National Cataract Surgery Registry
107
National Cataract Surgery Registry Ministry of Health Malaysia THE FIRST REPORT OF THE NATIONAL CATARACT SURGERY REGISTRY 2002 Edited by Goh Pik Pin Shamala Retnasabapathy Rajalakshmi Gopal Ronald Arun Das A publication of the National Cataract Surgery Registry And Clinical Research Centre, Ministry of Health
Transcript of National Cataract Surgery Registry

National Cataract Surgery Registry
Ministry of Health Malaysia
THE FIRST REPORT OF THE
NATIONAL CATARACT SURGERY REGISTRY 2002
Edited by
Goh Pik Pin
Shamala Retnasabapathy Rajalakshmi Gopal Ronald Arun Das
A publication of the National Cataract Surgery Registry
And Clinical Research Centre, Ministry of Health

Published by the National Cataract Surgery Registry (NCSR) C/O Disease and Treatment Registry Unit 2nd Floor, Wisma MEPRO 29 & 31 Jalan Ipoh 51200 Kuala Lumpur Malaysia Direct Line: 603-4045 5652 General Line: 603-4045 5408 Ext: 15/25 Fax: 603-4045 1252 Email [email protected] Website: http://www.crc.gov.my/ncsr Disclaimer The data reported here have been supplied by NCSR. The interpretation and reporting of these data are the responsibility of the Editor and in no way should be seen as an official policy or interpretation of the NCSR. Suggested citation The suggested citation for this report is as follows: Goh Pik Pin, Shamala Retnasabapathy, Rajalakshmi Gopal, Ronald Arun Das.(Eds) THE FIRST REPORT OF THE NATIONAL CATARACT SURGERY 2002 Kuala Lumpur, Malaysia 2003 Electronic version Electronic version of this report can be downloaded at http://www.crc.gov.my/ncsr

i
FOREWARD
Congratulations to all concerned on the successful completion of the first annual
report of the National Cataract Surgery Registry (NCSR).
Cataract surgery is the most common surgery performed in Ophthalmology
Departments in the Ministry of Health Hospitals. Outcome of cataract surgery
services therefore serves as an indicator of the quality of Ophthalmic surgical
services. It is in this light that the National Cataract Surgery Registry (NCSR) was
established and data collection started on the first of January 2002. A preliminary
report on twenty-two participating centres for the period January to March 2002 has
been published.
NCSR has since served as a tool to collect and analyze data for the evaluation of
cataract surgery services in MOH hospitals. Useful information had been gathered on
the pattern of cataract surgery, its surgical and service outcome over the past one year.
Data can be retrieved for surgical audit by individual centres.
This report also provides an insight into the training needs for cataract surgery. I am
positive that this information can be used to improve cataract surgery services at the
local and national level.
On behalf of the NCSR Advisory Committee, I would like to thank all source data
producers, individuals and institutions that have made it possible for the completion
of this annual report. Your continued participation and contribution is of utmost
importance in ensuring the sustainability of the registry.
Dr. Mariam Ismail
Chairman
NCSR Advisory Committee

ii
ACKNOWLEDGMENTS When we read a report, we often do not recognize the hard work and effort many people have put in to make the report a reality. The birth of the first National Cataract Surgery Registry (NCSR) annual report owed its success to many people. Without the perseverance of staff at the participating canters in data collection, particularly the doctors who filled in the clinical record forms and the paramedical staff who collected and sent the forms to cataract surgery registry unit (CSRU), we would not have the data.
Without the painstaking follow-up in case ascertainment and tedious checking of completeness of data by the staff at CSRU, particularly the Clinical Registry Manager Staff Nurse Lee Poe Poay and Disease & Treatment Registry Associate, Ms Sharmila Bt Saari, we will not have good quality data. Without the careful analysis of the data by Dr. LimTeck Onn and Ms Teh Poh Geok , we would not have the data made into meaningful tables and figures. Without the conversion from figures and tables into words by the editors consisting of Dr. Goh Pik Pin, Dr. Shamala Retnasabapathy, Dr. Rajalakshmi Gopal, and Dr. Ronald Arun Das, we will not have the report. Without the support of the Development Division of the Ministry of Health, Ophthalmology Service and Clinical Research Centre , NCSR would not be born. We are also very grateful to: The Ministry of Health, in particular, the Deputy Director General (Research and Technical Support) Dato` Dr. Mohd Ismail Merican, whose support was absolutely crucial to getting the NCSR started by providing the seed money in the form of a research grant (Grant number: MRG-2002-2). The Director, Kuala Lumpur Hospital, Dr. Haji Ramlee B Haji Rahmat for contributing in the resources required.
The financial sponsors: Alcon Laboratories (M) Sdn Bhd, Advanced Medical Optics and Pharmacia Ophthalmology Malaysia Sdn Bhd ( currently as Pfizer ( Malaysia) Sdn Bhd). The National Cataract Surgery Registry Advisory Committee would like to thank all the above. As the registry is an on going undertaking, your continuous supports are very much appreciated and hope for. Thank you very much.
National Cataract Surgery Registry Advisory Committee

iii
PARTICIPATING CENTRES
1. 94 Hospital Angkatan Tentera Kem Terendak Head, Ophthalmology Department: Lt Kol (Dr) Nor Aishah Bt Malik Site Coordinator: PW II Foziah Bt Yusof
2. Alor Setar Hospital Head, Ophthalmology Department: Dr. Ahmad Mat Saad Site Coordinator: Dr. Zaharidah Bt. Abd. Kadir T/AN Siti Aishah Salim
3. Batu Pahat Hospital Head, Ophthalmology Department: Dr. Chandra Mohan Site Coordinator: MA Hasim Buniran
4. Bukit Mertajam Hospital Head, Ophthalmology Department: Dr. Teoh Hian Jin Site Coordinator: S/N Masheran Bt. Musa
5. Duchess of Kent Sandakan Hospital
Head, Ophthalmology Department: Dr. Adarsh Bhardwaj Site Coordinator: MA Pius Kondu
6. Ipoh Hospital Head, Ophthalmology Department: Dato Dr. P. Balaravi Site Coordinator: Dr. Indarjit Singh MA Hj. Ismail
7. Kajang Hospital Head, Ophthalmology Department: Dr. Ong Poh Yan Site Coordinator: Puan Rini Roslina Amir
8. Kangar Hospital
Head, Ophthalmology Department: Dr. Mohd Nazri Sulaiman Site Coordinator: MA Abdul Rahman Daud
9. Kota Bharu Hospital Head, Ophthalmology Department: Dr. Zulkifli Abd. Ghani Site Coordinator: Dr. Sakinah Bt Zakariah
10. Kuala Lumpur Hospital Head, Ophthalmology Department: Dr. Joseph Alagaratnam Site Coordinator: Dr. Sharifah Intan S/N Hazizah Mohamed
11. Kuala Pilah Hospital Head, Ophthalmology Department: Dr. Khairul Husnaini Bt. Mohd. Khalid Site Coordinator: S/N Rohaizah Bt. Baharin

iv
12. Kuala Terengganu Hospital
Head, Ophthalmology Department: Dr. Zuraidah Mustari Site Coordinator: S/N Juriffah Mohd Amin
13. Umum Sarawak Kuching Hospital Head, Ophthalmology Department: Dr. Intan Gudom Site Coordinator: S/N Hjh Fatimah Hassan
14. Melaka Hospital Head, Ophthalmology Department: Dr. S. Anusiah Site Coordinator: Dr. Meena Kandiah S/N Soon Bee Wan
15. Miri Hospital Head, Ophthalmology Department: Dr. Daw Saw Thein Site Coordinator: MA Musa Zaini
16. Muar Hospital Head, Ophthalmology Department: Dr. Adnan Abas Site Coordinator: MA Nuruhadi
17. Mentakab Hospital Head, Ophthalmology Department: Dr. Azhar Zainuddin Site Coordinator: MA Hj. Abdul Akim B. Sabit Ali
18. Putrajaya Hospital Head, Ophthalmology Department: Dr. Salmah Othman Site Coordinator: S/N Sarniah Sidek
19. Pulau Pinang Hospital Head, Ophthalmology Department: Dr. Elizabeth John Site Coordinator: En. Azahari B. Ahmad MA Samsuddin Shahul Hamid
20. Queen Elizabeth Kota Kinabalu Hospital Head, Ophthalmology Department: Dr. Dayang Sayalam Ag Daud Site Coordinator: S/N Eugenie
21. Seremban Hospital Head, Ophthalmology Department: Dr. Bethel Livingstone Site Coordinator: MA Thivagaran
22. Sibu Hospital Head, Ophthalmology Department: Dr. Reddy Site Coordinator: MA Morni B. Morsen

v
23. Sultanah Aminah Johor Baharu Hospital Head, Ophthalmology Department: Dr. Loh Swee Seng Site Coordinator: Dr. Suresh S/N Hapsah Bt Ali
24. Sungei Petani Hospital Head, Ophthalmology Department: Dr. Foo Sui Wan Site Coordinator: S/N Zainab
25. Taiping Hospital Head, Ophthalmology Department: Dr. Wong Sook Mun Site Coordinator: S/N Norashah Bt Abd. Hamid
26. Tawau Hospital Head, Ophthalmology Department: Dr. Ajit Majumder Site Coordinator: MA Bacho Bin Nordin
27. Teluk Intan Hospital Head, Ophthalmology Department: Dr. Vivian Gong Hee Meng Site Coordinator: MA Halim
28. Tengku Ampuan Afzan Kuantan Hospital Head, Ophthalmology Department: Dr. Vasantha Kumar Site Coordinator: MA Nadarajah S/N Rosila
29. Tengku Ampuan Rahimah Klang Hospital Head, Ophthalmology Department: Dr. Yogan Kanagasabai Site Coordinator: Dr. Norlelawati S/N Wong Huey Fen
30. Universiti Sains Malaysia Hospital Head, Ophthalmology Department: Dr. Elias Hussein Site Coordinator: Dr. Asokumaran

vi
NATIONAL CATARACT SURGERY REGISTRY ADVISORY COMMITTEE Dr. Mariam Ismail Chairperson
Head, Ophthalmology Service, MOH and Head, Ophthalmology Department, Selayang Hospital
Dr. Goh Pik Pin Co-Chairperson
Ophthalmologist, Ophthalmology Department, Hospital Selayang
Datuk Dr. Abdul Gani B. Mohammed Din
Director, Medical Development Division Ministry of Health
Dr. Gomathy Arumugam President, Ophthalmology Society Malaysian Medical Association
Dato' Dr. P. Balaravi Head, Ophthalmology Department, Ipoh Hospital
Dr. Bethel Livingstone Head, Ophthalmology Department, Seremban Hospital
Dr. Joseph Alagaratnam Head, Ophthalmology Department, Kuala Lumpur Hospital
Dr. Zuraidah Bt. Mustari Head, Ophthalmology Department, Kuala Terengganu Hospital
Dr. Hamidah Bt. Budin Ophthalmologist, Ophthalmology Department, Hospital Kota Bharu
Associate Prof. Dr. Muhaya Bt. Mohamad
Head, Ophthalmology Department, Universiti Kebangsaan Malaysia
Dr. Elias Hussein Head, Ophthalmology Department, Universiti Sains Malaysia
Dr. Hoh Hong Beng Private, Pantai Medical Centre, Kuala Lumpur
Dato Dr. Y. C. Lee Private, Lee Eye Centre, Ipoh, Perak
Dr. Lim Teck Onn Head, Clinical Research Centre, Kuala Lumpur Hospital
Dr. Rugayah Bakri Head, Evidence Based Medicine Clinical Research Centre, Kuala Lumpur Hospital
S/N Lee Poe Poay Secretariat to NCSR Advisory Committee

vii
ABOUT NATIONAL CATARACT SURGERY REGISTRY INTRODUCTION The National Cataract Surgery Registry is a disease outcome registry. It is a prospective, ongoing systematic collection of data pertaining to patients who have had cataract surgery. Data collected include demography, operative events, post-operative visual outcomes and probable causes for poor outcome. These data are used to calculate cataract surgery rates and to evaluate surgical outcome. Such information is useful for performance audit in each participating ophthalmology department, leading to improvement in cataract surgery service, and to assist Ministry of Health, non-governmental organization, private eye care providers and industry in blindness prevention programme planning and evaluation in the country. Analyzed data is presented in report and is disseminated to contributors and other users of the registry at a timely and regular fashion. NCSR was established in January 2002. Till date, there are 30 source data producers/participating centres in the registry consisting of 28 ophthalmology departments from the Ministry of Health Hospitals, Hospital Angkatan Tentera Kem Terendak, and Universiti Sains Malaysia Hospital. OBJECTIVES The objectives of National Cataract Surgery Register are to: 1. Determine the frequency and distribution of cataract surgery in Malaysia. These
are useful measures of the health burden arising of cataract and its treatment provision in the country
2. Determine the outcomes, and factors influencing outcomes of cataract surgery. This serves the needs of outcome assessment.
3. Evaluate cataract surgery services. This serves the need of accountability. 4. Stimulate and facilitate research on cataract and its management. The objectives listed above, while typical of any cataract surgery registry, is clearly rather ambitious and certainly cannot be met right away. Thus the registry is implemented in phases. Phase 1 of the proposed cataract surgery register shall be limited to Public Hospitals only. Phase 2 of the proposed cataract surgery register shall expand the coverage of Phase 1 to include university, private hospitals and private ophthalmologists in the country. SPONSORS OF NCSR Ophthalmology Service, Ministry of Health Clinical Research Centre, Ministry of Health

viii
CLINICAL RESEARCH CENTRE The Clinical Research Centre is the designated collaborating unit to the NCSR. It provides the functional capacity to support the operations of the NCSR. The CRC is the clinical research arm of the Ministry of Health. Apart from the NCSR, CRC currently also supports the National Renal Registry, National Cancer Registry, National Neonatal Registry, National Mental Health Registry and National HIV/AIDS Treatment Registry. In recent years, CRC has emerged to become the preferred collaborating partner for medical professional groups to establish disease and treatment registries in the country. This is because CRC possesses sophisticated facility and equipment, state of the art technology, and most importantly the trained human resources such as registry managers, epidemiologists, statisticians, information technology professionals and other supporting staff skilled in registry operations. These resources are consolidated in the Disease and Treatment Registry Unit in the CRC. The unit specializes in assisting medical professionals to establish and operate their registries.
Staff of the Clinical Research Centre (CRC) and Cataract Surgery Registry Unit (CSRU) of Disease & Treatment Registry Unit (DTRU)
Director Dr. Zaki Morad B Mohamad Zaher Head Dr. Lim Teck Onn Head of DTRU Dr. Rugayah Bakri Cataract Surgery Registry Manager CSRU
SN Lee Poe Poay
Clinical Registry Associate CSRU Ms. Sharmila Bt Saari Clinical Registry Associate CSRU Mr. Mohamad Fauzan B Jamaluddin Information Security Officer Ms Celine Tsai Pao Chien Network Administrator Mr. Kevin Ng Hong Heng Assistant Network Administrator Mr. Adlan Ab. Rahman Database Administrator Ms. Lim Jie Ying Webmaster/Desktop publisher Mr. Patrick Lum See Kai Programmer Mr. Sebastian Thoo Statistician Ms. Teh Poh Geok

1
CONTENTS FOREWARD.................................................................................................................i ACKNOWLEDGMENTS ...........................................................................................ii PARTICIPATING CENTRES ..................................................................................iii NATIONAL CATARACT SURGERY REGISTRY ADVISORY COMMITTEE.......................................................................................................................................vi ABOUT NATIONAL CATARACT SURGERY REGISTRY...............................vii CLINICAL RESEARCH CENTRE........................................................................viii CONTENTS..................................................................................................................1 ABBREVIATIONS......................................................................................................5 GLOSSARY..................................................................................................................5 REGISTRY METHODS .............................................................................................6 1.ORGANISATION AND ADMINISTRATIVE STRUCTURE ............................6 2.DATA STANDARDS................................................................................................8 3.DATA FLOW PROCESS.........................................................................................8 OVERALL DATA MANAGEMENT FLOW.........................................................10 OVERALL DATA FLOW PROCESS.....................................................................11 4.LEGAL ASPECT AND CONFIDENTIALITY...................................................12 REPORT SUMMARY...............................................................................................13 1 PATIENTS’ CHARACTERISTICS ............................................................13 2 CATARACT SURGERY PRACTICE ........................................................14 3 CATARACT SURGERY OUTCOMES......................................................15 3.1 CATARACT SURGERY COMPLICATIONS INTRA-OPERATIVE....15 3.2 CATARACT SURGERY COMPLICATIONS POST-OPERATIVE ......16 3.3 ANALYSIS ON CATARACT SURGERY OUTCOMES..........................17 3.4 POST-OPERATIVE VISUAL ACUITY .....................................................17 3.5 POST-OPERATIVE REFRACTED VA IMPROVED BY ONE OR MORE LINE SNALLEN CHART...........................................................................20 3.6 FACTORS CONTRIBUTING TO POST-OPERATIVE VA WORSE....20 THAN 6/12..................................................................................................................20 APPENDIX I (CLINICAL RECORD FORMS).....................................................90

2
LIST OF TABLES Table 1.1 : Age distributions..................................................................................21 Table 1.2 : Gender distributions.............................................................................22 Table 1.3 : Number (%) of surgery done by month...............................................22 Table 1.4 : Number of surgery done by centre ......................................................23 Table 1.5 : Distribution of care setting by centre...................................................25 Table 1.6 : Number of patients with first eye and second eye surgery..................26 Table 1.7 : Number of patients with ocular co-morbidity .....................................27 Table 1.8 : Number of patients with systemic co-morbidity .................................28 Table 1.9 : Pre-operative visual acuity measurement ............................................29 Table 1.10 : Causes of cataract ................................................................................30 Table 2.1 : Distribution of types of cataract surgery by centre..............................31 Table 2.2 : Distribution of combined surgery by centre ........................................33 Table 2.3 : Proportion of nature of cataract surgery ..............................................34 Table 2.4 : Type of anaesthesia..............................................................................35 Table 2.5 : Type of local anaesthesia.....................................................................37 Table 2.6 : Distribution of single and multiple local anaesthesia ..........................39 Table 2.7 : Type of sedation given to patient who had local anaesthesia..............40 Table 2.8 : Distribution of IOL placement.............................................................41 Table 2.9 : Distribution of cataract surgery without IOL ......................................42 Table 2.10 : Distribution of IOL- materials and types.............................................43 Table 3.1.1 : Distribution of intra-operative complications by type of cataract surgery..................................................................................................44 Table 3.1.2 : Distribution of intra-operative complications by combined surgery...48 Table 3.1.3 : Distribution of intra-operative complications by nature of cataract
surgery..................................................................................................49 Table 3.1.4 : Distribution of intra-operative complications by type of anaesthesia .50 Table 3.1.5 : Distribution of intra-operative complications by type of local anaesthesia .....................................................................................51 Table 3.1.6 : Distribution of intra-operative complications by single or multiple local anaesthesia...................................................................................53 Table 3.1.7 : Distribution of intra-operative complications by type of sedation ......54 Table 3.1.8 : Distribution of intra-operative complications by sedation ..................56 Table 3.1.9 : Distribution of intra-operative complications by cataract surgery with IOL.......................................................................................................57 Table 3.1.10 : Distribution of intra-operative complications by cataract surgery without IOL..........................................................................................59 Table 3.2.1 : Distribution of post-operative complications ......................................61 Table 3.2.2 : Distribution of post-operative complications by IOL types ................62 Table 3.2.3 : Distribution of post-operative complication by material.....................63 Table 3.2.4 : Post-operative complication by centre.................................................64 Table 3.3.1 : Median follow-up period in weeks (Patients with only unaided vision, refraction was not performed)..............................................................68 Table 3.3.2 : Median follow-up period in weeks (Patients with refracted vision)....68 Table 3.4.1 : Distribution of post-operative VA.......................................................69 Table 3.4.2 : Distribution of post-operative refracted VA 6/12 or better at the last follow up, by surgery ...........................................................................71 Table 3.4.3 : Distribution of post-operative refracted VA 6/12 or better in relation to age and type of surgery ........................................................................72 Table 3.4.4 : Distribution of post-operative refracted VA 6/12 or better in relation to gender and type of surgery...................................................................73 Table 3.4.5 : Distribution of post-operative refracted VA 6/12 or better in relation to co-morbidity and type of surgery.........................................................74

3
Table 3.4.6 : Distribution of post-operative refracted VA 6/12 or better in relation to complication and type of surgery.........................................................75 Table 3.4.7 : Distribution of post-operative refracted VA 6/12 or better in relation to nature of surgery and type of surgery ..................................................76 Table 3.4.8 : Distribution of post-operative refracted VA 6/12 or better in relation to anaesthesia and type of surgery .......................................................77 Table 3.4.9 : Distribution of post-operative refracted VA 6/12 or better in relation to combined surgery and type of surgery.................................................78 Table 3.4.10 : Distribution of post-operative refracted VA 6/12 or better in relation to IOL and type of surgery.......................................................................79 Table 3.4.11 : Distribution of post-operative refracted VA 6/12 or better in relation to surgeon status and type of surgery without ocular co-morbidity.........80 Table 3.4.12 : Distribution of post-operative refracted VA 6/12 or better in relation to centre and type of surgery....................................................................81 Table 3.5.1 : Distribution of post-operative refracted VA improved by one or more line of Snellen chart, at the last follow up ...........................................83 Table 3.5.2 : Distribution of post- operative refracted VA improved by one or more line of Snellen chart, with and without ocular co-morbidity at the last follow up ..............................................................................................84 Table 3.5.3 : Distribution of post- operative refracted VA improved by one or more line of Snellen chart with intra-op complication and without intra-op complication, at the last follow up.......................................................85 Table 3.5.4 : Distribution of post -operative refracted VA improved by one or more line of Snellen chart with systemic co-morbidity and without systemic co-morbidity, at the last follow up.......................................................86 Table 3.5.5 : Distribution of post -operative refracted VA improved by one or more line of Snellen chart at the last follow up in relation to surgeon status and type of surgery without ocular comorbidity..................................87 Table 3.6.1 : Distribution of factors contributing to post- operative refracted VA of worse than 6/12 ....................................................................................89

4
LIST Of FIGURES Figure 1.1 : Age Distributions ...............................................................................21 Figure 1.3 : Number (%) of surgery.......................................................................22 Figure 1.4 : Number of surgery done by centre ....................................................24 Figure 1.5 : Distribution of day care and in patient by centre ...............................26 Figure 1.9 : Pre-operative visual acuity measurement...........................................29 Figure 2.1 : Distribution of types of cataract surgery by centre ............................32 Figure 2.4 : Type of anaesthesia ............................................................................36 Figure 3.1.1.1 : Distribution of intra-operative complication......................................45 Figure 3.1.1.2 : Distribution of intra-operative complication by posterior capsule rupture with vitreous loss and posterior capsule rupture without vitreous loss ........................................................................................46 Figure 3.1.1.3 : Distribution of intra-operative complication by zonular dialysis with vitreous loss and zonular dialysis without vitreous loss .....................47 Figure 3.1.3 : Distribution of intra-operative complications by nature of cataract surgery.................................................................................................49 Figure 3.1.4 : Distribution of intra-operative complications by type of anaesthesia 50 Figure 3.1.6 : Distribution of intra-operative complications by single or multiple local anaesthesia..................................................................................53 Figure 3.1.7 : Distribution of intra-operative complications by type of sedation.....55 Figure 3.1.8 : Distribution of intra-operative complications by sedation .................56 Figure 3.1.9 : Distribution of intra-operative complications by cataract surgery with IOL......................................................................................................58 Figure 3.1.10 : Distribution of intra-operative complications by cataract surgery without IOL.........................................................................................60 Figure 3.4.1.1 : Distribution of post-operative VA......................................................69 Figure 3.4.1.2 : Cumulative distribution of visual acuity by pre- and post-operative unaided VA .........................................................................................70 Figure 3.4.1.3 : Cumulative distribution of visual acuity by pre- and post-operative refracted VA........................................................................................70 Figure 3.4.2 : Percent of patients with refracted VA 6/12 or better at the last follow up, by surgery......................................................................................71

5
ABBREVIATIONS CF Counting finger CI Confidence interval CMO Cystoid macular oedema CSRU Cataract surgery registry unit ECCE Extraca psular cataract extraction HM Hand movement IOL Intraocular lens ICCE Intracapsular cataract extraction NPL No perception of light PCO Posterior capsule opacification PCR Posterior capsule rapture PE Phacoemulsification PL Perception of light SDP Source data producers VA Visual acuity ZD Zonular dialysis GLOSSARY Advisory Committee
A committee, board, council, panel or group thereof that is established by the sponsors of the registry to govern the registry. The Advisory Committee shall direct and control the activities of the designated collaborating unit, which manages the day-to-day operations of the registry.
Advisory Committee member
An individual appointed to serve on an advisory committee. Members may have relevant expertise and/or represent the interest of SDP, users or donor.
Chairperson An advisory committee member who is appointed to preside at committee meetings and ensure that all rules of order and conduct are maintained during each session.
Disease Register The ongoing systematic collection, analysis and interpretation of a specific disease data essential to the planning, implementation and evaluation of clinical and public health practice, closely integrated with dissemination of these data to those who need to know. The final link in the chain is the application of these data to the management, prevention and control of the disease. A registration system includes a functional capacity for data collection, analysis and dissemination linked to clinical and public health programs.
Secretary The individual responsible for an advisory committee’s overall administrative management. He/she is ordinarily a staff provided by the designated collaborating unit for the purpose.
Source data producer
The individuals or institutions that report the required data to the registry.
Sponsor The individuals or institutions that own the registry.

6
REGISTRY METHODS The following aspects of registry methods are described below. 1. Organization and Administrative structure 2. Data standards 3. Data flow process 4. Legal aspects and confidentiality 1.ORGANISATION AND ADMINISTRATIVE STRUCTURE In brief, the organizational structure of NCSR consists of sponsors, advisory committee, cataract surgery registry unit (CSRU), source data producers and target groups/users. The Ophthalmology Service and the Clinical Research Centre, both of the MOH, jointly sponsor the registry. The NCSR is governed by an advisory committee who oversees the operations of registry. The cataract surgery registry unit, which is based at the Clinical Research Centre, MOH, provides the functional capacity to support the operation of NCSR. The source data producers are Departments of Ophthalmology, both public and private, who provide data on patients who have had cataract surgeries. The users or target groups are individuals or institutions to which the regular registry reports are addressed. The description of the duties and functions of each entity depicted follows.
Sponsor The registry is jointly sponsored by the Ophthalmology Service and the Clinical Research Centre; both of the MOH. Sponsors shall ♦ Be responsible to Director General of Health, MOH for the effective, efficient and
responsive operations of the registry. ♦ Provide leadership and direction for the registry. ♦ Establish an Advisory Committee, jointly chair the committee and appoint
members to the Advisory committee. Membership should represent all interested parties. These must include source data producers, Target groups or users and representative from the Cataract Surgery Registry Unit.
♦ Provide the financial, human and information resources required, if necessary with financial contribution from industry or donor agencies.
Sponsor
Advisory Committee
Source Data Producers
Cataract Surgery Registry Unit
Target Group or Users

7
Advisory Committee An Advisory Committee for cataract surgery register shall be established by sponsors to oversee the operations of registry. Interested parties including source data producers and target groups or users are represented on this committee.
The Committee shall ♦ Provide leadership and direction for cataract surgery registry. ♦ Ensure the continuing relevance of registry. ♦ Determine policy and procedures for the operations of the registry. ♦ Designate a collaborating unit to be the Cataract Surgery Registry Unit. ♦ Oversee the progress of registry. ♦ Facilitate access to data sources. ♦ Galvanize commitment of all stakeholders.
Cataract Surgery Registry Unit (CSRU) The CSRU in the Clinical Research Centre (CRC) is established to provide functional capacity to support the operation of the NCSR. Here, the collection and analysis of data, and feedback of information collected are performed. CSRU is a sophisticated unit staffed by epidemiologist, statistician, information technology personnel and other supporting staff. To achieve the objectives of the NCSR, the function of CSRU is to ensure:
1. The complete enumeration of all cataract surgery done at the SDP centres 2. The validity of the data collected
Source Data Producers (SDP) These are individual Departments of Ophthalmology who collects the required data. It is the most costly and difficult element of the system. As the data collected has to be systematic and uniform, and producers of source data need to be trained and motivated to ensure high data quality. There are 29 Ophthalmology departments under Ministry of Health (MOH), one under Ministry of Defense and 3 in the local universities. Of these public operated ophthalmology departments, 30 registered as source data producers in the year 2002. This gives a coverage rate of 86% in the government hospitals. If only the MOH hospitals are taken into account, the coverage rate is 100%. Of the 30 SDPs, 22 participated for the full year. The registry aims to invite other university hospitals, private institutions and private ophthalmologists to participate in the registry in the coming year.
Users or Target groups
These are the individuals or institutions to which the regular registry reports are addressed. They include • Public health practitioner • Health provider • Industry • Decision maker

8
• Researcher • Press and public It is their needs for information to assist in planning and implementing disease management, control and prevention activity that justify the investment in registry. 2.DATA STANDARDS The data collected are patient demography, cause of cataract, first or second eye surgery, prior intra-ocular surgery, pre-existing ocular co-morbidity and systemic co-morbidity, pre-operative unaided and refracted vision, surgeon’s status, type of admission (day care or non day care surgery), urgency of surgery, type of anesthesia, types of sedation, types of IOL (placement of IOL, material, foldable or non-foldable), and intra-ocular complication, post-operative complications, post-operative best corrected visual acuity by 12 weeks, and possible factors contributing to post-operative refracted VA of worse than 6/12. 3.DATA FLOW PROCESS Inclusion criteria All patients, regardless of age, who have undergone cataract surgery, including those who have combined cataract surgery, are included in the registry. Patients who have their lens removal, decided by surgeons while performing the other surgeries, usually during vitreo-retinal surgery were excluded. Data Collection On Clinical Record Forms Three clinical record forms are used in NCSR. They are:
i. Pre-clerking record ii. Operative records
iii. Cataract surgery outcomes through 12 weeks post-op record These forms are used as medical records in the day-to-day patient care at the eye departments, with duplicate copies to be sent to CSRU. By doing so, there is no additional work in data collection. The pre-clerking records gather information on patient demography, cause of cataract, first or second eye surgery, prior intra-ocular surgery, pre-existing ocular co-morbidity and systemic co-morbidity, pre-operative unaided and refracted vision; the operative record forms capture data related to surgical procedure, surgeon’s status, type of admission (day care or non day care surgery), urgency of surgery, type of anesthesia, both local and systemic sedation, types of IOL (placement of IOL, material, foldable or non-foldable), and intra-ocular complication, and the cataract outcome records collect data on post-operative complications and post-operative best corrected visual acuity by 12 weeks, as well as the possible factors contributing to post-operative refracted VA of worse than 6/12. Refer appendix 1 for the clinical record forms. The data transferred to CSRU are kept strictly confidential with access only to authorized individual working in the CSRU.
9
Data flow Doctors complete the pre-clerking forms while doing pre-clerking of patients. Upon completion of surgery, the operative records are entered. Post-operative findings and visual outcome findings are filled in the post-operative records by 12 ± 2 weeks post-op. Site coordinators ensure completeness of case ascertainment and completeness of data collection. She/he will send the completed forms, together with the operating list to CSRU in a monthly basis. Data submission by SDP is tracked by CSRU computer system, which flags any late submission and automatically sends a reminder. An instruction manual is used as reference and is available at http://www.crc.gov.my/ncsr website . It is also used as a training manual to new doctors and other new staff who join the eye department.
Data Management At CSRU Visual review, data entry,data update and edit checks Data received by the CSRU were logged- in and manually reviewed to check for completeness and error. Data without apparent problems were entered into the registry database. Edit checks were performed periodically to identify potential data errors, such as missing data, non-allowed values, out of range numeric values, inconsistent data and error with deduplication. Data queries that are resolved are then updated to the database. To ensure complete enumeration and validity of data, a series of tasks as shown in the figure below have to be in place.
SDP-: eye departments Data collection by doctors, optometrists & paramedics. Site coordinators monitor and collect completed forms and send to CSRU.
CSRU: CRC Data analysis & interpretation. Report writing
Users : e.g. SDP, researchers, MOH etc

10
OVERALL DATA MANAGEMENT FLOW
Data Source
Data Receipt
Data Clarification
Queries
Pre Entry Manual Review
Data Verification Resolution
(Audited) Data Logging (Audited) Data Entry
Edit Checks Run (Data Query)
(Audited)
Data Editing
Final CRF Received
Repeat Flow
Final Data Validation Checks
Run No Final Data Editing Yes
End of Period?
Archive
Deduplication End
Database required for interim
report – database freezing
Statistical Analysis & Reporting

11
OVERALL DATA FLOW PROCESS Functions
Yes
Yes
CRF 1 & 2
No
SDP
Receive data from SDP
CRF 1 only /obvious
error/missing data?
End
End
Yes
Received CRF 3 data?
Manual review
Notes: CRF1 = Pre Clerking record CRF2 = Operative record CRF3 = Cataract Surgery Outcomes 12 weeks post-op
*Log receipt of CRF 1 and 2 in batch
How many CRFs?
*Enter CRF 1 and 2 data
*Log receipt of CRF 3
*Enter CRF 3 data
CRF 1,2 & 3
>120 days from Date of Cataract
Operation in CRF2?
*Generate query list to site
End
*Log receipt of CRF 3 in batch
*Enter CRF 1, 2 & 3 data
No

12
Statistical Analysis Descriptive analysis was employed in this report. All data were described in terms of percentages except continuous data, like follow-up period and age, where summary statistics like mean, median, 25th percentile and 75th percentile were calculated. We ignored the missing data and confined the analysis to available data. Therefore, no imputation was done. 4.LEGAL ASPECT AND CONFIDENTIALITY Data transfer from source data producers is entirely voluntary. There is no legal provision to compel any individual or institution to report or transfer its data to the CSRU. The data transferred to CSRU is of course highly sensitive and has to be kept strictly confidential with access only to authorized individual working in the CSRU. Strict data protection procedure will need to be put in place, following standard disease registration practice, and in compliance with applicable regulatory guidelines.

13
REPORT SUMMARY
This annual report contains data from 12,798 patients who had cataract surgery performed in January to December 2002 from 25 SDPs and whose complete set of clinical record forms were received by Cataract Surgery Registry Unit by 31st July, 2003. Data from the other 5 SDP were not included due to small number of patients (less than 100) or incomplete clinical record forms received. As not all the patients who had cataract surgery done had all 3 completed CRF, the number of surgeries did refract the true burden of cataract surgery performed in each centre.
1 PATIENTS’ CHARACTERISTICS 1.1 The mean age of the patients was 64 years (youngest was 1 year, eldest was 97
years). More than half of the patients (56%) were 65 years and older. 1.2 Gender distribution was almost equal among the male and female patients. 1.3 The month of October had the highest number of cataract surgeries performed
(11%) while December had the least number of cases (5%). 1.4 Centre E, J, H, and N performed more than 1000 cataract surgeries in the year. 1.5 One third (38%) of the operations were done as day care surgery and two third
(62%) were done as in-patient. Centre W had most of the operations done as day care (98%). Seven centres (E, F, G, H, J, R,W ) had more than 50% of their cataract surgeries performed as day care surgery. Five centres (A, C, M, Q, Y ) did not have any day care services.
1.6 Two third of the patients (70%) had first eye operation while one third of the
patients (30%) had second eye operation (i.e. fellow eye has had cataract surgery before).
1.7 Ocular co-morbidity was noted in 29% of the patients. The common ocular co-
morbidity was diabetic retinopathy (9%) and glaucoma (6%). Seven percent of the patients had poor view of the posterior segment and thus presence of pre-existing ocular co-morbidity could not be determined.
1.8 Systemic co-morbidity was noted in 57% of the patients. Hypertension was the
most common systemic co-morbidity (35%) followed by diabetes mellitus (29%), ischaemic heart disease (9%) and asthma/ COAD (5%).
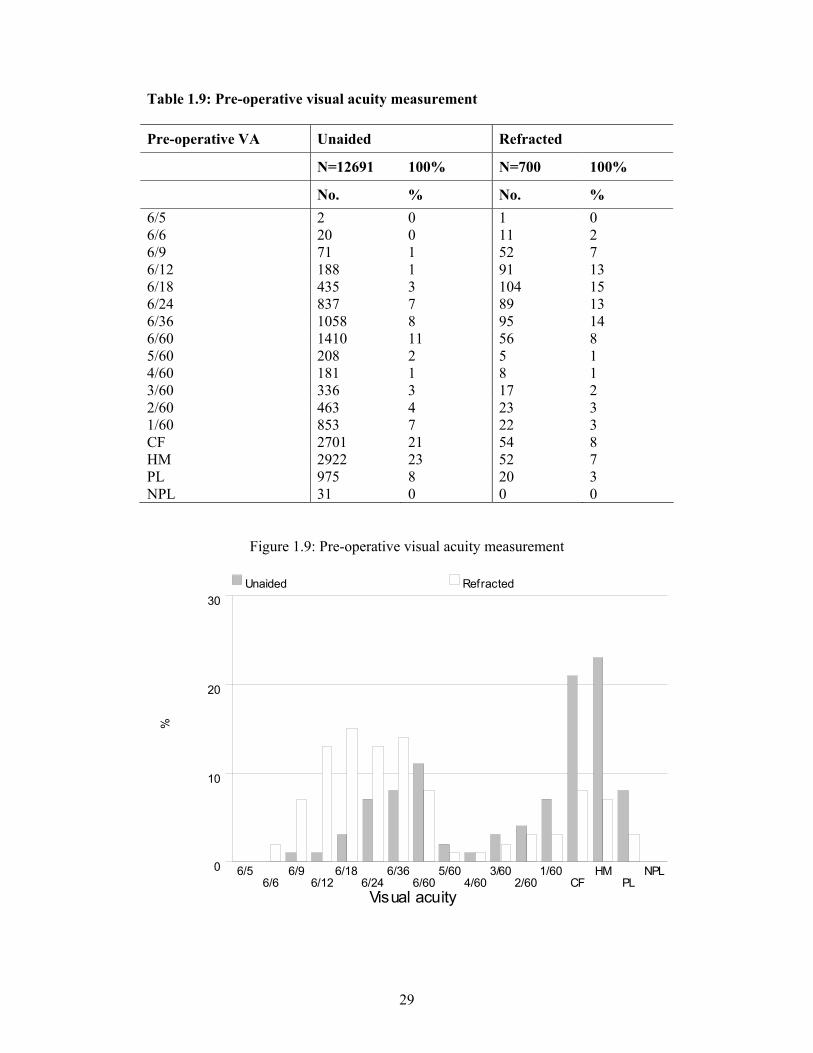
1.9 Using unaided vision as measurement, there was a bimodal trend of visual status
at pre-clerking, i.e. vision between 6/24 to 6/60 (26%), and vision at worse than counting fingers (CF) (52%). While using refracted vision as measurement, most patients had vision between 6/12 to 6/60 (63%). Sixty six percent of the patients presented with blindness in the eyes to be operated (blindness is defined as presenting vision of 3/60 or worse) but when refracted vision was recorded, only 26% of the eyes were in the blindness category.

14
1.10 Senile/age related cataract accounted for 93% and traumatic cataract accounted for 3% of the causes of cataract.
2 CATARACT SURGERY PRACTICE 2.1 Extracapsular cataract extraction (ECCE) was the most common type of
cataract surgery performed. Fifty four percent of cataract surgeries were ECCE, 40% were phacoemulsification (PE), 2% PE convert to ECCE, and 3% lens aspiration. All other centres performed ECCE more frequently than other type of surgeries except for centres G, H, I, K, N, R and S where phacoemulsification was performed more frequently. Centres E, G, H, J, K, N, R, S, Y and I performed 40% or more PE. Two centres, i.e. C and M did not performed phacoemulsification surgery.
2.2 Only 3% (n=375) of the cataract surgeries had some form of combined surgery. Combined cataract and filtering surgery (n=148) was the commonest form of combined surgery (39%). Centres F and Q performed the highest number of combined surgery at 7% each. Centre W was the only centre that did not perform any combined surgery.
2.3 Almost all cataract surgeries were performed for elective reasons with only
1% of the cases requiring emergency cataract surgery. Seventeen centres performed emergency cataract surgeries and the percentage at these centres ranged between 1 to 3%.
2.4 Ninety four percent of cataract surgeries were performed under local
anaesthesia (LA). The frequency of LA utilized ranged between 86-100% at the various centres. Six percent of cataract surgeries were performed under general anaesthesia (GA). At centres C, F, J, N, S, T, and U, GA was utilized for more than 6% of cases and this ranged between 7-14%.
2.5 For cataract surgeries performed under LA, the type of LA most commonly
performed was subtenon anaesthesia (47%). This was followed by retrobulbar anaesthesia (26%), peribulbar anaesthesia (22%) and topical anaesthesia (12%).
Generally more than one type of LA was utilised at each centre. Though there
was usually a preference towards one type of LA at each centre. Centre X performed purely one type of anaesthesia i.e. subtenon anaesthesia.
Facial block is given to prevent over action of the orbicularis oculi muscle and is not for pain relieve during surgery. This was performed at only 10 of the 25 centres. Centre C performed facial block on all cases of cataract surgery.
2.6 Cataract surgery in some cases may require more than one type of LA to
provide adequate anaesthesia. Of the 94% of cataract surgeries requiring LA, 83% was given only one type of LA with the remaining 17% was given more than one type of LA. Eight centres (A, D, F, H, I, T, W and X) utilised only single LA. This was in contrast to centres B, C, G, K, Q, where more than 50% of the patients were given more than one type of LA.

15
2.7 Sixty three percent of cataract surgeries undergoing LA did not have any form
of sedation. Four centres (H, P, R and Y) did not use any form of sedation.
Among the 37% of patients who were given sedation, oral sedation was the commonest sedation used (33%). Intravenous, intravenous plus oral and intramuscular were infrequently used (ranged between 1 to 4%) with the exception of centre C where 47% received intravenous sedation and centres C, D, and U where 60%, 90% and 30% of the cases received intramuscular sedation respectively.
2.8 Posterior chamber (PC) intraocular lens (IOL) is the normal placement of an
IOL in uncomplicated surgery. PC IOLs were placed in 97% of the cataract surgeries. Two centres (C and X) achieved 100% PC IOL placement.
Anterior chamber (AC) IOLs were placed in 3% of cases and this ranged between 0 to 7% at the various centres. Some cases with AC IOL may not be a result of complication but planned based on preoperative assessment.
2.9 Three hundred and twenty seven patients (2.7%) had cataract surgery without
IOL implantation. Of these, IOL had been planned for but lens implantation was not possible at the time of surgery in 72% of the cases. While 28% of the cases, no IOL was planned for implantation. Lens implantation may not have been planned for various reason based on preoperative assessment.
2.10 IOLs made of PMMA were the most frequently used IOL (73%). IOLs made
of silicone and acrylic had an equal frequency of utilization at 13% each.
PMMA IOLs are non-foldable IOLs while silicone and acrylic IOL are foldable IOLs. Seventy three percent of the eyes were reported to have non-foldable IOLs and 27% had foldable IOLs.
3 CATARACT SURGERY OUTCOMES 3.1 CATARACT SURGERY COMPLICATIONS INTRA-OPERATIVE 3.1.1 Overall, 10% of the cataract surgeries performed had intra-operative
complications. Posterior capsule rupture with vitreous loss was the commonest, contributing to 5% of total number of cataract surgery performed. Posterior capsule rupture without vitreous loss (1%) and zonular dialysis with vitreous loss (1%) and zonular dialysis without vitreous loss (1%) were the other types of intra-operative complications.
As for surgical techniques, PE converted to ECCE cases had the highest complication rate (41%), followed by ICCE (33%). The rates of complication in ECCE and PE were almost similar, being 10% and 9% respectively.
3.1.2 In cases of combined surgeries, 17% had intra-operative complication.
Complication was seen in 14% in cataract surgeries combined with filtering surgery and 35% in those combined with vitreo-retinal surgery. Of all the combined surgeries, posterior capsule rupture with vitreous loss was the commonest intra-operative complication (9%).

16
3.1.3 Eighteen percent of emergency cases had intra-operative complications compared to 10% of elective cases. Posterior capsule rupture with vitreous loss was the most frequent complication in these patients (7%).
3.1.4 Eighty-eight patients (11%) who had general anaesthesia and 1240 (10%) who
had local anaesthesia had intra-operative complications. Posterior capsule rupture with vitreous loss was the most frequent complication in these patients (5%).
3.1.5 The rate for any intra-operative complication according to type of local
anaesthesia was 13%, 10%, 7% and 7% for subtenon, peribulbar, retrobulbar and topical anaesthesia respectively.
3.1.6 The occurrence of intra-operative complications was almost similar whether
single (11%) or multiple (9%) administrations of local anaesthesia were given to patients.
3.1.7 Intravenous (12%), and intravenous plus oral (13%) had higher percentages of
intra-operative complications compared to those given oral sedation alone (10%), or when no sedation was given (10%).
3.1.8 Patients who were not given any sedation have similar rate of intra-operative
complication (10%) compared to those who were given single sedation (10%) or those who had multiple sedation (9%).
3.1.9 Patients who had AC IOL implanted had the highest rate of intra-operative
complications (75%) as compared to those who had PCIOL (8%). There was a 27% complication rate for those who had scleral fixated IOLs. Among patients who had ACIOL, 47% of them had posterior capsule rupture with vitreous loss.
3.1.10 For those without IOL implantation, patients who were planned to have IOL
implanted had higher percent of intra-operative complications at 70% compared to those who were not planned to have IOL implantation (27%). Understandably, the earlier group was those who had intra-operative complication rendering IOL implantation impossible. Posterior capsule rupture with vitreous loss was the commonest complication among patients who did not have IOL implanted (17%).
3.2 CATARACT SURGERY COMPLICATIONS POST-OPERATIVE 3.2.1 Overall, 12% of patients had postoperative complication. Central corneal
edema within 4 mm of visual axis (3 %) and astigmatism of more than 3 diopters (4 %) were the most common complications seen.
3.2.2 The rate of complication when foldable IOLs were implanted was 8% as
compared to 13% when non-foldable IOLs were implanted. Patients with non-

17
foldable IOLs had higher percentages of cystoid macular oedema (1%) and astigmatism of more than 3 diopters (5%) compared to those with foldable IOLs (0.4% and 1% respectively).
3.2.3 Without taking surgeon status and type of surgery into consideration, the rate
of complications was highest when PMMA IOLs were used (13%). This is followed by acrylic IOLs (9%) and silicone IOLs (7%). The rates of severe iritis with fibrin and posterior capsular opacification (PCO) were higher in patients who had PMMA followed by acrylic IOLs and silicone IOLs (severe iritis: PMMA 0.5%, silicone 0.2%, acrylic 0.2%; PCO: PMMA 1%, silicone 0.5%, acrylic 0.5%). The rate of endophthalmitis was highest for patients who had silicone IOLs (0.41%), compared with the rates for PMMA and acrylic IOLs (0.14% and 0.12% respectively).
3.2.4 Six centres (A, B, F, L, Q, R, T) had post-operative complication rates worse
than the average 12%, which ranged from 16% to 36%. Centre O has the lowest post-operative complication rate at 2%.
3.3 ANALYSIS ON CATARACT SURGERY OUTCOMES 3.3.1 Of the 12,798 patients who had cataract surgery, 2184 (17%) patients did not
have refraction during the first 3 months following surgery. Their median post-operative follow-up period was at 7.9 weeks. Two third of them (75 percentile) had follow up period of 11.9 weeks.
3.3.2 Of the 12,798 patients who had cataract surgery, 10385 (81%) patients had post-operative refraction. Their median post-operative follow-up period was 11.1 week. Two third of them (75 percentile) had follow up period of 13.9 weeks. Patient who had PE had the shorter follow-up period compared to patients who had other types of surgeries.
3.4 POST-OPERATIVE VISUAL ACUITY 3.4. 1 Of the 12,798 patients operated, 12512 (99%) had data on unaided post-
operative visual acuity. Of these, 39% obtained post-operative unaided VA of 6/12 or better.
Of the 12,798 patients operated 10385 (81%) had data on post-operative refracted visual acuity. Of these, 81% obtained post-operative refracted VA of 6/12 or better. Four percent of the operated eyes had post-operative refracted VA (7% with unaided VA) at the blindness range (VA 63/60 and worse). Thus, 4% of the operated eyes who were blind, measured with unaided vision, improved to better than 3/60 when refraction was performed. Figure 3.4.1.2 and 3.4.1.3 showed the visual improvement before and after cataract surgery. In general, post-op VA was better than pre-op VA and the

18
difference was more apparent when unaided VA was taken as the measurement.
3.4.2 When comparing post-op VA in relation to types of surgery, patients who had
PE have higher percentage of good visual outcome (50% based on unaided VA, 87% using refracted VA), followed by ECCE (32% based on unaided VA, 77% using refracted VA)
3.4.3 When comparing age and visual outcome for all cataract surgeries, patients who were younger than 35 years and older than 75 years had lower percentage of good VA outcome of 6/12 or better. While those between 35 to 75 years had percentage of refracted VA 6/12 or better ranged from 82 to 84%.
3.4.4 In general, post-op visual outcome was similar among male (81%) and female
patients (80%). 3.4.5 As a whole, patients without ocular co-morbidity (86%) had higher percentage
of better visual outcome as compared to those with ocular co-morbidity(67% ). Among patients who did not have ocular co-morbidity, PE (91%), followed by ECCE (83%), had good visual outcome.
In general, presence or absent of systemic co-morbidity did not affect the post-op visual outcome (81% vs. 80%).
3.4.6 In general patients who had intra-operative or post-operative complications have poorer visual outcome than patients who did not have complications.
Sixty eight percent of patients with intra-operative complications had post-operative VA 6/12 or better compared to 83% for those without intra-op complications.
For those with post-operative complications, 66% of them had refracted VA 6/12 or better compared to 83% for those without post-operative complications. In the absent of intra-operative or post-operative complication, PE had better outcome (both at 88%) compared to the other type of cataract surgeries.
3.4.7 In general, patients who had elective surgery have better visual outcome
(81%) compared to emergency cataract surgery (69%). However, patients who had ICCE had better outcome when it was performed under emergency surgery compared to elective surgery (67% vs. 49%). This might imply that when indicated, especially among patients with lens related complications such as phacomorphic, phacolytic and lens subluxation, it may be better to perform ICCE as emergency operation.
3.4.8 Patients who had local anaesthesia had better visual outcome compared to
those who had general anesthesia (82% and 62% respectively). This may be because majority of patients who required general anaesthesia had pre-existing co-morbidity or they were of paediatric age group.

19
Patients who had topical anaesthesia had the highest percentage with good outcome (85%). This may be due to the fact that most of them had PE performed.
Percentage of good outcome was similar among those who had peribulbar (82%), retrobulbar (81%), subtenon (81%). Those who had subconjunctival anaesthesia had the lowest percent of good outcome (73%). There is no difference in visual outcome among patients who were given and those who were not given systemic sedation.
3.4.9 In general, patients who did not have combined surgeries had better outcome
(81%) compared to those who had combined surgery (64%). 3.4.10 Understandably, patients who had IOL implanted had better refracted visual
outcome (82%) compared to those who did not had IOL (23%).
Eighty-eight percents of patients with foldable IOL had postoperative visual acuity of 6/12 or better, compared to 79% of those with non-foldable IOL. Among those who had PE, percent of good visual outcome was similar with foldable or non-foldable IOL (89% vs. 84%).
When comparing IOL material, 79% of patients who had PMMA IOL, 89% who had silicone IOL, and 87% who had acrylic IOL had refracted visual outcome of 6/12 or better.
Among patients who had ECCE, there is no difference in visual outcome whether PMMA (79%), acrylic (78%) or silicone IOL (76%) was implanted. However, among patients who had PE, patients who had PMMA had lower percent of good outcome (84%) while there was no difference in visual outcome between patient who had silicone or acrylic IOL implantation (89% and 90% respectively).
3.4.11 When comparing visual outcome among patients who were without ocular co-
morbidity (n=6425) in relation to surgeons status, percent of patient with good visual outcomes was similar whether the cataract surgery was performed by specialists, gazetting specialists or medical officers. This applies to all surgeries, ECCE and PE. The number of cataract patients performed by other types of cataract surgeries was too small for meaningful comparison.
3.4.12 When comparing among SDPs, percent of post-operative visual outcome of
6/12 or better in the 25 SDPs ranged from 69% to 88%, with the average of 81%. Ten out of 25 centres (40%) performed below average.
Among ECCE cataract surgeries, percent of good outcome ranged from 57% to 87% in all SDPs, with the average of 77%. Eleven out of 25 centres (45.6%) performed below average. Among PE cataract surgeries, percent of good outcome ranged from 80% to 100% in all SDPs, average of 87%. Eight out of 23 centres (34.8%) performed below average.

20
3.5 POST-OPERATIVE REFRACTED VA IMPROVED BY ONE OR MORE
LINE SNELLEN CHART 3.5.1 Of the 12,798 patients operated, only 628 patients had refracted vision for both
pre-op and post op assessment. Among these 628 patients, 89% of them had one or more line of visual improvement postoperatively, while 7% experienced no change in visual acuity and 4% had reduced vision. Among those with one line visual improvement, the highest percentage was ICCE (100%, but small sample, n=2), lens aspiration (93%), followed by ECCE (92%), PE (88%), and PE converted to ECCE (79%). PE converted to ECCE had the highest percent of post-op worsening of vision of one line or more (13 %).
3.5.2 In the absent of ocular co-morbidity, 90% of patients had visual improvement
of one line or more. Percentage was high in ECCE (95%), lens aspiration (92%) and PE (88%) patients compared to PE converted to ECCE patients (74%).
3.5.3 In the absent of intra-op complications, 90% of patients had visual
improvement of one line or more. Percentage was higher in ECCE (92%) as compared to PE (88%).
3.5.4 In the absent of systemic co-morbidity, 92% of patients had visual
improvement of one line or more. Percentage was higher in ECCE (94%) and PE (92%).
3.5.5 When comparing visual outcome in patients who had pre-operative and post-
operative refracted vision, and who were without ocular co-morbidity (n=479), in relation to surgeons status, percent of patient with one or more line of visual improvement was similar whether the cataract surgery was performed by specialists, gazetting specialists or medical officers. This applies to all surgeries, ECCE and PE. The number of cataract patients performed by other types of cataract surgeries was too small for meaningful comparison.
3.6 FACTORS CONTRIBUTING TO POST-OPERATIVE VA WORSE THAN 6/12 3.6.1 Of the 2009 patients who had postoperative refracted visual acuity of worse
than 6/12, only 1776 ( 88%) had factors identified for poor outcome.
Preexisting ocular co-morbidity (41%) was the main cause for poor outcome followed by high astigmatism (24%). Ten percent had posterior capsular opacification, 5% had clinical cystoid macular oedema, 2% had corneal decompensation, 1%, had endophthalmitis, and 1% had retinal detachment. Among the 25 patients who were noted to have post-operative endophthalmitis, 16 (64%) had post –operative best corrected visual acuity of worse than 6/12. The prevalence of post-op endophthalmitis was 0.20 (25 cases in 12,798 cataract surgeries performed).

PATIENTS’ CHARACTERISTICS
Age Distribution
Gender Distribution
Number of Surgeries by Month
Number of Surgeries by Centre
Distribution of Care Setting by Centre
Number of Patients with First Eye and Second Eye Surgery
Number of Patients with Ocular Co-Morbidity
Number of Patients with Systemic Co-Morbidity
Pre-Operative Visual Acuity Measurement
Causes of Cataract

21
1. PATIENTS’ CHARACTERISTICS
Table 1.1: Age distributions Age, years N=12798 Mean 64 Median 66 Minimum .1 Maximum 97
% Distributions
Age group <1 year .2 1-14 years 1 15-24 years 1 25-34 years 1 35-44 years 3 45-54 years 12 55-64 years 27 65-74 years 38 75-84 years 16 >=85 years 2
Figure 1.1: Age Distributions
%
Age group, years
0
10
20
30
40 percent
<11-14
15-2425-34
35-4445-54
55-6465-74
75-84>=85

22
Table 1.2: Gender distributions Gender N=12798 % Male 49 Female 51 Table 1.3: Number (%) of surgery done by month Month No. % N 12798 100 January 1064 8 February 838 7 March 1166 9 April 986 8 May 1018 8 June 1127 9 July 1207 9 August 1210 9 September 1184 9 October 1346 11 November 1003 8 December 649 5
Figure 1.3: Number (%) of surgery
No.
of s
urge
ries
Month
0
500
1000
1500 number
JanuaryFebruary
MarchApril
MayJune
JulyAugust
SeptemberOctober
NovemberDecember

23
Table 1.4: Number of surgery done by centre Centre No. % All sites 12798 100 A 154 1 B 956 7 C 129 1 D 294 2 E 1079 8 F 422 3 G 737 6 H 1017 8 I 519 4 J 1141 9 K 480 4 L 830 6 M 260 2 N 1009 8 O 414 3 P 429 3 Q 188 1 R 392 3 S 421 3 T 801 6 U 268 2 V 285 2 W 213 2 X 127 1 Y 233 2

24
Figure 1.4: Number of surgery done by centre
No.
of s
urge
ries
Centre
0
500
1000
1500 number
AB
CD
EF
GH
IJ
KL
MN
OP
QR
ST
UV
WX
Y

25
Table 1.5: Distribution of care setting by centre Centre Care setting
N % Day care % In-patient All sites 12798 38 62 A 154 0 100 B 956 24 76 C 129 0 100 D 294 3 97 E 1079 89 11 F 422 53 47 G 737 81 19 H 1017 88 12 I 519 2 98 J 1141 67 33 K 480 11 89 L 830 42 58 M 260 0 100 N 1009 10 90 O 414 12 88 P 429 8 92 Q 188 0 100 R 392 53 47 S 421 42 58 T 801 3 97 U 268 1 99 V 285 5 95 W 213 98 2 X 127 16 84 Y 233 0 100

26
Figure 1.5: Distribution of day care and in patient by centre
Average day care (all patients)=38%
%
Centre
0
38
50
100 Day care In-patient
CY
MA
QU
ID
TV
PN
K0
XB
SL
FR
JG
HE
W
Table 1.6: Number of patients with first eye and second eye surgery Type of surgery No. % N 12798 100 First eye 8958 70 Second eye 3840 30

27
Table 1.7: Number of patients with ocular co-morbidity Patients with ocular co-morbidity No. % N 12798 100 Patients with any ocular co-morbidity 3691 29 Patients with specific ocular co-morbidity Anterior segment 1.Pterygium involving the cornea 342 3 2.Corneal opacity 184 1 3.Glaucoma 795 6 4.Chronic uveitis 54 0 5.Pseudoexfoliation 184 1 Len related complication 1.Phacomorphic 106 1 2.Phacolytic 61 0 3.Subluxated/Disclosed 87 1 Posterior segment 1.Diabetic Retinopathy: Non Proliferative 642 5 2.Diabetic Retinopathy: Proliferative 218 2 3.Diabetic Retinopathy: CSME 96 1 4.Diabetic Retinopathy: Vitreous haemorrhage 66 1 5.ARMD 145 1 6.Other macular disease (includes hole or scar) 77 1 7.Optic nerve disease, any type 43 0 8.Retinal detachment 70 1 9.Cannot be assessed 884 7 Miscellaneous 1.Amblyopia 64 1 2.Significant previous eye trauma 52 0 3.Pre-existing non glaucoma field defect 2 0 Other 380 3

28
Table 1.8: Number of patients with systemic co-morbidity Patients with systemic co-morbidity No. % N 12798 100 Patients with any systemic co-morbidity 7264 57 Patients with specific systemic co-morbidity 1.Hypertension 4529 35 2.Diabetes Mellitus 3694 29 3.Ischaemic Heart Disease 1148 9 4.Renal Failure 211 2 5.Cerebrovascular accident 106 1 6.COAD/Asthma 669 5 7.Hansen's Disease 11 0 8.Allergies 55 0 Other 869 7
29
Table 1.9: Pre-operative visual acuity measurement Pre-operative VA Unaided Refracted
N=12691 100% N=700 100%
No. % No. % 6/5 2 0 1 0 6/6 20 0 11 2 6/9 71 1 52 7 6/12 188 1 91 13 6/18 435 3 104 15 6/24 837 7 89 13 6/36 1058 8 95 14 6/60 1410 11 56 8 5/60 208 2 5 1 4/60 181 1 8 1 3/60 336 3 17 2 2/60 463 4 23 3 1/60 853 7 22 3 CF 2701 21 54 8 HM 2922 23 52 7 PL 975 8 20 3 NPL 31 0 0 0
Figure 1.9: Pre-operative visual acuity measurement
%
Visual acuity
0
10
20
30 Unaided Refracted
6/56/6
6/96/12
6/186/24
6/366/60
5/604/60
3/602/60
1/60CF
HMPL
NPL

30
Table 1.10: Causes of cataract Causes of Cataract No. % N 12793 100 Primary cataract Senile/age related 11960 93 Congenital 130 1 Development 155 1 Other 49 0
Secondary cataract Trauma 325 3 Drug induced 53 0 Surgery induced 23 0 Other 98 1

CATARACT SURGERY PRACTICE
Distribution of Types of Cataract Surgery by Centre
Distribution of Combined Surgery by Centre
Proportion of Nature of Cataract Surgery
Types of Anaesthesia
Types of Local Anaesthesia
Distribution of Single and Multiple Local Anaesthesia
Types of Sedation given to Patients Having Local Anaesthesia
Distribution of IOL Placement
Distribution of Cataract Surgery Without IOL
Distribution of IOL – Materials and Types

31
2. CATARACT SURGICAL PRACTICES Table 2.1: Distribution of types of cataract surgery by centre Centre Types of cataract surgery
All surgeries
Lens aspiration
ECCE PE PE converted to ECCE
ICCE Secondary IOL Implant
No. % No. % No. % No. % No. % No. % No. % All Centres
12798 100 372 3 6914 54 5085 40 311 2 81 1 35 0
A 154 100 5 3 84 55 60 39 4 3 0 0 1 1 B 956 100 16 2 649 68 263 28 15 2 7 1 6 1 C 129 100 6 5 123 95 0 0 0 0 0 0 0 0 D 294 100 8 3 261 89 22 7 3 1 0 0 0 0 E 1079 100 29 3 513 48 496 46 31 3 6 1 4 0 F 422 100 29 7 223 53 157 37 8 2 4 1 1 0 G 737 100 28 4 208 28 488 66 5 1 5 1 3 0 H 1017 100 28 3 356 35 593 58 33 3 7 1 0 0 I 519 100 11 2 234 45 255 49 18 3 0 0 1 0 J 1141 100 30 3 557 49 509 45 34 3 10 1 1 0 K 480 100 25 5 161 34 273 57 14 3 2 0 5 1 L 830 100 20 2 606 73 169 20 21 3 13 2 1 0 M 260 100 4 2 256 98 0 0 0 0 0 0 0 0 N 1009 100 24 2 449 44 519 51 9 1 6 1 2 0 O 414 100 21 5 244 59 133 32 13 3 2 0 1 0 P 429 100 10 2 232 54 153 36 34 8 0 0 0 0 Q 188 100 2 1 184 98 1 1 1 1 0 0 0 0 R 392 100 5 1 176 45 205 52 0 0 6 2 0 0 S 421 100 9 2 183 43 206 49 18 4 2 0 3 1 T 801 100 27 3 431 54 315 39 21 3 4 0 3 0 U 268 100 19 7 219 82 19 7 9 3 1 0 1 0 V 285 100 8 3 181 64 84 29 9 3 3 1 0 0 W 213 100 1 0 162 76 43 20 5 2 2 1 0 0 X 127 100 0 0 99 78 26 20 2 2 0 0 0 0 Y 233 100 7 3 123 53 96 41 4 2 1 0 2 1

32
Figure 2.1: Distribution of types of cataract surgery by centre
%
Centre
0
50
100
ECCE Lens aspirations PE PE to ECCE ICCE Secondary IOL Implant
GK
HS
NR
IE
JF
YT
PA
0V
BL
WX
UD
CM
Q

33
Table 2.2: Distribution of combined surgery by centre Centre Combined surgery
All surgeries
Any Combined surgery
Pterygium surgery
Filtering surgery
Vitreo-retinal surgery
Penetrating Keratoplasty
Other
No. No. % No. % No. % No. % No. % No. %All Centres
12798 375 3 86 1 148 1 26 0 1 0 124 1
A 154 10 6 7 5 3 2 0 0 0 0 1 1 B 956 51 5 12 1 11 1 1 0 0 0 31 3 C 129 6 5 3 2 0 0 0 0 0 0 4 3 D 294 12 4 2 1 9 3 0 0 0 0 1 0 E 1079 36 3 1 0 23 2 4 0 0 0 9 1 F 422 28 7 8 2 14 3 2 0 1 0 5 1 G 737 31 4 13 2 3 0 0 0 0 0 15 2 H 1017 34 3 5 0 16 2 5 0 0 0 8 1 I 519 7 1 5 1 1 0 0 0 0 0 1 0 J 1141 21 2 5 0 13 1 2 0 0 0 1 0 K 480 10 2 2 0 0 0 4 1 0 0 5 1 L 830 28 3 0 0 16 2 2 0 0 0 10 1 M 260 7 3 0 0 4 2 0 0 0 0 3 1 N 1009 10 1 0 0 6 1 0 0 0 0 4 0 O 414 5 1 0 0 2 0 0 0 0 0 3 1 P 429 12 3 1 0 5 1 0 0 0 0 6 1 Q 188 14 7 10 5 3 2 1 1 0 0 0 0 R 392 6 2 0 0 3 1 0 0 0 0 3 1 S 421 9 2 4 1 2 0 1 0 0 0 2 0 T 801 16 2 1 0 6 1 3 0 0 0 6 1 U 268 8 3 3 1 2 1 0 0 0 0 3 1 V 285 8 3 3 1 2 1 1 0 0 0 2 1 W 213 1 0 0 0 1 0 0 0 0 0 0 0 X 127 1 1 0 0 1 1 0 0 0 0 0 0 Y 233 4 2 1 0 2 1 0 0 0 0 1 0

34
Table 2.3: Proportion of nature of cataract surgery Centre Nature of cataract surgery
Emergency Elective
N No. % No. % All Centres 12798 141 1 12657 99 A 154 1 1 153 99 B 956 15 2 941 98 C 129 4 3 125 97 D 294 6 2 288 98 E 1079 12 1 1067 99 F 422 5 1 417 99 G 737 2 0 735 100 H 1017 5 0 1012 100 I 519 1 0 518 100 J 1141 21 2 1120 98 K 480 9 2 471 98 L 830 7 1 823 99 M 260 5 2 255 98 N 1009 7 1 1002 99 O 414 4 1 410 99 P 429 1 0 428 100 Q 188 0 0 188 100 R 392 0 0 392 100 S 421 8 2 413 98 T 801 17 2 784 98 U 268 5 2 263 98 V 285 2 1 283 99 W 213 1 0 212 100 X 127 0 0 127 100 Y 233 3 1 230 99

35
Table 2.4: Type of anaesthesia Centre Types of anaesthesia
General Local
N No. % No. % All Centres 12798 818 6 11980 94 A 154 8 5 146 95 B 956 48 5 908 95 C 129 12 9 117 91 D 294 7 2 287 98 E 1079 70 6 1009 94 F 422 58 14 364 86 G 737 28 4 709 96 H 1017 53 5 964 95 I 519 9 2 510 98 J 1141 79 7 1062 93 K 480 31 6 449 94 L 830 45 5 785 95 M 260 25 10 235 90 N 1009 68 7 941 93 O 414 26 6 388 94 P 429 24 6 405 94 Q 188 9 5 179 95 R 392 24 6 368 94 S 421 35 8 386 92 T 801 98 12 703 88 U 268 38 14 230 86 V 285 8 3 277 97 W 213 0 0 213 100 X 127 3 2 124 98 Y 233 12 5 221 95

36
Figure 2.4: Type of anaesthesia
Average of local anesthesia =94%
%
Centre
0
94
50
100 Local General
FU
TM
CS
NJ
PE
RK
0Q
YA
BL
HG
VX
DI
W

37
Table 2.5: Type of local anaesthesia Centre Local anaesthesia
Retrobulbar Peribulbar Subtenon Subconjunctival Facial block Topical Other
N No. % No. % No. % No. % No. % No. % No. % All Centres
11980 3100 26 2601 22 5647 47 28 0 1348 11 1406 12 1 0
A 146 0 0 0 0 145 99 1 1 0 0 0 0 0 0 B 908 829 91 11 1 86 9 0 0 509 56 7 1 0 0 C 117 116 99 0 0 0 0 0 0 117 100 0 0 0 0 D 287 4 1 1 0 283 99 0 0 0 0 0 0 0 0 E 1009 27 3 392 39 604 60 4 0 10 1 33 3 0 0 F 364 0 0 0 0 201 55 3 1 0 0 160 44 0 0 G 709 37 5 611 86 98 14 1 0 124 17 380 54 0 0 H 964 0 0 3 0 510 53 0 0 0 0 453 47 0 0 I 510 3 1 0 0 507 99 0 0 0 0 0 0 0 0 J 1062 45 4 7 1 1004 95 0 0 2 0 10 1 1 0 K 449 315 70 144 32 2 0 2 0 333 74 92 20 0 0 L 785 72 9 710 90 83 11 3 0 3 0 0 0 0 0 M 235 233 99 0 0 0 0 0 0 65 28 1 0 0 0 N 941 721 77 94 10 76 8 5 1 0 0 54 6 0 0 O 388 67 17 320 82 3 1 0 0 0 0 0 0 0 0 P 405 3 1 0 0 344 85 3 1 0 0 62 15 0 0 Q 179 0 0 179 100 0 0 0 0 177 99 1 1 0 0 R 368 25 7 0 0 200 54 0 0 0 0 148 40 0 0 S 386 316 82 60 16 47 12 1 0 0 0 4 1 0 0 T 703 67 10 2 0 633 90 1 0 0 0 1 0 0 0 U 230 17 7 4 2 207 90 4 2 0 0 0 0 0 0

38
Centre Local anaesthesia
Retrobulbar Peribulbar Subtenon Subconjunctival Facial block Topical Other
N No. % No. % No. % No. % No. % No. % No. % V 277 2 1 1 0 276 100 0 0 0 0 0 0 0 0 W 213 0 0 1 0 212 100 0 0 0 0 0 0 0 0 X 124 0 0 0 0 124 100 0 0 0 0 0 0 0 0 Y 221 201 91 61 28 2 1 0 0 8 4 0 0 0 0
* % May add to more than 100 % as one patient might have more than one type of local anaesthesia.

39
Table 2.6: Distribution of single and multiple local anaesthesia
Centre Local anaesthesia
Single Multiple
N No. % No. % All Centres 11980 9997 83 1983 17 A 146 146 100 0 0 B 908 388 43 520 57 C 117 1 1 116 99 D 287 286 100 1 0 E 1009 954 95 55 5 F 364 364 100 0 0 G 709 207 29 502 71 H 964 962 100 2 0 I 510 510 100 0 0 J 1062 1055 99 7 1 K 449 113 25 336 75 L 785 700 89 85 11 M 235 171 73 64 27 N 941 932 99 9 1 O 388 386 99 2 1 P 405 398 98 7 2 Q 179 2 1 177 99 R 368 363 99 5 1 S 386 346 90 40 10 T 703 702 100 1 0 U 230 228 99 2 1 V 277 275 99 2 1 W 213 213 100 0 0 X 124 124 100 0 0 Y 221 171 77 50 23

40
Table 2.7: Type of sedation given to patient who had local anaesthesia Centre Types of sedation
No sedation
Oral alone
Intravenous alone
Intravenous plus oral
Intra-muscular
N No. % No. % No. % No. % No. % All Centres
11980 7507 63 3995 33 108 1 83 1 426 4
A 146 139 95 5 3 0 0 1 1 1 1 B 908 423 47 450 50 21 2 18 2 0 0 C 117 4 3 0 0 55 47 0 0 70 60 D 287 7 2 119 41 0 0 2 1 258 90 E 1009 778 77 194 19 12 1 24 2 1 0 F 364 358 98 4 1 1 0 1 0 0 0 G 709 705 99 2 0 2 0 0 0 0 0 H 964 962 100 1 0 1 0 0 0 0 0 I 510 507 99 3 1 0 0 0 0 0 0 J 1062 406 38 653 61 3 0 1 0 0 0 K 449 445 99 4 1 0 0 0 0 0 0 L 785 133 17 620 79 4 1 21 3 27 3 M 235 24 10 211 90 0 0 0 0 0 0 N 941 45 5 894 95 2 0 0 0 0 0 O 388 26 7 362 93 0 0 0 0 0 0 P 405 405 100 0 0 0 0 0 0 0 0 Q 179 6 3 173 97 0 0 0 0 0 0 R 368 367 100 0 0 1 0 0 0 0 0 S 386 376 97 7 2 1 0 2 1 0 0 T 703 505 72 193 27 1 0 4 1 0 0 U 230 60 26 92 40 3 1 9 4 69 30 V 277 272 98 5 2 0 0 0 0 0 0 W 213 211 99 2 1 0 0 0 0 0 0 X 124 123 99 1 1 0 0 0 0 0 0 Y 221 220 100 0 0 1 0 0 0 0 0
* % may add to more than 100 % as one patient might have more than one type of sedation.

41
Table 2.8: Distribution of IOL placement Centre Cataract surgery with IOL
Posterior chamber IOL
Anterior chamber IOL
Scleral fixated IOL
N No. % No. % No. % All Centres 12471 12074 97 386 3 11 0 A 152 142 93 10 7 0 0 B 935 907 97 28 3 0 0 C 115 115 100 0 0 0 0 D 291 286 98 5 2 0 0 E 1053 999 95 54 5 0 0 F 407 389 96 16 4 2 0 G 707 682 96 25 4 0 0 H 969 948 98 20 2 1 0 I 510 498 98 12 2 0 0 J 1099 1041 95 57 5 1 0 K 469 450 96 19 4 0 0 L 809 793 98 14 2 2 0 M 260 250 96 10 4 0 0 N 983 970 99 13 1 0 0 O 406 396 98 10 2 0 0 P 423 417 99 6 1 0 0 Q 180 177 98 3 2 0 0 R 383 366 96 17 4 0 0 S 419 409 98 7 2 3 1 T 785 745 95 38 5 2 0 U 261 254 97 7 3 0 0 V 285 282 99 3 1 0 0 W 212 203 96 9 4 0 0 X 127 127 100 0 0 0 0 Y 231 228 99 3 1 0 0

42
Table 2.9: Distribution of cataract surgery without IOL
Centre Cataract surgery without IOL
IOL planned but not implanted
No IOL was planned
N No. % No. % All Centres 327 93 28 234 72 A 2 0 0 2 100 B 21 6 29 15 71 C 14 4 29 10 71 D 3 1 33 2 67 E 26 12 46 14 54 F 15 1 7 14 93 G 30 6 20 24 80 H 48 13 27 35 73 I 9 3 33 6 67 J 42 10 24 32 76 K 11 0 0 11 100 L 21 9 43 12 57 M 0 0 0 0 0 N 26 7 27 19 73 O 8 1 13 7 88 P 6 3 50 3 50 Q 8 2 25 6 75 R 9 7 78 2 22 S 2 1 50 1 50 T 16 3 19 13 81 U 7 4 57 3 43 V 0 0 0 0 0 W 1 0 0 1 100 X 0 0 0 0 0 Y 2 0 0 2 100

43
Table 2.10: Distribution of IOL- materials and types
IOL No. % N 12472 100 Materials PMMA 9161 73 Silicone 1670 13 Acrylic 1641 13 Other 0 0
Types Foldable 3311 27 Non-foldable 9161 73

CATARACT SURGERY OUTCOMES
Cataract Surgery Complications – Intra-Operative
Cataract Surgery Complications – Post-Operative
Analysis On Cataract Surgery Visual Outcome
Post-Operative Visual Acuity
Post-Operative Refracted VA Improved by One or More Line of Snellen Chart
Factors Contributing to Post-Operative Visual Acuity Worse than 6/12

44
3. CATARACT SURGERY OUTCOMES 3.1 Cataract Surgery Complications - Intra-Operative Table 3.1.1: Distribution of intra-operative complications by type of cataract surgery
Type of intra-operative complications
Types of cataract surgery
All surgeries Lens Aspiration
ECCE PE PE to ECCE ICCE Secondary IOL Implant
No. % No. % No. % No. % No. % No. % No. % N 12798 100 372 100 6914 100 5085 100 311 100 81 100 35 100 Any intra-op complication 1328 10 51 14 684 10 438 9 128 41 27 33 0 0 1.Posterior capsule rupture with vitreous loss
584 5 22 6 291 4 202 4 66 21 3 4 0 0
2.Posterior capsule rupture without vitreous loss
189 1 10 3 65 1 107 2 7 2 0 0 0 0
3.Zonular dialysis with vitreous loss
150 1 3 1 82 1 30 1 20 6 15 19 0 0
4.Zonular dialysis without vitreous loss
96 1 8 2 50 1 32 1 5 2 1 1 0 0
5.Loss of nucleus material into vitreous
13 0 0 0 3 0 7 0 3 1 0 0 0 0
6.Choroidal/suprachoroidal haemorrhage
5 0 0 0 4 0 1 0 0 0 0 0 0 0
7.Significant trauma to cornea or iris
56 0 2 1 36 1 14 0 3 1 1 1 0 0
8.Other 274 2 8 2 167 2 62 1 29 9 8 10 0 0 * Number in each column might add up to be more than that recorded at row with ‘ Any intra-op complication’ as one patient might have more than one type of intra-operative complications.

45
Figure 3.1.1.1: Distribution of intra-operative complication
%
Intra-operative complication
0
5
10 All surgeries
Any1
23
45
67
8
Intra-operative complication: Index refers to table 3.1.1

46
Figure 3.1.1.2: Distribution of intra-operative complication by posterior capsule rupture with vitreous loss and posterior capsule rupture without
vitreous loss
%
Type of cataract surgery0
5
10
15
20
PCR w ith vitreous loss PCR w ithout vitreous loss
LA ECCE PE PE to ECC ICCE 2 IOL Imp
• LA=Lens aspiration • 2 IOL Imp=Secondary IOL Implant

47
Figure 3.1.1.3: Distribution of intra-operative complication by zonular dialysis with vitreous loss and zonular dialysis without vitreous loss
%
Type of cataract surgery0
5
10
15
20 ZD w ith vitreous loss ZD w ithout vitreous loss
LA ECCE PE PE to ECC ICCE 2 IOL Imp
• LA=Lens aspiration • 2 IOL Imp=Secondary IOL Implant

48
Table 3.1.2: Distribution of intra-operative complications by combined surgery
Type of intra-operative complications
Combined surgery
All surgeries Any Combined surgery
Pterygium surgery
Filtering surgery
Vitreo-retinal surgery
Penetrating Keratoplasty
Other
No. % No. % No. % No. % No. % No. % No. % N 12798 100 375 100 86 100 148 100 26 100 1 100 124 100 Any intra-op complication 1328 10 64 17 7 8 20 14 9 35 1 100 31 25 1.Posterior capsule rupture with vitreous loss
584 5 33 9 2 2 9 6 5 19 1 100 17 14
2.Posterior capsule rupture without vitreous loss
189 1 2 1 1 1 2 1 0 0 0 0 0 0
3.Zonular dialysis with vitreous loss
150 1 13 3 2 2 2 1 0 0 0 0 10 8
4.Zonular dialysis without vitreous loss
96 1 5 1 0 0 3 2 1 4 0 0 1 1
5.Loss of nucleus material into vitreous
13 0 3 1 1 1 0 0 1 4 0 0 1 1
6.Choroidal/suprachoroidal haemorrhage
5 0 0 0 0 0 0 0 0 0 0 0 0 0
7.Significant trauma to cornea or iris
56 0 1 0 1 1 0 0 0 0 0 0 0 0
8.Other 274 2 12 3 2 2 5 3 3 12 0 0 3 2 Number in each column might add up to be more than that recorded at row with ‘ Any intra-operative complication’ as one patient might have more than one type of intra-operative complications

49
Table 3.1.3: Distribution of intra-operative complications by nature of cataract surgery Type of intra-operative complications Nature of cataract surgery
All patients Emergency Elective
No. % No. % No. % N 12798 100 141 100 12657 100 Any intra-op complication 1328 10 25 18 1303 10 1.Posterior capsule rupture with vitreous loss
584 5 10 7 574 5
2.Posterior capsule rupture without vitreous loss
189 1 4 3 185 1
3.Zonular dialysis with vitreous loss 150 1 1 1 149 1 4.Zonular dialysis without vitreous loss 96 1 2 1 94 1 5.Loss of nucleus material into vitreous 13 0 0 0 13 0 6.Choroidal/suprachoroidal haemorrhage 5 0 0 0 5 0 7.Significant trauma to cornea or iris 56 0 1 1 55 0 8.Other 274 2 8 6 266 2
Figure 3.1.3: Distribution of intra-operative complications by nature of cataract surgery
%
Intra-operative complication
0
5
10
15
20 Emergency Elective
Any1
23
45
67
8
Intra-op complication: Index refers to table 3.1.03

50
Table 3.1.4: Distribution of intra-operative complications by type of anaesthesia Type of intra-operative complications Types of anaesthesia
All patients General Local
No. % No. % No. % N 12798 100 818 100 11980 100 Any intra-op complication 1328 10 88 11 1240 10 1.Posterior capsule rupture with vitreous loss
584 5 38 5 546 5
2.Posterior capsule rupture without vitreous loss
189 1 15 2 174 1
3.Zonular dialysis with vitreous loss 150 1 6 1 144 1 4.Zonular dialysis without vitreous loss 96 1 14 2 82 1 5.Loss of nucleus material into vitreous 13 0 0 0 13 0 6.Choroidal/suprachoroidal haemorrhage 5 0 0 0 5 0 7.Significant trauma to cornea or iris 56 0 1 0 55 0 8.Other 274 2 18 2 256 2
Figure 3.1.4: Distribution of intra-operative complications by type of anaesthesia
%
Intra-operative complication
0
5
10
General Local
Any1
23
45
67
8
Intra-op complication: Index refers to table 3.1.4

51
Table 3.1.5: Distribution of intra-operative complications by type of local anaesthesia
Type of intra-op complications
Types of local anaesthesia
Local anaesthesia
Retrobulbar Peribulbar Subtenon Sub-
conjunctival
Facial block Topical Other
No. % No. % No. % No. % No. % No. % No. % No. % N 11980 100 3100 100 2601 100 5647 100 28 100 1348 100 1406 100 1 100 Any intra-op complication
1240 10 226 7 262 10 730 13 0 0 103 8 104 7 0 0
1.Posterior capsule rupture with vitreous loss
546 5 110 4 106 4 309 5 0 0 61 5 61 4 0 0
2.Posterior capsule rupture without vitreous loss
174 1 30 1 32 1 108 2 0 0 14 1 18 1 0 0
3.Zonular dialysis with vitreous loss
144 1 24 1 30 1 87 2 0 0 12 1 8 1 0 0
4.Zonular dialysis without vitreous loss
82 1 22 1 18 1 43 1 0 0 3 0 5 0 0 0
5.Loss of nucleus material into vitreous
13 0 1 0 0 0 8 0 0 0 1 0 4 0 0 0
6.Choroidal/suprachoroidal haemorrhage
5 0 0 0 2 0 3 0 0 0 0 0 0 0 0 0
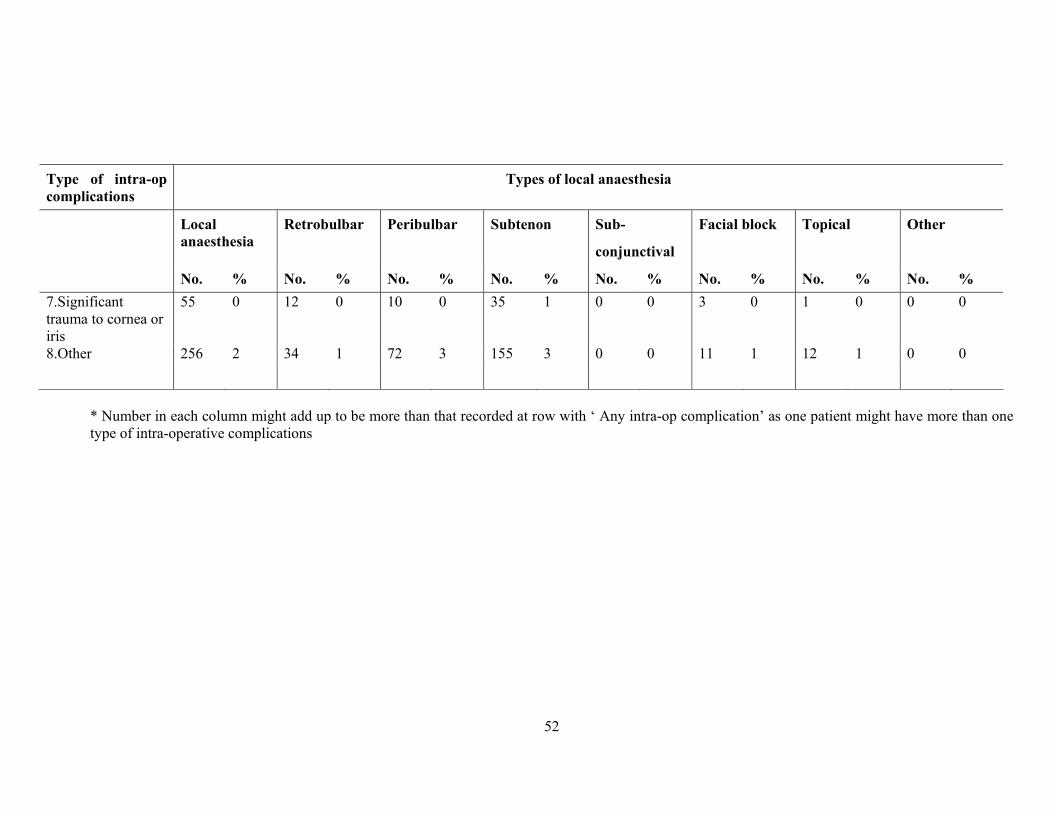
52
Type of intra-op complications
Types of local anaesthesia
Local anaesthesia
Retrobulbar Peribulbar Subtenon Sub-
conjunctival
Facial block Topical Other
No. % No. % No. % No. % No. % No. % No. % No. % 7.Significant trauma to cornea or iris
55 0 12 0 10 0 35 1 0 0 3 0 1 0 0 0
8.Other 256 2 34 1 72 3 155 3 0 0 11 1 12 1 0 0
* Number in each column might add up to be more than that recorded at row with ‘ Any intra-op complication’ as one patient might have more than one type of intra-operative complications

53
Table 3.1.6: Distribution of intra-operative complications by single or multiple local anaesthesia Type of intra-operative complications Local anaesthesia
Single Multiple
No. % No. % N 9997 100 1983 100 Any intra-op complication 1067 11 173 9 1.Posterior capsule rupture with vitreous loss
452 5 94 5
2.Posterior capsule rupture without vitreous loss
150 2 24 1
3.Zonular dialysis with vitreous loss 127 1 17 1 4.Zonular dialysis without vitreous loss 73 1 9 0 5.Loss of nucleus material into vitreous 12 0 1 0 6.Choroidal/suprachoroidal haemorrhage 5 0 0 0 7.Significant trauma to cornea or iris 50 1 5 0 8.Other 228 2 28 1
Figure 3.1.6: Distribution of intra-operative complications by single or multiple local anaesthesia
%
Intra-operative complication
0
5
10
Single anaesthesia Multiple anaesthesia
Any1
23
45
67
8
Intra-op complication: Index refers to table 3.1.06

54
Table 3.1.7: Distribution of intra-operative complications by type of sedation Type of intra-operative complications Types of sedation
No sedation Oral alone Intravenous alone
Intravenous plus oral
Intramuscular
No. % No. % No. % No. % No. % N 7507 100 3995 100 108 100 83 100 426 100 Any intra-op complication 780 10 406 10 13 12 11 13 42 10 1.Posterior capsule rupture with vitreous loss
351 5 169 4 3 3 7 8 22 5
2.Posterior capsule rupture without vitreous loss
116 2 52 1 1 1 1 1 4 1
3.Zonular dialysis with vitreous loss 87 1 53 1 0 0 0 0 5 1 4.Zonular dialysis without vitreous loss 50 1 28 1 2 2 1 1 1 0 5.Loss of nucleus material into vitreous 12 0 1 0 0 0 0 0 0 0 6.Choroidal/suprachoroidal haemorrhage 3 0 2 0 0 0 0 0 0 0 7.Significant trauma to cornea or iris 35 0 20 1 1 1 0 0 1 0 8.Other 149 2 91 2 6 6 2 2 11 3
* Number in each column might add up to be more than that recorded at row with ‘ Any intra-op complication’ as one patient might have more than one type of intra-operative complications
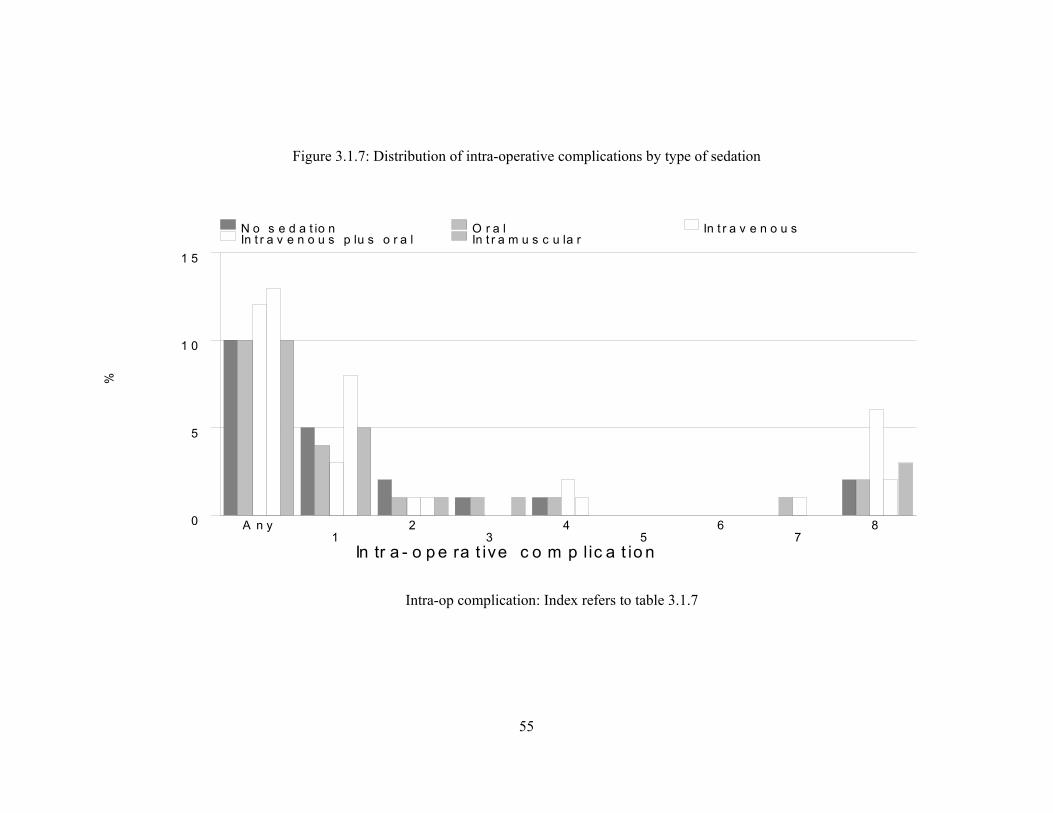
55
Figure 3.1.7: Distribution of intra-operative complications by type of sedation
%
In tr a - o p e ra t ive c o m p lic a t io n
0
5
1 0
1 5
N o s e d a t io n O r a l In t r a v e n o u s In t r a v e n o u s p lu s o r a l In t r a m u s c u la r
A n y1
23
45
67
8
Intra-op complication: Index refers to table 3.1.7

56
Table 3.1.8: Distribution of intra-operative complications by sedation Type of intra-operative complications
Sedation
No sedation Single Multiple
No. % No. % No. % N 7507 100 4334 100 139 100 Any intra-op complication 780 10 448 10 12 9 1.Posterior capsule rupture with vitreous loss
351 5 189 4 6 4
2.Posterior capsule rupture without vitreous loss
116 2 58 1 0 0
3.Zonular dialysis with vitreous loss 87 1 56 1 1 1 4.Zonular dialysis without vitreous loss 50 1 32 1 0 0 5.Loss of nucleus material into vitreous 12 0 1 0 0 0 6.Choroidal/suprachoroidal haemorrhage
3 0 2 0 0 0
7.Significant trauma to cornea or iris 35 0 18 0 2 1 8.Other 149 2 104 2 3 2
Figure 3.1.8: Distribution of intra-operative complications by sedation
%
Intra-operative complication
0
5
10
No Sedation Single Sedation Multiple Sedation
Any1
23
45
67
8
Intra-op complication: Index refers to table 3.1.8
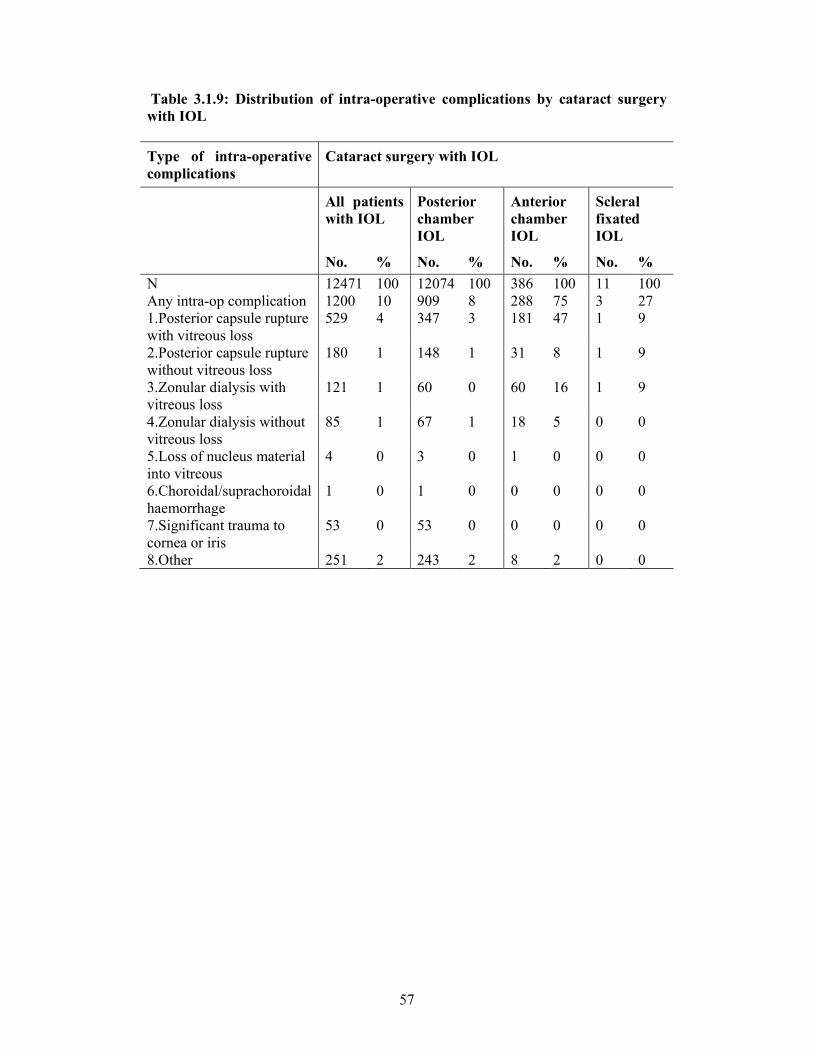
57
Table 3.1.9: Distribution of intra-operative complications by cataract surgery with IOL Type of intra-operative complications
Cataract surgery with IOL
All patients with IOL
Posterior chamber IOL
Anterior chamber IOL
Scleral fixated IOL
No. % No. % No. % No. % N 12471 100 12074 100 386 100 11 100 Any intra-op complication 1200 10 909 8 288 75 3 27 1.Posterior capsule rupture with vitreous loss
529 4 347 3 181 47 1 9
2.Posterior capsule rupture without vitreous loss
180 1 148 1 31 8 1 9
3.Zonular dialysis with vitreous loss
121 1 60 0 60 16 1 9
4.Zonular dialysis without vitreous loss
85 1 67 1 18 5 0 0
5.Loss of nucleus material into vitreous
4 0 3 0 1 0 0 0
6.Choroidal/suprachoroidal haemorrhage
1 0 1 0 0 0 0 0
7.Significant trauma to cornea or iris
53 0 53 0 0 0 0 0
8.Other 251 2 243 2 8 2 0 0

58
Figure 3.1.9: Distribution of intra-operative complications by cataract surgery with IOL
%
Intra-operative complication
0
20
40
60
80
Posterior Anterior Scleral
Any1
23
45
67
8
Intra-op complication: Index refers to table 3.1.09

59
Table 3.1.10: Distribution of intra-operative complications by cataract surgery without IOL Type of intra-operative complications
Cataract surgery without IOL
All patients without IOL
IOL planned, but not implanted
No IOL was planned
No. % No. % No. % N 327 100 93 100 234 100 Any intra-op complication 128 39 65 70 63 27 1.Posterior capsule rupture with vitreous loss
55 17 25 27 30 13
2.Posterior capsule rupture without vitreous loss
9 3 6 6 3 1
3.Zonular dialysis with vitreous loss
29 9 15 16 14 6
4.Zonular dialysis without vitreous loss
11 3 8 9 3 1
5.Loss of nucleus material into vitreous
9 3 9 10 0 0
6.Choroidal/suprachoroidal haemorrhage
4 1 1 1 3 1
7.Significant trauma to cornea or iris
3 1 1 1 2 1
8.Other 23 7 12 13 11 5

60
Figure 3.1.10: Distribution of intra-operative complications by cataract surgery
without IOL
%
Intra-operative complication
0
20
40
60
80 IOL Planned No IOL w as planned
Any1
23
45
67
8
Intra-op complication: Index refers to table 3.1.10

61
3.2 Cataract Surgery Complications - Post-Operative Table 3.2.1: Distribution of post-operative complications Post-operative complications No. % N 12798 100 Patients with any post-op complication 1529 12 Patients with specific post-op complication 1.Central edema within 4mm of visual axis 445 3 2.Raised IOP of more than 30mmHg 153 1 3.Suture abscess 59 0 4.Severe iritis with fibrin 52 0 5.Iris prolapse/wound dehiscence 32 0 6.Vitreous incarceration into wad 16 0 7.Vitreous in AC touching cornea 17 0 8.IOL decentration/dislocation 27 0 9.Cystoid macular edema 60 0 10.Endophathalmitis 25 0 11.New retinal break 0 0 12.Retinal detachment 21 0 13.Astigmation of > 3 diopters 481 4 14.Posterior capsule opacification 110 1 15.Other 213 2

62
Table 3.2.2: Distribution of post-operative complications by IOL types
Type of IOL
Foldable Non-Foldable
Post-operative complications N No. % No. % N 12798 3311 100 9161 100 Patients with any post-op complication
1529 277 8 1180 13
Patients with specific post-op complication
1.Central edema within 4mm of visual axis
445 144 4 282 3
2.Raised IOP of more than 30mmHg 153 37 1 111 1 3.Suture abscess 59 11 .3 45 .5 4.Severe iritis with fibrin 52 8 .2 42 .5 5.Iris prolapse/wound dehiscence 32 0 0 31 .3 6.Vitreous incarceration into wad 16 2 .1 12 .1 7.Vitreous in AC touching cornea 17 1 0 12 .1 8.IOL decentration/dislocation 27 2 .1 25 .3 9.Cystoid macular edema 60 13 .4 46 1 10.Endophathalmitis 25 9 .3 13 .1 11.New retinal break 0 0 0 0 0 12.Retinal detachment 21 3 .1 12 .1 13.Astigmation of > 3 diopters 481 28 1 448 5 14.Posterior capsule opacification 110 18 1 87 1 15.Other 213 34 1 148 2

63
Table 3.2.3: Distribution of post-operative complication by material Type of material
PMMA Silicone Acrylic Other
Post-operative complications
N No. % No. % No. % No. %
N 12798 9161 100 1670 100 1641 100 0 0 Patients with any post-op complication
1529 1180 13 123 7 154 9 0 0
Patients with specific post-op complication
1.Central edema within 4mm of visual axis
445 282 3 61 4 83 5 0 0
2.Raised IOP of more than 30mmHg
153 111 1 15 1 22 1 0 0
3.Suture abscess 59 45 .5 4 .2 7 .4 0 0 4.Severe iritis with fibrin
52 42 .5 4 .2 4 .2 0 0
5.Iris prolapse/wound dehiscence
32 31 .3 0 0 0 0 0 0
6.Vitreous incarceration into wad
16 12 .1 0 0 2 .1 0 0
7.Vitreous in AC touching cornea
17 12 .1 0 0 1 .1 0 0
8.IOL decentration/dislocation
27 25 .3 1 .1 1 .1 0 0
9.Cystoid macular edema
60 46 1 4 .2 9 1 0 0
10.Endophathalmitis 25 13 .1 7 .4 2 .1 0 0 11.New retinal break 0 0 0 0 0 0 0 0 0 12.Retinal detachment 21 12 .1 2 .1 1 .1 0 0 13.Astigmation of > 3 diopters
481 448 5 10 0.6 18 1 0 0
14.Posterior capsule opacification
110 87 1 9 0.5 9 0.5 0 0
15.Other 213 148 2 19 1 15 1 0 0

64
Table 3.2.4: Post-operative complication by centre Centre
A B C D E F
Post-operative complications N No. % No. % No. % No. % No. % No. % N 12798 154 100 956 100 129 100 294 100 1079 100 422 100 Patients with any post-op complication 1529 35 23 191 20 5 4 30 10 112 10 112 27 Patients with specific post-op complication
1.Central edema within 4mm of visual axis
445 19 12 22 2 1 1 0 0 50 5 70 17
2.Raised IOP of more than 30mmHg 153 2 1 11 1 1 1 0 0 13 1 12 3 3.Suture abscess 59 2 1 7 1 0 0 0 0 11 1 17 4 4.Severe iritis with fibrin 52 3 2 5 1 0 0 0 0 1 0 2 0 5.Iris prolapse/wound dehiscence 32 2 1 0 0 0 0 0 0 3 0 0 0 6.Vitreous incarceration into wad 16 0 0 1 0 0 0 0 0 3 0 0 0 7.Vitreous in AC touching cornea 17 0 0 1 0 0 0 0 0 0 0 0 0 8.IOL decentration/dislocation 27 0 0 4 0 1 1 1 0 1 0 2 0 9.Cystoid macular edema 60 5 3 0 0 0 0 5 2 0 0 1 0 10.Endophathalmitis 25 3 2 1 0 0 0 0 0 0 0 4 1 11.New retinal break 0 0 0 0 0 0 0 0 0 0 0 0 0 12.Retinal detachment 21 0 0 4 0 0 0 0 0 3 0 1 0 13.Astigmation of > 3 diopters 481 0 0 128 13 0 0 26 9 22 2 5 1 14.Posterior capsule opacification 110 0 0 14 1 0 0 0 0 3 0 5 1 15.Other 213 4 3 14 1 3 2 0 0 12 1 7 2

65
Centre
G H I J K L
Post-operative complications N No. % No. % No. % No. % No. % No. % N 12798 737 100 1017 100 519 100 1141 100 480 100 830 100 Patients with any post-op complication 1529 15 2 59 6 19 4 124 11 45 9 186 22 Patients with specific post-op complication
1.Central edema within 4mm of visual axis
445 1 0 14 1 5 1 18 2 24 5 29 3
2.Raised IOP of more than 30mmHg 153 2 0 7 1 1 0 15 1 2 0 15 2 3.Suture abscess 59 0 0 1 0 5 1 3 0 0 0 2 0 4.Severe iritis with fibrin 52 0 0 3 0 0 0 5 0 1 0 5 1 5.Iris prolapse/wound dehiscence 32 2 0 1 0 0 0 0 0 0 0 2 0 6.Vitreous incarceration into wad 16 0 0 0 0 0 0 2 0 0 0 3 0 7.Vitreous in AC touching cornea 17 0 0 2 0 3 1 2 0 0 0 0 0 8.IOL decentration/dislocation 27 1 0 1 0 0 0 2 0 0 0 2 0 9.Cystoid macular edema 60 1 0 12 1 1 0 8 1 1 0 14 2 10.Endophathalmitis 25 1 0 4 0 1 0 3 0 0 0 1 0 11.New retinal break 0 0 0 0 0 0 0 0 0 0 0 0 0 12.Retinal detachment 21 1 0 0 0 0 0 2 0 2 0 2 0 13.Astigmation of > 3 diopters 481 2 0 7 1 0 0 41 4 9 2 95 11 14.Posterior capsule opacification 110 2 0 2 0 1 0 3 0 3 1 10 1 15.Other 213 3 0 11 1 2 0 32 3 8 2 28 3
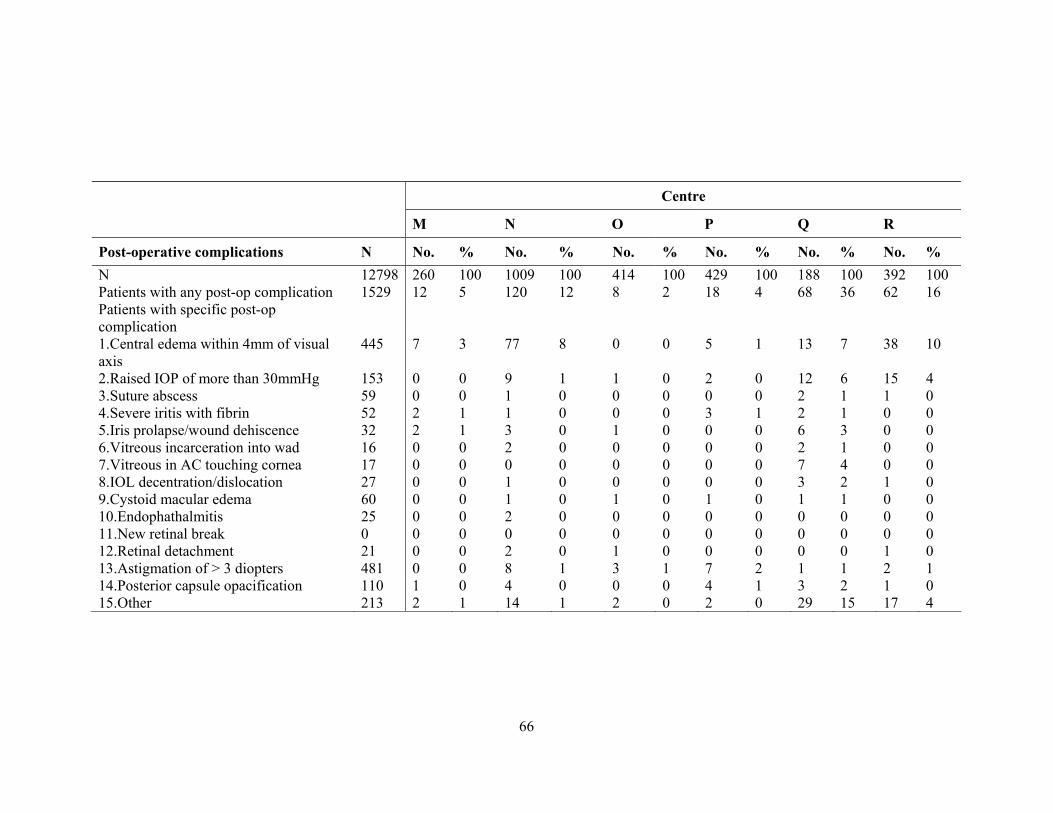
66
Centre
M N O P Q R
Post-operative complications N No. % No. % No. % No. % No. % No. % N 12798 260 100 1009 100 414 100 429 100 188 100 392 100 Patients with any post-op complication 1529 12 5 120 12 8 2 18 4 68 36 62 16 Patients with specific post-op complication
1.Central edema within 4mm of visual axis
445 7 3 77 8 0 0 5 1 13 7 38 10
2.Raised IOP of more than 30mmHg 153 0 0 9 1 1 0 2 0 12 6 15 4 3.Suture abscess 59 0 0 1 0 0 0 0 0 2 1 1 0 4.Severe iritis with fibrin 52 2 1 1 0 0 0 3 1 2 1 0 0 5.Iris prolapse/wound dehiscence 32 2 1 3 0 1 0 0 0 6 3 0 0 6.Vitreous incarceration into wad 16 0 0 2 0 0 0 0 0 2 1 0 0 7.Vitreous in AC touching cornea 17 0 0 0 0 0 0 0 0 7 4 0 0 8.IOL decentration/dislocation 27 0 0 1 0 0 0 0 0 3 2 1 0 9.Cystoid macular edema 60 0 0 1 0 1 0 1 0 1 1 0 0 10.Endophathalmitis 25 0 0 2 0 0 0 0 0 0 0 0 0 11.New retinal break 0 0 0 0 0 0 0 0 0 0 0 0 0 12.Retinal detachment 21 0 0 2 0 1 0 0 0 0 0 1 0 13.Astigmation of > 3 diopters 481 0 0 8 1 3 1 7 2 1 1 2 1 14.Posterior capsule opacification 110 1 0 4 0 0 0 4 1 3 2 1 0 15.Other 213 2 1 14 1 2 0 2 0 29 15 17 4

67
Centre
S T U V W X Y
Post-operative complications N No. % No. % No. % No. % No. % No. % No. % N 12798 421 100 801 100 268 100 285 100 213 100 127 100 233 100 Patients with any post-op complication 1529 47 11 173 22 30 11 35 12 10 5 7 6 6 3 Patients with specific post-op complication
1.Central edema within 4mm of visual axis
445 7 2 37 5 4 1 3 1 1 0 0 0 0 0
2.Raised IOP of more than 30mmHg 153 7 2 20 2 1 0 3 1 0 0 2 2 0 0 3.Suture abscess 59 2 0 2 0 0 0 0 0 0 0 3 2 0 0 4.Severe iritis with fibrin 52 0 0 17 2 1 0 1 0 0 0 0 0 0 0 5.Iris prolapse/wound dehiscence 32 1 0 1 0 1 0 4 1 1 0 1 1 1 0 6.Vitreous incarceration into wad 16 1 0 0 0 0 0 0 0 0 0 0 0 2 1 7.Vitreous in AC touching cornea 17 0 0 0 0 0 0 1 0 0 0 0 0 1 0 8.IOL decentration/dislocation 27 0 0 6 1 0 0 0 0 0 0 0 0 1 0 9.Cystoid macular edema 60 1 0 1 0 1 0 5 2 0 0 0 0 0 0 10.Endophathalmitis 25 1 0 2 0 0 0 0 0 1 0 0 0 1 0 11.New retinal break 0 0 0 0 0 0 0 0 0 0 0 0 0 0 0 12.Retinal detachment 21 1 0 1 0 0 0 0 0 0 0 0 0 0 0 13.Astigmation of > 3 diopters 481 14 3 77 10 14 5 11 4 7 3 2 2 0 0 14.Posterior capsule opacification 110 7 2 32 4 6 2 8 3 0 0 0 0 1 0 15.Other 213 11 3 4 0 6 2 2 1 0 0 0 0 0 0

68
3.3 Analysis On Cataract Surgery Visual Outcome Table 3.3.1: Median follow-up period in weeks (Patients with only unaided vision, refraction was not performed) Type of surgery N Median 25th
percentile 75th percentile
All surgeries 2184 7.9 2.1 11.9 Lens aspiration 81 7.6 3.3 11.3 ECCE 1309 8.1 1.9 11.9 PE 720 7 2.1 11.4 PE to ECCE 52 9.9 5.6 13.6 ICCE 14 9.1 1.9 16.6 Secondary IOL Implant
8 11.1 7.5 13.4
Table 3.3.2: Median follow-up period in weeks (Patients with refracted vision) Type of surgery N Median 25th
percentile 75th percentile
All surgeries 10385 11.1 8.1 13.9 Lens aspiration 237 11.1 7.9 14.1 ECCE 5492 11.7 8.6 14 PE 4309 10.3 7.4 13.4 PE to ECCE 255 12.3 9.1 14.1 ICCE 66 12.4 8.7 15.4 Secondary IOL Implant
26 11.2 8 16.9

69
3.4 Post-Operative Visual Acuity Table 3.4.1: Distribution of post-operative VA VA post operative Unaided Refracted
N=12512 100% N=10385 100%
No. % No. % 6/5 9 0 60 1 6/6 598 5 2784 27 6/9 1968 16 3773 36 6/12 2294 18 1759 17 6/18 2308 18 735 7 6/24 1954 16 410 4 6/36 1452 12 279 3 6/60 868 7 166 2 5/60 77 1 13 0 4/60 64 1 13 0 3/60 127 1 43 0 2/60 128 1 59 1 1/60 146 1 54 1 CF 231 2 86 1 HM 203 2 105 1 PL 54 0 27 0 NPL 31 0 19 0
Figure 3.4.1.1: Distribution of post-operative VA
%
Visual acuity
0
10
20
30
40 Unaided Refracted
6/56/6
6/96/12
6/186/24
6/366/60
5/604/60
3/602/60
1/60CF
HMPL
NPL

70
Figure 3.4.1.2: Cumulative distribution of visual acuity by pre- and post-operative
unaided VA
Cum
ulat
ive d
istrib
utio
n
Visual acuity
Pre-operative Post-operative
6/5 6/6 6/9 6/12 6/18 6/24 6/36 6/60 5/60 4/60 3/60 2/60 1/60 CF HM PL NPL0
.25
.5
.75
1
Figure 3.4.1.3: Cumulative distribution of visual acuity by pre- and post-operative refracted VA
Cum
ulat
ive d
istrib
utio
n
Visual acuity
Pre-operative Post-operative
6/5 6/6 6/9 6/12 6/18 6/24 6/36 6/60 5/60 4/60 3/60 2/60 1/60 CF HM PL NPL0
.25
.5
.75
1

71
Table 3.4.2: Distribution of post-operative refracted VA 6/12 or better at the last follow up, by surgery Type of surgery Unaided Refracted
N VA 6/12 or better N VA 6/12 or
better
No. % No. % All surgeries 12512 4869 39 10385 8376 81 Lens aspiration 315 86 27 237 129 54 ECCE 6770 2177 32 5492 4255 77 PE 5009 2490 50 4309 3746 87 PE to ECCE 305 94 31 255 192 75 ICCE 80 12 15 66 33 50 Secondary IOL Implant 33 10 30 26 21 81 Figure 3.4.2: Percent of patients with refracted VA 6/12 or better at the last follow up,
by surgery
% V
A 6/
12 o
r bet
ter
Type of surgery0
50
100 Unaided Refracted
LA ECCE PE PE to ECCE ICCE 2 IOL Implant
* LA=Lens aspiration * 2 IOL Implant=Secondary IOL Implant

72
Table 3.4.3:Distribution of post-operative refracted VA 6/12 or better in relation to age and type of surgery
Factor Types of cataract surgery
All surgeries Lens aspiration ECCE PE PE to ECCE ICCE Secondary IOL Implant
N No. % N No. % N No. % N No. % N No. % N No. % N No. % N 10385 8376 81 237 129 54 5492 4255 77 4309 3746 87 255 192 75 66 33 50 26 21 81 Age group, year
<1 2 1 50 2 1 50 0 0 0 0 0 0 0 0 0 0 0 0 0 0 0 1-14 105 51 49 97 44 45 3 2 67 4 4 100 0 0 0 0 0 0 1 1 100 15-24 80 55 69 55 33 60 12 10 83 6 6 100 0 0 0 3 2 67 4 4 100 25-34 81 60 74 35 25 71 22 16 73 23 18 78 0 0 0 0 0 0 1 1 100 35-44 303 253 83 25 14 56 151 131 87 118 102 86 5 4 80 2 1 50 2 1 50 45-54 1175 990 84 10 5 50 599 495 83 522 456 87 31 26 84 12 7 58 1 1 100 55-64 2836 2394 84 4 2 50 1446 1160 80 1283 1158 90 75 56 75 23 14 61 5 4 80 65-74 4012 3282 82 3 1 33 2183 1693 78 1692 1489 88 109 85 78 16 7 44 9 7 78 75-84 1627 1196 74 5 4 80 961 688 72 616 481 78 33 19 58 9 2 22 3 2 67 >=85 164 94 57 1 0 0 115 60 52 45 32 71 2 2 100 1 0 0 0 0 0

73
Table 3.4.4: Distribution of post-operative refracted VA 6/12 or better in relation to gender and type of surgery
Factor Types of cataract surgery
All surgeries Lens aspiration ECCE PE PE to ECCE ICCE Secondary IOL Implant
N No. % N No. % N No. % N No. % N No. % N No. % N No. % N 10385 8376 81 237 129 54 5492 4255 77 4309 3746 87 255 192 75 66 33 50 26 21 81 Gender Male 5046 4105 81 157 87 55 2602 2048 79 2093 1825 87 130 104 80 49 27 55 15 14 93 Female 5339 4271 80 80 42 53 2890 2207 76 2216 1921 87 125 88 70 17 6 35 11 7 64
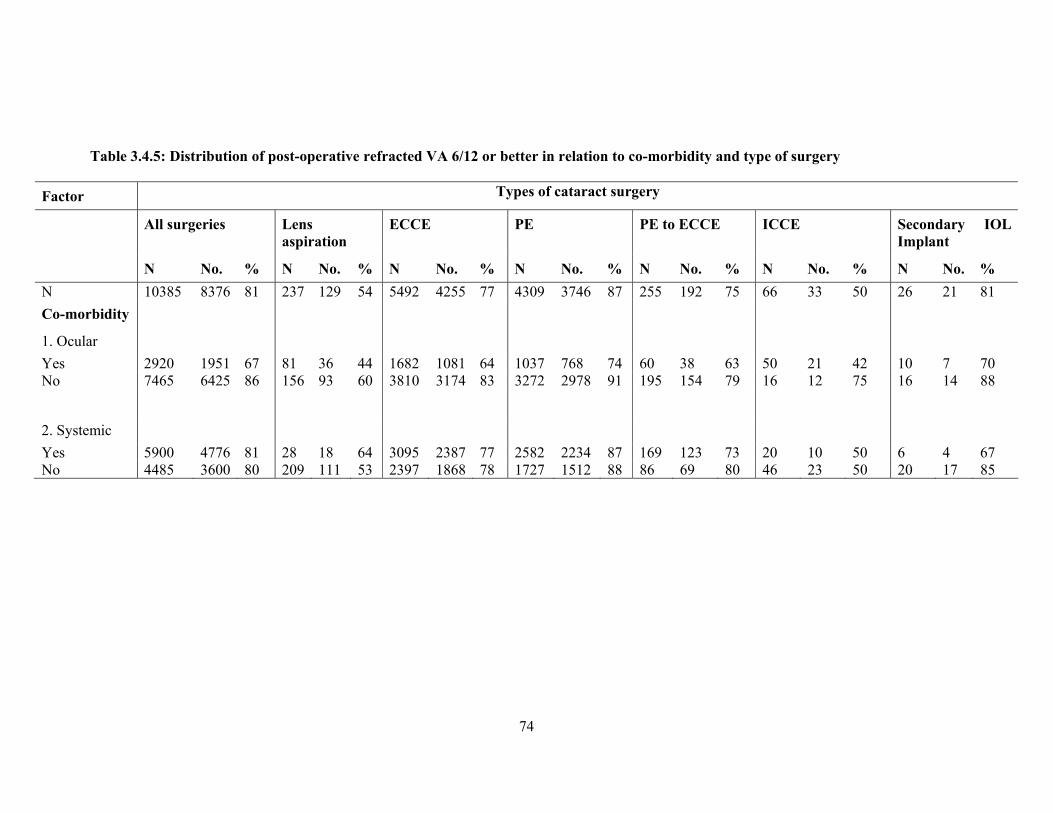
74
Table 3.4.5: Distribution of post-operative refracted VA 6/12 or better in relation to co-morbidity and type of surgery
Factor Types of cataract surgery
All surgeries Lens aspiration
ECCE PE PE to ECCE ICCE Secondary IOL Implant
N No. % N No. % N No. % N No. % N No. % N No. % N No. % N 10385 8376 81 237 129 54 5492 4255 77 4309 3746 87 255 192 75 66 33 50 26 21 81 Co-morbidity
1. Ocular Yes 2920 1951 67 81 36 44 1682 1081 64 1037 768 74 60 38 63 50 21 42 10 7 70 No 7465 6425 86 156 93 60 3810 3174 83 3272 2978 91 195 154 79 16 12 75 16 14 88
2. Systemic Yes 5900 4776 81 28 18 64 3095 2387 77 2582 2234 87 169 123 73 20 10 50 6 4 67 No 4485 3600 80 209 111 53 2397 1868 78 1727 1512 88 86 69 80 46 23 50 20 17 85

75
Table 3.4.6: Distribution of post-operative refracted VA 6/12 or better in relation to complication and type of surgery
Factor Types of cataract surgery
All surgeries Lens aspiration ECCE PE PE to ECCE ICCE Secondary IOL Implant
N No. % N No. % N No. % N No. % N No. % N No. % N No. % N 10385 8376 81 237 129 54 5492 4255 77 4309 3746 87 255 192 75 66 33 50 26 21 81 Complication
1. Intra-op Yes 1091 740 68 37 16 43 548 350 64 377 289 77 107 76 71 22 9 41 0 0 0 No 9294 7636 82 200 113 56 4944 3905 79 3932 3457 88 148 116 78 44 24 55 26 21 81
2. Post-op Yes 1288 845 66 33 10 30 810 529 65 376 273 73 47 25 53 15 1 7 7 7 100 No 9097 7531 83 204 119 58 4682 3726 80 3933 3473 88 208 167 80 51 32 63 19 14 74

76
Table 3.4.7: Distribution of post-operative refracted VA 6/12 or better in relation to nature of surgery and type of surgery
Factor Types of cataract surgery
All surgeries Lens aspiration ECCE PE PE to ECCE ICCE Secondary IOL Implant
N No. % N No. % N No. % N No. % N No. % N No. % N No. % N 10385 8376 81 237 129 54 5492 4255 77 4309 3746 87 255 192 75 66 33 50 26 21 81 Nature of surgeries
Emergency 108 74 69 12 5 42 56 39 70 36 28 78 1 0 0 3 2 67 0 0 0 Elective 10277 8302 81 225 124 55 5436 4216 78 4273 3718 87 254 192 76 63 31 49 26 21 81

77
Table 3.4.8: Distribution of post-operative refracted VA 6/12 or better in relation to anaesthesia and type of surgery
Factor Types of cataract surgery
All surgeries Lens aspiration ECCE PE PE to ECCE ICCE Secondary IOL Implant
N No. % N No. % N No. % N No. % N No. % N No. % N No. % N 10385 8376 81 237 129 54 5492 4255 77 4309 3746 87 255 192 75 66 33 50 26 21 81 Anaesthesia
1. Anaesthesia General 571 353 62 200 110 55 208 131 63 131 92 70 9 3 33 13 8 62 10 9 90 Local 9814 8023 82 37 19 51 5284 4124 78 4178 3654 87 246 189 77 53 25 47 16 12 75 2. Local anaesthesia
Retrobulbar 2368 1927 81 5 2 40 1266 988 78 1025 887 87 52 38 73 12 5 42 8 7 88 Peribulbar 2051 1678 82 7 5 71 1168 921 79 816 712 87 40 29 73 17 9 53 3 2 67 Subtenon 4780 3865 81 22 11 50 2904 2266 78 1683 1462 87 139 110 79 27 13 48 5 3 60 Subconjunctival 26 19 73 0 0 0 13 8 62 12 10 83 1 1 100 0 0 0 0 0 0 Facialblock 991 788 80 2 1 50 648 496 77 317 275 87 17 9 53 4 4 100 3 3 100 Topical 1208 1031 85 6 2 33 171 115 67 1003 894 89 25 19 76 2 1 50 1 0 0 Other 1 1 100 0 0 0 1 1 100 0 0 0 0 0 0 0 0 0 0 0 0
3. Sedation Any 3603 2964 82 11 5 45 2235 1788 80 1252 1097 88 80 61 76 21 9 43 4 4 100 None 6782 5412 80 226 124 55 3257 2467 76 3057 2649 87 175 131 75 45 24 53 22 17 77

78
Table 3.4.9: Distribution of post-operative refracted VA 6/12 or better in relation to combined surgery and type of surgery
Factor Types of cataract surgery
All surgeries Lens aspiration ECCE PE PE to ECCE ICCE Secondary IOL Implant
N No. % N No. % N No. % N No. % N No. % N No. % N No. % N 10385 8376 81 237 129 54 5492 4255 77 4309 3746 87 255 192 75 66 33 50 26 21 81 Combined surgery
Any 281 179 64 23 8 35 135 86 64 99 71 72 4 2 50 16 9 56 4 3 75 None 10104 8197 81 214 121 57 5357 4169 78 4210 3675 87 251 190 76 50 24 48 22 18 82

79
Table 3.4.10: Distribution of post-operative refracted VA 6/12 or better in relation to IOL and type of surgery
Factor Types of cataract surgery
All surgeries Lens aspiration ECCE PE PE to ECCE ICCE Secondary IOL Implant
N No. % N No. % N No. % N No. % N No. % N No. % N No. % N 10385 8376 81 237 129 54 5492 4255 77 4309 3746 87 255 192 75 66 33 50 26 21 81 IOL
1. IOL With IOL 10184 8329 82 207 121 58 5370 4227 79 4291 3744 87 249 192 77 41 24 59 26 21 81 Without IOL 201 47 23 30 8 27 122 28 23 18 2 11 6 0 0 25 9 36 0 0 0 N 10185 8330 82 207 121 58 5370 4227 79 4292 3745 87 249 192 77 41 24 59 26 21 81 2. IOL-type Foldable 2871 2535 88 64 41 64 148 115 78 2604 2330 89 53 47 89 0 0 0 2 2 100 Non-foldable 7314 5795 79 143 80 56 5222 4112 79 1688 1415 84 196 145 74 41 24 59 24 19 79
3.IOL-material
PMMA 7314 5795 79 143 80 56 5222 4112 79 1688 1415 84 196 145 74 41 24 59 24 19 79 Silicone 1495 1335 89 15 11 73 55 42 76 1403 1262 90 21 19 90 0 0 0 1 1 100 Acrylic 1376 1200 87 49 30 61 93 73 78 1201 1068 89 32 28 88 0 0 0 1 1 100 Other 0 0 0 0 0 0 0 0 0 0 0 0 0 0 0 0 0 0 0 0 0
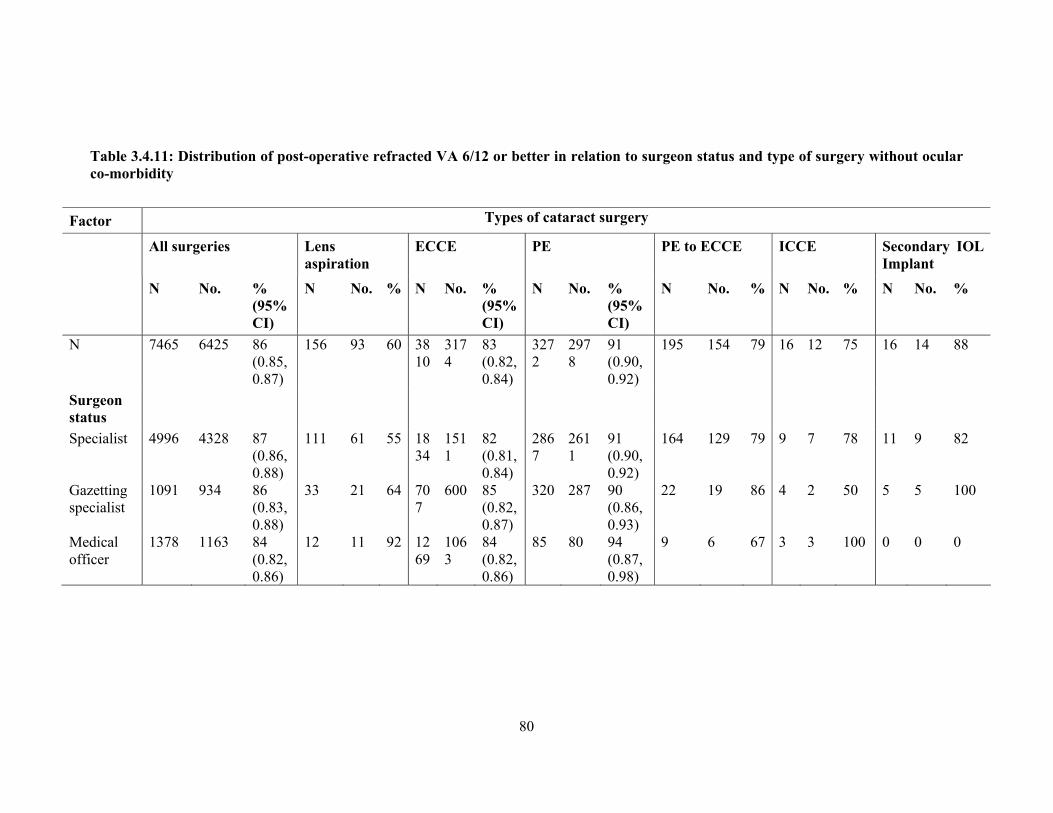
80
Table 3.4.11: Distribution of post-operative refracted VA 6/12 or better in relation to surgeon status and type of surgery without ocular co-morbidity
Factor Types of cataract surgery
All surgeries Lens aspiration
ECCE PE PE to ECCE ICCE Secondary IOL Implant
N No. % (95%CI)
N No. % N No. % (95%CI)
N No. % (95%CI)
N No. % N No. % N No. %
N 7465 6425 86 (0.85, 0.87)
156 93 60 3810
3174
83 (0.82, 0.84)
3272
2978
91 (0.90, 0.92)
195 154 79 16 12 75 16 14 88
Surgeon status
Specialist 4996 4328 87 (0.86, 0.88)
111 61 55 1834
1511
82 (0.81, 0.84)
2867
2611
91 (0.90, 0.92)
164 129 79 9 7 78 11 9 82
Gazetting specialist
1091 934 86 (0.83, 0.88)
33 21 64 707
600 85 (0.82, 0.87)
320 287 90 (0.86, 0.93)
22 19 86 4 2 50 5 5 100
Medical officer
1378 1163 84 (0.82, 0.86)
12 11 92 1269
1063
84 (0.82, 0.86)
85 80 94 (0.87, 0.98)
9 6 67 3 3 100 0 0 0
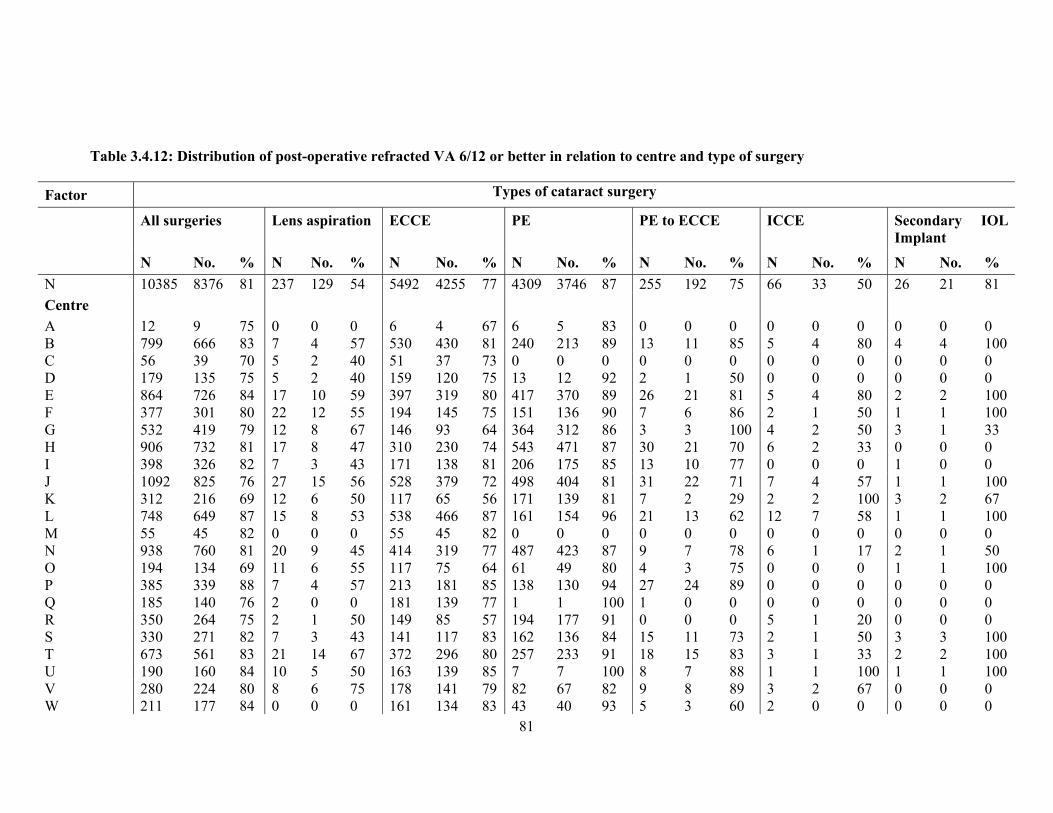
81
Table 3.4.12: Distribution of post-operative refracted VA 6/12 or better in relation to centre and type of surgery
Factor Types of cataract surgery
All surgeries Lens aspiration ECCE PE PE to ECCE ICCE Secondary IOL Implant
N No. % N No. % N No. % N No. % N No. % N No. % N No. % N 10385 8376 81 237 129 54 5492 4255 77 4309 3746 87 255 192 75 66 33 50 26 21 81 Centre A 12 9 75 0 0 0 6 4 67 6 5 83 0 0 0 0 0 0 0 0 0 B 799 666 83 7 4 57 530 430 81 240 213 89 13 11 85 5 4 80 4 4 100 C 56 39 70 5 2 40 51 37 73 0 0 0 0 0 0 0 0 0 0 0 0 D 179 135 75 5 2 40 159 120 75 13 12 92 2 1 50 0 0 0 0 0 0 E 864 726 84 17 10 59 397 319 80 417 370 89 26 21 81 5 4 80 2 2 100 F 377 301 80 22 12 55 194 145 75 151 136 90 7 6 86 2 1 50 1 1 100 G 532 419 79 12 8 67 146 93 64 364 312 86 3 3 100 4 2 50 3 1 33 H 906 732 81 17 8 47 310 230 74 543 471 87 30 21 70 6 2 33 0 0 0 I 398 326 82 7 3 43 171 138 81 206 175 85 13 10 77 0 0 0 1 0 0 J 1092 825 76 27 15 56 528 379 72 498 404 81 31 22 71 7 4 57 1 1 100 K 312 216 69 12 6 50 117 65 56 171 139 81 7 2 29 2 2 100 3 2 67 L 748 649 87 15 8 53 538 466 87 161 154 96 21 13 62 12 7 58 1 1 100 M 55 45 82 0 0 0 55 45 82 0 0 0 0 0 0 0 0 0 0 0 0 N 938 760 81 20 9 45 414 319 77 487 423 87 9 7 78 6 1 17 2 1 50 O 194 134 69 11 6 55 117 75 64 61 49 80 4 3 75 0 0 0 1 1 100 P 385 339 88 7 4 57 213 181 85 138 130 94 27 24 89 0 0 0 0 0 0 Q 185 140 76 2 0 0 181 139 77 1 1 100 1 0 0 0 0 0 0 0 0 R 350 264 75 2 1 50 149 85 57 194 177 91 0 0 0 5 1 20 0 0 0 S 330 271 82 7 3 43 141 117 83 162 136 84 15 11 73 2 1 50 3 3 100 T 673 561 83 21 14 67 372 296 80 257 233 91 18 15 83 3 1 33 2 2 100 U 190 160 84 10 5 50 163 139 85 7 7 100 8 7 88 1 1 100 1 1 100 V 280 224 80 8 6 75 178 141 79 82 67 82 9 8 89 3 2 67 0 0 0 W 211 177 84 0 0 0 161 134 83 43 40 93 5 3 60 2 0 0 0 0 0
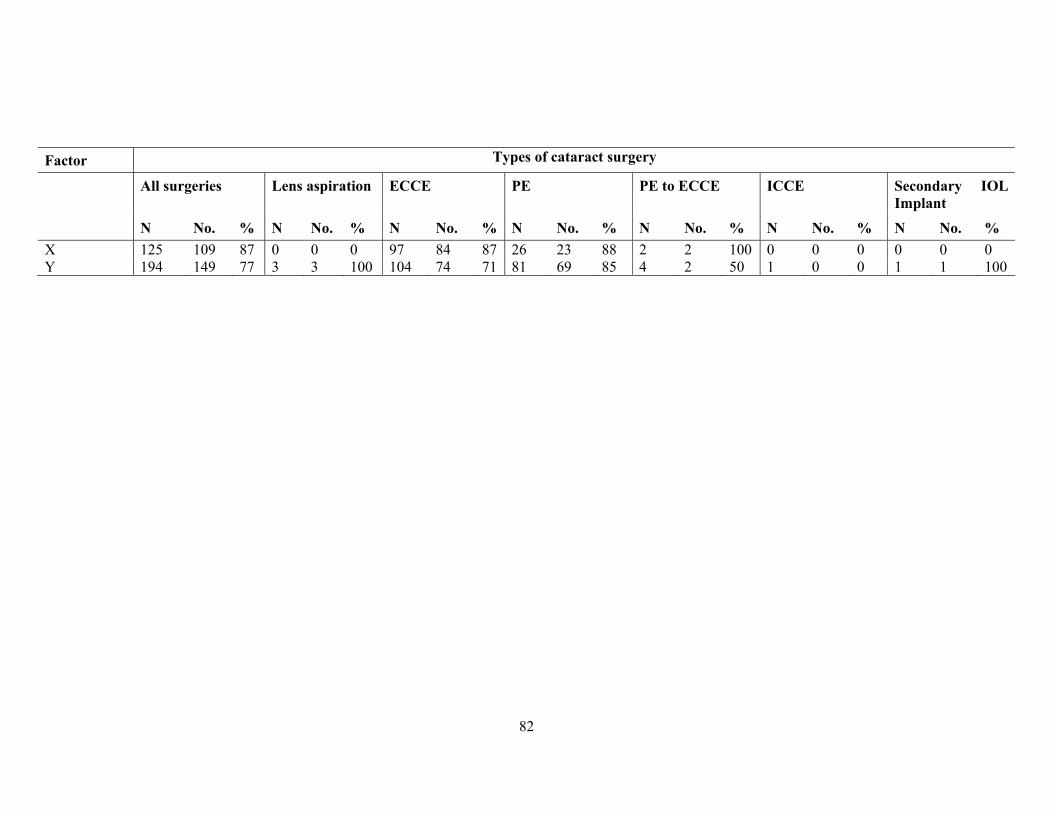
82
Factor Types of cataract surgery
All surgeries Lens aspiration ECCE PE PE to ECCE ICCE Secondary IOL Implant
N No. % N No. % N No. % N No. % N No. % N No. % N No. % X 125 109 87 0 0 0 97 84 87 26 23 88 2 2 100 0 0 0 0 0 0 Y 194 149 77 3 3 100 104 74 71 81 69 85 4 2 50 1 0 0 1 1 100

83
3.5 Post-Operative Refracted VA Improved by One or More Line of Snellen Chart Table 3.5.1: Distribution of post-operative refracted VA improved by one or more line of Snellen chart, at the last follow up Type of surgery
Refracted Visual Acuity
N No change Worse Improved
No. % No. % No. % All surgeries 628 41 7 27 4 560 89 Lens aspiration
14 0 0 1 7 13 93
ECCE 235 9 4 9 4 217 92 PE 350 29 8 14 4 307 88 PE to ECCE 24 2 8 3 13 19 79 ICCE 2 0 0 0 0 2 100 Secondary IOL Implant
3 1 33 0 0 2 67

84
Table 3.5.2: Distribution of post- operative refracted VA improved by one or more line of Snellen chart, with and without ocular co-morbidity at the last follow up
Ocular co-morbidity
Refracted VA
Type of surgery
All surgeries
Lens aspiration
ECCE PE PE to ECCE
ICCE Secondary IOL Implant
Yes N 156 2 68 77 5 2 2
No change
No. 9 0 4 4 0 0 1
% 6 0 6 5 0 0 50
Worse No. 12 0 5 7 0 0 0
% 8 0 7 9 0 0 0
Improved No. 135 2 59 66 5 2 1
% 87 100 87 86 100 100 50
No. N 472 12 167 273 19 0 1
No change
No. 32 0 5 25 2 0 0
% 7 0 3 9 11 0 0
Worse No. 15 1 4 7 3 0 0
% 3 8 2 3 16 0 0
Improved No. 425 11 158 241 14 0 1
% 90 92 95 88 74 0 100
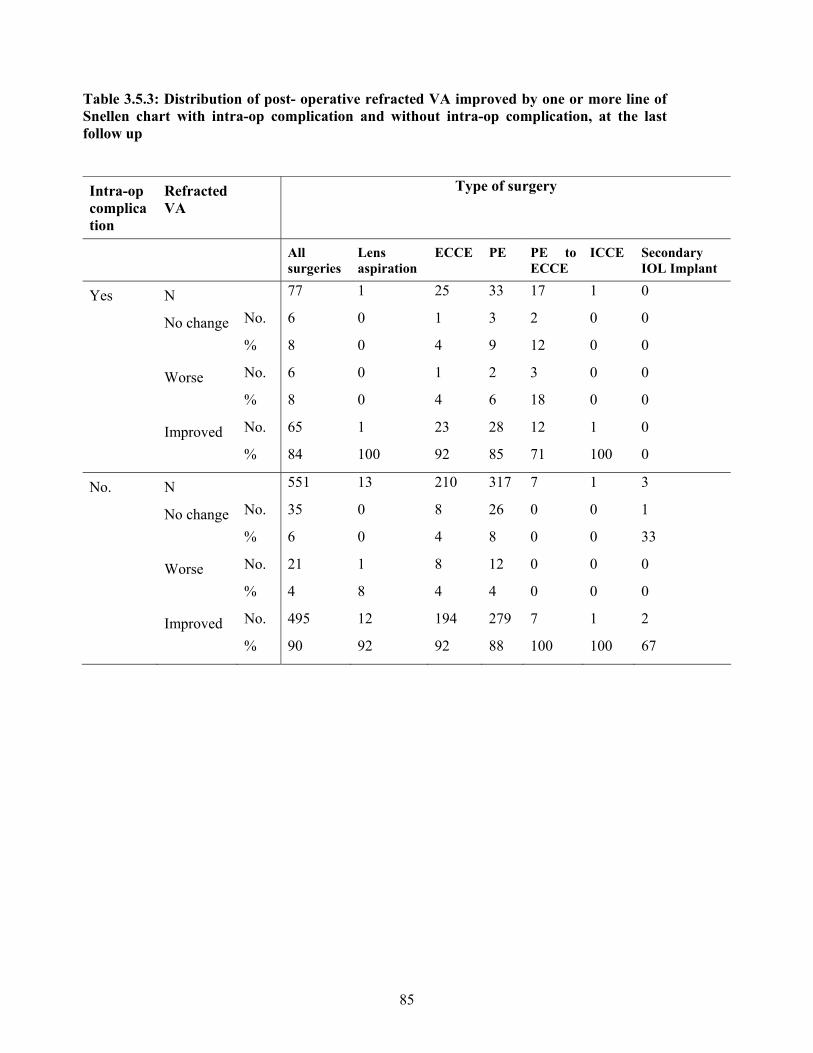
85
Table 3.5.3: Distribution of post- operative refracted VA improved by one or more line of Snellen chart with intra-op complication and without intra-op complication, at the last follow up
Intra-op complication
Refracted VA
Type of surgery
All surgeries
Lens aspiration
ECCE PE PE to ECCE
ICCE Secondary IOL Implant
Yes N 77 1 25 33 17 1 0
No change No. 6 0 1 3 2 0 0
% 8 0 4 9 12 0 0
Worse No. 6 0 1 2 3 0 0
% 8 0 4 6 18 0 0
Improved No. 65 1 23 28 12 1 0
% 84 100 92 85 71 100 0
No. N 551 13 210 317 7 1 3
No change No. 35 0 8 26 0 0 1
% 6 0 4 8 0 0 33
Worse No. 21 1 8 12 0 0 0
% 4 8 4 4 0 0 0
Improved No. 495 12 194 279 7 1 2
% 90 92 92 88 100 100 67
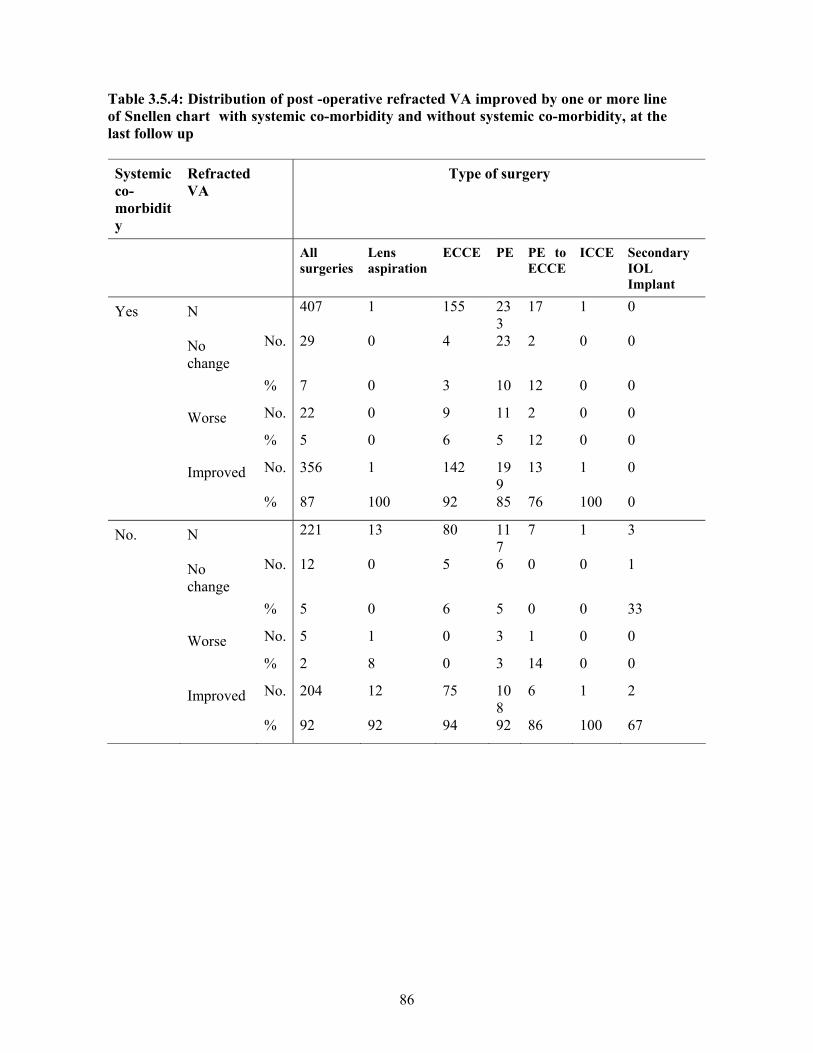
86
Table 3.5.4: Distribution of post -operative refracted VA improved by one or more line of Snellen chart with systemic co-morbidity and without systemic co-morbidity, at the last follow up
Systemic co-morbidity
Refracted VA
Type of surgery
All surgeries
Lens aspiration
ECCE PE PE to ECCE
ICCE Secondary IOL Implant
Yes N 407 1 155 233
17 1 0
No change
No. 29 0 4 23 2 0 0
% 7 0 3 10 12 0 0
Worse No. 22 0 9 11 2 0 0
% 5 0 6 5 12 0 0
Improved No. 356 1 142 199
13 1 0
% 87 100 92 85 76 100 0
No. N 221 13 80 117
7 1 3
No change
No. 12 0 5 6 0 0 1
% 5 0 6 5 0 0 33
Worse No. 5 1 0 3 1 0 0
% 2 8 0 3 14 0 0
Improved No. 204 12 75 108
6 1 2
% 92 92 94 92 86 100 67

87
Table 3.5.5: Distribution of post -operative refracted VA improved by one or more line of Snellen chart at the last follow up in relation to surgeon status and type of surgery without ocular comorbidity
Type of surgery Surgeon status N No change Worse Improved
No. % (95%CI) No. % (95%CI) No. % (95%CI) All surgeries Specialist 374 27 7 (4.81,10.33) 13 3 (1.86,5.87) 334 89 (85.72,92.25) Gazetting
specialist 55 7 13 (5.27,24.48) 0 0 (0.00,6.49)* 48 87 (75.52,94.73)
Medical officer
62 1 2 (0.04,8.66) 2 3 (0.39,11.17) 59 95 (86.50,98.99)
Lens aspiration Specialist 8 0 0 1 13 7 88 Gazetting
specialist 1 0 0 0 0 1 100
Medical officer
3 0 0 0 0 3 100
ECCE Specialist 109 3 3 (0.57,7.83) 2 2 (0.22,6.47) 104 95 (89.62,98.49) Gazetting
specialist 27 4 15 (4.19,33.73) 0 0 (0.00,12.77)* 23 85 (66.27,95.81)
Medical officer
41 1 2 (0.06,12.86) 2 5 (0.60,16.53) 38 93 (80.08,98.47)
PE Specialist 240 23 10 (6.17,14.03) 7 3 (1.18,5.92) 210 88 (82.64,91.41) Gazetting
specialist 23 2 9 (1.07,28.04) 0 0 (0.00,14.82)* 21 91 (71.96,98.93)
Medical officer
17 0 0 (0.00,19.51)* 0 0 (0.00,19.51)* 17 100 (80.49,100.00)*
PE to ECCE Specialist 17 1 6 3 18 13 76 Gazetting
specialist 3 1 33 0 0 2 67
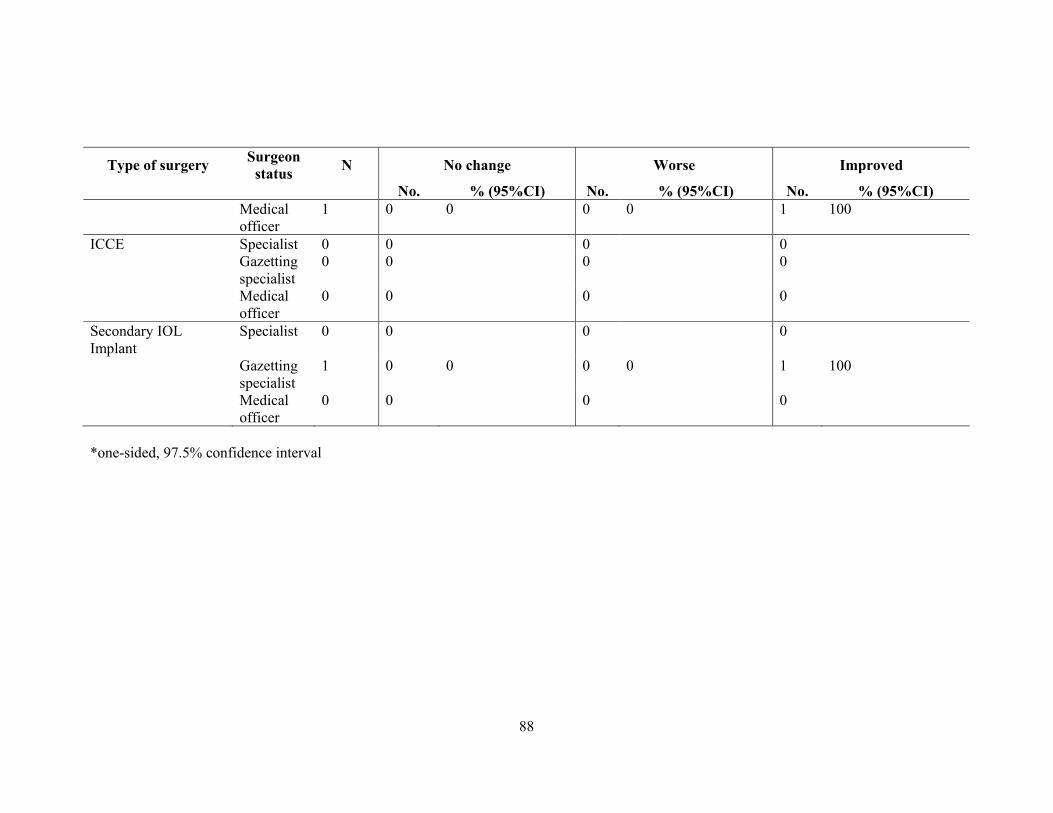
88
Type of surgery Surgeon status N No change Worse Improved
No. % (95%CI) No. % (95%CI) No. % (95%CI) Medical
officer 1 0 0 0 0 1 100
ICCE Specialist 0 0 0 0 Gazetting
specialist 0 0 0 0
Medical officer
0 0 0 0
Secondary IOL Implant
Specialist 0 0 0 0
Gazetting specialist
1 0 0 0 0 1 100
Medical officer
0 0 0 0
*one-sided, 97.5% confidence interval

89
3.6 Factors Contributing to Post-Operative Refracted Visual Acuity of Worse than 6/12 Table 3.6.1: Distribution of factors contributing to post- operative refracted VA of worse than 6/12 Factor No. % N 2009 100 Patients with any factor 1776 88 Patients with specific factor 1.High astigmatism 489 24 2.Posterior capsular opacity 198 10 3.Cystoid macular edema 93 5 4.Endophthalmitis 16 1 5.Corneal decompensation 37 2 6.Decentre ed IOL 14 1 7.Retinal detachment 27 1 8.Preexisting ocular co-morbidity 818 41 9.Other 302 15

APPENDIX I (CLINICAL RECORD FORMS)
PRE-CLERKING RECORD
OPERATIVE RECORD
CATARACT SURGERY OUTCOMES THROUGH 12 WEEKS POST OP