NATIONAL ADVISORY COMMQ'TEE FOR AERONAUTICS · PDF fileNATIONAL ADVISORY COMMQ'TEE FOR...
73
. : _.---- -- - 3 1176 01348 3954 7 - . .- 9.’ NATIONAL ADVISORY COMMQ'TEE FOR AERONAUTICS TECHNICAL NOTE By N; J, Hoff, $7. J. Fuchs, and Adam J. Cirillo Polytechnic Ins%ltute of Brooklyn Washington October 1944 https://ntrs.nasa.gov/search.jsp?R=19930085005 2018-05-26T19:01:38+00:00Z
Transcript of NATIONAL ADVISORY COMMQ'TEE FOR AERONAUTICS · PDF fileNATIONAL ADVISORY COMMQ'TEE FOR...

. : _.---- -- -
3 1176 01348 3954 7 -
.
.- 9.’
NATIONAL ADVISORY COMMQ'TEE FOR AERONAUTICS
TECHNICAL NOTE
By N; J, Hoff, $7. J. Fuchs, and Adam J. Cirillo Polytechnic Ins%ltute of Brooklyn
Washington October 1944
https://ntrs.nasa.gov/search.jsp?R=19930085005 2018-05-26T19:01:38+00:00Z

4
--•
f
a
NAT1IQBlI.I ADtrISO~Y CO2S2~ITTIE ;tPOR ABBOXJ!.UTICS
TECHNICAL XOTE NO, 939
THE INWARD SULGX TYPE BUCZLSNG OF 2iOaOCOQUI!! CYLI2~IDIBS
COIS9IXTED BEXBIFG AND CQl@RESSION
By IT, J. Hoff, S. J. FUC~S~ &IA Adam J, Cirillo
This paper is the second part of a ssries Of reports on the inward bulge typa buckling of monoCoqUe cylinders. . It preeents the result6 of an experimental investigation of buckling in combined bending and compression. In the investigation it was found that the theory developed in part I of the present series predicts the buckling load in combined bending and compression with the same degree of accuracy as the older theory does in pure bending, In the realm covered by the experiments no systematic varfa- tion of the parameter n was ctbserved. The analysis of the tesd results afforded a check on the theories Of buck- 1Sng of a curved panel. The agreement between experiment and theory was reasona‘bly good. In addition, the effect of the end conditions upon the stress distribution under loads and upon initOa1 s.tresses was investigated.
IXTBODUCTIOB
Large monocoque.fuselages reinforced with closely spacad stringers and rfngs are 1Pkely to buckle, when loadea, in a pattern which involves simultaneous distor- tions of the stringers, the rings, and the sheet covering. This type.of buckling is known as general instability. The details of the pattern vary with the loading. When the maximum stress In the fuselage is caused mainly by a bending moment, which may be accompanied by a small shear force, compressive force, or tOPqu8, the characteristic feature of the distorted shape fs an inward bulge extending

4
--d-. BymmetriCally from the most highly COmpr8S%8d Stringer. ' In SOm8 c&se~ there iS a sing18 inward bulge; in others several appear along the most highly compressed stringer, and these may occur when the bending moment 5s aonstant over a uniform portion of considerable length of a mono- coque cylinder. often a few shallower secondary bulges appear alongsids the main bulges, or the main bulge &s diSpleLU8a slightly because of inaco,uraoies of manufacture . and load application, but fn every case ~0 far observed all these distortions were restricted to the-general neighborhood ef the nos.% highly COmpr88S8d stringer, This type of general instability is denoted as inward bulge type buckling.
The purpose of the esperimental investigation pre- sented here was the verffication of the theory of inward bulge type buoklfng in combined bending and CQmpr8SSiOn aa deueloped in referenae 1, Beinforoed monoooque Cyl- inders of 20-inch diameter and 33.6-inch length - four oylfnders in the preliminary and nine in the final test series - were tested in the Aircraft gtructures &abOratOry of the Polytechnic Institute -of'Brooklyn, Hor their oon- tribution to the development of the,manufaoturing and testing teahnique Cr8d%t ia due to Albert J. Gullen and Joseah Eempner, SfUilarly* the contribution of Bruno 8, Boleg in Barticipating in the final tests and the evalua- tion of the test re$ults must be acknowledged.'
In the third sectionzof this report the test specf- men and the test rig are desaribed, In the fourth sec- tion the test res'ults are analysed. $or the calculation Of the theoretical buckling stress correspanding to the inward bulge pattern the effective width of the curved panel3 of sheet must be known. The determination of the effective width in turn presupposes the knowledge of the buckling stress of the curved, panels, SIoreover, devta- tions Prom the theoratioal str8ss distribution influence the magnitude of the load under which the inward bulgs develaps and it was establSshed in the experiments that at least the location of.the bulge is influenced by the initial stresses in the test specimen,
Beoauae of these complex interrelations it was net)- essary to analyze the.varfoua items separately and'to proceed systenatioally frum the discussion of the lfne- arity of the strain distribution in bending through the atnal.vBeS of the uniformity of strain in COmpr88S%On, the inttial stresd, the buckling of the sheet oovering, tLe

NACA !rCB Nb. 939 3
,
.
.*
equilibrium of forces and moments, and the strain-bending moment curvas of the stringers to the discussion of the Crrtical. stress in inward bulge type buckling proper*
l!he fifth section contains the principal conclusions drawn from the anaLysfs.
This investigatfon, conducted at; the Polytechnic Institute of Broo!clya, was sponsord by, and aonhucted with financial assistance from, the Natfonal Advisory Committee for Beronautios,
B0tr
d
1
f e cr
f .curved
fflat P
CY
Ir
1 st3?
I str r
1 str t
k
cross-seotional area of stringer plus effective width
stringer spacing measured along circumference
Youngts modulus
buckling stress of curved panel
buckling stress of cfrcular cylinder . buckling stress of flat panel
yield-point stress
moment of inertia of ring plus effeotive width
moment of inertia of stringer defined in equa- tion (7)
moment of inert%a of stringer plus effectZv0 width for bending in radial directfbn
moment of inertia of stringer plus sffeotive width for bending in tangential direction
oonstanl in formula for buokling stress of flat panel
ring spauing
?XLmb0r Of rings involved in buckling

.
* “
-. .
i
c
NAOd TN No. 939 .4
n parameter characteristic of wave length in cir- cumferential direction
P axial force in cylinder . I
r radius of cylinder
t thickness of sheet
2w effective width of flat panel
2w' effective width of curved panel
"cr. critical strain in general instability
"curved buckling strain of circular cylinder
Eflat buckling strain of flat panel
Enax observed strain in most highly compressed stringer
Estr strain in stringer
P Poisson's ratio
u compressive load divided by perimeter
TEST SPECIMEN AND TPIST RIG
The test specimen is shown in figure 1. It con- sisted of a circular sheet metal cylinder of 20-inch out- side diameter and 33 s-inch over-all length reinforced */ with 5 equidistant rings of 3/8- by l/8-inch rectangular section and with 16 equidistant longitudinals of 3/8-inch s,euare section. In order to simplify manufacture stringers were attached internally and rings externally to the cyl- indrical sheet, Rings and stringers were connected by l/8-inch round head machine screws. Machine screws of the same size, spaced 0.714 inch apart, secured the sheet to the stringers.
Ring butt splices were arranged alternately to the right and the left of.the top stringer. Segments of the ring stock were used as butt straps extending as far as the adjaaent stringers and bolted to them. Two more

BAOA TN Ho, 939 6
bolts between the stringers'faetened the strap to the ring and the sheet. Rings were made of 24$-T aluminum alloy. Stringers were of 173-T aluminum alloy except in oylinder 110, 13, ,rvhere they were of 24S-T aluminum alloy.
Cylinders SOS. 9, 10, and 11 were manufactured of four sheets each which were attached to one another by lap joSnts along top, bottom, and extreme right and left stringers. In these aylinders the sheets had a nominal thickness of 0.012 inch. Actually this thickness ranged from 0.0119 to 0.0122 inch. The material was 245-T alclad, 811 the other cylinders were eonstruoted of two sheets each weth lap joints along the extreme right and left stringers. The nominal thickness of the sheets for these cylinders was 0.020 Inch, while the actual values varied from 0.0199 to 0.0203 inch. The material was 24%T aluminum alloy,'
.The teat rig is shown schematically in figure 2. The base of the rig consisted of two pairs of 8-fnoh chan- nels 30 inches apart. The end stand, built of ohannel sections, was braced to the base by ties and struts, The loading arm was a tripod, It rested on three ball bear- fngs whioh ?rere free to roll on the supporting table.
The external load was applied by a surew jack which exerted & downward force on the bottom of a rectangular frame suspended from the apex of the tripod -loading arm. The reaction to the force was taken up by a seoond reo- tangular frame pinned to the base of the rig,
A heavy machined steel ring was fitted to each end of the cylinder. Ring No. l. was bolted to the end stand, ring No. 2 to the loading head, which like the end stand was a grid composed of steel channels and angles. The considerable :veight of the loading head v&s balanoed by means of a aounterwefght suspended from an overhead frame by a steel cable guided over sheaves. Two parallel links oonnected the loading arm to the loading he‘ad an4 trans- mitted to the test specimen the couple caused by the ag- plied load. Front and rear views of the test arrangement are presented in figures 3 and 4.
The test speofmen was uonnected to the end rings by means of the stringer grip fittings shown in figure 5, Eaoh fitting was attached'to the ring by two l/2-inch steel bolts. The surfaae of contact between stringer and fitting was serrated, and the pressure exerted by the

1
,
HAOA QN x0. 939 6
bolts was found sufficient to maintain an adequate grip*
Ihe compressive force required for the tests fn sim- ple compression and in combined bending and compression Was applied by means of the compression load bar indicated
. in figure 2 and shown in the photograph of figure 6. The bar was maohined of ohromfum-molybdenum steel. At one end it was attached to the Loqding head, at the other, to the end stand, The latter attaohment was effected by means of a buttress thread and nut. By tightenfng the nut with a large ratchet lever the required oomprsssive force was applied to the test cylinder,
f
i
The compress$ve foroe in the test cylinder was equal to the tensile forts in the load bar. The latter was measured by two BaXdwfn-Southwark 62-4 metaleotrfc strain gages type A-5, cemented to plane surfaces machined at the middle of the load bar, The load applied to the loading arm was measured by the same type of strain gages attached to a load lSnk inserted between the loading arm and the reatangular frame. In all strain meaeuraments the pairs of gages,were connected in series in order to obtain average-direat strain values.
The pairs of gages used for measuring strain in the test oylinders were cemented to the stringers. They were arranged in two eections of the oylinder denoted in fig- ure 2 as sand A and Band 3, respettfvely. At each sec- tion the strain was measured in every other stringer.
Two Baldwin-Southwark SB-4 oontrol boxes were used to obtain simultaneous readings of bending moment and compressive foroe. Switching wtie effected by means Of a tapered brass plug and matching br,ass sockets,, A11 wir- ing was done with rubber insulated single conductor fo, 18 wire& Separata dummy gages were provided for the load link, the csompression load bar, and the stringers.
The Uompression load bar and the load link were cal- ibrated in a Biehle Bras* lever type testing machine,
ANALYSIS AI?? PXSW3SSX.01: OF TCEST RESULTS
Presentation of Test Besults
The results of the tests are presented in the diar : grams of figures 7 to 63+ The diagrams may be subdivided

4
D
MACA II? tiO; 939 7
into four main grOupsI .$n the first, figures 7 to 28, the measured direat strain is plotted aga%nst distance from the horizontal center line of the cylinder. In the seoond group, figures 29 to 34, the direct strain caused by the compression alone is indicated in polar ooordfnates. In the third, figares 35 to 45, the initial strains in the cylinders axe given in sinilar polar form, with the excep- tion of the last dfagram, figure 45 in this group, which presents the variatjon of the initial strain in the axfal direction. Fhe fourth group, figures 46 to 63, shows the variation of the stringer strain with increasing bending momellt~
Linearity of the Stress Distribution in Bending
In the course Of the fdrst pure bending tests of the' present investigation it was noticed that the direct strain measured deviated greatly frOm.the straight-line law usually assumed to prevail in structures subjected to bending, In Order to obtain a better agreement with the assumptions of theory, the loading head was systemafi- tally reinforced and the effset of thess reinforoements on the strain distribution wasobserved. The improvement attained may be juagf3d on the basis of a oomparison of figures 24 to 26 and 7 tb & representing the strain dis- tribution in aylinders 30s. 2 and 6, respectively. In cylinder Bo. 2, although the greater part of the rein- forcements already had been added, the deviations- from linearity are seen to be still excessiveS By oontrast, cglinher HO. 6, which was the first of the final test series, yields a olose agreement with the theoretical as- sumptfons in -@e A band and a satisfactory agreement in the B band, The strain lfnes corresponding to high bend- ing moments are st-ightly cOncave on the aompression side Of the B band.
A review of all the strain diagrams reveals that aa a r=rle the strain curves are straight up to about one- halZf the failing load. Zn the later stages of loading, when buokling of the sheet becomes pronouncea, deviations from linearity appear, especially on the compression side of, th8 cylinder, In most cases these deviations make the aompression side of the strain curves oonvex when the bending moment is accompanied by a hdgh compressive force, and oonaave when bending moments are applfed alone. Bor each cylinder tested in combined bending and compression, a f2ontrol test; in pure 'bend%ng wag run before the nain

test was made+ The results of the control test are shown by a dotted line which in no case deviates appreciably from a straight line.
In order to illustrate more &early the deviations ‘froa linearity, figures 26 to 28 are included, These figures show experimental etrain curves for typical cases of combined bending and oompreeeicn at various stages of loading superimposed upon the theoretical straight lines constructed for the corresponding loads,
The development of a linear strain distribution may be interpreted by the prfnci-ple of least work. A lizear distrfbutfo'n corresponds indee‘d to the least strain energy in a cylinder subjected to pure bending if Sookels law appliee and if the ends of the cylinder are attached t0 Derfscltly rigid bodiesa In nany experfmental setups it may be inconvanfent to provide very rigfd and thus heavy and cumbersome structural arrangements for transmitting the applied forces to the ends of the cylinders. The least work principle then rsqufres that the total strafn energy stored in both the cylinder and the attaching etructural menbers be a minimum, The resulting strain distrtbution may deviate considerably fron linearity in . eucrh casss. Uoreover, the relative rigidity of test specimen and attaching structural elements changes with the type and the nagnitude of the loading. Ooneequsntly, ideal straight-line strain curves are n,ot lflcely to be ob- tained in exgerinenfe oarried out with a sfngle test rig under var%ous conditions of loading, unless very heavy attaching structural elements are used.
The deria%fons from the straight-line law obtained in the present experinents were considered permissible in view of the results of the calculations preeented under The Effeot of Eonlinear Direct Stress Distribution in reference 1, However, the conclusion is drawn from the foregofng investigations that a careful survey of the strain dfetributfon fn a monocoque structure subjected to bending is a necessary preliminary to the use of a new test-rig or of a new type of test specimen,
It is noted that the conpreseius fvrcea listed in the diagrams for tests of bendfng,conbfned with uonpreesion are nVtlina1 values. The exact values at the various stages of loading are listed in table I,

NACA TPJ No. 939 9
Uniformity of :'che Strain Distribution in Compression
After the first suoceeeful tests in pure bending were aeconpliehed, the testing of the cylinders in com- hined bendi-ng and compression was undertaken, TrSal com- preesivi tests applied to cylinder I?o. 6 resulted in great deviations from a uniform strain dietributdon. This may be seen from f'9gpre 34, The n?agnffude of the dsviatsons was unexpected eince the satisfactory strain curves obtained in bending had been 2nterpreted as a proof. of an adequate rigiility of the loading rfg for all types of loading, The fallacy of this conclusion becaiae apparent when the inaorporation in the test rig of addf- tional di?ferently arranged stiffening elements and a eystenatic application of shims, resulted in strain durvee 8ufficZently unlforn? for praotdoal purposes. Bppar ently the strain energy babance discussed In the preceding ar- ticle changes materially from one loading condition to the other,
. -
f
As a preliminary of the sombinsd bending and compre'e- sfon tests a simple oompreesion check test was run with each of the subsequent cylinders except X0. 13* The re- sults of the check rune are shown in figures 29 to 33, and the naxin;un deviations from the uniformity of the . strain are listed in table II, The Ijaxinium deviation from the average strain was 8.17 percent for the four cylinders having the thick sheet, l.6c31 percent for the two having the thin sheet.
Initfal Strains
In the simple bending and the combined bending and 'conyressfon tests it was observed that buckling of the sheet covering almost invariably started near stringer PO. 7, although theoretically the maximum compressive strain should have occurred at stringer 170. 9. The pos- sibility that this phsnorsenon had been oaused by in5tial stresses was investigated in a series of systematic ex- seriments. The results Obtained in the experiments car- ried out on cylinder Xo. 13 are presented in figures 40 to 44.
T%rst the strain gagee were cenented to the stringers before any of the bolts which served for attaching test eBecfmen, end rings, and test rig were tightened. With tile cylinder resting on the floor, strain gage readings

were Iilade to serve a9 zero readings, IText the bolts in the stringer grip fittings of end ring So, L were tfght- ened and a nsw set of strain readings was taken. The strains caloulated from these readings are shown in fig- ure 40, !Shey are predominately tensile, the maximum val- ue being 2.26 X 10e4, In the following steps the oylin- der was fastened to the end stand, the stringer grip fit- tfngs tightened at the other end of the oylfnder, and finally the loading head was bolted to end ring S?o, 2. After eaoh of these steps the strains were measured and recorded. lhey are shown in figures 41 to 43. The dla- grams reveal the characteristic features and the relative importance of the strains caused by eabh operation. Pig- ure 44 presents the.total inittal strain in cylinder 50. 13.
Figures 35 to 39 show the strains caused in cyLinder No. 16 by a simdlar sequence of operations in which, ~CW- ever, the order of the first two steps was reversed. Be- cause of this change, and possibly because of the differ- ence in the thickness of tize sheet, the effect of the in- dividual operations daffered from that observed in the experiments carried out with cylinder So, 13, Beverthe- 10S6, the curves representing the total initial strains in the two cylinders show marked resemblance. The same ig true of the total Lnitial strain Gurves of cylinders - 30s. 8 and 9, which are not reproduced in thfs report,
5he total initial strain distribution corresponds basically to a warping group with a vanishing resultant force and a vanishing moment about any axis. The strains caused by an operation undertaken at one end ring de- crease rapidly fn the direction of the other end r%ng, as may be se6n from figure 45, ?his is in agreement with Saint Tenant's principle. . It should be noted, however, that the distance at whioh the effeot of a disturbance beoomes negligibly small is likely to be equal to two Or three times the diameter of the cylinder..
In the initial strain measurements undertaken, the greatest tensile strains occurred generally at stringers 80s. 1 and 9, and uomparatively Zarge compressive strain8
.at stringers Nos. 7 and 13, The maximum total initial stress was of the order of '3000 pounds per square inch. Xoreover, the curves of dfstribution of strain fn com- pression (figs. 29 to 33) also ind%cate Borne excess over the average of compressive strain* These findings com- p&e'~eI.y explain why the first buckles in the sheet
,

NACA TN No. 939 11
appeared near stringer No. 7 rather than near stringer PO. 9. On this basis the development of the inward bulge along stringer No. 7 near end ring NO. 1 in come of the tests also can be understood. It does not appear likely, however, that the initial stress oould have appreciably influenced the magnitude of the critical stress in inward bulge type buokling. This opinion is based on the fact that there was no systematic variation in the buckling stress to correspond with changes in the location Of the inward bulge. It appears advisable, however, ta pay more attention in the future to initial stresses in experimental investigations on semimonoooque cylinders than was usual in the past.
The Bucklfng of the Sheet covering
The d.eterminaLion of the effective width of sheet, 'needed in the comparis0n of experiment with the theory of general instability, depends on a oorrect estimate of the strain (or of the stress) at whfah the sheet covering buckles. In the calculation of the critical stress f c cr of the ourved panels of-sheet 8edshawls formula was used;
f c cr = Cfflati2) + (11
In this equation fflat stands for the critical stress of the oorresponding flat sheet. Its value is given by the formula
fflat = k _ n% sz(r - Pa)
(t/a? (2)
where t is the thickness of the sheet, d the width of the panel measured along the perimeter of the oylinder, E Youngts modulus, and 11 Poiss0n's ratio. The value of k depends upon the length-to-width ratio of the panel and upon the edge conditions. In the test speci- mens the length-,to-width ratio was high because of the absence of intermediate attachment between rings and sheet. If the difference in the elastie restraint ex-. erted by the stringers upon the thick*and the thin sheet is taken into account, it appears reasonable to ahooso k= 4 for the thick and k I 5 for the thin sheet.

X$0,4 TN No. 939 12
Equation (2) then gives 987 and 445 pounds per so_uare fnch for the critical stress of the thick- and the thin-walled specimenrr, respectively.
The buckling stress of the circular cylindrical sheet was denoted fcurved in eo.uation (1). It can best be calculated from DbnnellJs formula:
f = 0.6E (t/r) 1 r 1.7 X 10%/t~"
curved 1 + 0.004 (E/Fcyl
where r is the radius of the cylinder and Fey the I ooapressLve yield-point stress of the material, Plquation (3) gives fcurped * 5890 pounds per square inch for speci- mens having the thick sheet, and fcurved = 3250 pounds per square inch for those having the thin sheet, For the critical stress of the curved panels equation (1) then gives :
fc or = 6400 pounds per sware inch (for the 0.02%in.-thick sheet), and
fe or = 3&o pounds per square inch (for the 0.012~in.&hick sheet}.
In the course of-the experiments these theoretical values were checked in four ways, First, the appearance of the first buckle was visually observed and the strain at its location was determined from the strain-gage raad- ings. Secondly, use was made of the strain against bend- . ing moment curves drawn for stringer Wo, 9. The cmrves are straight until the sheet begins to buckle. Conse- auently the first devfations.from the initial 61Op8 mark <he bending moment at which the sheet buckles. A third indication of the critical strain'of the sheet aovering was found in plots of the observed shiftof the neutral axis in bending, since there oannot‘be any s'lift until the sheet buckles, Finally, the slope of the strain aurves of figures 7 to 28 was determined at the neutral axis and plotted against the bending moment. The slope of these curves alsa changes when the sheet begins to buokle,
Ihe data obtained by the methods Just outlfned are aollected in table III. Correctfon of the data for ifii’:.
tial strain was hot co?lsidered warranted for the purposes of t8e grssent investigation. In ep9te of the aonsiderable

scatter of the values one conclusion, at least, is inevi- table : the sheet buckled, at imch higher strains when the s>ectmen was acted upon by a bending aoment than in t’ne case when the load was pure c0ngreseion. This pbenonenon had been noted by Lundquist in reference 2, 3ut is drsrec- gardefi as a rule in the stress calculation 0I" semimono- coaues. ys;s that
It trould be desirable to develop methods Of all~l- ta’ke this effect into account. Tfith no such
i2etliOd yet available, however, a constant value of the buckling strain all along the circu.nfereEce of the cgliz- der ?ras assurred for the subseauent calculationsr Fron tile conparison of theory and experinent the following r0und numbers were chosen for use in later analysis:
cflat = 1 x 10⁻⁴ (for the O,02O-in.-t?~ic% sheet)
‘flat = 0.5 X lb’” (for the O,OlZ-in.-thick sheet 1 (4)
E curved = 6 x ur4 (f0T the Oc020-in,-thick skeet}
ecurved = 3 x 1o-4 (for the 0.012-in,-thick sheet)
Force and iI0ner-t EquiLibriun
3;n order to obtain an independent check 0f the ac- curacy Of the load and strain measurenent, as well as Of the methods used in the analysis, the applied forces and moraents were coillpared with the force and moment resultants Of the measured internal direct stresses. in this com- P aris on EioOkets law was assuned valid, and the n~dulus bf elasticity was taken as 10.5 x lo6 pounds Ter square 5zch for both s’neet and stringers over the whole range of strains neasured. For the stringers in which the strain had uot Seer? neasured it was determined by inlerpolati0n. The effective width aw 1 Of the curved panels >!aF; taken as the total width ll’rzerever the panel was i,~ a r,onbucX!.ed state. In the buckled state it was calculated from the follo??ing formulas:
where EStr is the strain ir? the stringer. These equa- tions are a-uotcd fr0n referelice S, The values given in

*
.
.
.
.
.
in equations (4) were used for t-he buckling strains.
Calculated values of forces and moments are listed ir. table IT for a number of loading conditions and for various test cyiinders. The agreement is good between the external and the internal moment, especially under small and moderate loads, For the higher stages of load- ing t.he interzal moment slightly exceeds the external mO- ment. The agreement between the internal and the exter- nal compressive force is also good in the low load range, bUr; the values deviate considerably for the higher stages of loading. The discrepancies can be explained by the reduction in the value of the modulus of elasticity 0f the material.
It was shown in reference 4 that the tangent modulus of 24S-T extruded sections begins to decrease at stresses ' between 22,000 and 30,OCO pounds per sauare inch in con- pression, while its value remains constant up to a range from 38,000 to 47,000 pounds per square inch in tension. The value 0f the tangent modulus of alclad 24S-T exoeri- ences a drop even at a stress of 10,000 pounds per square inch. GvaluatiOn of the nure comDression tests made with the monocooue gations at-the
test cylinders during the present investi- Polytechnic institute of Brooklyn also
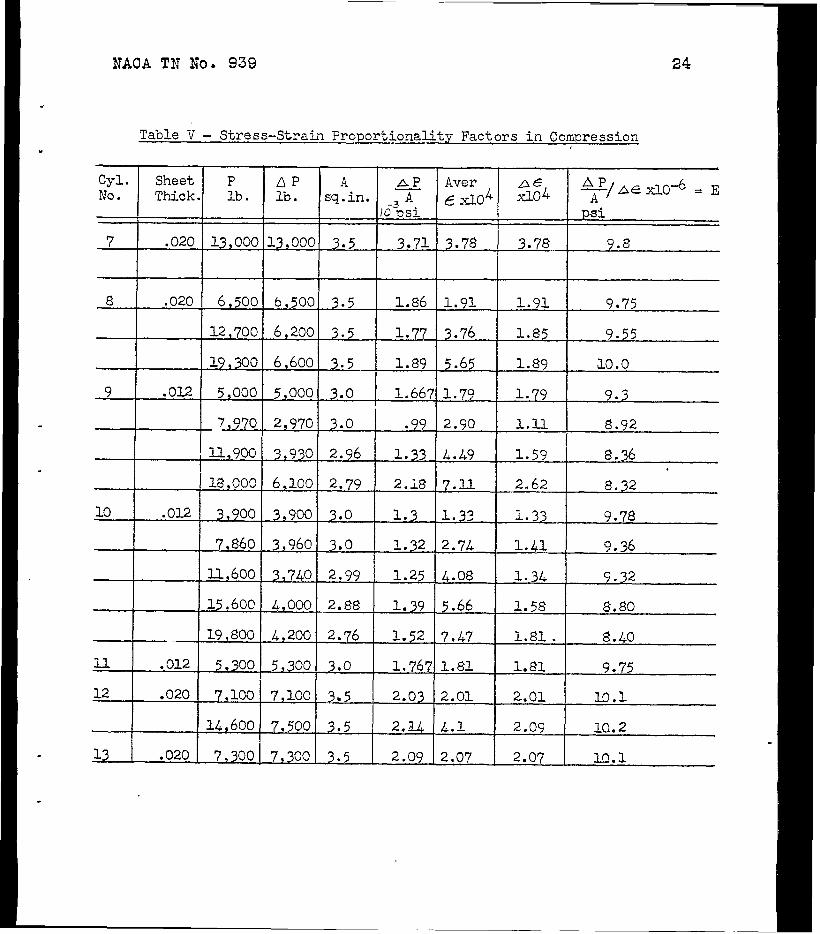
showed a decrease in the-apparent modulus l:ith increasing load, as may be seen from the data included in table Y.
Since exact values of the variation of the modulus with stress were not available for the sheet and the sec- tions used in the esverincnts, the force and moment ea-ui- librfum could not be determined accurately. in one case, however, the calculations were repeated with the assuo?p- tj.onof 3~ 13.5 X 20" zounds per square inch fcr ten- sion and for compression below lO,OOO-pounds-per-square- inch stress, and of X= 9.5 x lo6 pounds per square inch for compression above 10,303-Doands-per-square-inch stress. This slight change sufficed tb reduce the-original dis- crepancy Of 45.6 percent in the compressive force to 12.2 percent. I'he corresponding change in the value of the mo- mezlt was unimportant dicates that reason for the discripancies noted. Fkip effect of such a sl i<ght variation is pronounced only in the case of the. resultant force which is the small difference of two large . . A. quan;; ,kles - namely, the resuitar,t forces on the tension and the compression sides of the specimen.

15
Variation of the Strain in the Stringers
Figures 46 to 57 give typical examples of the varia- tion with bendln- Ej moment of the strain in the three most highly stresseii stringers on the tenzion and on the com- pression sides. The curves shown represent data obtained with cylinders 270s. 7, 9, and 10, corrected for the weight of the Loading arm. In figures 58 to 63 measured values of the compressive stragn in stringer ITo. 9 are compared with the theoretical stringer strain variation curves* This comparison is of importance since in the theory of the inylard bulge type bucklin g a theoretical stringer strain variation iS assumed.
The tLeoretica1 curves were determined as follows: For different assumed values of the shift of the neutral axis the resultant bending moment was calculated and g'otted agarnst the compressive strain in stringer Wo+ 9. In a secod diagram the resultent compressive force was plotted against the compressive strain in stringer 170. 9 for the same values of the parameter "neutral axis shift." From these tvr0 diagrams the variation of the compressive strain in stringer So, 9 with increasir,g bending moment was determined and plotted for several constant values Of the congrsssiae force. Since at each stage of loading the cectroid of the effective material of the cross sec- tion. of the specimen is shifted a different distance from the geometrcc center of the c;Jlinder while the compressive load is allYrays appliec at the geometric center, an addi- tional bending moment arFses the effect of which must -oe taken into account before the theoretical curves can be compareti Witlh the experimental values, Figures 58 to 63 present curves which have been correct'ea for this effect.
in general, the agreement between theory and exneri- ment can be considered good. In some cases at high oend- ing moments the experimental values of the strain exceed those predicted by theory, This Ciiscrepancy is probably caused by the variation of the mociuSus.
Gezieral instability
The correlation of experiment with the theory of the inward bulge t;-pe bucklL2g of monocoque cylinriers, which is the ultimate objective of these investigations, can best be carried out on the basis of the strains in the most highly compressed stringer at the moment of general

.
.
instability, The formula for the maximum compressive strain at collapse 5' derived from equation (24) of reference 1 r:rith the assumption of the same modulus of elasticity for rings and stringers, is as follc~s:
- I ECr
=,2 w- J a 772 J stA _ fo.9/n2i ?d 31 -4 IT2
(6) St?? B z str
nh e r e II is a parameter, II, the ring spacing, .4str the cross-sectional area of stringer plus effective width, I r the moment of inertia of ring plus effective widtk, v the con:ressive load divided by the perimeter of the cylinder, and Istr is defined by the equation
I str = I str r + (5/8)(l/n2> :,tr t
where Istr 'i and Istr t are the moments of inertia of the stringer plus effective width for radial and ten- gential bending, respectively. Tbe effective lwidth of the sheet acting with the ring was assumed to be equal t0 the width of the ring.
The forces at collapse in the load link and in the compression lOad bar were accurately known since they were continuously observed with the aid of the two COT?- troL boxes while the load was applied. in many cases the strains in the stringers lrere also measured close to the load at which general instability occurred, Some test specimens, however, ColZapsed before readings could be i- ,a:k-en in the proximity of the buc9ling load. The strains Just -prior to instability were nat significant, 'noY:ever, since they were obviously influenced by the developing bulge. In many cylinders wit3 the imminent approach of instability the maximum camp ressive strain suddenly in- creased in one Sand, and decreased in the ot'aer. Secause of this the fcllO!uing procedure was used to determine sig- nificant values of the maximum compressive strain at col- lapse:
Strirger strain variatF03 curves, as Obtained for stringer To. 9 in bands A and 3, were superimposed. The general trend, established prior to the appearance of irregularities, of the curve representing the average of

WAC&4 TX xc?. 9 39 17
the valuea in bands B and B was extrapolated up to the COflapsing load. TSe strain at collapse obtained by this procedure we.s considered the experimental critical strain.
Table VI presents the collapsing leads as measured, and as corrected for the Tveight of the loac?ing asrs: and for the effect of the shift of the centroid of the effective material from the geometric center of the cylin&er, Val- uee of the. experimental critical strain are listed in table VII.
Zrom these maximun conpressive strai3s the value of the parameter n was calculated in accordance with the suggestions of reference 3 and satisfying ea_uation (6) Of this report. The results are listed in table VIII, It may he seen from the table that n varies but little, its maximum value being 3.21, the average 2,935, and the minimum 2.66. The gossihility of a variation of n with connressive force Was anticipated in refererce 3 but any sysiematic Variation is lacking in table fiiII, On the other hand, equatios (6) appears to give the influence of the compressive load correctly.
It should be noted that the average value obtained for A is 15 percent smaller than cauld be predicted from figure 10 of raferencs 3, which is based on the GALCIT experiments, The reason for this deviation is un- known, There was, however, a slight difference in the PTay the specimens were constructed. In the GAXIT cylin- ders the sheet Was bolted to the rings and the strir,gers; while in the cylinders used in the present investigation the sheet was attached to the stringers alone.
in reference 3 it was suggested that the critical strain iii general insta3ility could be calculated approx- imately by neglecting the effective width of the sheet, The accuracy of this suggestion was checked by calculat- ing II from ea:dation (6) using values of the moments Of inertia of stringers and rings alone. The values so ob- tained are also presented in table VIiL, There is a syste'matic deviation between the accurate and the approx- imate values. The average deviation is 16 percent. Car,- s equently in the present case, the use of the approximate procedure suggested would result in underestimating the critical strain by 26 percent.
T5e general appearance of the.distorted shape after bUGk1j.q is ShO;Jn in the photographs of figures 64 t0 74,

The. pictures ai;ree vrell with the description of the inward bulge girren in the istroduction. The values of the param- eters n and m characteristic of the bulge could not be determined accurately Secause the bulge did not termi- nate sharply. The approximate values are listed in table VIII, together with the theoretical values. The average experimental *value of the number xl of rings involved in Suckling Was 3, while theory predicted about 4. The ob- served mean value of n was near 5 as compared -with the theoretical average of 3.
The series of tests conducted in the Aircraft Structures za3oratory of the Polytechnic Institute of Brooklyn with reinforced nonocoque cylinders in combined jending and compression leads to the followizlg conclu- sions:
1. The pattern of distortion at 3uckling as realized in the actual tests corresponds in essential features to the deflected shape assumed iti the theory.
2. The experimentally established strains in the most highly compressed stringer at buckling are consist- ent with the values obtained from the theoretical rela- tionship:
2 a lT2 f
e/xx c cr =n -- _ (0.9/n2) ud
Ll -&str r2 A 7 -str"
3. x0 systematic variation was found of the parame- ter n with compressive force,
I: . The average value of the parameter n was 2.935 when calculated from the formula quoted in conclusion 2 usir.g experimental values of the critical strain,
5. The data collected in the course of the cxperi- ments afforded fairly close corroboration of the theories Of buckling of curved panels.
6. It was est a'olished that the elastic properties of the test rig and -Ihe manner of attachment of the test

NACA TX 20. 939 3.9
specislesls exerted a considerable influence on the nature of the stress distribution and 0% the initial strains in the specimen.
Polytechnic Institute of =Srooklyr, Brooklyn, ET. Y,, Z'ebruary 1944,
1. Hoff, 1:. J., and Xlein, Bertran: The Isvrard Bulge Type BuckLir-g of Xonacoque Cylinders. L - Calculation of the Xffect ugon the Buckling Stress of a Compressive Farce, a Xonlinear Direct Stress Distribution, and a Shear Force. NACA TX No, 938, 1944.
2. Lundquist, &gene E,: StFellgth Tests of Thin-Yalled Duralunin Cylinders in Pure Bending. ITACA TIT iTo l 479, 1933.
3, Iioff, N. J,: General Instability of Xonocoque Cyl- inders. Jour. Aero. Sci., vol, 30, -10, 4, April 1943, -0-o. -- 105-114,. 130,
0 -. Tesplin, 2. L,, Zartmann, E. C,, and Paul, D, A.: Typical Tensile and Consressive Stress-Strain Curuez fer dluninun Xllog 24,5-T, Alclad 24S-T, 24%RT, and Alclad 24%ET Products. Tech. Paper EC. 6, dluminrrn Res. Lab,, dluninuil! Co. of Am,, 1942.

NACA TN 170. 939
I
t f
i : I
1 i

NACA TN No. 939 21
Table II - &&mum Deviation in Compression
Test Cyl. Stage Load Stringer. Avera e Strain f
Maximum Detia- No. No. &lO'(lb./sq.in.) tion Percentage
7 1 &00 2% 3.79 c8.17 1 13,000 B-5 3.76 744
8 1 6,500 A-5 1.93 -7:25 1 6,500 B-l 1.89 +6.35 2 12,700 A-5 3.76 -5.33 2 12,700 B-5 b ~4.26 3 19,300 A-5 5.65 -5.30 3 19,300 B-9 5.65 -5.67
9 1 5,003 A-15 1.83 c15.31 1 5,000 El3 1.76 +u.93 2 7,970 A-9 2.95 -10.85 2 7,970 , B-13 2.85 c12.26 3 11,900 A-9 4.52 -13.72 3 'll,900 B-13 4,115 +l2.36 4 18,ooO A-9 7.18 -11.13 4 18,ooO Et-9 7.04 al.93
10 1 3,900 A-u. 1.33 +9.03 .
1 7,900 B-15 1.33 - c 3 76 2 7,860 A-11 2.77 +9.03 2 '7,860 B-11 2.72 +4.78 3 11,600 A-15 4.07 -3-2.55 3 11,600 13-u. 4.08 +7.60 I 15,600 A-7 5.63 d2.43 4 ~, IL5*600 p4.l 5.69 c8.87 5 19,800 A-7 7.43 +9.96 5 19,800 B-ll 7.52 +7.85
32 1 7,100 A-1 2,03 t4.92 1 7,100 B-5 2.00 -4.50 1 7,100 B-13 2,Ou c4.50 2 14,690 A-ll . +3.86 2 I-49600 B-9 4.05 -5,68

NACA TN No. 939
1 i ,
1
I
i 1
i .i

.
NACA TN No. 939 24
c
Table V - Stress-Strain Proportionality Factors in Compression
Cyl. Sheet P LIP A AP Aver No . Thick. lb. lb. sq.in. A =E
/03psi e A04 %4
psi
7 .020 13,000 13,000 3.5 3.71 3.78 3.78 9.8
8 .020 6,500 6,500 3.5 1.86 1.91 1.91 9.75
12,700 6,200 3.5 1.77 3.76 1.85 9.55
19,300 6,600 3.5 1.89 5.65 1.89 LO.0
9 .Ol2 5,000 5,000 3.0 1.667 1.79 1.79 9.3
7,970 2,970 3.0 .99 2.90 l.U 8.92
11,900 3,930 2.96 1.33 4.49 1.59 %.ys
18,000 6,100 2.79 2.B 7.11 2.62 8.32
10 .0X2 3,900 3,900 3.0 1.3 1.33 1.33 9.78
7,860 3,960 3.0 1.32 2.74 1.41 9.36
U,600 3,740 2.99 1.25 4.08 1.34 9.32
l5,600 4,000 2.88 1.39 5.66 1.58 8.80
19,800 4,200 2.76 1.52 7.47 1.81. 8.40
ll .012 5,300 5,300 3.0 1.767 1.81 1.81 9.75
12 .020 7,100 7,100 3.5 2.03 2.01 2.01 lo.1
14,600 7,500 3.5 2.L.4 4.1 2.09 10.2
13 .020 7,300 7,300 3.5 2.09 2.07 2.07 ID.3

NACA TIU' No. 939
I-
I-
I I-
:: ! 1 i > . . L
? 8 , ! : I . !

NACA TN Ilo. 939
VII - Zxperimental Critical Strains
Test Cyl. No .
4
6
A--
8
9 10
ll
. 12
13
.020T~-- B&C 16.6 27.2 15.85 15.76 24.38 31.2 3
,020 B&C 25.4 1'::, 28.6
+CB - (Pure Bending) B & C - (Bending and Compression Combined)
Table VIII.- Experimentally Determined Values of Parameters n and m
Cyl. No. tl P Observed 53 n m forn2%0 n
Observed in. lb. m
5 .020 0 21.83 2.66 4.93 3.28
6 ! .020 0 25.68 2.99 4.05 3.56 4 3
7 .02c 13,000 24.0 2.89 4.32 3.44 5.33 3
8 ! .020 I-4,600 23.28 2.84 4.45 3.38 6.4 3
' 9 .012 13,900 21.7 2.99 3.82 3.27 4 3
10 .012 l4,200 22.4 3.05 3.70 3.32 6.4 2 s
Ill .012 0 20.86 2.89 4.00 3.2 4.25 4
12 .020 7,400 24.38 2.90 4.27 3.48 I 5.33 3
1.3 .020 7,250 28.6 I 3.21 I 3.60 3.76 4.57 3

NACA TN NO. 939

HACA TX X0. 939 Figs. 1,2
- N-
LOADING HEAD LOADING ARM
SECTION A-A
UPPORTING TABLE
72” --I LOAD BAR
FIG.2. DIAGRAM OF TEST SET-UP.

NACA TN No. 939
Figure 3. - Forward view of test rig.

IiACA TN No. 939
Figure 4. - Rem- uiew of test rig.
Fig. Y

NACA TN No. 939
Figure 5. - Stringer grip fittings.

NACA TN No. 939
Fitwe 6. - Compress ion bar ond adjustment end.

HACA TN No. 939 Fi@. 7,8
--
19-l S3H3NI ‘3NIl t131N33 “WOW 33NVlSlCl
ln 0
(1 block = 10 divisions on l/32" Arch. scele)

NACA TN No. 939 Figs. O,lO
0 In S3H3NI ‘3Nil ki3dir) WOW 33NVISIQ
Y) 0
(1 block = 10/32n)
S3H3NI ‘3Nl-l M31N33 BObA 32NV.lSla
a
I

NAGA TN X0. 939
(1 blosk a: 10/32")
OX
-----
cvi TJ
i ?3H3kI ‘3Nll kI31N33 %OkU 33NVlSlO

NACA TN N 0. 939 Figs. 13,14
I
I I I I
In S3H3NI ’ 3Nll dfi3 YlOW 33NWlSKl
(1 block = 10/32")
0 tn S3H3NI ‘3NI-l U31233 WOtlcl 33NV.lS10
0 0
: : I ;QI I , x
+I
co1 f(
CJ +
I I
L

YAC?. TN No. 939 Fig-E. X,16
. I I I I I I I I I I I I I I
In S3H3NI ‘3NI7 t131N33 %I44 33NVISIa
Ln 0
(1 'block = 10/32n)
m S3H3NI ‘3NIl tJ3U%33 WOtlzl 33NVISlCl
M 0

NACA TN ?io. 939 Figs. 17,18 ti
000 r?nn UlZ I j I 19
2 z L___ .-_ -~-- -- + - I ti tri
i 0 KJ 0,ii
(1 block = i0/3tY)

(1 block = 10/32")
2 I I I i I I I
I , Y, , I , I I
t 11

_ - ._ .- ^_^ NACA ‘1.X No. Y5Y
- n, m + In In
c
%H3NI ‘IiN ti31N33 %Otr, 33NVISla
% cj ii
0
(1 block = 10/52")
%H3NI ‘3NIl kl31N33 “WOW 33NVISla Lo 0 ii

I ‘I
I
.
N&IA TN No. :939 Fige. 23,28
0 %H3NI ‘3Nll t131N33 %OtlA 33NV.LSlCI 0 -
(1 block = 10/32")
’ ’ ’ I -’ iIl7
0 u, S3H3NI ‘3NIl tr&r, WOkId 33NVISla
In 0

NACA TN Ho. 939 Figt. 25,26
, I I I I I I I I I I 1
m S3H3NI ‘3Nll &333 WOtlzl 33NWlSlCl
In 0
(1 block =: 10/32")
0 In 0 Lo S3H3NI ‘3Nl-l U3LN33 RObId 33NVISla

‘rACA TY Yo .* . . 939 Figs. g;,z,j
I rl ;” m
+ -I-
0 %3H3NI ‘3NI-l kl31N33 %OW 33NVlSla In 0

HACA TH lo. 939

NACA TN NO. 939
r
31,52

HACA TH NO. 939 Figs. 33,34

NACA TN No. 939 Figs. 35,36
ti ii
0 m

~~ACA TN NO. 939 Pigs. 37,3a

NACA TH Ho.

NACA TN No. 939

m - d z*
.
l

%4CA TX No. 939 Fig. 45
-~
--
-.
.-
.-
- -_ A-”
I 1
I
! I i I i
--+.- I I
i I iM I I”
i 1 t i
-_ I-
I , i V 1-i 0
i

NAGA TN No.
8 0
81 ‘NI ClNVSilOHl ‘IN3WOYI
Figs. 46,47
\I i i- I IF Y I I I :a
i -‘lo d 0 (o-
i-x z d-t-
iz
pg
0 i
81 ‘NI ONVSflOHI ‘lN3WOW

NACA TN No. 939 Figs. 40,49
+e 0
*- +x
d I
81 ‘Nl ONVSrlOHl ‘IN3CYOOY
I31 ‘NI ClNVSflOHl ‘INiWOb’d

NACA TN No. 939
131 ‘NI ONVSflOHl ‘lN3WOW
Figs.
I I I I I I 0
z 8 9
iz 0
8-I ‘NI aN\ISf-IOHl ‘lN3WOW

NACA TN NO. 939
l----J---L---- l 1 B 0
gl ‘NI ONWSflOHI ‘lN3WOb’t
I \ I Q) + ro & a
t- Ii= I \I I I I f
r’C Fi$ 52,53
I I I I I I
I QD I I 8
81 ‘NI ONWSnOHl ‘lN3WOW

t * \
81 ‘NI ONVSflOHL ‘IN3WOb4
0
8 5 is 0
Fige. 54,55
81 ‘NI ClNVSflOHl lN3b’dOW

NACA TN NO. 939
, I I tz 0
61 ‘NI ClNVSnOt-41 ‘lN3LnlOW
, / I I
0 i? 8 8 0
c\I
9 I
CD
cd T
0 +
W +
W +-t
0 b-
Figs. 56,57
87 ‘Nl aNWSnOH1 ‘lN3WOW

NACA TN No. 939 Figs. 58 4001 I I I I I I I I I I I I I I I
t
I I I I I I I I I I I I I I (--I’-
\
m 300. -I CYL. NO.5
2
is 3 2 200
z c
5
: r 100
0 0 -2 -4 -6 -8 -10 -12 -14 -16 -18 -20 -22 -24 -26 -28
STRAIN x IO4
FIG. 58.-MAXIMUM COMPRESSIVE STRINGER STRAIN VARIATION. COMPRESSIVE FORCE P = 0 LB SHEET THICKNESS t = .020 IN.
THEORETICAL CYLINDER NO. 5
II ” 6
/’
0.. BAND A X BAND B q . . ’ A A.. ” B
0 -2 -4 -6 -8 -IO -12 -14 -16 -18 -20 STRAIN X IO4
FIG. 59.-MAXIMUM COMPRESSIVE STRINGER STRAIN VARIATION.
COMPRESSIVE FORCE P = 0 SHEET THICKNESS t = .Ol2 IN.
THEORETICAL
CYLINDER NO. I I 0 BAND A X BAND B

,
15
t
0 -2 -4 -6 -8 -10 -12 -14 -16 -18 -20 -22 -24 -26 -28 -30 -32 STRAIN X IO4
FIG. 60.-MAXIMUM COMPRESSIVE STRINGER STRAIN VARIATION. COMPRESSIVE FORCE p=7,250 LB SHEET THICKNESS t= -020 IN.
THEORETICAL CYLINDER NO. I2
: BAND A A BAND B
” ” 13 “AX “B 300
CYL. NO.10
A-i U-U! IMCRI / I ? CYL. NO.9 _
/ _ /-
z’ 200
4 2 0
z z
k- too. 5
%
0 0 -2 -4 -6 -8 -10 -12 -14 -16 -18 -20 -22 -24 -26
STRAIN X i04
FIG. 61.- MAXIMUM COMPRESSIVE STRINGER STRAIN VARIATION.
COMPRESSIVE FORCE P = 14.000 LB SHEET THICKNESS t = .012 IN.
THEORETICAL
CYLINDER NO 9 - 0 BAND A X ..BAND B I/ . IO - 0 q A y A. “..’ B

.
NACA TN No. 939 Figs. 62 ?--2
300----------
0
200
.
IOO-
0 0 -2 -4 -6 -8 -10 -12 -14 -16 -18 -20 -22 -24 -26 -28 -30
STRAIN X IO4
FIG. 62.- MAXIMUM COMPRESSIVE STRINGER STRAIN VARIATION.
COMPRESSIVE FORCE = 14.500 LB SHEET THICKNESS = ,020 IN
THEORETICAL
CYLINDER NO. 8 0 BAND A X BAND B
-I-
0 -2 -4 -6 -8 -10 -12 -14 -16 -18 -20 -22 -24 -26
STRAIN x IO4
FIG. 63.- MAXIMUM COMPRESSIVE STRINGER STRAIN VARIATION.
COMPRESSIVE FORCE p = 17,000 LB SHEET THICKNESS t q -020 IN.
THEORETICAL
CYLINDER NO. 7 0 BAND A X BAND B

NACA TN NO. 939 Fig. 64
. 4 Qo
. 9

NACA TN No. 939 Fig. 65

Fig. 66 NACA TN No. 939

NACA TN No. 939
.
8
Fig. 67

NACA TN No. 939
c
.
L Q) 2 4
-
=:
c

NACA TN HO. 939 Fig. 69

c
t
t!ACA TN No. 939 Fig. 70
Y Y

NACA TN No. 939 Fig. 71

Fig. 72
NACA TH NO. 939

NACA TN No. 939

HACA TN No. 939 Fig. 74
m Y