NASA/ARMY/BELL XV-15 TILTROTOR LOW-NOISE TERMINAL AREA OPERATIONS · NASA/ARMY/BELL XV-15 TILTROTOR...
23
NASA/ARMY/BELL XV-15 TILTROTOR LOW-NOISE TERMINAL AREA OPERATIONS FLIGHT RESEARCH PROGRAM Bryan D. Edwards Principal Engineer, Acoustics Bell Helicopter Textron, Inc., Fort Worth, Texas bedwards2(_bellhelicopter.textron.com David A. Conner Aerospace Engineer, Aeroflightdynamics Directorate (AMRDEC) U.S. Army Aviationa nd Missile Command, Langley Research Center, Hampton, Virginia d.a.conner(_larc.nasa.gov William A Decker Aeronautical Engineer Flight Control and Cockpit Integration Branch Army/NASA Rotorcraft Division NASA Ames Research Center, Moffett Field, California [email protected], gov Michael A. Marcolini Head, Advanced Measurement and Diagnostics Branch NASA Langley Research Center, Hampton, Virginia m.a. marcolini(il_larc.nasa, gov Peter D. Klein Chief, Advanced Systems Development Bell Helicopter Textron Inc., Fort Worth, Texas [email protected] ABSTRACT To evaluate the noise reduction potential for tiltrotor aircraft, a series of three XV-15 acoustic flight tests were conducted over a five-year period by a NASA/Army/Bell Helicopter team. Lower hemispherical noise characteristics for a wide range of steady-state terminal area type operating conditions were measured during the Phase 1 test and indicated that the takeoff and level flight conditions were not significant con- tributors to the total noise of tiltrotor operations. Phase 1 results were also used to design low-noise approach profiles that were tested later during the Phase 2 and Phase 3 tests. These latter phases used large area microphone arrays to directly measure ground noise footprints. Approach profiles emphasized noise reduction while maintaining handling qualities sufficient for tiltrotor commercial passenger ride comfort and flight safety under Instrument Flight Rules (IFR) conditions. This paper will discuss the weather, air- craft, tracking, guidance, and acoustic instrumentation sys- tems, as well as the approach profile design philosophy, and the overall test program philosophy. Acoustic results are presented to document the variation in tiltrotor noise due to changes in operating condition, indicating the potential for significant noise reduction using the unique tiltrotor capabil- ity of nacelle tilt. Recommendations are made for a final Presented at the Tiltrotor/Runway Independent Aircraft Technology and Applications Specialists' Meeting of the American Helicopter Society, Arlington, Texas, March 20 21, 2001. This paper is declared a work of the U.S. Government and is not subject to copyright protection in the United States. XV-15 test to define the acoustic benefits of the automated approach capability which has recently been added to this testbed aircraft. INTRODUCTION Many U.S. airports are rapidly reaching their saturation point with regard to the number of daily aircraft operations permitted. Commuter aircraft, flying fairly short routes with relatively few passengers, make up a significant portion of the total airport operations at a large number of these air- ports, thus significantly limiting the total number of passen- gers that can use those airports each day (Ref. 1). Tiltrotor aircraft, with their unique capability to take off and land vertically while still flying like an airplane during cruise, provide a potential alternate means of transportation that could link major cities, thus alleviating some of the demand on airports. Research on tiltrotor aircraft has been con- ducted for many years using such vehicles as the XV-3 and the XV--15, among others. More recently, the Navy has begun procurement of the V-22 Osprey to utilize the capa- bilities of the tiltrotor for military applications. However, noise generated by the large tiltrotor aircraft is a potential barrier issue for civil market penetration. Tiltrotor aeroacoustics, including primary noise sources and the cur- rent state of the art, has been extensively documented in the literature (Ref. 2). There are two primary ways to reduce the noise produced by a tiltrotor aircraft. One means is by designing an inherently quiet rotor system. This requires a significant lead time and involves complex aeroacoustic and structural design trade- offs. A second approach is to make use of the nacelle tilt 00-08-1 https://ntrs.nasa.gov/search.jsp?R=20010059380 2018-08-30T18:42:39+00:00Z
Transcript of NASA/ARMY/BELL XV-15 TILTROTOR LOW-NOISE TERMINAL AREA OPERATIONS · NASA/ARMY/BELL XV-15 TILTROTOR...
NASA/ARMY/BELL XV-15 TILTROTOR LOW-NOISE TERMINAL AREA OPERATIONSFLIGHT RESEARCH PROGRAM
Bryan D. EdwardsPrincipal Engineer, Acoustics
Bell Helicopter Textron, Inc., Fort Worth, Texasbedwards2(_bellhelicopter.textron.com
David A. Conner
Aerospace Engineer, Aeroflightdynamics Directorate (AMRDEC)U.S. Army Aviationa nd Missile Command,Langley Research Center, Hampton, Virginia
d.a.conner(_larc.nasa.gov
William A Decker
Aeronautical EngineerFlight Control and Cockpit Integration Branch
Army/NASA Rotorcraft DivisionNASA Ames Research Center, Moffett Field, California
[email protected], gov
Michael A. Marcolini
Head, Advanced Measurement and Diagnostics BranchNASA Langley Research Center, Hampton, Virginia
m.a. marcolini(il_larc.nasa, gov
Peter D. Klein
Chief, Advanced Systems DevelopmentBell Helicopter Textron Inc., Fort Worth, Texas
ABSTRACT
To evaluate the noise reduction potential for tiltrotor aircraft,
a series of three XV-15 acoustic flight tests were conductedover a five-year period by a NASA/Army/Bell Helicopter
team. Lower hemispherical noise characteristics for a wide
range of steady-state terminal area type operating conditionswere measured during the Phase 1 test and indicated that the
takeoff and level flight conditions were not significant con-tributors to the total noise of tiltrotor operations. Phase 1
results were also used to design low-noise approach profilesthat were tested later during the Phase 2 and Phase 3 tests.
These latter phases used large area microphone arrays to
directly measure ground noise footprints. Approach profilesemphasized noise reduction while maintaining handling
qualities sufficient for tiltrotor commercial passenger ridecomfort and flight safety under Instrument Flight Rules
(IFR) conditions. This paper will discuss the weather, air-craft, tracking, guidance, and acoustic instrumentation sys-
tems, as well as the approach profile design philosophy, andthe overall test program philosophy. Acoustic results are
presented to document the variation in tiltrotor noise due tochanges in operating condition, indicating the potential for
significant noise reduction using the unique tiltrotor capabil-ity of nacelle tilt. Recommendations are made for a final
Presented at the Tiltrotor/Runway Independent Aircraft
Technology and Applications Specialists' Meeting of theAmerican Helicopter Society, Arlington, Texas, March
20 21, 2001. This paper is declared a work of the U.S.Government and is not subject to copyright protection in theUnited States.
XV-15 test to define the acoustic benefits of the automated
approach capability which has recently been added to thistestbed aircraft.
INTRODUCTION
Many U.S. airports are rapidly reaching their saturationpoint with regard to the number of daily aircraft operations
permitted. Commuter aircraft, flying fairly short routes withrelatively few passengers, make up a significant portion of
the total airport operations at a large number of these air-ports, thus significantly limiting the total number of passen-
gers that can use those airports each day (Ref. 1). Tiltrotor
aircraft, with their unique capability to take off and landvertically while still flying like an airplane during cruise,
provide a potential alternate means of transportation thatcould link major cities, thus alleviating some of the demand
on airports. Research on tiltrotor aircraft has been con-ducted for many years using such vehicles as the XV-3 and
the XV--15, among others. More recently, the Navy hasbegun procurement of the V-22 Osprey to utilize the capa-
bilities of the tiltrotor for military applications. However,noise generated by the large tiltrotor aircraft is a potential
barrier issue for civil market penetration. Tiltrotoraeroacoustics, including primary noise sources and the cur-
rent state of the art, has been extensively documented in theliterature (Ref. 2).
There are two primary ways to reduce the noise produced by
a tiltrotor aircraft. One means is by designing an inherentlyquiet rotor system. This requires a significant lead time and
involves complex aeroacoustic and structural design trade-offs. A second approach is to make use of the nacelle tilt
00-08-1
https://ntrs.nasa.gov/search.jsp?R=20010059380 2018-08-30T18:42:39+00:00Z
capabilityof a tiltrotor,whichallowstheaircraftto fly aspecifiedflightpathatanumberofdifferentrotoroperatingconditions.Toaddresstheissueofnoisereduction,NASAinitiatedaneffortwiththegoalofreducingtheoveralltiltro-torapproachnoisewithina40-acrevertiportby12dBrela-tivetocurrent(1995)technology.ThiseffortisakeypartoftheShort-Haul(CivilTiltrotor)(SH(CT))programwhichisanelementof theAviationSystemsCapacityInitiativewithinNASA. Theobjectivesandoverallscopeof theSH(CT)programhavebeenthoroughlydocumented(Ref.3). Thegoalis toobtainhalfthenoisereductionthroughdesignandhalfthroughoperations.
Theconceptof noisereductionbyflightoperationsisnotnewin therotorcraftindustryandis thebasisforadecadesoldHelicopterAssociationInternational(HAl)programre-ferredto asthe"FlyNeighborlyProgram"(Ref.4). The
idea is to avoid operating in those regions of the vehicleflight operations envelope that produce high noise levels
relative to other regions of the flight envelope. To explore
this concept in detail, the NASA Langley and Ames Re-search Centers conducted an acoustic flight test using a UH-
60 "Blackhawk" helicopter to determine relative noise levels
as a function of flight operating condition (Refs. 5, 6). Witha noise mapping of the Blackhawk flight envelope in hand, a
noise abatement approach profile was designed. To flynoise abatement approach profiles with precision, a flight
guidance system was developed at the Ames Research Cen-ter which was based on a global position by satellite (GPS)
system (Ref. 7). A subsequent flight test to assess the noiseabatement potential of this approach profile showed no sig-
nificant differences in the sound exposure level (SEL) at thethree FAA noise certification measurement locations when
compared to a standard 6-deg decelerating approach (Ref.8). However, different conclusions might have been reachedif a large area noise footprint had been measured. In 1996,
large area noise footprints were measured during a noiseabatement flight test involving the NASA Langley and
Ames Research Centers, the Volpe National TransportationSystems Center (DOT/FAA), Boeing-Mesa, and Sikorsky
Aircraft (Ref. 9). During this test, a Boeing MD Explorerand a Sikorsky S-76B flew noise abatement approaches over
a 49-microphone array which was deployed over an areameasuring 3,000 ft by 8,000 ft. Results for the MD Explorer
showed that a two-segmented noise abatement approach
profile provided an average 3 to 4 SELdB noise reductionrelative to the reference approach profile over a ground area
termed as the noise sensitive region under the flight path(3,000 to 7,000 ft uprange from the landing point) (Ref. 10).
The S-76 noise abatement approach profile showed noisereductions of more than 6 SELdB for distances in excess of
5,000 ft uprange of the landing point when compared to a
standard FAA noise certification approach (Ref. 11). How-ever, this same approach showed no significant noise reduc-
tions at the FAA certification distance of 3,750 fl uprange of
the landing point.
Tiltrotor aircraft have the potential for even more significant
noise reduction benefits due to the additional operationalvariable of nacelle tilt angle. To design noise abatement
procedures for tiltrotors, a detailed knowledge of the noisedirectivity characteristics for many different operating con-
ditions is required. The XV 15 has been the predominant
tiltrotor acoustic research aircraft for the last 20 years. As ajoint NASA/Army/Bell venture, two XV-15 aircraft were
built, and much acoustic testing has been accomplished us-ing these vehicles. Lee and Mosher showed significant varia-
tion (10-15 dB) in noise level as a function of nacelle tilt
angle in a test of an XV-15 in the NASA Ames 40 × 80 footwind tunnel (Ref. 12). However, detailed directivity
changes could not be measured, because only four micro-
phones were used. Conner and Wellman conducted XV-I 5flight tests that successfully mapped the aircraft noise direc-
tivity during hover for two different rotor blade sets (Ref.13). Brieger, Maisel, and Gerdes conducted XV--15 flight
tests, acquiring acoustic data during level flight, ascent, and
descent operating conditions (Ref. 14). Their results showed
a significant variation in noise generation with nacelle tilt,but since acoustic data were only acquired at two sidelineangles to each side of the aircraft, directivity information
was limited. Edwards (Ref. 15) acquired XV-15 acoustics
data for a limited test matrix using a large area microphonearray to directly measure the noise footprint. More recently,
Conner et al. conducted an extensive XV-15 flight testwhich used a linear microphone array to successfully map
the noise directivity for many different ascent, descent, and
level flight operating conditions (Ref. 16). The potential forsignificant tiltrotor noise reductions with variations in ap-
proach profile design (nacelle angle/airspeed/altitude sched-ule) was shown in a 1997 XV-15 acoustic flight test which
used a large area microphone array to directly measure noisefootprints for a large number of candidate low noise profiles
(Ref. 17). Compared to a standard 6-deg approach, a noiseabatement approach showed a noise reduction of more than5 SELdB when averaged over all microphones located be-
tween 3,000 ft and 8,000 ft uprange of the landing point, and
more than 7 SELdB when averaged over all microphoneslocated between 5,000 and 8,000 fl uprange of the landing
point.
In the present paper, results are presented from the most
recent series of three XV-15 flight tests conducted by aNASA/Army/Bell Helicopter team that addresses tiltrotornoise reduction by flight operations. These tests were con-
ducted in 1995 (Ref. 16), 1997 (Ref. 17), and 1999 at a re-mote test site located near Waxahachie, TX. The 1995 test,
referred to as Phase 1, focused on all aspects of terminal areaoperations (takeoff, approach, and level flight conditions),
00-08-2
whilethe1997(Phase2)and1999(Phase3)testsfocusedexclusivelyon theapproachcondition,becausethiswasidentifiedastheareaofmostconcern.Theoverallprogramapproachphilosophyaswel asthespecificobjectivesforeachtestarediscussed.Resultsfromeachtestarepresented,includingeffectivegroundcontoursfor steadystateflightconditionsandmeasuredgroundfootprintsforrealistictake-offsandapproaches.Theseresultsdocumentthevariationintiltrotornoiseduetochangesinoperatingcondition,andindicatethepotentialforsignificantnoisereductionusingtheuniquetiltrotorcapabilityof nacelletilt. Alsoincludedarediscussionsof theweather,aircraft,tracking,guidance,andacousticinstrumentationsystems,thelow noiseap-proachprofiledesignphilosophy,andtheuseoftheRotor-craftNoiseModel(RNM)(Ref.18)asanaidinthedesignof quietapproachprofiles.Thispaperis anessentiallyanupdateto one presented by Dave Conner at an AIAA confer-
ence in June 2000 (Ref. 19).
OVERALL PROGRAM DESIGN
The overall objective of this flight test program was todetermine terminal area flight procedures for tilt-rotors that
are consistently quiet, safe, and easy to fly. An XV-15flight test program was developed that included three
separate flight tests, allowing time between the tests tothoroughly analyze the data and use the results to plan the
following test. The Phase I test (Ref. 16) was designed toassess the relative noise levels produced by tiltrotor aircraft
for a broad range of steady-state flight conditions by
measuring the lower hemispherical noise characteristicsusing a linear microphone array. Data were acquired for
level flyovers, takeoffs, and approaches. Results indicated
that level flyover and takeoff noise levels were insignificantcompared to approach noise levels. The remainder of the
program, therefore, focused exclusively on developing low-noise approaches. Steady-state noise characteristics for the
approaches flown during Phase 1 testing were studied andcandidate low-noise approach profiles were designed using
engineering judgment and the noise prediction programRNM. The candidate low-noise approach profiles, originally
designed from a purely acoustic point of view, weremodified to blend noise reduction and handling qualities.
The modified candidate low-noise approach profiles werethen flown in the Phase 2 flight test (Ref. 17) to assess the
noise reduction potential. During this test, the noise
footprints were directly measured using a large areamicrophone array. Handling qualities assessments wereprovided by the pilots after each approach. The most
promising approach profiles from Phase 2 testing were thenmodified to further improve handling qualities, thus
providing a refined set of low-noise approach profiles. Inaddition, an optimizer was linked with the RNM to provide a
couple of new candidate low-noise approach profiles that
were then modified for improved handling qualities. The
refined set of approach profiles, along with the two new
approach profiles, were then tested in the Ames VerticalMotion Simulator (VMS) to assess and, if necessary,
improve the handling qualities characteristics prior to the
Phase 3 flight test.
EXPERIMENTALSETUP
XV-15 Tiltrotor Aircraft
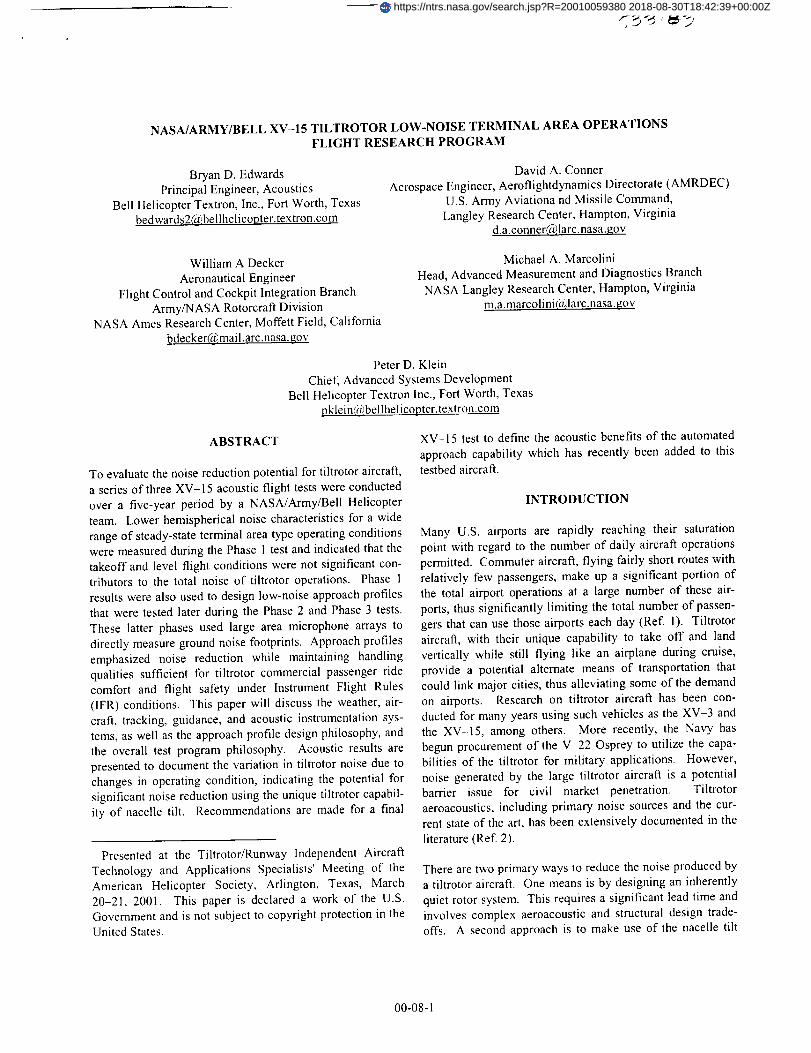
The XV-15 tiltrotor aircraft (Fig. 1 from Re£ 20) was built
by Bell Helicopter Textron, Inc. (hereinafter referred to as
Bell), as a proof-of-concept aircraft and technology demon-strator whose first flight was in May 1977. The XV-15 has
two 25-ft (7.6-m) diameter rotors mounted on pivoting na-celles that are located on the wingtips. Each nacelle houses
a main transmission and a Lycoming T-53 turboshaft engine
capable of generating 1,800 shaft horsepower (1.342 kW).The nacelles are tilted into the vertical position (90 deg na-
celle angle) for vertical takeoffs and landings and rotated to
the horizontal (0 deg nacelle angle) for cruising flight. Eachrotor has three highly-twisted, square-tip stainless steel
blades which typically operate at 589 rpm during hover andtransitional flight modes, and at 517 rpm in cruise, corre-
sponding to 98% and 86% of rotor design speed. The wingshave a 6.5 deg forward sweep to provide clearance for rotor
flapping. During this test, the nominal vehicle takeoff gross
weight was 13,900 lb (5,897 kg), including about 2,000 lb(907 kg) of fuel. During the period of data acquisition, fuel
bum-off resulted in an approximately 10% reduction in thevehicle gross weight. The vehicle was operated by Bell un-
der contract to NASA. In addition, Bell furnished research
Fig. 1. XV-15 tiltrotor aircraft approachingthe landing point at test site near Waxaha-chie, TX during Phase 3 test.
00-08-3
pilots, flight test engineers, ground crew personnel, and
other necessary support personnel for operation and mainte-
nance of the aircraft and onboard data acquisition system.
The XV-15 featured an impressive suite of onboard instru-
mentation. Approximately 150 aircraft state parameters
were measured and recorded on magnetic tape. Transducers
included attitude and rate gyros, strain gauges, temperature
sensors, accelerometers, and control position sensors. In
addition to the standard onboard instrumentation package, a
modified instrument landing system (ILS) was installed for
pilot guidance during Phase 1 testing and a differential
global positioning system (DGPS) and flight director system
(Ref. 21) were installed to provide tracking and pilot guid-
ance during Phase 2 and Phase 3 testing.
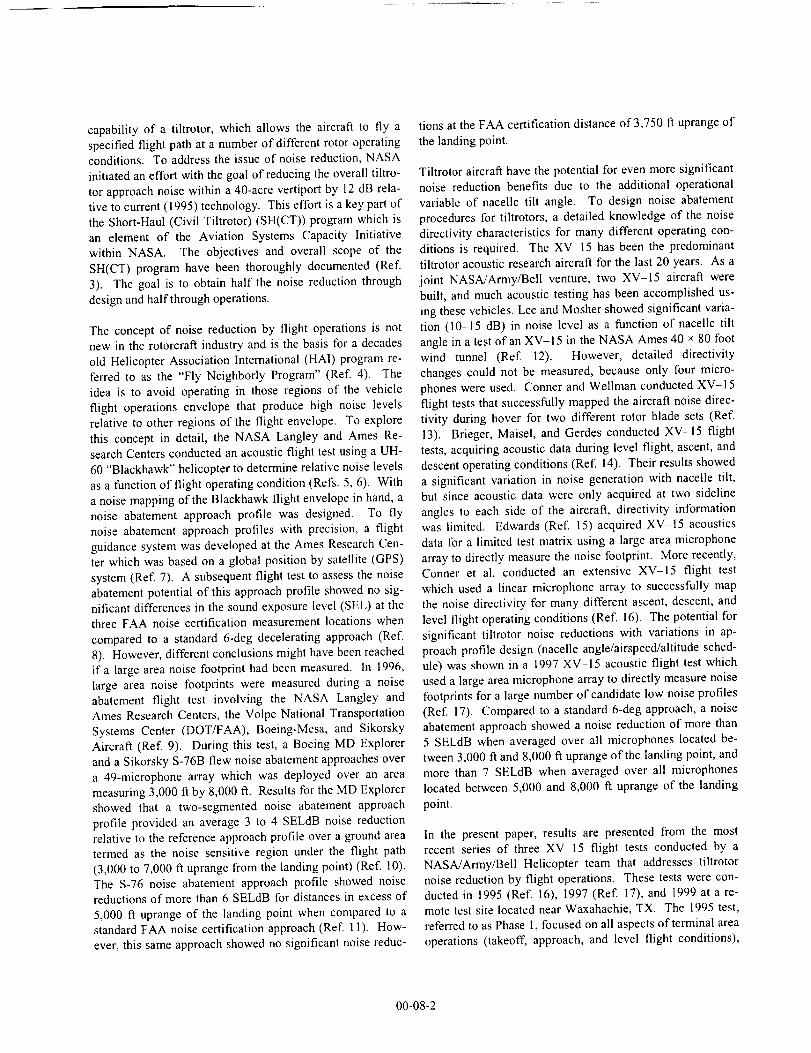
The nominal XV 15 flight envelope, shown in Fig. 2, illus-
trates the combination of nacelle angle and airspeed neces-
sary to achieve stabilized level flight conditions. It should
be noted that a fairly broad range of nacelle angles and air-
speeds is possible within this operating envelope. The
acoustic effects of avoiding certain portions of this range can
guide flight operations of the XV-I 5 (and presumably other
tiltrotor aircraft) in minimizing external noise. The flight
test series discussed here was designed to define and quan-
tify these effects during terminal area operations.
Aircraft Tracking and Pilot Guidance Systems
During the Phase I test, aircraft tracking was provided by
the NASA Ames Precision Automated Tracking System
(PATS). The PATS used a pulsed laser beam with a 100 Hz
pulse rate to measure the position of the aircraft within 0.1
mrad in azimuth and elevation and ±1 ft in range. These
measurements were then converted to absolute X, Y, and Z
coordinates with respect to the acoustic reference location.
Along with tracking aircraft position, the Ames instrument
positioning system (IPS) was used to provide flight path
guidance information to the pilots. The IPS compared the
actual aircraft position to a pre-selected desired flight
100
8O"0
_t 60
<40
00
"_'_ Normal level flight '_Q \.l"_operating corridor
\
20 40 60 80 100 120 140 160
Calibrated Airspeed, kts.
180 200
Fig. 2, XV-15 flight envelope.
profile, and transmitted an error signal to a traditional ILS
receiver and display installed on board the XV-15. This
system provided real-time feedback to the pilots regarding
their position with respect to the desired flight profile. In
addition to the IPS, three 1,000-W metal halide lights with
parabolic reflectors oriented towards the aircraft when
inbound were deployed along the desired flight path
approximately 25 ft (7.6 m) above ground level at both ends
and at the center of the test range property. These lights
were visible to the pilots several miles out and provided very
useful visual cues of the desired flight path.
During the Phase 2 and 3 tests, aircraft tracking was pro-
vided by a 12-channel, dual-frequency Ashtech Model Z-12
GPS receiver installed on board the XV-15. Differential
corrections were received from a reference ground GPS unit
using a VHF radio modem. The GPS reference ground sta-
tion consisted of a matching GPS receiver and radio modem.
Differential corrections were determined and transmitted to
the aircraft twice per second at 19,200 baud. The informa-
tion from the onboard DGPS receiver was passed from a
serial data port to a Bell-designed interface unit. This unit
parsed the serial GPS data stream and formatted the values
into data words, which were inserted into the aircraft's
pulse-code modulated (PCM) data stream. This approach
allowed the GPS measurements to be correlated in time with
the remainder of the approximately 150 measured aircraft
parameters. The PCM data stream, including the GPS pa-
rameters, was simultaneously recorded onboard the aircraft
and transmitted to the ground telemetry station for real-time
monitoring. The three 1,000-W metal halide lights were also
deployed during the Phase 2 and Phase 3 tests to provide the
pilots with visual ground cues of the desired flight track.
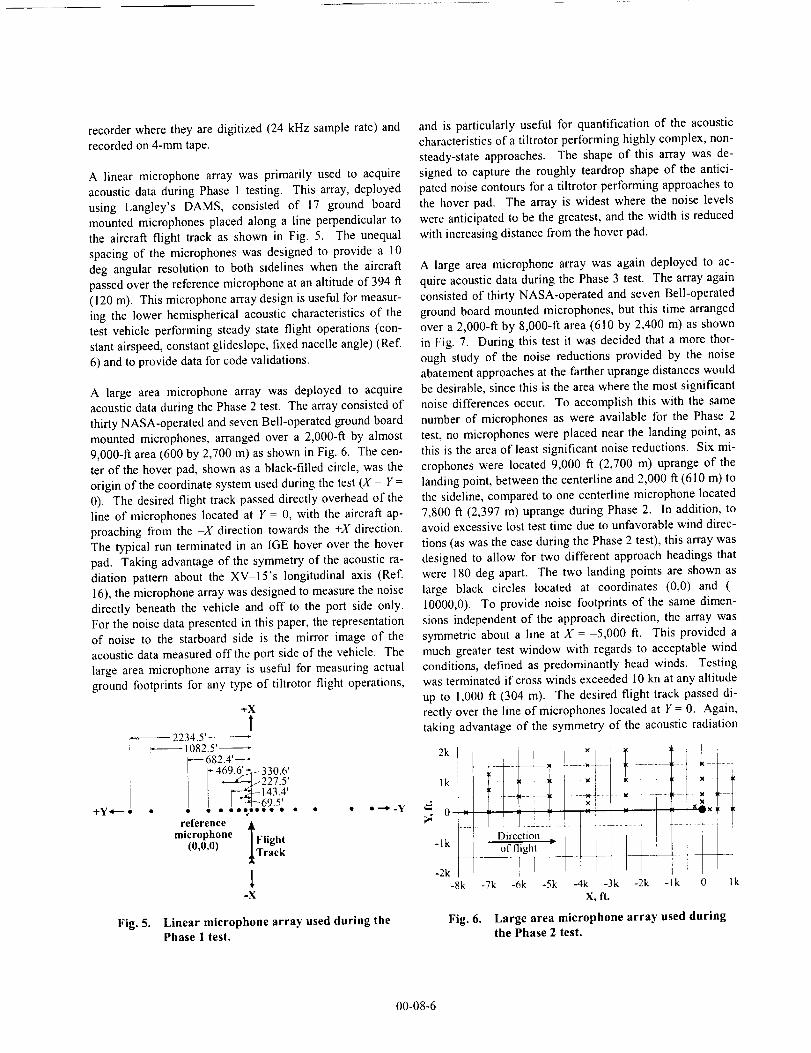
An advanced flight guidance system was used during the
1997 and 1999 flight tests. The XV-15 was fitted with a
Silicon Graphics, Inc. computer that calculated the flight
director guidance parameters required to perform complex,
multi-segmented, decelerating approaches with the required
precision (Ref. 21). The flight director computer utilized
guidance control laws developed in NASA/Bell simulations
specifically for tiltrotor operations (Ref. 22). The computer
received DGPS information and other aircraft state parame-
ters by means of an Ethernet communications link with the
interface unit. The XV-15 copilot's instrument panel was
modified with the installation of a color liquid crystal dis-
play (LCD), shown in Fig. 3, which provided essential in-
formation for piloting the aircraft, and also provided the in-
formation needed for flight director guidance. The flight
director provided guidance commands for the desired air-
craft configuration, as well as for the desired flight path and
velocity profile. Commands were given for the operation of
flaps, landing gear, and nacelle conversion angle. Conven-
tional command bars were used for flight path guidance and
00-08-4
raw data for horizontal and vertical position errors were alsoprovided. Ground speed errors were displayed, and power
lever commands were given for airspeed and descent rate
control. The nacelle conversion angle and flaps can be usedvery effectively to reduce pilot workload and control fuse-
lage attitude while flying very precise approach paths.
Meteorological Instrumentation
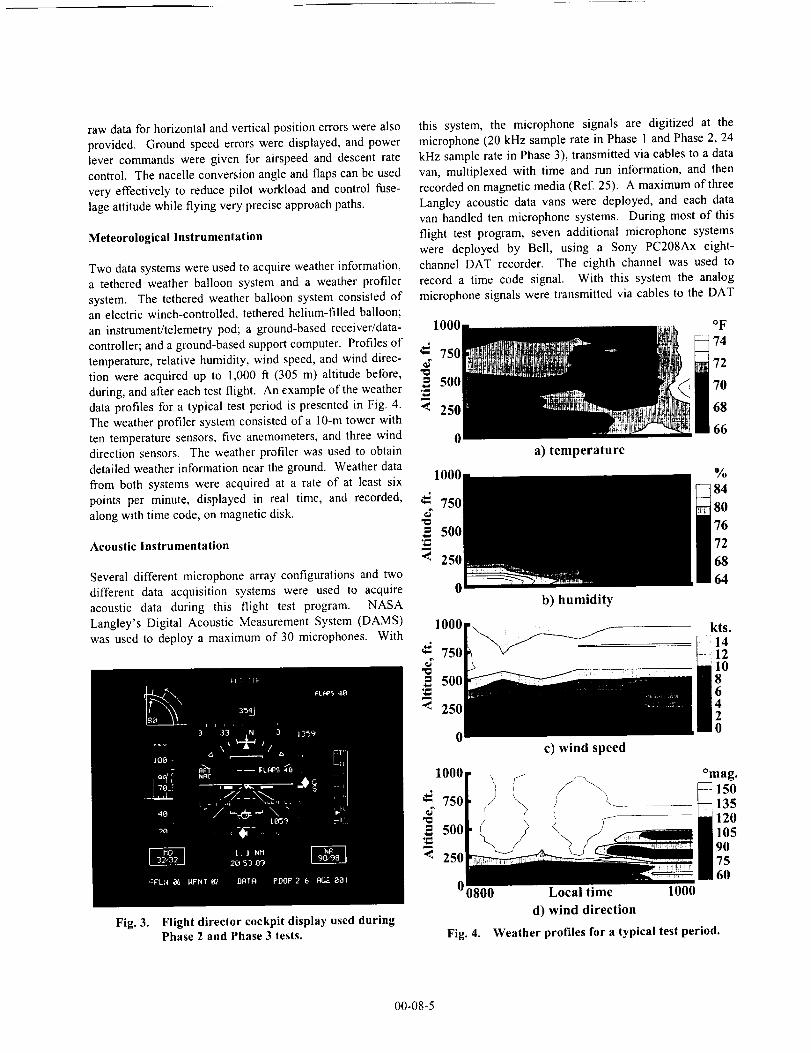
Two data systems were used to acquire weather information,
a tethered weather balloon system and a weather profiler
system. The tethered weather balloon system consisted ofan electric winch-controlled, tethered helium-filled balloon;
an instrument/telemetry pod; a ground-based receiver/data-controller; and a ground-based support computer. Profiles of
temperature, relative humidity, wind speed, and wind direc-
tion were acquired up to 1,000 ft (305 m) altitude before,during, and after each test flight. An example of the weather
data profiles for a typical test period is presented in Fig. 4.The weather profiler system consisted of a 10-m tower with
ten temperature sensors, five anemometers, and three wind
direction sensors. The weather profiler was used to obtaindetailed weather information near the ground. Weather data
from both systems were acquired at a rate of at least sixpoints per minute, displayed in real time, and recorded,
along with time code, on magnetic disk.
Acoustic Instrumentation
Several different microphone array configurations and two
different data acquisition systems were used to acquire
acoustic data during this flight test program. NASALangley's Digital Acoustic Measurement System (DAMS)
was used to deploy a maximum of 30 microphones. With
Fig. 3. Flight director cockpit display' used duringPhase 2 and Phase 3 tests.
this system, the microphone signals are digitized at themicrophone (20 kHz sample rate in Phase 1 and Phase 2, 24
kHz sample rate in Phase 3), transmitted via cables to a data
van, multiplexed with time and run information, and thenrecorded on magnetic media (Ref. 25). A maximum of three
Langley acoustic data vans were deployed, and each datavan handled ten microphone systems. During most of this
flight test program, seven additional microphone systems
were deployed by Bell, using a Sony PC208Ax eight-channel DAT recorder. The eighth channel was used to
record a time code signal. With this system the analogmicrophone signals were transmitted via cables to the DAT
1000 oF
750 i 74
72
500 70
< 250 68
0 66
_-" 750
.= 500
< 250
1000
750
500
< 250
1000
750
500
< 250
00800
Fig. 4.
a) temperature
b) humidity
c) wind speed
( ',
%
84
8O
76
72
68
64
kts.
ii41210
l0
°mag.150135120
i105907560
Local time 1000
d) wind direction
Weather profiles for a typical test period.
00-08-5
recorder where they are digitized (24 kHz sample rate) and
recorded on 4-ram tape.
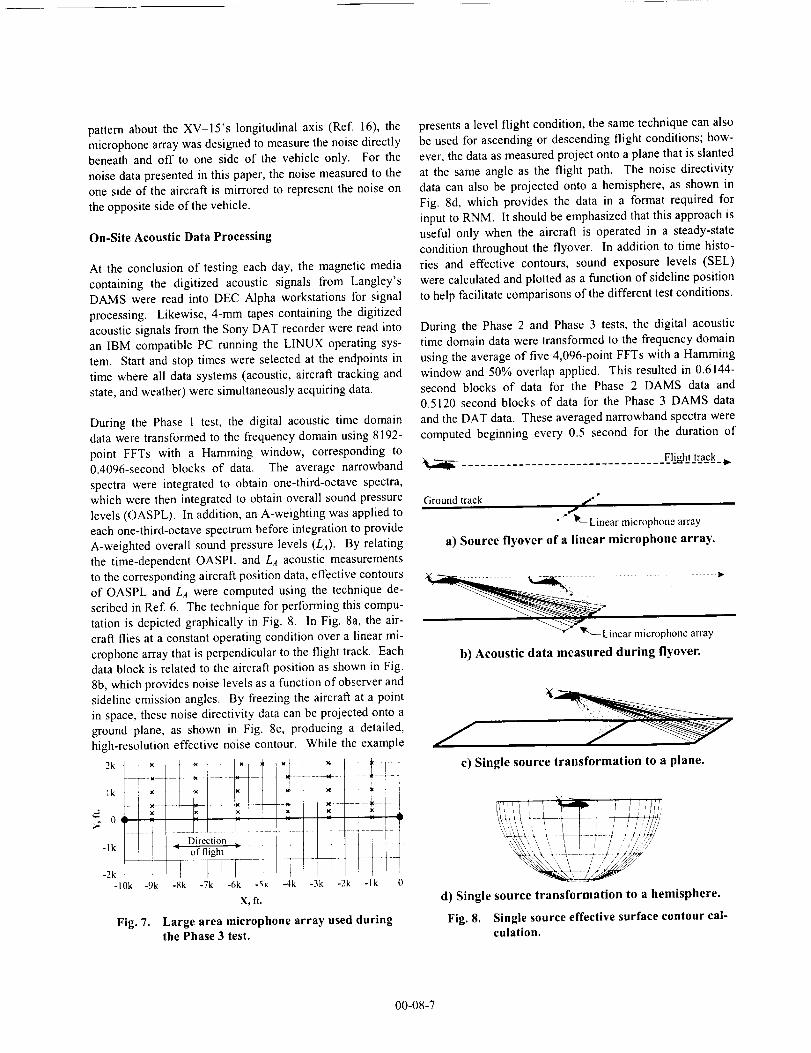
A linear microphone array was primarily used to acquire
acoustic data during Phase 1 testing. This array, deployed
using Langley's DAMS, consisted of 17 ground board
mounted microphones placed along a line perpendicular to
the aircraft flight track as shown in Fig. 5. The unequal
spacing of the microphones was designed to provide a 10
deg angular resolution to both sidelines when the aircraft
passed over the reference microphone at an altitude of 394 fl
(120 m). This microphone array design is useful for measur-
ing the lower hemispherical acoustic characteristics of the
test vehicle performing steady state flight operations (con-
stant airspeed, constant glideslope, fixed nacelle angle) (Ref.
6) and to provide data for code validations.
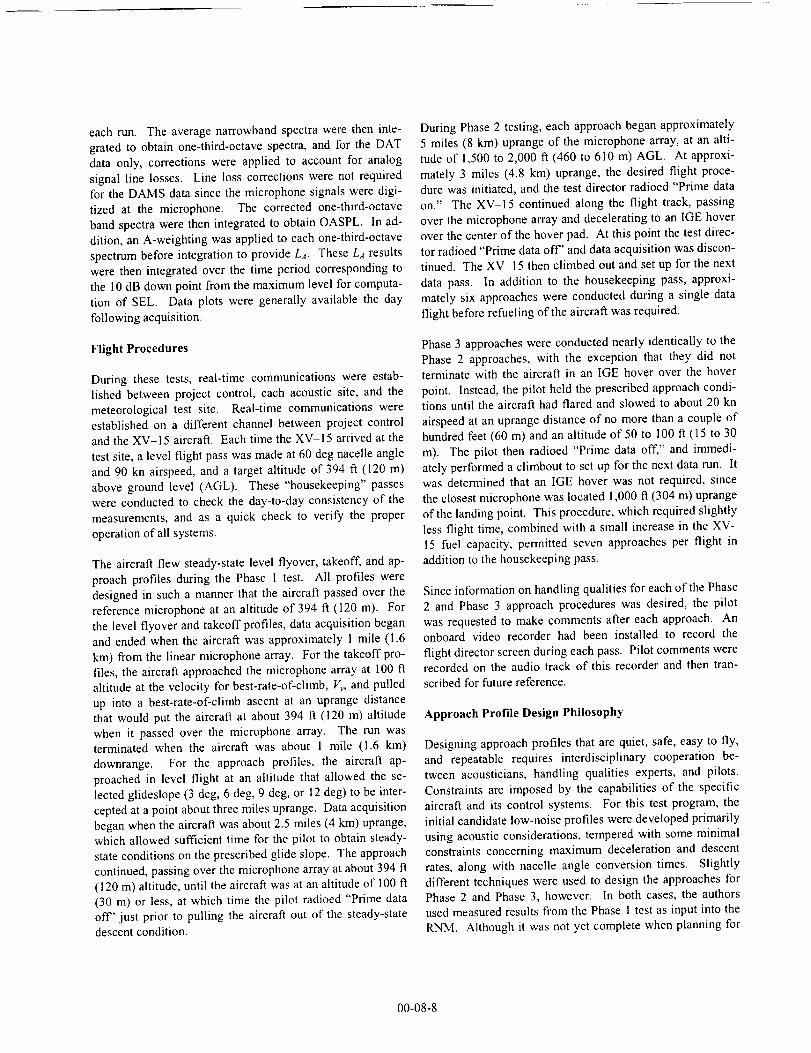
A large area microphone array was deployed to acquire
acoustic data during the Phase 2 test. The array consisted of
thirty NASA-operated and seven Bell-operated ground board
mounted microphones, arranged over a 2,000-ft by almost
9,000-ft area (600 by 2,700 m) as shown in Fig. 6. The cen-
ter of the hover pad, shown as a black-filled circle, was the
origin of the coordinate system used during the test (X = Y =
0). The desired flight track passed directly overhead of the
line of microphones located at Y = 0, with the aircraft ap-
proaching from the X direction towards the +X direction.
The typical run terminated in an IGE hover over the hover
pad. Taking advantage of the symmetry of the acoustic ra-
diation pattern about the XV-15's longitudinal axis (Ref.
16), the microphone array was designed to measure the noise
directly beneath the vehicle and off to the port side only.
For the noise data presented in this paper, the representation
of noise to the starboard side is the mirror image of the
acoustic data measured off the port side of the vehicle. The
large area microphone array is useful for measuring actual
ground footprints for any type of tiltrotor flight operations,
+X
!_ 2234.5' ---------_
1082.5'.-:7-_-- 682.4'4
_- 469.6'__J 330 6'i | _---_--/227"5'
t _-14314'
+v--- .f .r . 69.5; .... --.-vreference
microphone tFlight
(0,0,0) _Track
-X
Fig. 5. Linear microphone array used during the
Phase 1 test.
and is particularly useful for quantification of the acoustic
characteristics of a tiltrotor performing highly complex, non-
steady-state approaches. The shape of this array was de-
signed to capture the roughly teardrop shape of the antici-
pated noise contours for a tiltrotor performing approaches to
the hover pad. The array is widest where the noise levels
were anticipated to be the greatest, and the width is reduced
with increasing distance from the hover pad.
A large area microphone array was again deployed to ac-
quire acoustic data during the Phase 3 test. The array again
consisted of thirty NASA-operated and seven Bell-operated
ground board mounted microphones, but this time arranged
over a 2,000-1t by 8,000-ft area (610 by 2,400 m) as shown
in Fig. 7. During this test it was decided that a more thor-
ough study of the noise reductions provided by the noise
abatement approaches at the farther uprange distances would
be desirable, since this is the area where the most significant
noise differences occur. To accomplish this with the same
number of microphones as were available for the Phase 2
test, no microphones were placed near the landing point, as
this is the area of least significant noise reductions. Six mi-
crophones were located 9,000 ft (2,700 m) uprange of the
landing point, between the centerline and 2,000 ft (610 m) to
the sideline, compared to one centerline microphone located
7,800 ft (2,397 m) uprange during Phase 2. In addition, to
avoid excessive lost test time due to unfavorable wind direc-
tions (as was the case during the Phase 2 test), this array was
designed to allow for two different approach headings that
were 180 deg apart. The two landing points are shown as
large black circles located at coordinates (0,0) and (
10000,0). To provide noise footprints of the same dimen-
sions independent of the approach direction, the array was
symmetric about a line at X = 5,000 ft. This provided a
much greater test window with regards to acceptable wind
conditions, defined as predominantly head winds. Testing
was terminated if cross winds exceeded 10 kn at any altitude
up to 1,000 ft (304 m). The desired flight track passed di-
rectly over the line of microphones located at Y= 0. Again,
taking advantage of the symmetry of the acoustic radiation
2k
i E-Tk - k -5k -4k -3k -2k -lk 0
X, ft.
Large area microphone array used during
the Phase 2 test.
Ik
00-08-6
pattern about the XV-15's longitudinal axis (Ref. 16), the
microphone array was designed to measure the noise directlybeneath and off to one side of the vehicle only. For the
noise data presented in this paper, the noise measured to the
one side of the aircraft is mirrored to represent the noise onthe opposite side of the vehicle.
On-Site Acoustic Data Processing
At the conclusion of testing each day, the magnetic mediacontaining the digitized acoustic signals from Langley's
DAMS were read into DEC Alpha workstations for signal
processing. Likewise, 4-ram tapes containing the digitizedacoustic signals from the Sony DAT recorder were read into
an IBM compatible PC running the LINUX operating sys-tem. Start and stop times were selected at the endpoints in
time where all data systems (acoustic, aircraft tracking and
state, and weather) were simultaneously acquiring data.
During the Phase 1 test, the digital acoustic time domain
data were transformed to the frequency domain using 8192-
point FFTs with a Hamming window, corresponding to
0.4096-second blocks of data. The average narrowbandspectra were integrated to obtain one-third-octave spectra,
which were then integrated to obtain overall sound pressurelevels (OASPL). In addition, an A-weighting was applied to
each one-third-octave spectrum before integration to provideA-weighted overall sound pressure levels (LA). By relating
the time-dependent OASPL and LA acoustic measurementsto the corresponding aircraft position data, effective contours
of OASPL and LA were computed using the technique de-
scribed in Ref. 6. The technique for performing this compu-tation is depicted graphically in Fig. 8. In Fig. 8a, the air-
craft flies at a constant operating condition over a linear mi-
crophone array that is perpendicular to the flight track. Eachdata block is related to the aircraft position as shown in Fig.8b, which provides noise levels as a function of observer and
sideline emission angles. By freezing the aircraft at a point
in space, these noise directivity data can be projected onto aground plane, as shown in Fig. 8c, producing a detailed,high-resolution effective noise contour. While the example
2k
_k
_o
-lk
-2kl
-IOk -9k
Fig. 7.
I-Sk -Tk -6k -5k -4k -3k -2k - t k
X, ft.
Large area microphone array used duringthe Phase 3 test.
presents a level flight condition, the same technique can also
be used for ascending or descending flight conditions; how-
ever, the data as measured project onto a plane that is slantedat the same angle as the flight path. The noise directivity
data can also be projected onto a hemisphere, as shown inFig. 8d, which provides the data in a format required for
input to RNM. It should be emphasized that this approach isuseful only when the aircraft is operated in a steady-state
condition throughout the flyover. In addition to time histo-
ries and effective contours, sound exposure levels (SEL)were calculated and plotted as a function of sideline position
to help facilitate comparisons of the different test conditions.
During the Phase 2 and Phase 3 tests, the digital acoustic
time domain data were transformed to the frequency domain
using the average of five 4,096-point FFTs with a Hammingwindow and 50% overlap applied. This resulted in 0.6144-second blocks of data for the Phase 2 DAMS data and
0.5120 second blocks of data for the Phase 3 DAMS data
and the DAT data. These averaged narrowband spectra were
computed beginning every 0.5 second for the duration of
................................ O_j _t__as_k_
Ground track t,- _"
_ _-Linear microphone array
a) Source flyover of a linear microphone array.
__-Linear microphone array
b) Acoustic data measured during flyover.
/c) Single source transformation to a plane.
d) Single source transformation to a hemisphere.
Fig. 8. Single source effective surface contour cal-culation.
00-08-7
eachrun.Theaveragenarrowbandspectraweretheninte-gratedtoobtainone-third-octavespectra,andfortheDATdataonly,correctionswereappliedto accountfor analogsignallinelosses.LinelosscorrectionswerenotrequiredfortheDAMSdatasincethemicrophonesignalsweredigi-tizedat themicrophone.Thecorrectedone-third-octavebandspectrawerethen integrated to obtain OASPL. In ad-dition, an A-weighting was applied to each one-third-octave
spectrum before integration to provide LA. These LA resultswere then integrated over the time period corresponding to
the 10 dB down point from the maximum level for computa-
tion of SEL. Data plots were generally available the dayfollowing acquisition.
Flight Procedures
During these tests, real-time communications were estab-lished between project control, each acoustic site, and the
meteorological test site. Real-time communications wereestablished on a different channel between project controland the XV-15 aircraft. Each time the XV-15 arrived at the
test site, a level flight pass was made at 60 deg nacelle angleand 90 kn airspeed, and a target altitude of 394 ft (120 m)
above ground level (AGL). These "housekeeping" passes
were conducted to check the day-to-day consistency of themeasurements, and as a quick check to verify the proper
operation of all systems.
The aircraft flew steady-state level flyover, takeoff, and ap-proach profiles during the Phase I test. All profiles were
designed in such a manner that the aircraft passed over thereference microphone at an altitude of 394 ft (120 m). For
the level flyover and takeoff profiles, data acquisition began
and ended when the aircraft was approximately I mile (1.6km) from the linear microphone array. For the takeoff pro-
files, the aircraft approached the microphone array at 100 ft
altitude at the velocity for best-rate-of-climb, Vy, and pulledup into a best-rate-of-climb ascent at an uprange distancethat would put the aircraft at about 394 ft (120 m) altitude
when it passed over the microphone array. The run wasterminated when the aircraft was about 1 mile (1.6 kin)
downrange. For the approach profiles, the aircraft ap-proached in level flight at an altitude that allowed the se-
lected glideslope (3 deg, 6 deg, 9 deg, or 12 deg) to be inter-
cepted at a point about three miles uprange. Data acquisitionbegan when the aircraft was about 2.5 miles (4 km) uprange,which allowed sufficient time for the pilot to obtain steady-
state conditions on the prescribed glide slope. The approach
continued, passing over the microphone array at about 394 ft(120 m) altitude, until the aircraft was at an altitude of 100 ft(30 m) or less, at which time the pilot radioed "Prime data
off" just prior to pulling the aircraft out of the steady-statedescent condition.
During Phase 2 testing, each approach began approximately5 miles (8 kin) uprange of the microphone array, at an alti-
tude of 1,500 to 2,000 fl (460 to 610 m) AGL. At approxi-mately 3 miles (4.8 kin) uprange, the desired flight proce-
dure was initiated, and the test director radioed "Prime data
on." The XV-15 continued along the flight track, passingover the microphone array and decelerating to an IGE hover
over the center of the hover pad. At this point the test direc-tor radioed "Prime data off" and data acquisition was discon-
tinued. The XV-15 then climbed out and set up for the next
data pass. In addition to the housekeeping pass, approxi-
mately six approaches were conducted during a single dataflight before refueling of the aircraft was required.
Phase 3 approaches were conducted nearly identically to the
Phase 2 approaches, with the exception that they did notterminate with the aircraft in an IGE hover over the hover
point. Instead, the pilot held the prescribed approach condi-tions until the aircraft had flared and slowed to about 20 kn
airspeed at an uprange distance of no more than a couple of
hundred feet (60 m) and an altitude of 50 to 100 ft (15 to 30
m). The pilot then radioed "Prime data off," and immedi-ately performed a climbout to set up for the next data run. It
was determined that an IGE hover was not required, sincethe closest microphone was located 1,000 ft (304 m) uprange
of the landing point. This procedure, which required slightly
less flight time, combined with a small increase in the XV-15 fuel capacity, permitted seven approaches per flight inaddition to the housekeeping pass.
Since information on handling qualities for each of the Phase2 and Phase 3 approach procedures was desired, the pilot
was requested to make comments after each approach. Anonboard video recorder had been installed to record the
flight director screen during each pass. Pilot comments wererecorded on the audio track of this recorder and then tran-
scribed for future reference.
Approach Profile Design Philosophy
Designing approach profiles that are quiet, safe, easy to fly,
and repeatable requires interdisciplinary cooperation be-tween acousticians, handling qualities experts, and pilots.
Constraints are imposed by the capabilities of the specificaircraft and its control systems. For this test program, the
initial candidate low-noise profiles were developed primarilyusing acoustic considerations, tempered with some minimal
constraints concerning maximum deceleration and descentrates, along with nacelle angle conversion times. Slightly
different techniques were used to design the approaches forPhase 2 and Phase 3, however. In both cases, the authorsused measured results from the Phase 1 test as input into the
RNM. Although it was not yet complete when planning for
00-08-8
Phase2 began,RNMstillprovidedatooltoassessthere-sultingnoiseproducedwhencombiningseveraldifferentflightproceduresintoacandidateapproachprofile.Noisefootprintsproducedbyusingdifferentcombinationsofair-speed,nacelleangle,andglideslopewereexaminedandcomparedwitha baseline6 degglideslope/70kn/85degnacelleangleapproach.
InPhase2,asetofteninitial candidate profiles were devel-oped using a somewhat ad hoc approach based on examina-
tion of the Phase ! results. These initial profiles were then
modified to reflect prior simulator experience with tiltrotorinstrument approach procedures, as well as attempting to
provide acceptable handling qualities. Approach profiledesign priorities were as follows: first, to maximize the ma-
neuvering portion of the approach over the 8,000 fl (2,440m) of microphone array; second, to aim for low noise flight
conditions identified in the Phase 1 test; and finally, the re-
sulting profiles were adjusted in an attempt to provide ac-ceptable handling qualities (priority to tracking perform-
ance) for the rate-stabilized XV-15. Examples of modifica-
tions made to the approach profiles include specifying thetime required to change the glideslope (rate of flight path
angle change of 0.5 deg/s), modeling the natural braking
effect produced when the nacelle angle is increased as partof selecting the deceleration rates (0.063g deceleration
matched average decelerations with nacelle moves for theXV 15), and including a 5-second buffer after a glideslope
change or nacelle movement to provide time for the pilot tostabilize on the new flight condition and to prepare for the
next change command. Four additional profiles were devel-oped based on previous flight simulations done in the VMS
at NASA Ames. These procedures had acceptable handling
qualities, but their noise impact was unknown. All of the
profiles discussed here were designed for "zero wind" condi-tions. During Phase 2 testing, which was limited to a singleapproach direction, the test site experienced significant pre-
vailing winds that forced the XV-15 to operate with a tailwind in excess of 10 kn most days, since the microphone
array and the landing pad were fixed on the ground. In anattempt to accommodate these weather conditions, some of
the approach profiles were modified with increased com-manded (inertial) ground speed.
To design the approach profiles for the Phase 3 test, a simi-
lar technique was used as in Phase 2, and the results of that
testing were incorporated as well. However, a more system-atic procedure was followed this time, based on the experi-
ence gained during Phase 2. First, several of the quieterapproaches from Phase 2 that also had fairly acceptable han-dling qualities were included with very little modification.
However, in an attempt to identify alternative low noise ap-proach profiles, RNM was coupled with iSIGHT (Ref. 24), acommercially available optimizer. Since it was not practical
to optimize based on contour information, the optimizationwas performed based on the noise predicted by RNM at
three microphone locations directly below the flight path, at2,000, 4,000, and 6,000 ft (610, 1,220, and 1,830 m) up-
stream of the landing point. Constraints were used to pre-
vent the optimizer from selecting flight conditions that wereoutside the XV-15 flight envelope, and to ensure that the
approach ended in an aircraft state viable for landing. The
optimized approach profiles were then slightly adapted usingthe lessons learned from the Phase 2 testing to try to produce
acceptable handling qualities, and then input to RNM toproduce a predicted noise footprint for each candidate ap-
proach. All profiles were then tested using a real-time simu-
lation model on a development workstation, while severalwere also tested in the VMS to refine handling qualities pro-
file design constraints. Smoothed guidance inputs for allcandidate Phase 3 profiles were developed on the real-time
simulation workstation associated with the VMS. The po-
tential for use of the XV-15's full flap position, rarely useddue to its higher hover download, was noted during this de-
velopment. The 75 deg flap position provided a more desir-
able body pitch attitude while increasing the rotor-enginepower requirement to a more controllable state during steep
descents. The profiles were then implemented for the test
aircraft guidance system, then checked and evaluated in theXV 15 simulator at Bell. Based on feedback from the pi-
lots, these approach profiles were further modified beforethe beginning of the Phase 3 testing. Once testing began, all
of the approaches were then evaluated in the aircraft itself,and further refinements were made if necessary. Once the
approach profiles were finalized, multiple repeats of eachone were made over the microphone array. Since the array
used in the Phase 3 testing could accommodate two flight
directions, 180 deg apart, no adaptation for tailwinds was
required during this testing.
RESULTS AND ANALYSIS
Data Repeatability
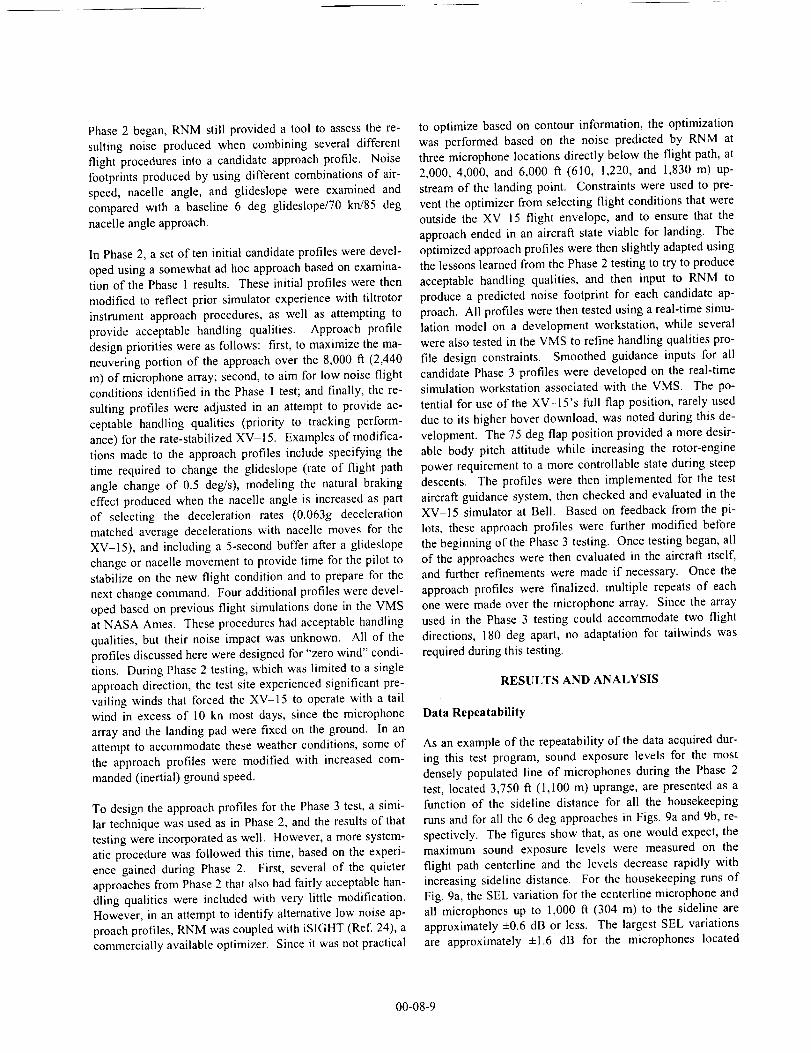
As an example of the repeatability of the data acquired dur-
ing this test program, sound exposure levels for the mostdensely populated line of microphones during the Phase 2
test, located 3,750 ft (1,100 m) uprange, are presented as afunction of the sideline distance for all the housekeeping
runs and for all the 6 deg approaches in Figs. 9a and 9b, re-spectively. The figures show that, as one would expect, the
maximum sound exposure levels were measured on the
flight path centerline and the levels decrease rapidly withincreasing sideline distance. For the housekeeping runs ofFig. 9a, the SEL variation for the centerline microphone and
all microphones up to 1,000 ft (304 m) to the sideline areapproximately ±0.6 dB or less. The largest SEL variations
are approximately +1.6 dB for the microphones located
00-08-9
1,500and2,000ft (460 and 610 m) to the sideline. Fig. 9b
shows that the SEL variations for the 6 deg approaches wasapproximately ±2.25 dB or less for all microphones, except
the farthest-out microphone located 2,000 ft (610 m) to the
sideline, which had a slightly greater variation of± 2.75 dB.These variations are consistent with what was measured dur-
ing the Phase 1 and Phase 3 tests.
PHASE 1 RESULTS
The types of analyses that were used to judge the relativenoise levels of all the steady-state approaches flown during
Phase 1 testing are presented below. In addition, lowerhemispherical noise contours were developed for all Phase 1
approaches and level flyovers, and used as input to RNM.When there were multiple runs of the same flight condition,
the data were averaged over those runs to provide a single
average noise hemisphere. A total of 76 hemispheres weregenerated, including 3 deg, 6 deg, 9 deg, and 12 deg ap-
proaches for a range of airspeeds and nacelle angles.
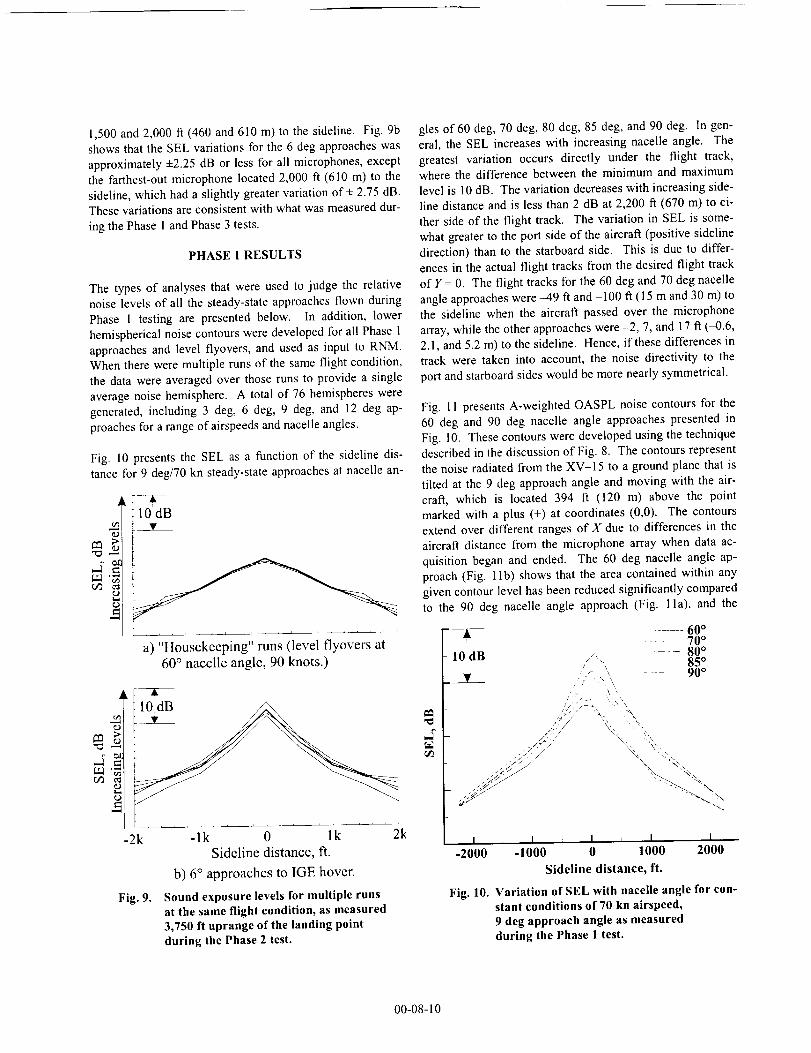
Fig. 10 presents the SEL as a function of the sideline dis-
tance for 9 deg/70 kn steady-state approaches at nacelle an-
a) "Housekeeping" runs (level flyovers at60 ° nacellc angle, 90 knots.)
"-d
-2k -lk 0 lk 2k
Fig. 9.
Sideline distance, ft.
b) 6° approaches to IGE hover.
Sound exposure levels for multiple runsat the same flight condition, as measured3,750 ft uprange of the landing pointduring the Phase 2 test.
gles of 60 deg, 70 deg, 80 deg, 85 deg, and 90 deg. In gen-
eral, the SEL increases with increasing nacelle angle. Thegreatest variation occurs directly under the flight track,where the difference between the minimum and maximum
level is 10 dB. The variation decreases with increasing side-
line distance and is less than 2 dB at 2,200 ft (670 m) to ei-
ther side of the flight track. The variation in SEL is some-what greater to the port side of the aircraft (positive sideline
direction) than to the starboard side. This is due to differ-
ences in the actual flight tracks from the desired flight track
of Y = 0. The flight tracks for the 60 deg and 70 deg nacelleangle approaches were-49 ft and -100 ft (15 m and 30 m) to
the sideline when the aircraft passed over the microphonearray, while the other approaches were -2, 7, and 17 fl (-0.6,
2.1, and 5.2 m) to the sideline. Hence, if these differences intrack were taken into account, the noise directivity to the
port and starboard sides would be more nearly symmetrical.
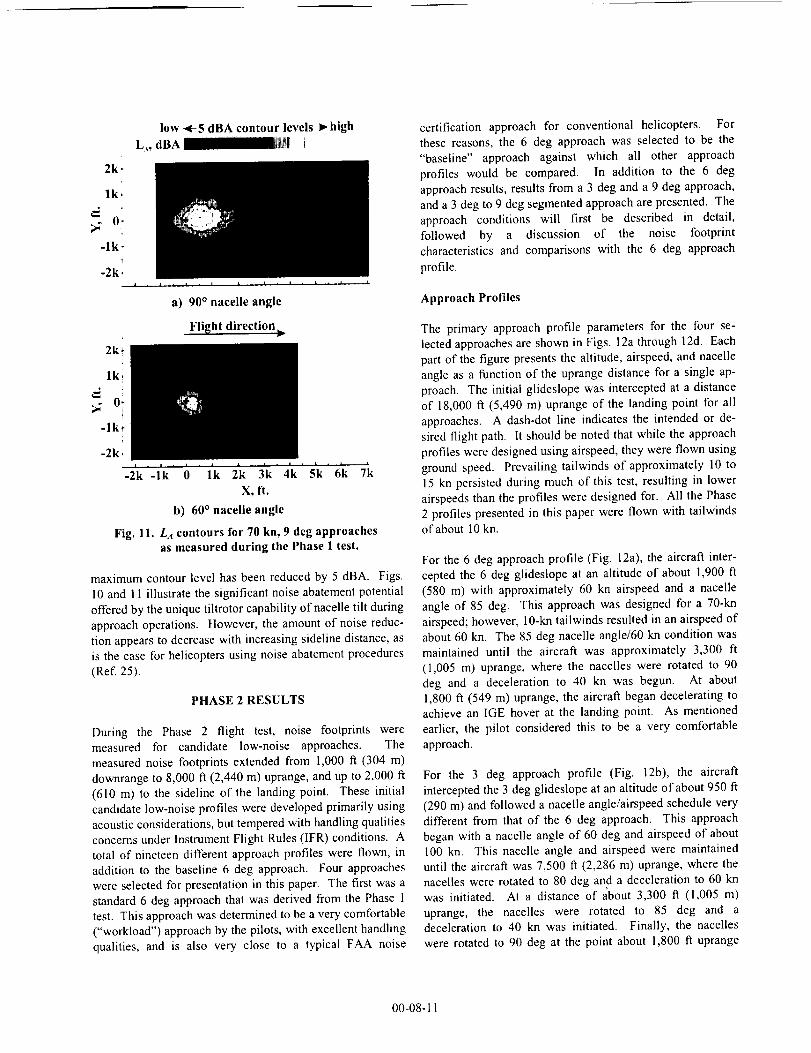
Fig. 11 presents A-weighted OASPL noise contours for the
60 deg and 90 deg nacelle angle approaches presented inFig. 10. These contours were developed using the technique
described in the discussion of Fig. 8. The contours representthe noise radiated from the XV-15 to a ground plane that is
tilted at the 9 deg approach angle and moving with the air-
craft, which is located 394 fi (120 m) above the pointmarked with a plus (+) at coordinates (0,0). The contours
extend over different ranges of X due to differences in theaircraft distance from the microphone array when data ac-
quisition began and ended. The 60 deg nacelle angle ap-proach (Fig. 1 lb) shows that the area contained within any
given contour level has been reduced significantly compared
to the 90 deg nacelle angle approach (Fig. l la), and the
X ;',/,"d
c/3
I I I I I I I
-2000 -1000 0 1000 2000
Sideline distance, ft.
Fig. 10. Variation of SEL with nacelle angle for con-stant conditions of 70 kn airspeed,
9 deg approach angle as measuredduring the Phase 1 test.
00-08-10
2k ¸.
lk,
p= O"
-lk
-2k,
2k-
lk,
0:.
-Ik;
-2k,
low 4- 5 dBA contour leveis-_high
L,, dBA_+_ i
I . [ , 1 I I [ I ) I [ J [ I I
a) 90 ° nacelle angle
Flight direction _,
-2'k -l'k () _ l'k 2_k 3'k'4'k' 5'k'6'k 7k
X, It.
b) 60 ° nacelle angle
Fig. 11. La contours for 70 kn, 9 deg approachesas measured during the Phase 1 test.
maximum contour level has been reduced by 5 dBA. Figs.10 and 11 illustrate the significant noise abatement potential
offered by the unique tiltrotor capability of nacelle tilt duringapproach operations. However, the amount of noise reduc-
tion appears to decrease with increasing sideline distance, as
is the case for helicopters using noise abatement procedures(Ref. 25).
PHASE 2 RESULTS
During the Phase 2 flight test, noise footprints were
measured for candidate low-noise approaches. Themeasured noise footprints extended from 1,000 ft (304 m)
downrange to 8,000 ft (2,440 m) uprange, and up to 2,000 fi(610 m) to the sideline of the landing point. These initial
candidate low-noise profiles were developed primarily usingacoustic considerations, but tempered with handling qualities
concerns under Instrument Flight Rules (IFR) conditions. Atotal of nineteen different approach profiles were flown, in
addition to the baseline 6 deg approach. Four approacheswere selected for presentation in this paper. The first was a
standard 6 deg approach that was derived from the Phase Itest. This approach was determined to be a very comfortable
("workload") approach by the pilots, with excellent handlingqualities, and is also very close to a typical FAA noise
certification approach for conventional helicopters. For
these reasons, the 6 deg approach was selected to be the"baseline" approach against which all other approach
profiles would be compared. In addition to the 6 deg
approach results, results from a 3 deg and a 9 deg approach,and a 3 deg to 9 deg segmented approach are presented. The
approach conditions will first be described in detail,followed by a discussion of the noise footprint
characteristics and comparisons with the 6 deg approach
profile.
Approach Profiles
The primary approach profile parameters for the four se-
lected approaches are shown in Figs. 12a through 12d. Eachpart of the figure presents the altitude, airspeed, and nacelle
angle as a function of the uprange distance for a single ap-
proach. The initial glideslope was intercepted at a distanceof 18,000 fi (5,490 m) uprange of the landing point for all
approaches. A dash-dot line indicates the intended or de-
sired flight path. It should be noted that while the approachprofiles were designed using airspeed, they were flown using
ground speed. Prevailing tailwinds of approximately 10 to
15 kn persisted during much of this test, resulting in lowerairspeeds than the profiles were designed for. All the Phase
2 profiles presented in this paper were flown with tailwindsof about 10 kn.
For the 6 deg approach profile (Fig. 12a), the aircraft inter-
cepted the 6 deg glideslope at an altitude of about 1,900 ft(580 m) with approximately 60 kn airspeed and a nacelle
angle of 85 deg. This approach was designed for a 70-kn
airspeed; however, 10-kn tailwinds resulted in an airspeed ofabout 60 kn. The 85 deg nacelle angle/@ kn condition was
maintained until the aircraft was approximately 3,300 fi(1,005 m) uprange, where the nacelles were rotated to 90
deg and a deceleration to 40 kn was begun. At about1,800 ft (549 m) uprange, the aircraft began decelerating to
achieve an IGE hover at the landing point. As mentionedearlier, the pilot considered this to be a very comfortable
approach.
For the 3 deg approach profile (Fig. 12b), the aircraftintercepted the 3 deg glideslope at an altitude of about 950 ft
(290 m) and followed a nacelle angle/airspeed schedule very
different from that of the 6 deg approach. This approachbegan with a nacelle angle of 60 deg and airspeed of about
100 kn. This nacelle angle and airspeed were maintaineduntil the aircraft was 7,500 f_ (2,286 m) uprange, where the
nacelles were rotated to 80 deg and a deceleration to 60 knwas initiated. At a distance of about 3,300 ft (1,005 m)
uprange, the nacelles were rotated to 85 deg and a
deceleration to 40 kn was initiated. Finally, the nacelleswere rotated to 90 deg at the point about 1,800 ft uprange
00-08-11
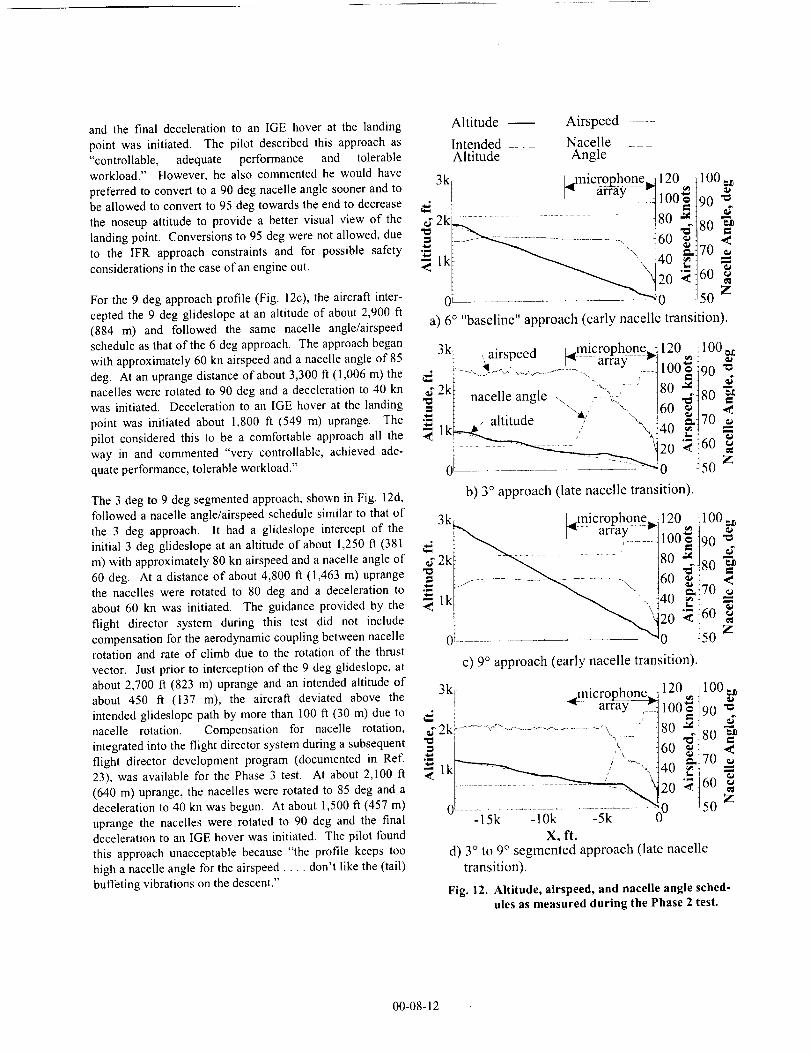
andthefinaldecelerationtoanIGEhoveratthelandingpointwasinitiated.Thepilotdescribedthisapproachas"controllable,adequateperformanceand tolerableworkload."However,healsocommentedhewouldhavepreferredtoconverttoa90degnacelleanglesoonerandtobeallowedtoconvertto95degtowardstheendtodecreasethenoseupattitudeto providea bettervisualviewof thelandingpoint.Conversionsto95degwerenotallowed,dueto theIFRapproachconstraintsandfor possiblesafetyconsiderationsinthecaseofanengineout.
Forthe9degapproachprofile(Fig.12c),theaircraftinter-ceptedthe9degglideslopeatanaltitudeof about2,900ft(884m) andfollowedthesamenacelleangle/airspeedscheduleasthatofthe6degapproach.The approach beganwith approximately 60 kn airspeed and a nacelle angle of 85
deg. At an uprange distance of about 3,300 ft (1,006 m) thenacelles were rotated to 90 deg and a deceleration to 40 kn
was initiated. Deceleration to an IGE hover at the landing
point was initiated about 1,800 ft (549 m) uprange. Thepilot considered this to be a comfortable approach all the
way in and commented "very controllable, achieved ade-quate performance, tolerable workload."
The 3 deg to 9 deg segmented approach, shown in Fig. 12d,followed a nacelle angle/airspeed schedule similar to that of
the 3 deg approach. It had a glideslope intercept of the
initial 3 deg glideslope at an altitude of about 1,250 ft (381m) with approximately 80 kn airspeed and a nacelle angle of
60 deg. At a distance of about 4,800 ft (1,463 m) uprangethe nacelles were rotated to 80 deg and a deceleration to
about 60 kn was initiated. The guidance provided by the
flight director system during this test did not includecompensation for the aerodynamic coupling between nacellerotation and rate of climb due to the rotation of the thrust
vector. Just prior to interception of the 9 deg glideslope, at
about 2,700 tl (823 m) uprange and an intended altitude ofabout 450 fl (137 m), the aircraft deviated above the
intended glideslope path by more than 100 ft (30 m) due tonacelle rotation. Compensation for nacelle rotation,
integrated into the flight director system during a subsequentflight director development program (documented in Ref.23), was available for the Phase 3 test. At about 2,100 ft
(640 m) uprange, the nacelles were rotated to 85 deg and a
deceleration to 40 kn was begun. At about 1,500 ft (457 m)
uprange the nacelles were rotated to 90 deg and the finaldeceleration to an IGE hover was initiated. The pilot found
this approach unacceptable because "the profile keeps toohigh a nacelle angle for the airspeed .... don't like the (tail)buffeting vibrations on the descent."
Altitude Airspeed .......
Intended __ Nacelle ._Altitude Angle
3k /microphone 120 100
........ 100_ i90 '_r
d2k: ..... 8o "tso .a
"-'" 40 _qT0
lk 20 t60O: ............................... _ 0 - 50 ;_
a) 6° "baseline" approach (early nacelle transition).
--microphone3k ,_airspeed _ .... affay .... 1_
._ 2k t nacelle angle \ :_-\-;-
._.. [ .p altitude "_," ",.
120 :100=
100_ i90 "_
4o !7o20 _i 60 ;_0 _50
b) 3 ° approach (late nacelle transition).
3kc lmicror_bone 120 -100
._ _1 array :. ,,_,_ t ._d i _ ,. ...... {luu=e t90 ._2k[ .... ""<.Q ........ t80 _]sm "-_
L.---......... ........ .. 16o 7
i _ "420 :_{60 g
o' "Ma t5o z
c) 9° approach (early nacelle transition).
3k!d_2k} ...... <" ................................. , ."
o!.......................-15k -10k -5k
X, ft.d) 3 ° to 9 ° segmented approach (late nacelle
transition).
Fig. 12. Altitude, airspeed, and nacelle angle sched-ules as measured during the Phase 2 test.
_micrgpho_ne - 120 t 100
-_ffaY _ 100_ !90 q
JO _! <
,0 i7°ZO '_t 60
t5o z
00-08-12
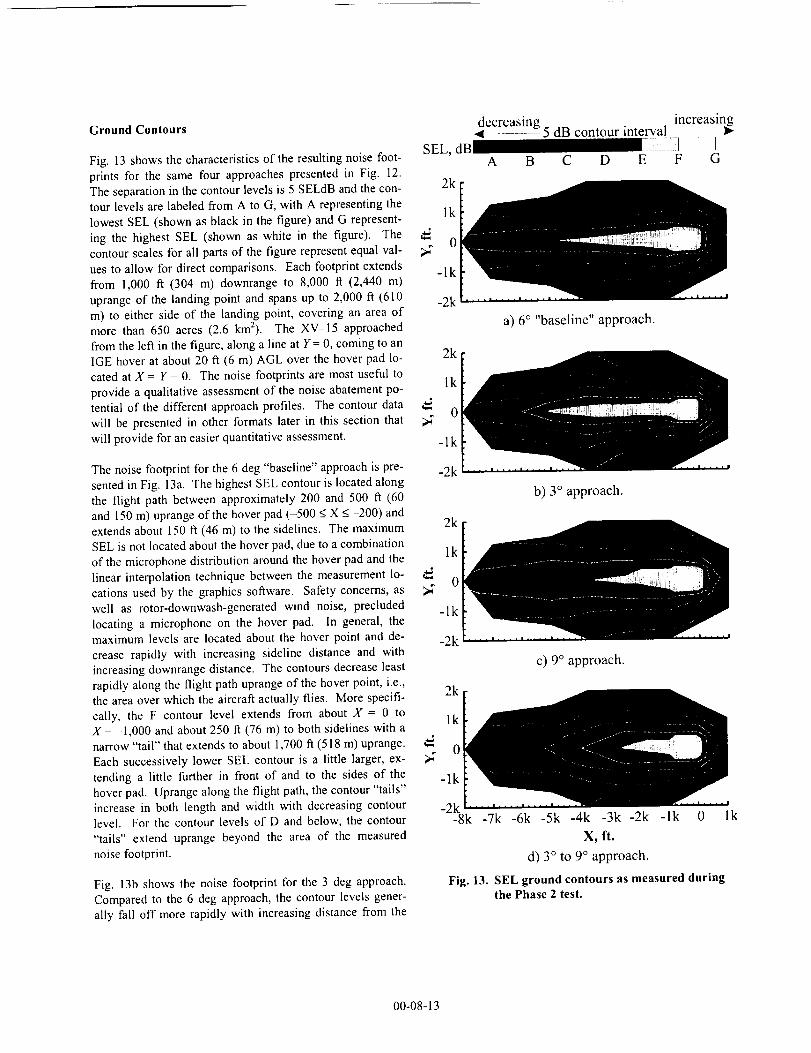
Ground Contours
Fig. 13 shows the characteristics of the resulting noise foot-
prints for the same four approaches presented in Fig. 12.The separation in the contour levels is 5 SELdB and the con- 2k
tour levels are labeled from A to G, with A representing thelk
lowest SEL (shown as black in the figure) and G represent-
ing the highest SEL (shown as white in the figure). The ,_0
contour scales for all parts of the figure represent equal val-
ues to allow for direct comparisons. Each footprint extends -lkfrom 1,000 fi (304 m) downrange to 8,000 fl (2,440 m)
uprange of the landing point and spans up to 2,000 ft (610 -2km) to either side of the landing point, covering an area ofmore than 650 acres (2.6 krn2). The XV-15 approached
from the left in the figure, along a line at Y = 0, coming to anIGE hover at about 20 ft (6 m) AGL over the hover pad lo- 2k
cated at X = Y = 0. The noise footprints are most useful tolk
provide a qualitative assessment of the noise abatement po-tential of the different approach profiles. The contour data ,._
0will be presented in other formats later in this section that ;_will provide for an easier quantitative assessment.
de-c-rea-s!ng 5 dB contour interval increasing
SEL, dB --_J ]A B C D E F G
-lk
The noise footprint for the 6 deg "baseline" approach is pre- -2ksented in Fig. 13a. The highest SEL contour is located along
the flight path between approximately 200 and 500 fl (60and 150 m) uprange of the hover pad (-500 _<X < -200) andextends about 150 fi (46 m) to the sidelines. The maximum 2k
SEL is not located about the hover pad, due to a combinationof the microphone distribution around the hover pad and the 1k
linear interpolation technique between the measurement lo-0
cations used by the graphics software. Safety concerns, as _"
well as rotor-downwash-generated wind noise, precluded -lklocating a microphone on the hover pad. In general, the
maximum levels are located about the hover point and de- -2kcrease rapidly with increasing sideline distance and withincreasing downrange distance. The contours decrease least
rapidly along the flight path uprange of the hover point, i.e.,the area over which the aircraft actually flies. More specifi- 2k
cally, the F contour level extends from about X = 0 tolk
X = -1,000 and about 250 ft (76 m) to both sidelines with anarrow "tail" that extends to about 1,700 ft (518 m) uprange.
0Each successively lower SEL contour is a little larger, ex- _"
tending a little further in front of and to the sides of the -lkhover pad. Uprange along the flight path, the contour "tails"
increase in both length and width with decreasing contourlevel. For the contour levels of D and below, the contour
"tails" extend uprange beyond the area of the measurednoise footprint.
a) 6 ° "baseline" approach.
Fig. 13b shows the noise footprint for the 3 deg approach.
Compared to the 6 deg approach, the contour levels gener-ally fall off more rapidly with increasing distance from the
b) 3 ° approach.
c) 9 ° approach.
-2k-8k -7k -6k -5k -4k -3k -2k -lk 0 Ik
X, ft.
d) 3 ° to 9° approach.
Fig. 13. SEL ground contours as measured duringthe Phase 2 test.
00-08-13
landing point. While the E contour level extends about 500
ft (150 m) further uprange, the D contour level has beenshortened significantly and is contained within the bounda-ries of the measurement area. For the SEL contour levels
below E, the decreased sideline width far uprange indicates
that the uprange lengths of these contours have also been
significantly decreased. This 3 deg approach appears to be-somewhat less noisy compared to the 6 deg approach and in
fact the average SEL for all microphones has been reducedby 3.3 dB.
The noise footprint for the 9 deg approach is presented inFig. 13c. Compared to the 6 deg approach, the contour lev-
els generally fall off less rapidly with increasing distancefrom the landing point. For this approach, the E and F con-
tour levels are a little smaller, while all the contour levels
below E are somewhat larger. This 9 deg approach appearssomewhat louder than the 6 deg approach, even though the
aircraft was at a higher altitude and thus a greater distancefrom the microphones. The average SEL for all micro-
phones has increased by 1.5 dB compared to the 6 deg ap-
proach.
The approach footprint for the 3 deg to 9 deg segmented
approach is presented in Fig. 13d. All SEL contour levelsfor this approach are smaller when compared to those for the
6 deg approach. In fact, the contour levels of E and beloware significantly smaller and contour levels C through G are
all completely contained within the measurement area. Thisapproach appears to be the quietest approach presented with
a reduction in the average SEL of 3.6 dB.
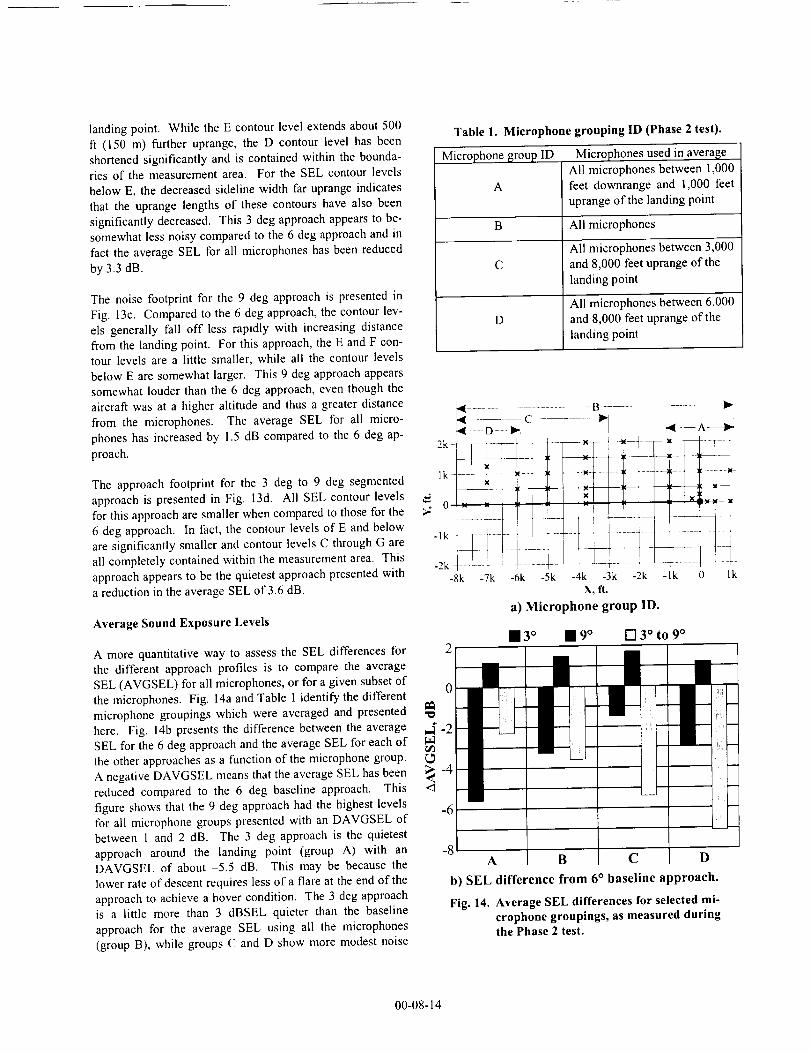
Average Sound Exposure Levels
A more quantitative way to assess the SEL differences forthe different approach profiles is to compare the averageSEL (AVGSEL) for all microphones, or for a given subset of
the microphones. Fig. 14a and Table 1 identify the differentmicrophone groupings which were averaged and presented
here. Fig. 14b presents the difference between the averageSEL for the 6 deg approach and the average SEL for each of
the other approaches as a function of the microphone group.A negative DAVGSEL means that the average SEL has been
reduced compared to the 6 deg baseline approach. This
figure shows that the 9 deg approach had the highest levelsfor all microphone groups presented with an DAVGSEL of
between 1 and 2 dB. The 3 deg approach is the quietestapproach around the landing point (group A) with an
DAVGSEL of about -5.5 dB. This may be because thelower rate of descent requires less of a flare at the end of theapproach to achieve a hover condition. The 3 deg approach
is a little more than 3 dBSEL quieter than the baselineapproach for the average SEL using all the microphones
(group B), while groups C and D show more modest noise
Table 1. Microphone grouping ID (Phase 2 test).
Microphone _;roup ID
A
Microphones used in average
All microphones between 1,000feet downrange and 1,000 feet
uprange of the landing point
B All microphones
All microphones between 3,000C and 8,000 feet uprange of the
landing point
All microphones between 6,000D and 8,000 feet uprange of the
landing point
i-lk
// /
-8k -7k -6k -5k -4k -3k -2k -lk 0X, ft.
a) Microphone group ID.
lk
• 3 ° • 9° [] 3 ° to 9 °
A B C D
b) SEL difference from 6 ° baseline approach.
Fig. 14. Average SEL differences for selected mi-crophone groupings, as measured duringthe Phase 2 test.
00-08-14
reductionsofabout-1.5and-3dBSEL,respectively.The3degto9degapproachshowsthegreatestnoisereductionforallmicrophonegroupsexceptaroundthehoverpad.Thenoisebenefitsforthisapproachincreaseasyoumovetotheprogressivelyuprangemicrophonesets.ForgroupD,theaverageSELhasbeenreducedbymorethan7 dBSELcomparedto the6 degbaselineapproach.This figure
indicates that the 3 deg to 9 deg approach provides thegreatest noise abatement for all areas of the measured
footprint, except near the landing point.
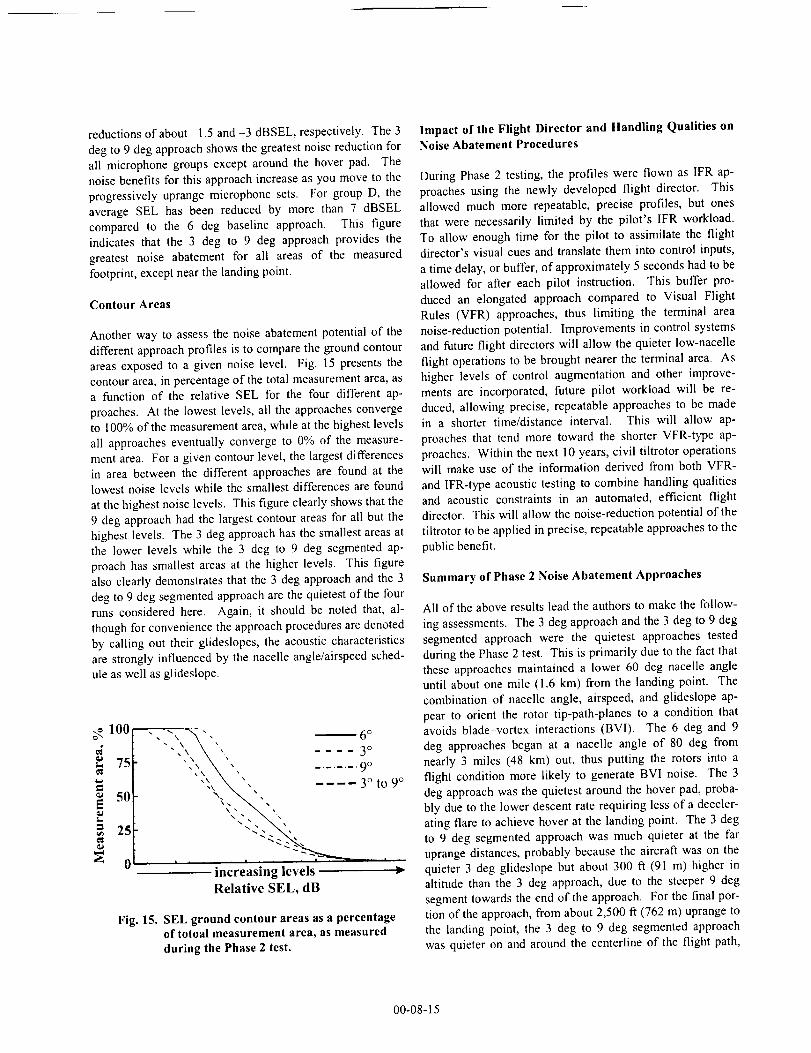
Contour Areas
Another way to assess the noise abatement potential of thedifferent approach profiles is to compare the ground contour
areas exposed to a given noise level. Fig. 15 presents thecontour area, in percentage of the total measurement area, as
a function of the relative SEL for the four different ap-proaches. At the lowest levels, all the approaches converge
to 100% of the measurement area, while at the highest levels
all approaches eventually converge to 0% of the measure-ment area. For a given contour level, the largest differences
in area between the different approaches are found at thelowest noise levels while the smallest differences are found
at the highest noise levels. This figure clearly shows that the
9 deg approach had the largest contour areas for all but thehighest levels. The 3 deg approach has the smallest areas at
the lower levels while the 3 deg to 9 deg segmented ap-proach has smallest areas at the higher levels. This figure
also clearly demonstrates that the 3 deg approach and the 3
deg to 9 deg segmented approach are the quietest of the fourruns considered here. Again, it should be noted that, al-
though for convenience the approach procedures are denotedby calling out their glideslopes, the acoustic characteristics
are strongly influenced by the nacelle angle/airspeed sched-ule as well as glideslope.
100
_- 75
50E
= 25
¢d
o
"."_. --_", 6°"-,,\ \ ,, .... 30
,,\ x O',_, \ , ........ 9,, " o 9°"_,\ _ ,, .... 3 to
increasing levels
Relative SEL, dB
Fig. 15. SEL ground contour areas as a percentageof totoal measurement area, as measuredduring the Phase 2 test.
Impact of the Flight Director and Handling Qualities onNoise Abatement Procedures
During Phase 2 testing, the profiles were flown as IFR ap-
proaches using the newly developed flight director. Thisallowed much more repeatable, precise profiles, but ones
that were necessarily limited by the pilot's IFR workload.To allow enough time for the pilot to assimilate the flight
director's visual cues and translate them into control inputs,
a time delay, or buffer, of approximately 5 seconds had to be
allowed for after each pilot instruction. This buffer pro-duced an elongated approach compared to Visual Flight
Rules (VFR) approaches, thus limiting the terminal areanoise-reduction potential. Improvements in control systems
and future flight directors will allow the quieter low-nacelle
flight operations to be brought nearer the terminal area. Ashigher levels of control augmentation and other improve-
ments are incorporated, future pilot workload will be re-duced, allowing precise, repeatable approaches to be made
in a shorter time/distance interval. This will allow ap-proaches that tend more toward the shorter VFR-type ap-
proaches. Within the next 10 years, civil tiltrotor operationswill make use of the information derived from both VFR-
and IFR-type acoustic testing to combine handling qualities
and acoustic constraints in an automated, efficient flightdirector. This will allow the noise-reduction potential of the
tiltrotor to be applied in precise, repeatable approaches to the
public benefit.
Summary of Phase 2 Noise Abatement Approaches
All of the above results lead the authors to make the follow-
ing assessments. The 3 deg approach and the 3 deg to 9 degsegmented approach were the quietest approaches tested
during the Phase 2 test. This is primarily due to the fact thatthese approaches maintained a lower 60 deg nacelle angle
until about one mile (1.6 kin) from the landing point. Thecombination of nacelle angle, airspeed, and glideslope ap-
pear to orient the rotor tip-path-planes to a condition thatavoids blade-vortex interactions (BVI). The 6 deg and 9
deg approaches began at a nacelle angle of 80 deg fromnearly 3 miles (48 kin) out, thus putting the rotors into a
flight condition more likely to generate BVI noise. The 3
deg approach was the quietest around the hover pad, proba-bly due to the lower descent rate requiring less of a deceler-
ating flare to achieve hover at the landing point. The 3 degto 9 deg segmented approach was much quieter at the faruprange distances, probably because the aircraft was on the
quieter 3 deg glideslope but about 300 ft (91 m) higher inaltitude than the 3 deg approach, due to the steeper 9 deg
segment towards the end of the approach. For the final por-tion of the approach, from about 2,500 ft (762 m) uprange to
the landing point, the 3 deg to 9 deg segmented approachwas quieter on and around the centerline of the flight path,
00-08-15
while the 3 deg approach was quieter to the sidelines. This
was probably because the 3 deg to 9 deg approach had tran-
sitioned to the noisier condition of the 9 deg glideslope.
Comparing the 3 deg, 6 deg, and 9 deg approaches, the 6 deg 1500
approach tended to be the loudest on centerline at all
uprange distances measured; however, this difference was _ 1000
usually quite small. The noise levels to the sidelines at all "o
uprange distances increased with increasing glideslope an- ._
gle. Noise levels around the landing point also increased _ 500
with increasing glideslope angle. Overall, the 9 deg ap-
proach was the loudest and the 3 deg approach was the qui-
etest.
PHASE 3 RESULTS
The purpose of the Phase 3 test was to quantify the noise
reduction provided by optimized noise abatement ap-
proaches. The design process for the approach profiles that
were tested used results from the Phase 1 and Phase 2 tests
while fully coupling noise reduction with handling qualities.
The flight director system was modified in an attempt to
compensate for the aerodynamic coupling between nacelle
rotation and rate of climb due to the rotation of the thrust
vector. Noise footprints were measured for a rectangular
grid that extended from 1,000 ft to 9,000 ft (304 m to
2,743 m) uprange and 2,000 fl (610 m) to the sideline of the
landing point. A total of eight different approach profiles
were flown, in addition to the 6 deg baseline approach. The
6 deg baseline approach profile tested in Phase 3 was, for all
practical purposes, identical to the one flown during the
Phase 2 test (Fig. 12a). Two low-noise approaches profiles
have been selected for presentation here, the 3 deg approach
and a 3 deg to 9 deg segmented approach. Each of these
approaches was flown six times during this test, and the
acoustic values presented are the average values over the six
runs. These approach profiles were selected for presentation
because the 3 deg profile provided significant and uniform
noise reduction over the entire measurement area, while the
3 deg to 9 deg profile provided the greatest noise reductions
at the areas farther uprange. The approach conditions and
the average noise footprints are presented, followed by com-
parisons to the 6 deg baseline approach.
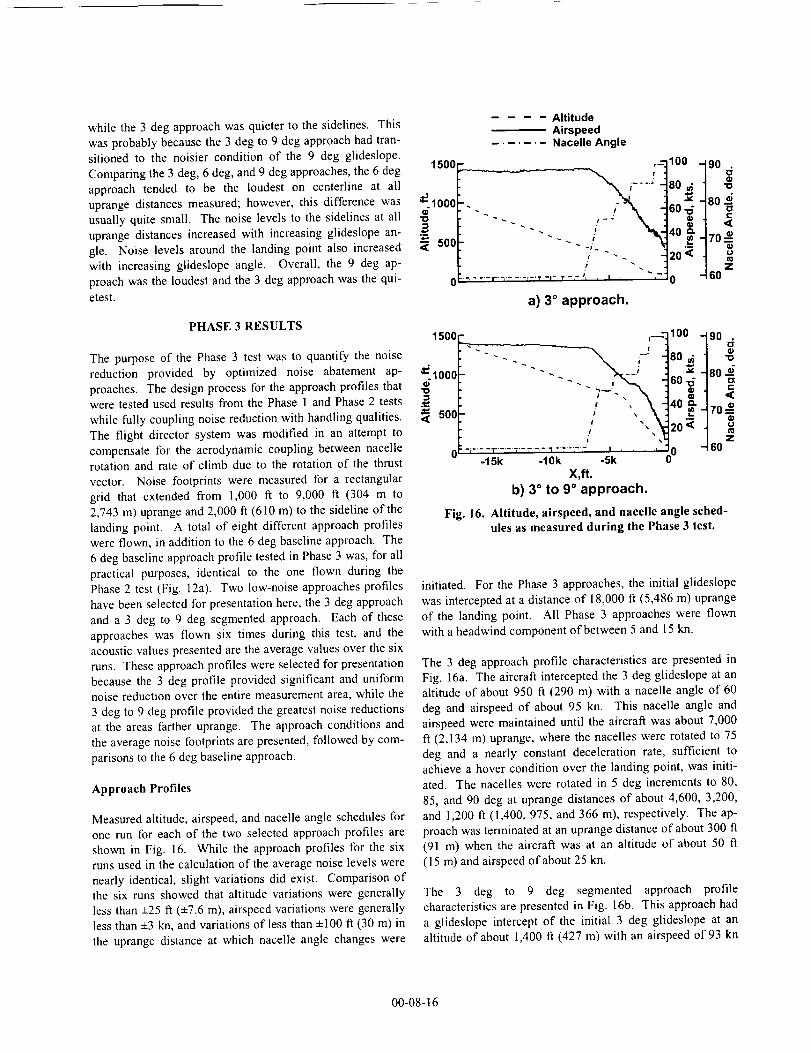
Approach Profiles
Measured altitude, airspeed, and nacelle angle schedules for
one run for each of the two selected approach profiles are
shown in Fig. 16. While the approach profiles for the six
runs used in the calculation of the average noise levels were
nearly identical, slight variations did exist. Comparison of
the six runs showed that altitude variations were generally
less than +25 ft (+7.6 m), airspeed variations were generally
less than +3 kn, and variations of less than +100 ft (30 m) in
the uprange distance at which nacelle angle changes were
AltitudeAirspeed
....... Nacelle Angle
t
", ..... I-",'-r'-_"Y -I-_T -L- Jk _ | i , i
a) 3 ° approach.
_1oo - 90 .
18o_ -_
leO=- 80® <
[40 70,="
120 < oz
l0 - 60
1500
_1000qD
"0
500
- [,_-100 - 90 ¢_
"" - --J a0 a _'
"-.. _, 804! , 40 __ 70
/ ",,z!
-i"_-T"i'_"--,-T''","- L I , , , ' ")0 - _0-15k -1Ok -5k
X,ft.
b) 3 ° to 9 ° approach.
Fig. 16. Altitude, airspeed, and nacelle angle sched-
ules as measured during the Phase 3 test.
initiated. For the Phase 3 approaches, the initial glideslope
was intercepted at a distance of 18,000 ft (5,486 m) uprange
of the landing point. All Phase 3 approaches were flown
with a headwind component of between 5 and 15 kn.
The 3 deg approach profile characteristics are presented in
Fig. 16a. The aircraft intercepted the 3 deg glideslope at an
altitude of about 950 ft (290 m) with a nacelle angle of 60
deg and airspeed of about 95 kn. This nacelle angle and
airspeed were maintained until the aircraft was about 7,000
ft (2,134 m) uprange, where the nacelles were rotated to 75
deg and a nearly constant deceleration rate, sufficient to
achieve a hover condition over the landing point, was initi-
ated. The nacelles were rotated in 5 deg increments to 80,
85, and 90 deg at uprange distances of about 4,600, 3,200,
and 1,200 ft (1,400, 975, and 366 m), respectively. The ap-
proach was terminated at an uprange distance of about 300 fi
(91 m) when the aircraft was at an altitude of about 50 fl
(15 m) and airspeed of about 25 kn.
The 3 deg to 9 deg segmented approach profile
characteristics are presented in Fig. 16b. This approach had
a glideslope intercept of the initial 3 deg glideslope at an
altitude of about 1,400 fl (427 m) with an airspeed of 93 kn
00-08-16
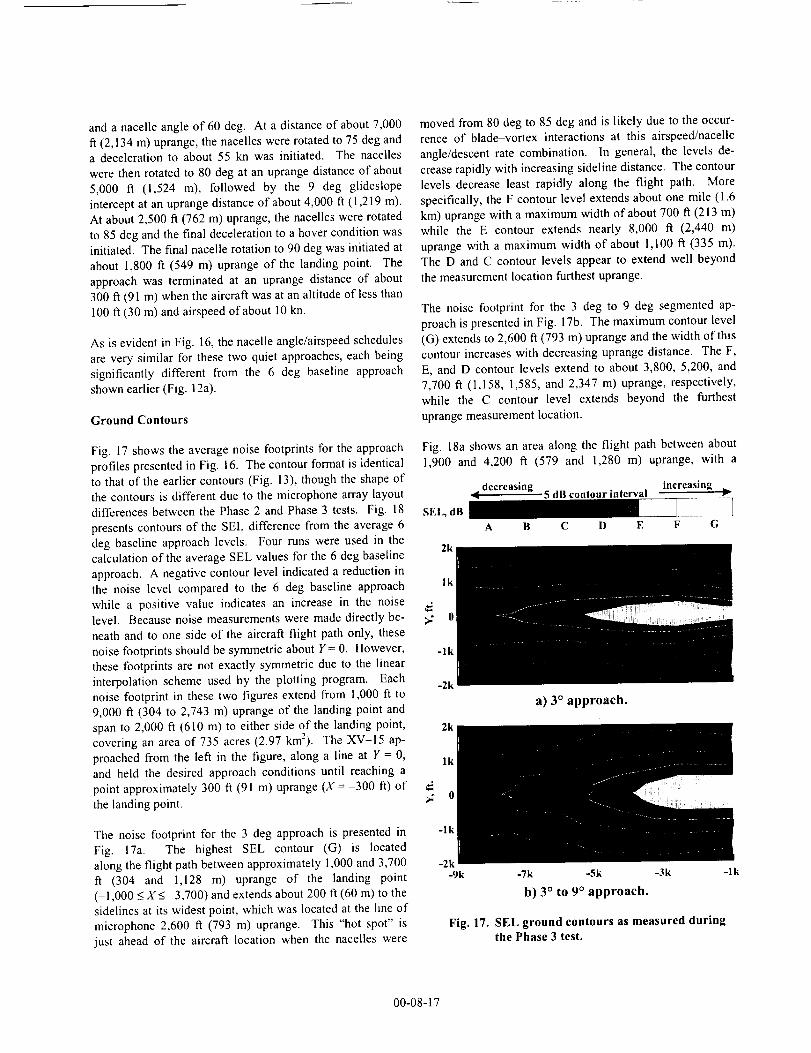
andanacelleangleof60deg.Atadistanceofabout7,000ft (2,134m)uprange,thenacelleswererotatedto75degandadecelerationto about55knwasinitiated.Thenacelleswerethenrotatedto80degatanuprangedistanceofabout5,000ft (1,524m), followedby the9 degglideslopeinterceptatan uprange distance of about 4,000 ft (I,219 m).
At about 2,500 ft (762 m) uprange, the nacelles were rotated
to 85 deg and the final deceleration to a hover condition was
initiated. The final nacelle rotation to 90 deg was initiated at
about 1,800 ft (549 m) uprange of the landing point. The
approach was terminated at an uprange distance of about
300 ft (91 m) when the aircraft was at an altitude of less than
100 ft (30 m) and airspeed of about I0 kn.
As is evident in Fig. 16, the nacelle angle/airspeed schedules
are very similar for these two quiet approaches, each being
significantly different from the 6 deg baseline approach
shown earlier (Fig. 12a).
Ground Contours
moved from 80 deg to 85 deg and is likely due to the occur-
rence of blade-vortex interactions at this airspeed/nacelle
angle/descent rate combination. In general, the levels de-
crease rapidly with increasing sideline distance. The contour
levels decrease least rapidly along the flight path. More
specifically, the F contour level extends about one mile (1.6
km) uprange with a maximum width of about 700 ft (213 m)
while the E contour extends nearly 8,000 ft (2,440 m)
uprange with a maximum width of about 1,100 ft (335 m).
The D and C contour levels appear to extend well beyond
the measurement location furthest uprange.
The noise footprint for the 3 deg to 9 deg segmented ap-
proach is presented in Fig. 17b. The maximum contour level
(G) extends to 2,600 ft (793 m) uprange and the width of this
contour increases with decreasing uprange distance. The F,
E, and D contour levels extend to about 3,800, 5,200, and
7,700 ft (I,158, 1,585, and 2,347 m) uprange, respectively,
while the C contour level extends beyond the furthest
uprange measurement location.
Fig. 17 shows the average noise footprints for the approach
profiles presented in Fig. 16. The contour format is identical
to that of the earlier contours (Fig. 13), though the shape of
the contours is different due to the microphone array layout
differences between the Phase 2 and Phase 3 tests. Fig. 18
presents contours of the SEL difference from the average 6
deg baseline approach levels. Four runs were used in the 2kcalculation of the average SEL values for the 6 deg baseline
approach. A negative contour level indicated a reduction in
the noise level compared to the 6 deg baseline approach l k
while a positive value indicates an increase in the noise
level. Because noise measurements were made directly be- _- 0
neath and to one side of the aircraf_ flight path only, these
noise footprints should be symmetric about Y= 0. However, -lk
these footprints are not exactly symmetric due to the linear
interpolation scheme used by the plotting program. Each-2k
noise footprint in these two figures extend from 1,000 fl to
9,000 fl (304 to 2,743 m) uprange of the landing point and
span to 2,000 ft (610 m) to either side of the landing point, 2k
covering an area of 735 acres (2.97 kin2). The XV-15 ap-
proached from the left in the figure, along a line at Y = 0,
and held the desired approach conditions until reaching a
point approximately 300 ft (91 m) uprange (X = -300 ft) of
the landing point.
The noise footprint for the 3 deg approach is presented in
Fig. 17a. The highest SEL contour (G) is located
along the flight path between approximately 1,000 and 3,700
ft (304 and 1,128 m) uprange of the landing point
(-I,000 <X< 3,700) and extends about 200 ft (60 m) to the
sidelines at its widest point, which was located at the line of
microphone 2,600 ft (793 m) uprange. This "hot spot" is
just ahead of the aircraft location when the nacelles were
Fig. 18a shows an area along the flight path between about
1,900 and 4,200 ft (579 and 1,280 m) uprange, with a
_., decreasing 5 dB contour interval increasing _
" iii11Iiiiiii]A B C D E F G
a) 3 ° approach.
lk
0
-Ik
-2k-9k -7k -5k -3k
b) 3 ° to 9 ° approach.
-lk
Fig. 17. SEL ground contours as measured duringthe Phase 3 test.
00-08-17
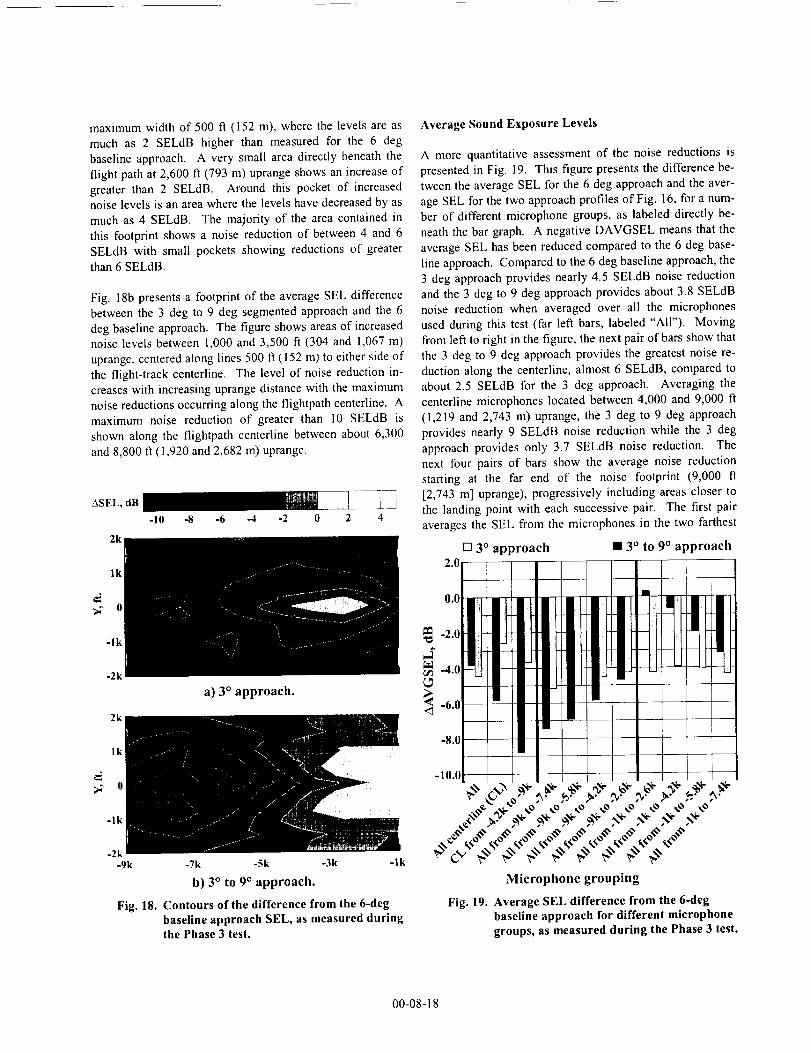
maximumwidthof 500 ft (152 m), where the levels are as
much as 2 SELdB higher than measured for the 6 deg
baseline approach. A very small area directly beneath the
flight path at 2,600 ft (793 m) uprange shows an increase of
greater than 2 SELdB. Around this pocket of increased
noise levels is an area where the levels have decreased by as
much as 4 SELdB. The majority of the area contained in
this footprint shows a noise reduction of between 4 and 6
SELdB with small pockets showing reductions of greater
than 6 SELdB.
Fig. 18b presents a footprint of the average SEL difference
between the 3 deg to 9 deg segmented approach and the 6
deg baseline approach. The figure shows areas of increased
noise levels between 1,000 and 3,500 ft (304 and 1,067 m)
uprange, centered along lines 500 ft (152 m) to either side of
the flight-track centerline. The level of noise reduction in-
creases with increasing uprange distance with the maximum
noise reductions occurring along the flightpath centerline. A
maximum noise reduction of greater than 10 SELdB is
shown along the flightpath centerline between about 6,300
and 8,800 ft (1,920 and 2,682 m) uprange.
ASEI,,dB ......... _--j_
-10 -8 -6 -4 -2 0 2 4
2k
lk
0
-Ik
-2k
2k
a) 3 ° approach.
lk
0
-lk
-2k'-9k -7k -5k -3k -! k
h) 3 ° to 9 ° approach.
Fig. 18. Contours of the difference from the 6-deg
baseline approach SEL, as measured duringthe Phase 3 test.
Average Sound Exposure Levels
A more quantitative assessment of the noise reductions is
presented in Fig. 19. This figure presents the difference be-
tween the average SEL for the 6 deg approach and the aver-
age SEL for the two approach profiles of Fig. 16, for a num-
ber of different microphone groups, as labeled directly be-
neath the bar graph. A negative DAVGSEL means that the
average SEL has been reduced compared to the 6 deg base-
line approach. Compared to the 6 deg baseline approach, the
3 deg approach provides nearly 4.5 SELdB noise reduction
and the 3 deg to 9 deg approach provides about 3.8 SELdB
noise reduction when averaged over all the microphones
used during this test (far left bars, labeled "All"). Moving
from left to right in the figure, the next pair of bars show that
the 3 deg to 9 deg approach provides the greatest noise re-
duction along the centerline, almost 6 SELdB, compared to
about 2.5 SELdB for the 3 deg approach. Averaging the
centerline microphones located between 4,000 and 9,000 ft
(1,219 and 2,743 m) uprange, the 3 deg to 9 deg approach
provides nearly 9 SELdB noise reduction while the 3 deg
approach provides only 3.7 SELdB noise reduction. The
next four pairs of bars show the average noise reduction
starting at the far end of the noise footprint (9,000 ft
[2,743 m] uprange), progressively including areas closer to
the landing point with each successive pair. The first pair
averages the SEL from the microphones in the two farthest
[] 3 ° approach • 3 ° to 9 ° approach2.0
0.0
-2.0
_ .-4.0
-I0.0 II
I
llll '! I
!lI
_ _ _- ,_. _. _. _. _. _,. ,_. ,,,.
o,+ o,+ o,+ o,+ o+ ,,,+ o,+ o,+ o,+
Microphone grouping
Fig. 19. Average SEL difference from the 6-deg
baseline approach for different microphone
groups, as measured during the Phase 3 test.
00-08-18
uprange lines of microphones, located 9,000 and 7,400 ft
(2,743 and 2,256 m) uprange. Each of the next three pairsprogressively includes the next line of microphones closer to
the landing point (5,800, 4,200, and 2,600 fi [1,768, 1,280,and 793 m] uprange). This set shows the trend of decreasing
noise reduction with increasing area when starting at the endof the noise footprint farthest from landing point. The 3 deg
to 9 deg approach provides an average of 7.4 SELdB noise
reduction when including the area from 7,400 to 9,000 ft(2,256 and 2,743 m) uprange, and 4.7 SELdB noise reduc-
tion when including the area from 2,600 to 9,000 ft (793 to
2,743 m) uprange. The 3 deg approach shows the sametrend as the 3 deg to 9 deg approach over these same areas,
but provides less noise reduction, decreasing from5.2 SELdB to 4.3 SELdB noise reduction. The next set of
four pairs of bars is similar to the previous set, except that itincludes the areas starting closest to the landing point and
progressive includes areas farther from the landing point, as
indicated in the figure. The first pair, which includes thearea from 1,000 to 2,600 ft (304 to 793 m) uprange, shows
that the 3 deg approach provided 4.2 SELdB noise reductionwhile the 3 deg to 9 deg approach had a slightly increased
noise level. Noise reduction provided by the 3 deg to 9 deg
approach increased with increasing uprange area with about3.2 SELdB noise reduction over the area from 1,000 to
7,400 ft (304 to 2,256 m) uprange. The 3 deg approach helda relatively constant noise reduction of about 4 SELdB overall the areas included in this set.
Use of Drag Flaps
Poor engine power response and high nose up pitch attitudes
during the initial powered-lift portion (60 deg nacelle angle)
of steep, low-powered descents resulted in less than desir-able handling qualities ratings. Increasing the flap positionfrom the normal maximum setting of 40 deg to the vehicle
limit of 75 deg would increase the nosedown pitching mo-ment and increase the aerodynamic drag. Increased drag
requires increased thrust and, hence, increased power tomaintain the same airspeed, potentially moving the engine
power into a better response region. In addition, the in-creased thrust in the X-direction will alter the rotor tip-path-
plane and rotor wake geometry, thus altering the BVI noisecharacteristics (Ref. 26).
Almost all XV 15 testing, including the Phase 1 and Phase 2acoustics tests discussed in this paper, has been done using a
maximum flap setting of 40 deg because earlier testing re-vealed increased hover downloads with the 75 deg flap posi-tion. One approach profile, identified during profile devel-
opment and confirmed early in the Phase 3 test, was selectedfor testing at the 75 deg flap setting. This was the first time
in many years the XV 15 had been flown at this flap setting.Pilot comments during the flight immediately confirmed the
desirability of full flap use. At 90 kn and 60 deg nacelleangle, the body attitude was reduced from an uncomfortable
8 deg with 40 deg flaps to an acceptable 3 deg with 75 degflaps. The post-flight debrief revealed several additionalbenefits. Tail buffet was reduced from "moderate" to
"minimal." Further, sloppy lateral control that occurred with
the high body pitch attitude and low power setting was im-
mediately tightened up, resulting in greatly reduced pilotattention to this control function, thus reducing pilot work-
load throughout the required operation. In addition, the
75 deg flap setting provided an average noise reduction ofapproximately 1 SELdB compared to the 40 deg flap setting.
After this point all Phase 3 approach profiles, with the ex-ception of the 3 deg and the 6 deg baseline approach pro-
files, were flown using the 75 deg flap position.
Summary of Phase 3 Noise Abatement Approaches
The purpose of the Phase 3 test was to quantify the noise
reduction potential, compared to the 6 deg baseline ap-
proach, of optimized noise abatement approach profiles thatfully coupled noise reduction with handling qualities con-
cerns. Eight different noise abatement approach profiles, inaddition to the 6 deg baseline approach profile, were flown
repeatedly to obtain statistical confidence in the results. The3 deg approach profile and a 3 deg to 9 deg approach profile
were selected for presentation in this paper. The 75 deg flapsetting was found to greatly improve the handling quality
characteristics of the 3 deg to 9 deg approach profile, while
the 40 deg flap setting provided adequate handling qualitycharacteristics for the 3 deg approach profile. Both these
approach profiles were rated to have acceptable handling
qualities for commercial passenger operations. The 3 degapproach profile provided a very uniform noise reduction
over much of the measured footprint area. A 4 to 6 SELdBnoise reduction was measured over most of the footprintarea, with small areas showing greater than of 6 SELdBnoise reduction. A small area, between 2,000 and 4,000 ft
(610 and 1,219 m) uprange and extending from the center-
line to as much as 500 fl (152 m) to the sideline, showedincreased noise levels of no more than about 2 SELdB. The
3 deg to 9 deg approach profile provided the greatest noise
reductions on the flight path centerline and for the measure-ment areas farther uprange. Slightly less than 6 SELdB
noise reduction was measured when averaged over all thecenterline microphones while nearly 9 SELdB noise reduc-
tion was measured when averaged over the centerline mi-crophones located between 4,200 and 9,000 fl (1,280 and
2,743 m) uprange. Greater than 10 SELdB noise reductionwas measured on centerline for a small area between 6,300
and 8,800 ft (1,920 and 2,682 m) uprange. However, noise
increases were measured between 1,000 and 3,000 ft (304
and 914 m) uprange and up to 1,000 fi (304 m) to eithersideline, with some very small pockets showing as much as a
00-08-19
4 to6 SELdBincrease.Severalother3 degto 9degap-proachprofilesweretestedduringthePhase3test.Someoftheseprofilesprovidednearlyasmuchnoisereductionasthe
selected profile, while others provided significantly less
noise reduction. It is the author's opinion that there is noone single approach profile that will provide the appropriate
noise abatement characteristics to fit all possible landing
sites. Rather, the approach profile will have to be tailored toeach type of landing site. For instance, if the landing site is
located on the top of a building in the center of a city, itmight be appropriate to use a 3 deg approach profile since it
provides the most uniform noise abatement over the entirenoise footprint. However, a 3 deg to 9 deg approach profile
may be more appropriate for a landing site located at an air-
port or an industrial area that is surrounded by residentialneighborhoods. If a landing point can be provided that is at
least 2,000 to 3,000 ft (610 to 914 m) beyond the residentialneighborhoods, then a 3 deg to 9 deg approach profile would
again provide the greatest noise reductions in those sur-rounding neighborhoods.
CONCLUDING REMARKS
Tiltrotor aircraft, with their unique capability to fly at rela-
tively high cruise speeds like an airplane while maintainingthe ability to take off and land vertically, provide a potentialalternate means of transportation that could link major cities
and alleviate some of the demand on airport runway usage.However, noise generated by the large tiltrotor aircraft is a
potential barrier issue for civil market penetration. To ad-dress the issue of noise reduction, NASA initiated an effort
with the goal of reducing the overall tilt-rotor approach noise
within a 40-acre (16 ha) vertiport by 12 dB relative to cur-
rent (1995) technology. The goal is to obtain half the noisereduction through design and half through operations. A
series of three XV-15 acoustic flight tests have been con-ducted by a NASA/Army/Bell Helicopter team to evaluate
the noise reduction potential for tiltrotor aircraft during ter-minal area operations by altering the nacelle an-gle/airspeed/altitude schedule.
During Phase 1 testing, acoustic measurements wereobtained using a linear microphone array to measure the
effective ground-plane noise contours for steady state flightoperations. Results indicated that the takeoff and level
flyover conditions had only a secondary effect on the totalnoise of tiltrotor operations, impacting land areas which are
an order of magnitude less than those impacted duringapproach conditions. In addition, the effective ground-planenoise contours were converted to fixed radius lower
hemispherical noise contours that were used as input to theRNM, which was then used to predict noise footprints for
complex, multisegmented decelerating approaches.
The effective ground-plane noise contours from the Phase 1test, along with the RNM predictions, were used to develop
candidate low noise ILS-type approach profiles for Phase 2
testing. Handling qualities considerations also played animportant role in the design of the noise abatement approach
profiles. An advanced flight guidance system, which waslinked to the DGPS tracking system, was utilized to perform
these complex approach profiles with precision. During
Phase 2 testing a large area microphones array was used todirectly measure the ground noise footprints. Results indi-
cated significant noise abatement potential by varying the
approach profile parameters. In general, noise levels de-creased with decreasing approach angles. The 3 deg to 9
deg approach profile provided the greatest noise abatementat the far uprange distances, probably because the aircraft
was on the quieter 3 deg glideslope, but about 300 ft (91 m)higher in altitude than the 3 deg approach, due to the steeper
9 deg segment during the final portion of the approach. Thenoise reductions measured reflected lower BVI noise genera-
tion resulting from more favorable nacelle an-
gle/airspeed/altitude schedules. The data strongly suggestedapproaching at nacelle angles no higher than 60 deg and
maintaining these low nacelle angles for as long as possible.
The approach profiles from the Phase 2 test that provided the
greatest noise reduction were further optimized and fullycoupled with handling qualities considerations for testing
during the Phase 3 test. In addition, the RNM was linked toan optimizer to develop additional approach profiles. All of
the approach profiles were designed to be IFR approaches
with the goal of achieving a handling qualities rating of threeor better, which is sufficient for commercial passenger
operations. The purpose of the final Phase 3 test was to
demonstrate an integrated system approach to optimize thenoise abatement for low noise approaches while fully
coupling handling qualities with noise reduction, and toquantify the noise reductions provided by these approachprofiles. The use of the 75 deg flap setting was found to
greatly improve the XV-15 handling quality characteristicsduring the steep, low-powered descent conditions that
occurred during many of the approach profiles. Comparedto the 6 deg baseline approach profile, the 3 deg approach
profile provided a relatively uniform 4 to 6 SELdB noisereduction over much of the measurement area. The 3 deg to
9 deg approach profile provided the greatest noise reductions
on the flight path centerline and for the measurement areasfarther uprange. Nearly 6 SELdB noise reduction was
measured when averaged over all the centerline microphones(between 1,000 and 9,000 ft [304 and 2,743 m] uprange)while almost 9 SELdB noise reduction was measured when
averaged over the centerline microphones located between4,200 and 9,000 ft (1,280 and 2,743 m) uprange. Greaterthan 10 SELdB noise reduction was measured on centerline
00-08-20
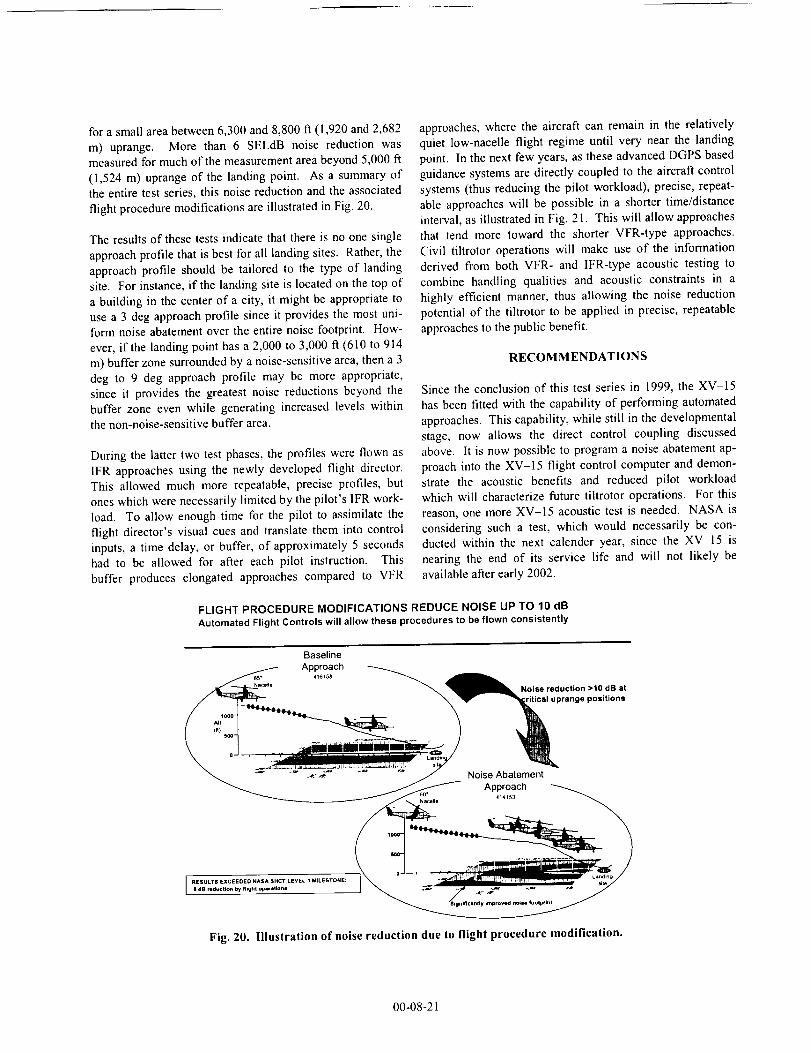
for a small area between 6,300 and 8,800 ft (1,920 and 2,682
m) uprange. More than 6 SELdB noise reduction was
measured for much of the measurement area beyond 5,000 ft
(1,524 m) uprange of the landing point. As a summary of
the entire test series, this noise reduction and the associated
flight procedure modifications are illustrated in Fig. 20.
The results of these tests indicate that there is no one single
approach profile that is best for all landing sites. Rather, the
approach profile should be tailored to the type of landing
site. For instance, if the landing site is located on the top of
a building in the center of a city, it might be appropriate to
use a 3 deg approach profile since it provides the most uni-
form noise abatement over the entire noise footprint. How-
ever, if the landing point has a 2,000 to 3,000 ft (610 to 914
m) buffer zone surrounded by a noise-sensitive area, then a 3
deg to 9 deg approach profile may be more appropriate,
since it provides the greatest noise reductions beyond the
buffer zone even while generating increased levels within
the non-noise-sensitive buffer area.
During the latter two test phases, the profiles were flown as
IFR approaches using the newly developed flight director.
This allowed much more repeatable, precise profiles, but
ones which were necessarily limited by the pilot's IFR work-
load. To allow enough time for the pilot to assimilate the
flight director's visual cues and translate them into control
inputs, a time delay, or buffer, of approximately 5 seconds
had to be allowed for after each pilot instruction. This
buffer produces elongated approaches compared to VFR
approaches, where the aircraft can remain in the relatively
quiet low-nacelle flight regime until very near the landing
point. In the next few years, as these advanced DGPS based
guidance systems are directly coupled to the aircraft control
systems (thus reducing the pilot workload), precise, repeat-
able approaches will be possible in a shorter time/distance
interval, as illustrated in Fig. 21. This will allow approaches
that tend more toward the shorter VFR-type approaches.
Civil tiltrotor operations will make use of the information
derived from both VFR- and IFR-type acoustic testing to
combine handling qualities and acoustic constraints in a
highly efficient manner, thus allowing the noise reduction
potential of the tiltrotor to be applied in precise, repeatable
approaches to the public benefit.
RECOMMENDATIONS
Since the conclusion of this test series in 1999, the XV-15
has been fitted with the capability of performing automated
approaches. This capability, while still in the developmental
stage, now allows the direct control coupling discussed
above. It is now possible to program a noise abatement ap-
proach into the XV-15 flight control computer and demon-
strate the acoustic benefits and reduced pilot workload
which will characterize future tiltrotor operations. For this
reason, one more XV-15 acoustic test is needed. NASA is
considering such a test, which would necessarily be con-
ducted within the next calender year, since the XV-15 is
nearing the end of its service life and will not likely be
available after early 2002.
FLIGHT PROCEDURE MODIFICATIONS REDUCE NOISE UP TO 10 dBAutomated Flight Controls will allow these procedures to be flown consistently
Baseline
Approach
Nr°__cea/e:Ur: tni;en_ OldoBna:
I . ......_ I
Fig. 20. Illustration of noise reduction due to flight procedure modification.
00-08-21
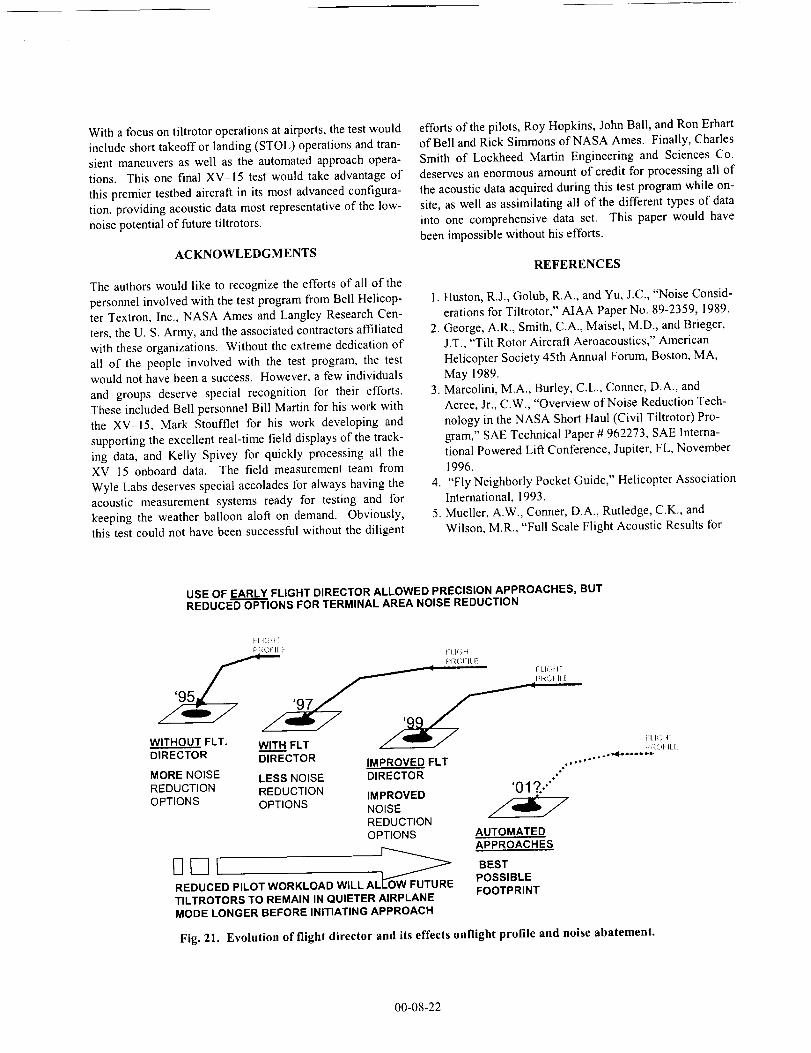
Withafocuson tiltrotor operations at airports, the test would
include short takeoff or landing (STOL) operations and tran-
sient maneuvers as well as the automated approach opera-
tions. This one final XV-15 test would take advantage of
this premier testbed aircraft in its most advanced configura-
tion, providing acoustic data most representative of the low-
noise potential of future tiltrotors.
ACKNOWLEDGMENTS
The authors would like to recognize the efforts of all of the
personnel involved with the test program from Bell Helicop-
ter Textron, Inc., NASA Ames and Langley Research Cen-
ters, the U. S. Army, and the associated contractors affiliated
with these organizations. Without the extreme dedication of
all of the people involved with the test program, the test
would not have been a success. However, a few individuals
and groups deserve special recognition for their efforts.
These included Bell personnel Bill Martin for his work with
the XV-15, Mark Stoufflet for his work developing and
supporting the excellent real-time field displays of the track-
ing data, and Kelly Spivey for quickly processing all the
XV 15 onboard data. The field measurement team from
Wyle Labs deserves special accolades for always having the
acoustic measurement systems ready for testing and for
keeping the weather balloon aloft on demand. Obviously,
this test could not have been successful without the diligent
efforts of the pilots, Roy Hopkins, John Ball, and Run Erhart
of Bell and Rick Simmons of NASA Ames. Finally, Charles
Smith of Lockheed Martin Engineering and Sciences Co.
deserves an enormous amount of credit for processing all of
the acoustic data acquired during this test program while on-
site, as well as assimilating all of the different types of data
into one comprehensive data set. This paper would have
been impossible without his efforts.
REFERENCES
1. Huston, R.J., Golub, R.A., and Yu, J.C., "Noise Consid-
erations for Tiltrotor," AIAA Paper No. 89-2359, 1989.
2. George, A.R., Smith, C.A., Maisel, M.D., and Brieger,
J.T., "Tilt Rotor Aircraft Aeroacoustics," American
Helicopter Society 45th Annual Forum, Boston, MA,
May 1989.
3. Marcolini, M.A., Burley, C.L., Conner, D.A., and
Acree, Jr., C.W., "Overview of Noise Reduction Tech-
nology in the NASA Short Haul (Civil Tiltrotor) Pro-
gram," SAE Technical Paper # 962273, SAE Interna-
tional Powered Lift Conference, Jupiter, FL, November
1996.
4. "Fly Neighborly Pocket Guide," Helicopter Association
International, 1993.
5. Mueller, A.W., Conner, D.A., Rutledge, C.K., and
Wilson, M.R., "Full Scale Flight Acoustic Results for
USE OF EARLY FLIGHT DIRECTOR ALLOWED PRECISION APPROACHES, BUTREDUCED OPTIONS FOR TERMINAL AREA NOISE REDUCTION
FL IC_HT
_k_Ol- II ( ftk_H [
PROFIt E
¢"WITHOUT FLT. WITH FLT
DIRECTOR DIRECTOR IMPROVED FLT
MORE NOISE LESS NOISE DIRECTOR
REDUCTION REDUCTION IMPROVED '01 ?..""
OPTIONS OPTIONS NOISE
REDUCTIONOPTIONS AUTOMATED
APPROACHES
REDUCED PILOT WORKLOAD WILL ALTILTROTORS TO REMAIN IN QUIETER AIRPLANEMODE LONGER BEFORE INITIATING APPROACH
BESTPOSSIBLEFOOTPRINT
PNOt ILL
°_=
°o°
Fig. 21. Evolution of flight director and its effects onflight profile and noise abatement.
00-08-22
the UH-60A Airloads Aircraft," American HelicopterSociety Vertical Lift Aircraft Design Conference, San
Francisco, CA, January 1995.
6. Wilson, M.R., Mueller, A.W., and Rutledge, C.K., "ANew Technique for Estimating Ground Footprint
Acoustics for Rotorcraft Using Measured Sound
Fields," American Helicopter Society Vertical Lift Air-craft Design Conference, San Francisco, CA, January1995.
7. Hindson, W.S., and Chen, R.T.N., "Flight Tests ofNoise Abatement Approaches for Rotorcraft Using Dif-
ferential GPS Guidance," American Helicopter Society51st Annual Forum, Ft. Worth, TX, May 1995.
8. Chen, R.T.N., Hindson, W.S., and Mueller, A.W.,
"Acoustic Flight Tests of Rotorcraft Noise-AbatementApproaches Using Local Differential GPS Guidance,"
American Helicopter Society Specialists Conference onRotorcraft Aeromechanical Technologies, Fairfield
County, CT, October 1995.
9. Jacobs, E.W., O'Connelt, J.M., Conner, D.A., Rutledge,C.K., Wilson, M.R., Shigemoto, F., Chen, R.T.N., and
Fleming, G.G., "Acoustic Flight Testing of a Boeing
MD Explorer and a Sikorsky S-76B Using a Large AreaMicrophone Array," American Helicopter Society
Technical Specialists Meeting for Rotorcraft Acousticsand Aerodynamics, Williamsburg, VA, October 1997.
10. JanakiRam, R.D., O'Connell, J.M., Fredrickson, D.E.,
Conner, D.A., and Rutledge, C.K., "Development and
Demonstration of Noise Abatement Approach Flight
Operations for a Light Twin-Engine Helicopter - MDExplorer," American Helicopter Society Technical Spe-
cialists Meeting for Rotorcraft Acoustics and Aerody-namics, Williamsburg, VA, October 1997.
11. Jacobs, E.W., Prillwitz, R.D, Chen, R.T.N., Hindson,W.S., and Santa Maria, O.L., "The Development and
Flight Test Demonstration of Noise Abatement Ap-
proach Procedures for the Sikorsky S-76," AmericanHelicopter Society Technical Specialists Meeting for
Rotorcraft Acoustics and Aerodynamics, Williamsburg,VA, October 1997.
12. Lee, A., and Mosher, M., "An Acoustical Study of the
XV-15 Tilt Rotor Research Aircraft," AIAA Paper No.79-0612, 1979.
13. Conner, D.A., and Wellman, J.B., "Hover AcousticCharacteristics of the XV- 15 with Advanced Technol-
ogy Blades," AIAA Journal of Aircraft, Volume 31,
Number 4, July-August 1994.14. Brieger, J.T., Maisel, M.D., and Gerdes, R., "External
Noise Evaluation of the XV-I 5 Tilt Rotor Aircraft,"
AHS National Technical Specialists' Meeting on Aero-dynamics and Aeroacoustics, Arlington, TX, February1987.
15. Edwards, B.D., "XV 15 Tiltrotor Aircraft Noise Char-
acteristics," American Helicopter Society 46th Annual
Forum, Washington, DC, May 1990.16. Conner, D.A., Marcolini, M.A., Edwards, B.D., and
Brieger, J.T., "XV 15 Tiltrotor Low Noise Terminal
Area Operations," American Helicopter Society 53rd
Annual Forum, Virginia Beach, VA, April May 1997.17. Conner, D.A., Marcolini, M.A., Decker, W.A., Cline,
J.H., Edwards, B.D., Nicks, C.O., and Klein, PD.,"XV-15 Tiltrotor Low Noise Approach Operations,"
American Helicopter Society 55th Annual Forum,Montreal, Quebec, Canada, May 1999.
18. Lucas, M.J. and Marcolini, M.A., "Rotorcraft NoiseModel," American Helicopter Society Technical Spe-
cialists' Meeting for Rotorcraft Acoustics and Aerody-
namics, Williamsburg, VA, October 1997.19. Conner, D. A., Edwards, B. D., Decker, W. A., Mar-
colini, M. A., and Klein, P. D., "NASA/Army/Bell XV-
15 Tiltrotor Low Noise Terminal Area Operations
Flight Research Program," AIAA-2000-1923, June2000.
20. "Tilt Rotor Research Aircraft Familiarization Docu-
ment," NASA TMX-62407, Jan. 1975.
21. Klein, P.D., and Nicks, C.O., "Flight Director and Ap-proach Profile Development for Civil Tiltrotor Terminal
Area Operations," American Helicopter Society 54thAnnual Forum, Washington, DC, May 1998.
22. Decker, W. A, "Piloted Simulator Investigations of a
Civil Tilt-Rotor Aircraft on Steep Instrument Ap-proaches," American Helicopter Society 48th Annual
Forum, Washington, DC, June 1992.23. Gray, D., Wright, K., and Rowland, W., "A Field-
Deployable Digital Acoustic Measurement System,"Technology 2000 (Proceedings published as NASA CP
3109, Vol. 2), Washington, DC, November 1990.24. Padula, S.L., Korte, J.J., Dunn, HJ., and Salas, A.O.,
"Multidisciplinary Optimization Branch Experience Us-ing iSIGHT Software," NASA TM-1999-209714, No-vember 1999.
25. Yoshikami, S., "Flight Operations Noise Tests of Eight
Helicopters," FAA-EE-85-7, Aug. 1985.
26. Gopalan, G., Schmitz, F.H., and Sim, B.W.-C., "FlightPath Management and Control Methodology to ReduceHelicopter Blade-Vortex Interaction (BVI) Noise,"
American Helicopter Society Vertical Lift Aircraft De-
sign Conference, San Francisco, CA, January 2000.
00-08-23