Influence of Wake Models on Calculated Tiltrotor Aerodynamics · Influence of Wake Models on...
18
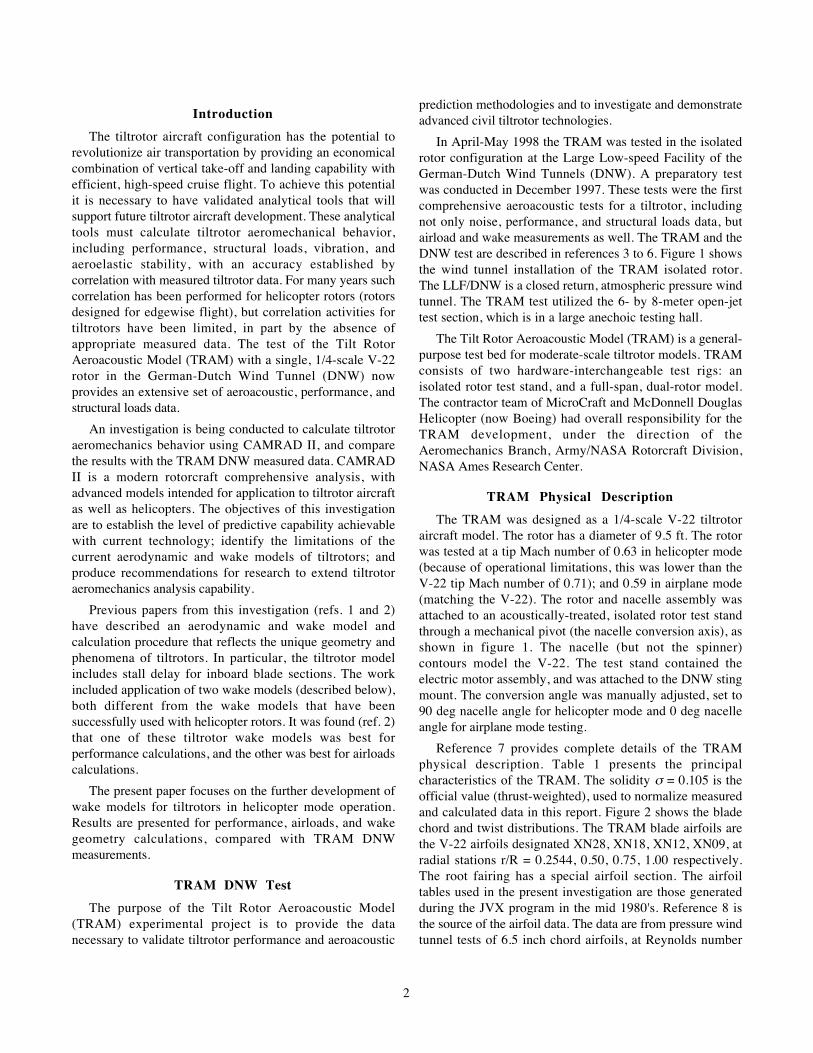
1 Influence of Wake Models on Calculated Tiltrotor Aerodynamics Wayne Johnson Army/NASA Rotorcraft Division NASA Ames Research Center Moffett Field, California Comparisons of measured and calculated aerodynamic behavior of a tiltrotor model are presented. The test of the Tilt Rotor Aeroacoustic Model (TRAM) with a single, 1/4-scale V- 22 rotor in the German-Dutch Wind Tunnel (DNW) provides an extensive set of aeroacoustic, performance, and structural loads data. The calculations were performed using the rotorcraft comprehensive analysis CAMRAD II. Presented are comparisons of measured and calculated performance and airloads for helicopter mode operation, as well as calculated induced and profile power and wake geometry. The focus of this paper is on the further development of wake models for tiltrotors in helicopter mode operation. Three tiltrotor wake models are considered, characterized as the rolled-up, multiple-trailer, and multiple-trailer with consolidation models. By using a free wake geometry calculation method that combines the multiple-trailer wake model with a simulation of the tip vortex formation process (consolidation), good correlation of the calculations with TRAM measurements is obtained for both performance and for airloads. Notation . a speed of sound A rotor disk area, πR 2 c n blade section normal force coefficient, N/( 1 / 2 ρU 2 c) c ref blade reference chord C P rotor power coefficient, P/ρ(ΩR) 3 A = Q/ρ(ΩR) 2 RA C T rotor thrust coefficient, T/ρ(ΩR) 2 A (shaft axes) C X rotor propulsive force coefficient, X/ρ(ΩR) 2 A (wind axes, positive forward) G strength of trailed vorticity M 2 c n blade section normal force coefficient times Mach number squared, N/( 1 / 2 ρa 2 c) M tip blade tip Mach number, ΩR/a ____________ . Presented at the American Helicopter Society Aerodynamics, Acoustics, and Test and Evaluation Technical Specialists Meeting, San Francisco, CA, January 23-25, 2002. This paper is declared a work of the U.S. Government. N number of blades N blade section normal force r blade radial station (0 to R) r c vortex core radius r C centroid of vorticity r G moment (radius of gyration) of vorticity R blade radius P rotor power, P = ΩQ q dynamic pressure, 1 / 2 ρV 2 Q rotor torque T rotor thrust (shaft axes) X rotor propulsive force (wind axes, positive forward) V wind tunnel speed α , α s rotor shaft angle (positive aft, zero for helicopter mode) μ advance ratio, V/ΩR ρ air density σ rotor solidity, Nc ref /πR (σ = 0.105 for TRAM) ψ blade azimuth angle (zero azimuth is downstream) Ω rotor rotational speed
Transcript of Influence of Wake Models on Calculated Tiltrotor Aerodynamics · Influence of Wake Models on...
1
Influence of Wake Models onCalculated Tiltrotor Aerodynamics
Wayne Johnson
Army/NASA Rotorcraft DivisionNASA Ames Research Center
Moffett Field, California
Comparisons of measured and calculated aerodynamic behavior of a tiltrotor model arepresented. The test of the Tilt Rotor Aeroacoustic Model (TRAM) with a single, 1/4-scale V-22 rotor in the German-Dutch Wind Tunnel (DNW) provides an extensive set of aeroacoustic,performance, and structural loads data. The calculations were performed using the rotorcraftcomprehensive analysis CAMRAD II. Presented are comparisons of measured and calculatedperformance and airloads for helicopter mode operation, as well as calculated induced andprofile power and wake geometry. The focus of this paper is on the further development ofwake models for tiltrotors in helicopter mode operation. Three tiltrotor wake models areconsidered, characterized as the rolled-up, multiple-trailer, and multiple-trailer withconsolidation models. By using a free wake geometry calculation method that combines themultiple-trailer wake model with a simulation of the tip vortex formation process(consolidation), good correlation of the calculations with TRAM measurements is obtained forboth performance and for airloads.
Notation.
a speed of sound
A rotor disk area, πR2
cn blade section normal force coefficient,N/(1/2ρU2c)
cref blade reference chord
CP rotor power coefficient, P/ρ(ΩR)3A =Q/ρ(ΩR)2RA
CT rotor thrust coefficient, T/ρ(ΩR)2A (shaft axes)
CX rotor propulsive force coefficient, X/ρ(ΩR)2A(wind axes, positive forward)
G strength of trailed vorticity
M2cn blade section normal force coefficient times Machnumber squared, N/(1/2ρa2c)
Mtip blade tip Mach number, ΩR/a
____________.Presented at the American Helicopter SocietyAerodynamics, Acoustics, and Test and Evaluation TechnicalSpecialists Meeting, San Francisco, CA, January 23-25,2002. This paper is declared a work of the U.S.Government.
N number of blades
N blade section normal force
r blade radial station (0 to R)
rc vortex core radius
rC centroid of vorticity
rG moment (radius of gyration) of vorticity
R blade radius
P rotor power, P = ΩQ
q dynamic pressure, 1/2ρV2
Q rotor torque
T rotor thrust (shaft axes)
X rotor propulsive force (wind axes, positiveforward)
V wind tunnel speed
α , αs rotor shaft angle (positive aft, zero for helicoptermode)
μ advance ratio, V/ΩR
ρ air density
σ rotor solidity, Ncref/πR (σ = 0.105 for TRAM)
ψ blade azimuth angle (zero azimuth is downstream)
Ω rotor rotational speed
2
Introduction
The tiltrotor aircraft configuration has the potential torevolutionize air transportation by providing an economicalcombination of vertical take-off and landing capability withefficient, high-speed cruise flight. To achieve this potentialit is necessary to have validated analytical tools that willsupport future tiltrotor aircraft development. These analyticaltools must calculate tiltrotor aeromechanical behavior,including performance, structural loads, vibration, andaeroelastic stability, with an accuracy established bycorrelation with measured tiltrotor data. For many years suchcorrelation has been performed for helicopter rotors (rotorsdesigned for edgewise flight), but correlation activities fortiltrotors have been limited, in part by the absence ofappropriate measured data. The test of the Tilt RotorAeroacoustic Model (TRAM) with a single, 1/4-scale V-22rotor in the German-Dutch Wind Tunnel (DNW) nowprovides an extensive set of aeroacoustic, performance, andstructural loads data.
An investigation is being conducted to calculate tiltrotoraeromechanics behavior using CAMRAD II, and comparethe results with the TRAM DNW measured data. CAMRADII is a modern rotorcraft comprehensive analysis, withadvanced models intended for application to tiltrotor aircraftas well as helicopters. The objectives of this investigationare to establish the level of predictive capability achievablewith current technology; identify the limitations of thecurrent aerodynamic and wake models of tiltrotors; andproduce recommendations for research to extend tiltrotoraeromechanics analysis capability.
Previous papers from this investigation (refs. 1 and 2)have described an aerodynamic and wake model andcalculation procedure that reflects the unique geometry andphenomena of tiltrotors. In particular, the tiltrotor modelincludes stall delay for inboard blade sections. The workincluded application of two wake models (described below),both different from the wake models that have beensuccessfully used with helicopter rotors. It was found (ref. 2)that one of these tiltrotor wake models was best forperformance calculations, and the other was best for airloadscalculations.
The present paper focuses on the further development ofwake models for tiltrotors in helicopter mode operation.Results are presented for performance, airloads, and wakegeometry calculations, compared with TRAM DNWmeasurements.
TRAM DNW Test
The purpose of the Tilt Rotor Aeroacoustic Model(TRAM) experimental project is to provide the datanecessary to validate tiltrotor performance and aeroacoustic
prediction methodologies and to investigate and demonstrateadvanced civil tiltrotor technologies.
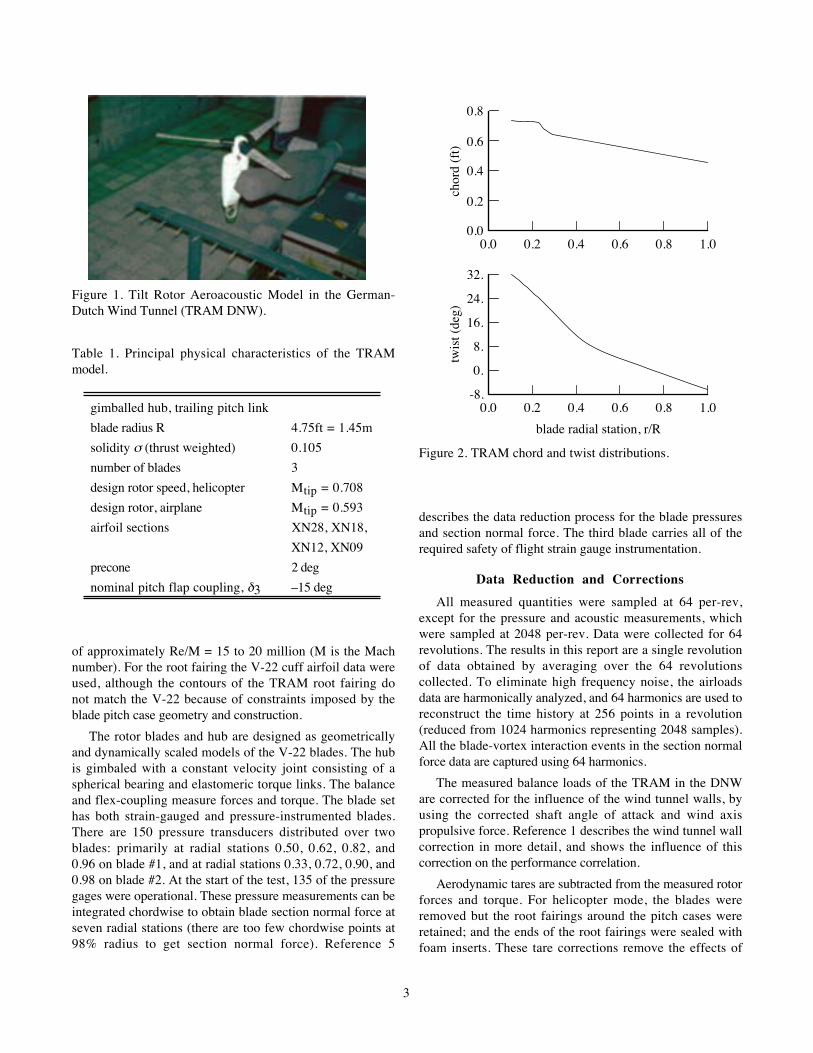
In April-May 1998 the TRAM was tested in the isolatedrotor configuration at the Large Low-speed Facility of theGerman-Dutch Wind Tunnels (DNW). A preparatory testwas conducted in December 1997. These tests were the firstcomprehensive aeroacoustic tests for a tiltrotor, includingnot only noise, performance, and structural loads data, butairload and wake measurements as well. The TRAM and theDNW test are described in references 3 to 6. Figure 1 showsthe wind tunnel installation of the TRAM isolated rotor.The LLF/DNW is a closed return, atmospheric pressure windtunnel. The TRAM test utilized the 6- by 8-meter open-jettest section, which is in a large anechoic testing hall.
The Tilt Rotor Aeroacoustic Model (TRAM) is a general-purpose test bed for moderate-scale tiltrotor models. TRAMconsists of two hardware-interchangeable test rigs: anisolated rotor test stand, and a full-span, dual-rotor model.The contractor team of MicroCraft and McDonnell DouglasHelicopter (now Boeing) had overall responsibility for theTRAM development, under the direction of theAeromechanics Branch, Army/NASA Rotorcraft Division,NASA Ames Research Center.
TRAM Physical Description
The TRAM was designed as a 1/4-scale V-22 tiltrotoraircraft model. The rotor has a diameter of 9.5 ft. The rotorwas tested at a tip Mach number of 0.63 in helicopter mode(because of operational limitations, this was lower than theV-22 tip Mach number of 0.71); and 0.59 in airplane mode(matching the V-22). The rotor and nacelle assembly wasattached to an acoustically-treated, isolated rotor test standthrough a mechanical pivot (the nacelle conversion axis), asshown in figure 1. The nacelle (but not the spinner)contours model the V-22. The test stand contained theelectric motor assembly, and was attached to the DNW stingmount. The conversion angle was manually adjusted, set to90 deg nacelle angle for helicopter mode and 0 deg nacelleangle for airplane mode testing.
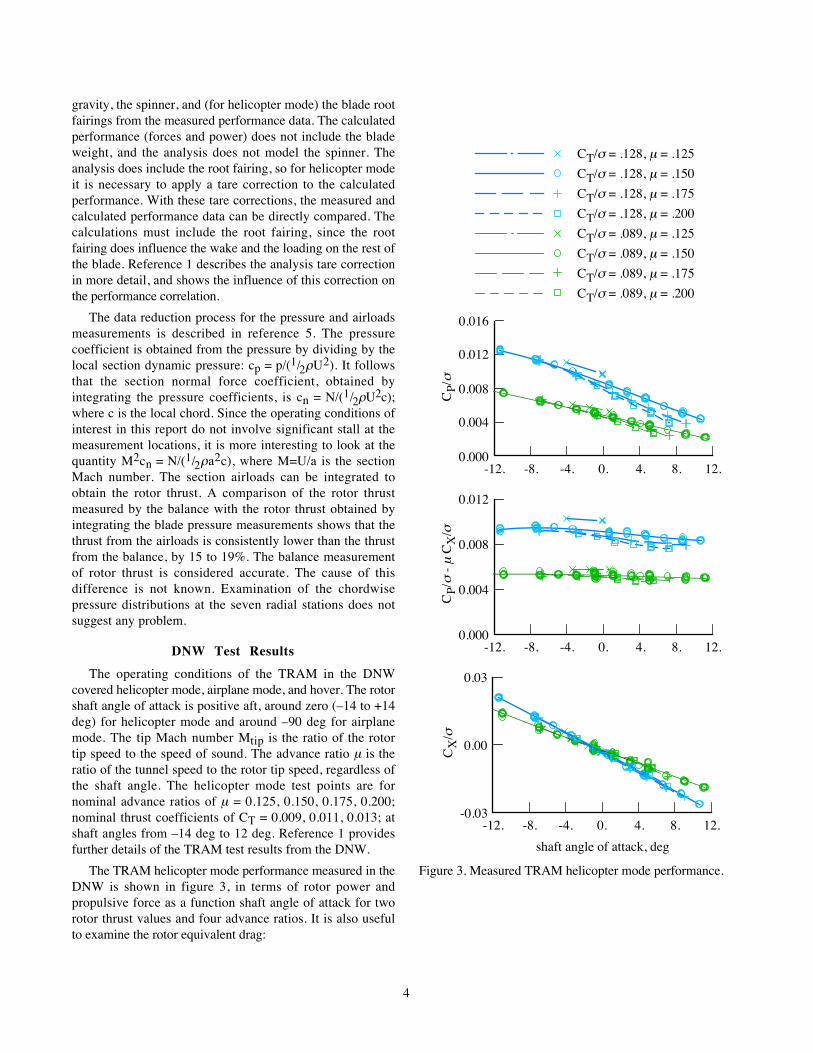
Reference 7 provides complete details of the TRAMphysical description. Table 1 presents the principalcharacteristics of the TRAM. The solidity σ = 0.105 is theofficial value (thrust-weighted), used to normalize measuredand calculated data in this report. Figure 2 shows the bladechord and twist distributions. The TRAM blade airfoils arethe V-22 airfoils designated XN28, XN18, XN12, XN09, atradial stations r/R = 0.2544, 0.50, 0.75, 1.00 respectively.The root fairing has a special airfoil section. The airfoiltables used in the present investigation are those generatedduring the JVX program in the mid 1980's. Reference 8 isthe source of the airfoil data. The data are from pressure windtunnel tests of 6.5 inch chord airfoils, at Reynolds number
3
Figure 1. Tilt Rotor Aeroacoustic Model in the German-Dutch Wind Tunnel (TRAM DNW).
Table 1. Principal physical characteristics of the TRAMmodel.
gimballed hub, trailing pitch link
blade radius R 4.75ft = 1.45m
solidity σ (thrust weighted) 0.105
number of blades 3
design rotor speed, helicopter Mtip = 0.708
design rotor, airplane Mtip = 0.593
airfoil sections XN28, XN18,
XN12, XN09
precone 2 deg
nominal pitch flap coupling, δ3 –15 deg
of approximately Re/M = 15 to 20 million (M is the Machnumber). For the root fairing the V-22 cuff airfoil data wereused, although the contours of the TRAM root fairing donot match the V-22 because of constraints imposed by theblade pitch case geometry and construction.
The rotor blades and hub are designed as geometricallyand dynamically scaled models of the V-22 blades. The hubis gimbaled with a constant velocity joint consisting of aspherical bearing and elastomeric torque links. The balanceand flex-coupling measure forces and torque. The blade sethas both strain-gauged and pressure-instrumented blades.There are 150 pressure transducers distributed over twoblades: primarily at radial stations 0.50, 0.62, 0.82, and0.96 on blade #1, and at radial stations 0.33, 0.72, 0.90, and0.98 on blade #2. At the start of the test, 135 of the pressuregages were operational. These pressure measurements can beintegrated chordwise to obtain blade section normal force atseven radial stations (there are too few chordwise points at98% radius to get section normal force). Reference 5
0.0 0.2 0.4 0.6 0.8 1.00.0
0.2
0.4
0.6
0.8
chor
d (f
t)
0.0 0.2 0.4 0.6 0.8 1.0-8.
0.
8.
16.
24.
32.
blade radial station, r/R
twis
t (de
g)Figure 2. TRAM chord and twist distributions.
describes the data reduction process for the blade pressuresand section normal force. The third blade carries all of therequired safety of flight strain gauge instrumentation.
Data Reduction and Corrections
All measured quantities were sampled at 64 per-rev,except for the pressure and acoustic measurements, whichwere sampled at 2048 per-rev. Data were collected for 64revolutions. The results in this report are a single revolutionof data obtained by averaging over the 64 revolutionscollected. To eliminate high frequency noise, the airloadsdata are harmonically analyzed, and 64 harmonics are used toreconstruct the time history at 256 points in a revolution(reduced from 1024 harmonics representing 2048 samples).All the blade-vortex interaction events in the section normalforce data are captured using 64 harmonics.
The measured balance loads of the TRAM in the DNWare corrected for the influence of the wind tunnel walls, byusing the corrected shaft angle of attack and wind axispropulsive force. Reference 1 describes the wind tunnel wallcorrection in more detail, and shows the influence of thiscorrection on the performance correlation.
Aerodynamic tares are subtracted from the measured rotorforces and torque. For helicopter mode, the blades wereremoved but the root fairings around the pitch cases wereretained; and the ends of the root fairings were sealed withfoam inserts. These tare corrections remove the effects of
4
gravity, the spinner, and (for helicopter mode) the blade rootfairings from the measured performance data. The calculatedperformance (forces and power) does not include the bladeweight, and the analysis does not model the spinner. Theanalysis does include the root fairing, so for helicopter modeit is necessary to apply a tare correction to the calculatedperformance. With these tare corrections, the measured andcalculated performance data can be directly compared. Thecalculations must include the root fairing, since the rootfairing does influence the wake and the loading on the rest ofthe blade. Reference 1 describes the analysis tare correctionin more detail, and shows the influence of this correction onthe performance correlation.
The data reduction process for the pressure and airloadsmeasurements is described in reference 5. The pressurecoefficient is obtained from the pressure by dividing by thelocal section dynamic pressure: cp = p/(1/2ρU2). It followsthat the section normal force coefficient, obtained byintegrating the pressure coefficients, is cn = N/(1/2ρU2c);where c is the local chord. Since the operating conditions ofinterest in this report do not involve significant stall at themeasurement locations, it is more interesting to look at thequantity M2cn = N/(1/2ρa2c), where M=U/a is the sectionMach number. The section airloads can be integrated toobtain the rotor thrust. A comparison of the rotor thrustmeasured by the balance with the rotor thrust obtained byintegrating the blade pressure measurements shows that thethrust from the airloads is consistently lower than the thrustfrom the balance, by 15 to 19%. The balance measurementof rotor thrust is considered accurate. The cause of thisdifference is not known. Examination of the chordwisepressure distributions at the seven radial stations does notsuggest any problem.
DNW Test Results
The operating conditions of the TRAM in the DNWcovered helicopter mode, airplane mode, and hover. The rotorshaft angle of attack is positive aft, around zero (–14 to +14deg) for helicopter mode and around –90 deg for airplanemode. The tip Mach number Mtip is the ratio of the rotortip speed to the speed of sound. The advance ratio μ is theratio of the tunnel speed to the rotor tip speed, regardless ofthe shaft angle. The helicopter mode test points are fornominal advance ratios of μ = 0.125, 0.150, 0.175, 0.200;nominal thrust coefficients of CT = 0.009, 0.011, 0.013; atshaft angles from –14 deg to 12 deg. Reference 1 providesfurther details of the TRAM test results from the DNW.
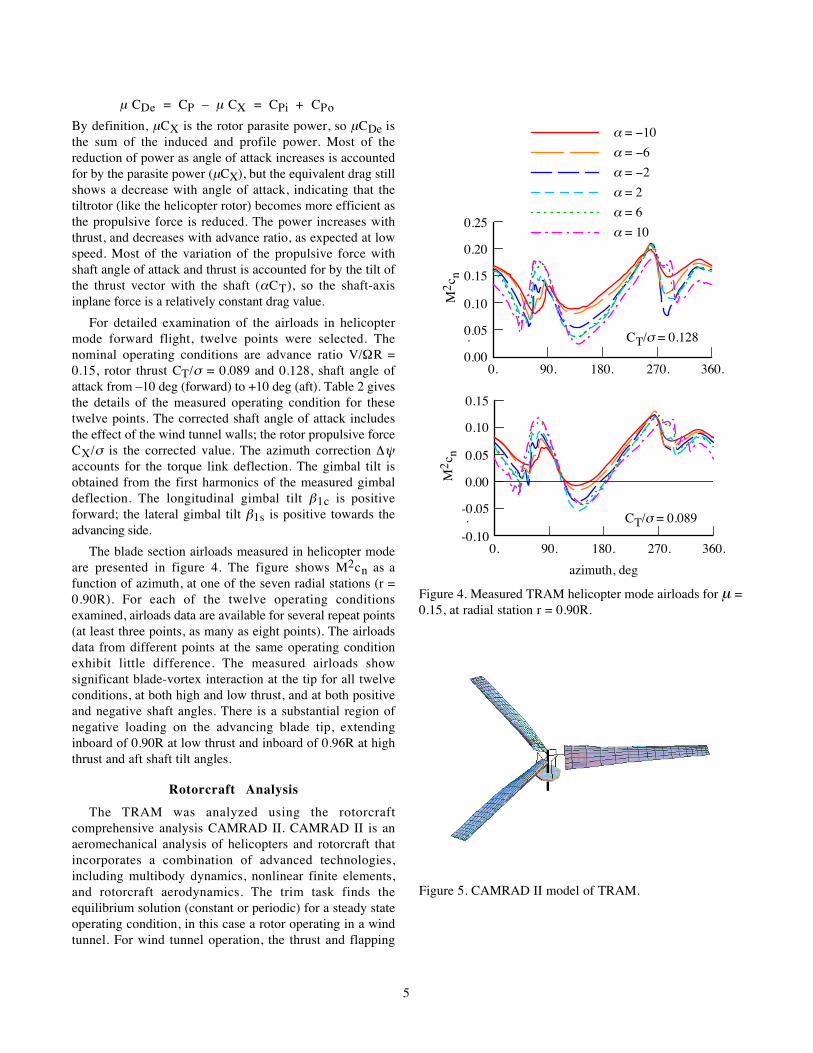
The TRAM helicopter mode performance measured in theDNW is shown in figure 3, in terms of rotor power andpropulsive force as a function shaft angle of attack for tworotor thrust values and four advance ratios. It is also usefulto examine the rotor equivalent drag:
-12. -8. -4. 0. 4. 8. 12.0.000
0.004
0.008
0.012
0.016
CP/
σ
CT/σ = .128, μ = .125
CT/σ = .128, μ = .150
CT/σ = .128, μ = .175
CT/σ = .128, μ = .200
CT/σ = .089, μ = .125
CT/σ = .089, μ = .150
CT/σ = .089, μ = .175
CT/σ = .089, μ = .200
-12. -8. -4. 0. 4. 8. 12.0.000
0.004
0.008
0.012
CP/
σ -
μ C
X/σ
-12. -8. -4. 0. 4. 8. 12.-0.03
0.00
0.03
shaft angle of attack, deg
CX
/σ
Figure 3. Measured TRAM helicopter mode performance.
5
μ CDe = CP – μ CX = CPi + CPo
By definition, μCX is the rotor parasite power, so μCDe isthe sum of the induced and profile power. Most of thereduction of power as angle of attack increases is accountedfor by the parasite power (μCX), but the equivalent drag stillshows a decrease with angle of attack, indicating that thetiltrotor (like the helicopter rotor) becomes more efficient asthe propulsive force is reduced. The power increases withthrust, and decreases with advance ratio, as expected at lowspeed. Most of the variation of the propulsive force withshaft angle of attack and thrust is accounted for by the tilt ofthe thrust vector with the shaft (αCT), so the shaft-axisinplane force is a relatively constant drag value.
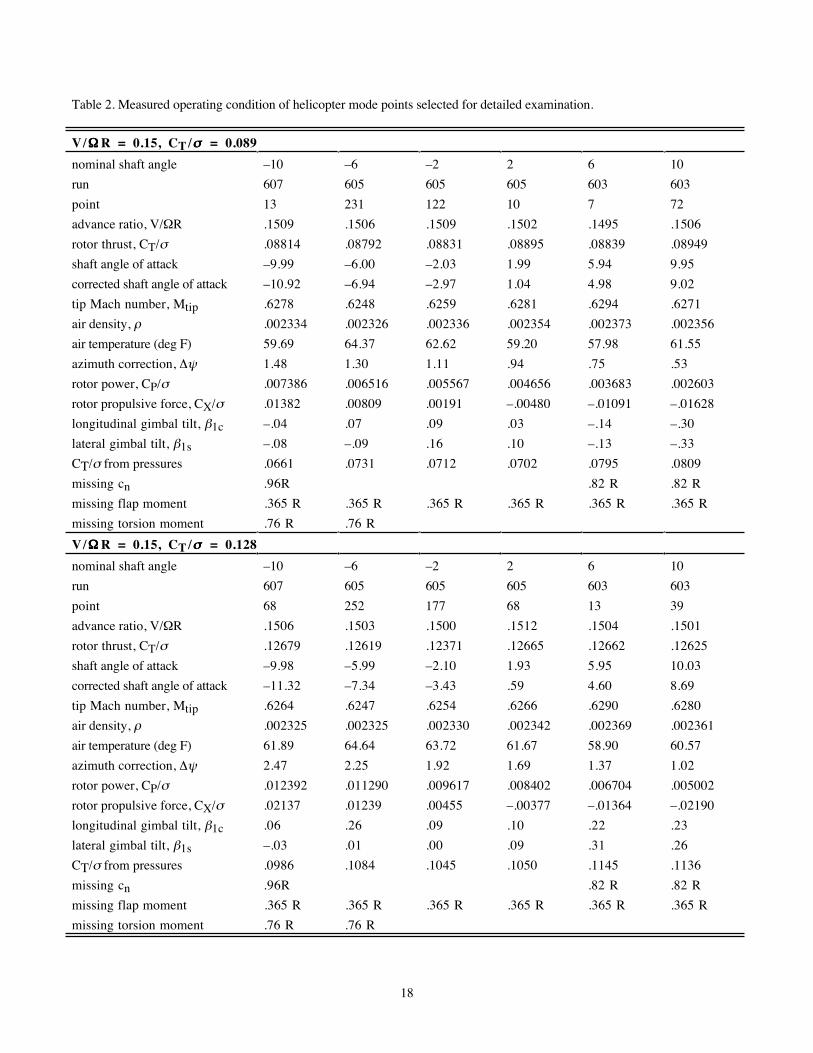
For detailed examination of the airloads in helicoptermode forward flight, twelve points were selected. Thenominal operating conditions are advance ratio V/ΩR =0.15, rotor thrust CT/σ = 0.089 and 0.128, shaft angle ofattack from –10 deg (forward) to +10 deg (aft). Table 2 givesthe details of the measured operating condition for thesetwelve points. The corrected shaft angle of attack includesthe effect of the wind tunnel walls; the rotor propulsive forceCX/σ is the corrected value. The azimuth correction Δψaccounts for the torque link deflection. The gimbal tilt isobtained from the first harmonics of the measured gimbaldeflection. The longitudinal gimbal tilt β1c is positiveforward; the lateral gimbal tilt β1s is positive towards theadvancing side.
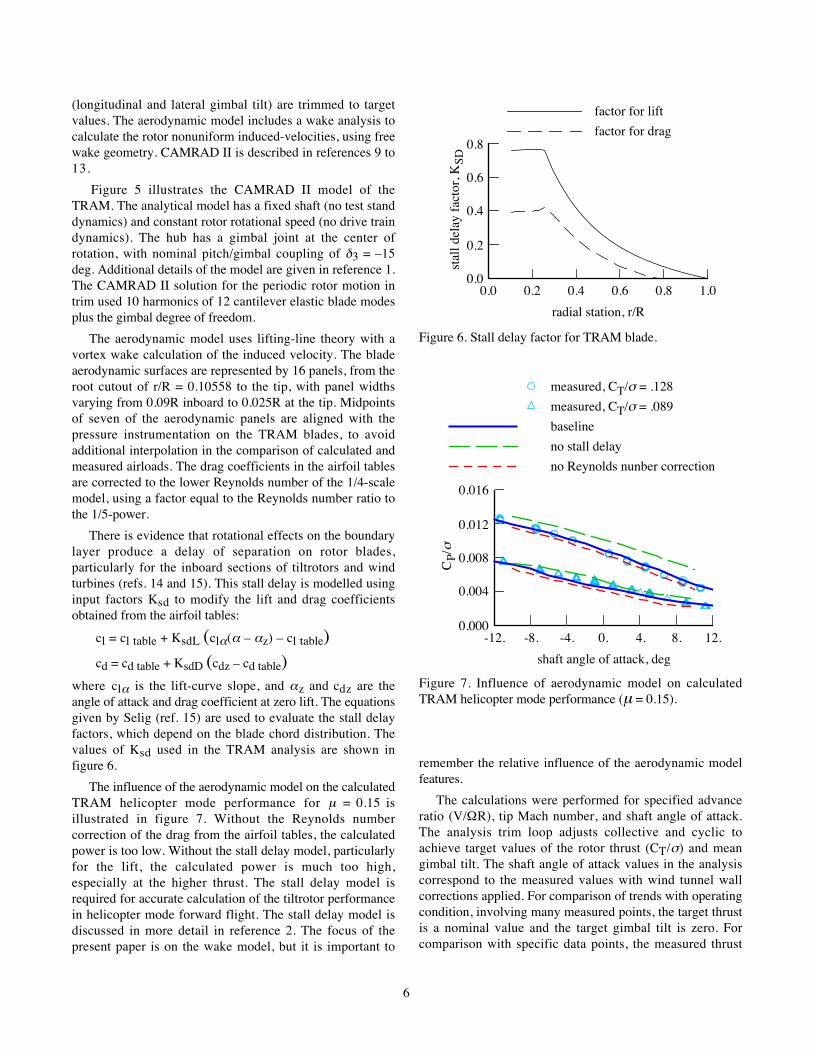
The blade section airloads measured in helicopter modeare presented in figure 4. The figure shows M2cn as afunction of azimuth, at one of the seven radial stations (r =0.90R). For each of the twelve operating conditionsexamined, airloads data are available for several repeat points(at least three points, as many as eight points). The airloadsdata from different points at the same operating conditionexhibit little difference. The measured airloads showsignificant blade-vortex interaction at the tip for all twelveconditions, at both high and low thrust, and at both positiveand negative shaft angles. There is a substantial region ofnegative loading on the advancing blade tip, extendinginboard of 0.90R at low thrust and inboard of 0.96R at highthrust and aft shaft tilt angles.
Rotorcraft Analysis
The TRAM was analyzed using the rotorcraftcomprehensive analysis CAMRAD II. CAMRAD II is anaeromechanical analysis of helicopters and rotorcraft thatincorporates a combination of advanced technologies,including multibody dynamics, nonlinear finite elements,and rotorcraft aerodynamics. The trim task finds theequilibrium solution (constant or periodic) for a steady stateoperating condition, in this case a rotor operating in a windtunnel. For wind tunnel operation, the thrust and flapping
0. 90. 180. 270. 360.0.00
0.05
0.10
0.15
0.20
0.25
M2 c
n
. CT/σ = 0.128
α = −10
α = −6
α = −2
α = 2
α = 6
α = 10
0. 90. 180. 270. 360.-0.10
-0.05
0.00
0.05
0.10
0.15
azimuth, deg
M2 c
n
. CT/σ = 0.089
Figure 4. Measured TRAM helicopter mode airloads for μ =0.15, at radial station r = 0.90R.
Figure 5. CAMRAD II model of TRAM.
6
(longitudinal and lateral gimbal tilt) are trimmed to targetvalues. The aerodynamic model includes a wake analysis tocalculate the rotor nonuniform induced-velocities, using freewake geometry. CAMRAD II is described in references 9 to13.
Figure 5 illustrates the CAMRAD II model of theTRAM. The analytical model has a fixed shaft (no test standdynamics) and constant rotor rotational speed (no drive traindynamics). The hub has a gimbal joint at the center ofrotation, with nominal pitch/gimbal coupling of δ3 = –15deg. Additional details of the model are given in reference 1.The CAMRAD II solution for the periodic rotor motion intrim used 10 harmonics of 12 cantilever elastic blade modesplus the gimbal degree of freedom.
The aerodynamic model uses lifting-line theory with avortex wake calculation of the induced velocity. The bladeaerodynamic surfaces are represented by 16 panels, from theroot cutout of r/R = 0.10558 to the tip, with panel widthsvarying from 0.09R inboard to 0.025R at the tip. Midpointsof seven of the aerodynamic panels are aligned with thepressure instrumentation on the TRAM blades, to avoidadditional interpolation in the comparison of calculated andmeasured airloads. The drag coefficients in the airfoil tablesare corrected to the lower Reynolds number of the 1/4-scalemodel, using a factor equal to the Reynolds number ratio tothe 1/5-power.
There is evidence that rotational effects on the boundarylayer produce a delay of separation on rotor blades,particularly for the inboard sections of tiltrotors and windturbines (refs. 14 and 15). This stall delay is modelled usinginput factors Ksd to modify the lift and drag coefficientsobtained from the airfoil tables:
cl = cl table + KsdL (clα(α – αz) – cl table)cd = cd table + KsdD (cdz – cd table)
where clα is the lift-curve slope, and αz and cdz are theangle of attack and drag coefficient at zero lift. The equationsgiven by Selig (ref. 15) are used to evaluate the stall delayfactors, which depend on the blade chord distribution. Thevalues of Ksd used in the TRAM analysis are shown infigure 6.
The influence of the aerodynamic model on the calculatedTRAM helicopter mode performance for μ = 0.15 isillustrated in figure 7. Without the Reynolds numbercorrection of the drag from the airfoil tables, the calculatedpower is too low. Without the stall delay model, particularlyfor the lift, the calculated power is much too high,especially at the higher thrust. The stall delay model isrequired for accurate calculation of the tiltrotor performancein helicopter mode forward flight. The stall delay model isdiscussed in more detail in reference 2. The focus of thepresent paper is on the wake model, but it is important to
0.0 0.2 0.4 0.6 0.8 1.00.0
0.2
0.4
0.6
0.8
radial station, r/R
stal
l del
ay f
acto
r, K
SD
factor for lift
factor for drag
Figure 6. Stall delay factor for TRAM blade.
-12. -8. -4. 0. 4. 8. 12.0.000
0.004
0.008
0.012
0.016
shaft angle of attack, deg
CP/
σ
measured, CT/σ = .128
measured, CT/σ = .089
baseline
no stall delay
no Reynolds nunber correction
Figure 7. Influence of aerodynamic model on calculatedTRAM helicopter mode performance (μ = 0.15).
remember the relative influence of the aerodynamic modelfeatures.
The calculations were performed for specified advanceratio (V/ΩR), tip Mach number, and shaft angle of attack.The analysis trim loop adjusts collective and cyclic toachieve target values of the rotor thrust (CT/σ) and meangimbal tilt. The shaft angle of attack values in the analysiscorrespond to the measured values with wind tunnel wallcorrections applied. For comparison of trends with operatingcondition, involving many measured points, the target thrustis a nominal value and the target gimbal tilt is zero. Forcomparison with specific data points, the measured thrust
7
and measured one per-rev gimbal tilt are the target trimvalues for the analysis. Similarly, for trends the operatingcondition is defined by nominal values of advance ratio, tipMach number, shaft angle of attack, air density, andtemperature; while for specific data points the measuredvalues are used.
In the calculations it is possible to separately evaluatethe induced power and the profile power. The induced powercan be presented as the ratio κ = CPi/CPideal, where CPidealis the ideal power obtained from momentum theory. Theprofile power can be presented as an equivalent blade dragcoefficient, cdo = 8CPo/σ.
Tiltrotor Wake Models
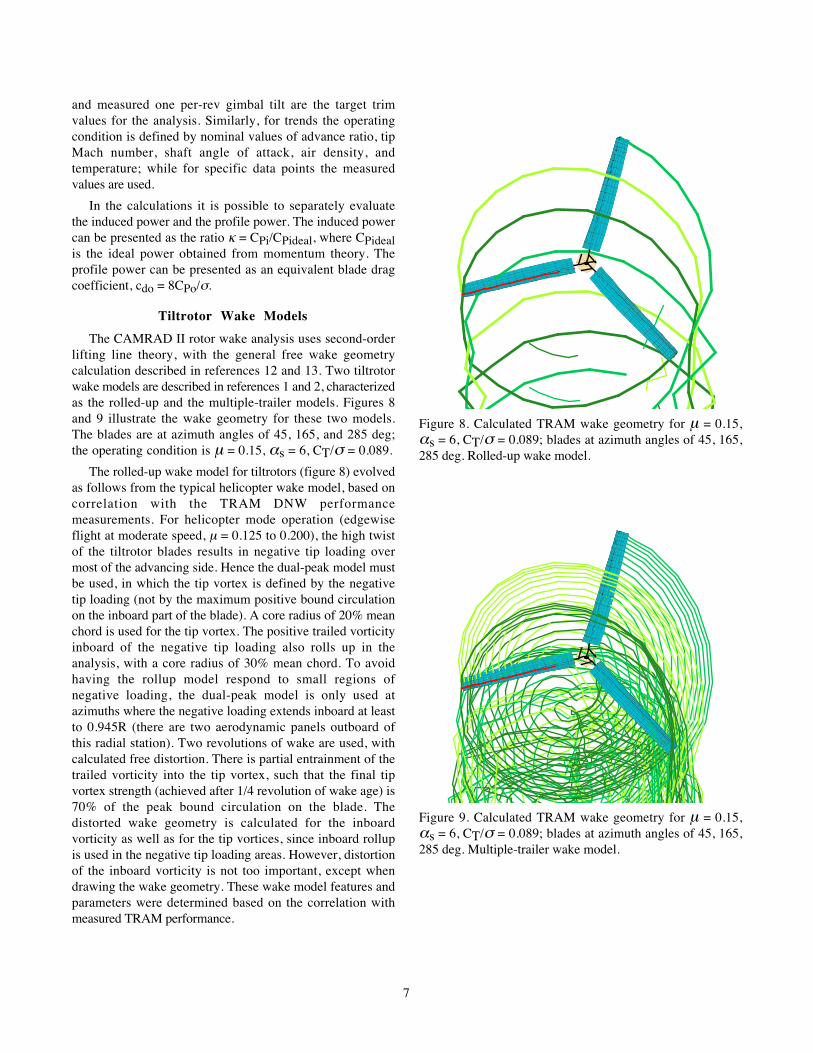
The CAMRAD II rotor wake analysis uses second-orderlifting line theory, with the general free wake geometrycalculation described in references 12 and 13. Two tiltrotorwake models are described in references 1 and 2, characterizedas the rolled-up and the multiple-trailer models. Figures 8and 9 illustrate the wake geometry for these two models.The blades are at azimuth angles of 45, 165, and 285 deg;the operating condition is μ = 0.15, αs = 6, CT/σ = 0.089.
The rolled-up wake model for tiltrotors (figure 8) evolvedas follows from the typical helicopter wake model, based oncorrelation with the TRAM DNW performancemeasurements. For helicopter mode operation (edgewiseflight at moderate speed, μ = 0.125 to 0.200), the high twistof the tiltrotor blades results in negative tip loading overmost of the advancing side. Hence the dual-peak model mustbe used, in which the tip vortex is defined by the negativetip loading (not by the maximum positive bound circulationon the inboard part of the blade). A core radius of 20% meanchord is used for the tip vortex. The positive trailed vorticityinboard of the negative tip loading also rolls up in theanalysis, with a core radius of 30% mean chord. To avoidhaving the rollup model respond to small regions ofnegative loading, the dual-peak model is only used atazimuths where the negative loading extends inboard at leastto 0.945R (there are two aerodynamic panels outboard ofthis radial station). Two revolutions of wake are used, withcalculated free distortion. There is partial entrainment of thetrailed vorticity into the tip vortex, such that the final tipvortex strength (achieved after 1/4 revolution of wake age) is70% of the peak bound circulation on the blade. Thedistorted wake geometry is calculated for the inboardvorticity as well as for the tip vortices, since inboard rollupis used in the negative tip loading areas. However, distortionof the inboard vorticity is not too important, except whendrawing the wake geometry. These wake model features andparameters were determined based on the correlation withmeasured TRAM performance.
Figure 8. Calculated TRAM wake geometry for μ = 0.15,αs = 6, CT/σ = 0.089; blades at azimuth angles of 45, 165,285 deg. Rolled-up wake model.
Figure 9. Calculated TRAM wake geometry for μ = 0.15,αs = 6, CT/σ = 0.089; blades at azimuth angles of 45, 165,285 deg. Multiple-trailer wake model.
8
-12. -8. -4. 0. 4. 8. 12.0.000
0.004
0.008
0.012
0.016
CP/
σ
CT/σ = .128, μ = .125
CT/σ = .128, μ = .150
CT/σ = .128, μ = .175
CT/σ = .128, μ = .200
CT/σ = .089, μ = .125
CT/σ = .089, μ = .150
CT/σ = .089, μ = .175
CT/σ = .089, μ = .200
measured, μ = .125
measured, μ = .150
measured, μ = .175
measured, μ = .200
-12. -8. -4. 0. 4. 8. 12.0.000
0.004
0.008
0.012
CP/
σ -
μ C
X/σ
-12. -8. -4. 0. 4. 8. 12.-0.03
0.00
0.03
shaft angle of attack, deg
CX
/σ
Figure 10. Measured and calculated TRAM helicopter modeperformance. Rolled-up wake model.
-12. -8. -4. 0. 4. 8. 12.0.000
0.004
0.008
0.012
0.016
CP/
σ
CT/σ = .128, μ = .125
CT/σ = .128, μ = .150
CT/σ = .128, μ = .175
CT/σ = .128, μ = .200
CT/σ = .089, μ = .125
CT/σ = .089, μ = .150
CT/σ = .089, μ = .175
CT/σ = .089, μ = .200
measured, μ = .125
measured, μ = .150
measured, μ = .175
measured, μ = .200
-12. -8. -4. 0. 4. 8. 12.0.000
0.004
0.008
0.012
CP/
σ -
μ C
X/σ
-12. -8. -4. 0. 4. 8. 12.-0.03
0.00
0.03
shaft angle of attack, deg
CX
/σ
Figure 11. Measured and calculated TRAM helicopter modeperformance. Multiple-trailer wake model.
9
0. 90. 180. 270. 360.-0.05
0.00
0.05
0.10
0.15
0.20
0.25
M2 c
n
. CT/σ = 0.128, αs = −6, r = 0.90R
measured
rolled-up wake
multiple-trailer wake
0. 90. 180. 270. 360.-0.10
-0.05
0.00
0.05
0.10
0.15
0.20
M2 c
n
. CT/σ = 0.089, αs = −6, r = 0.90R
0. 90. 180. 270. 360.-0.10
-0.05
0.00
0.05
0.10
0.15
0.20
M2 c
n
. CT/σ = 0.089, αs = 6, r = 0.90R
0. 90. 180. 270. 360.-0.10
-0.05
0.00
0.05
0.10
0.15
0.20
azimuth, deg
M2 c
n
. CT/σ = 0.089, αs = 6, r = 0.72R
Figure 12. Measured and calculated TRAM helicopter modeairloads for μ = 0.15.
There are major differences between this model and thecorresponding aerodynamic and wake model that has beenestablished for helicopter rotors (refs. 12 and 13). Theprimary differences are that the tiltrotor model includes thestall delay, does not use complete entrainment of the tipvortex, uses two revolutions of wake, and uses a restrictedsearch for the circulation peak.
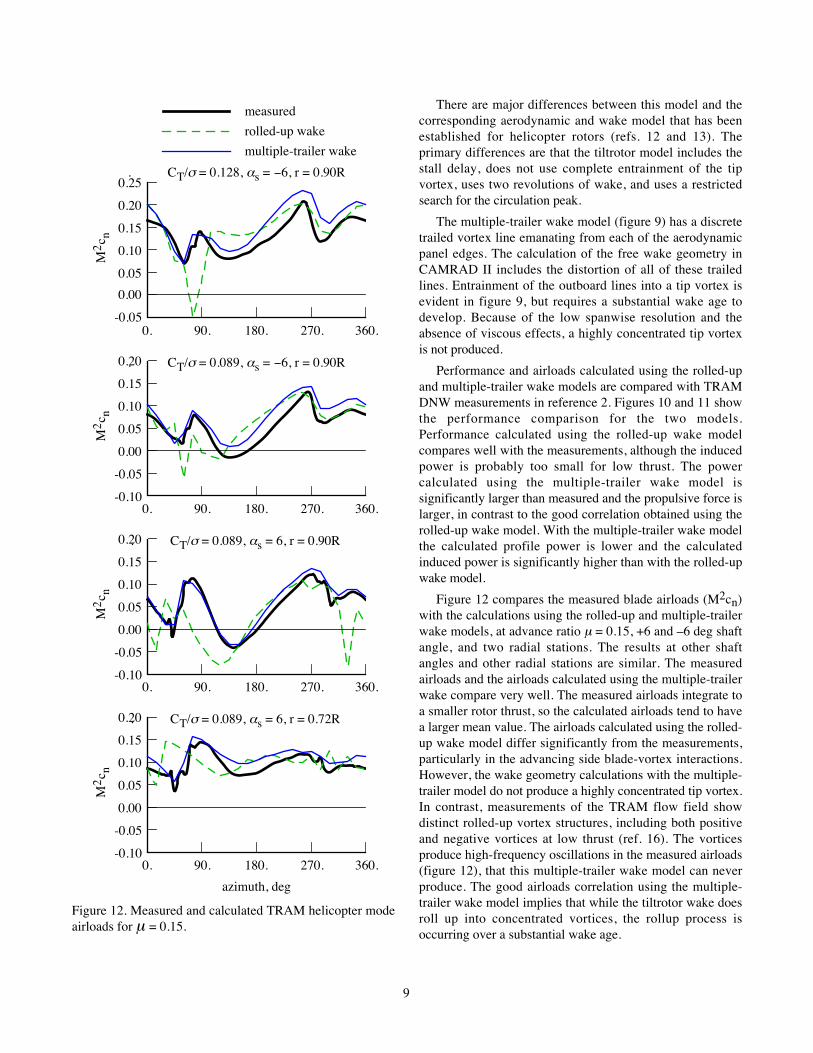
The multiple-trailer wake model (figure 9) has a discretetrailed vortex line emanating from each of the aerodynamicpanel edges. The calculation of the free wake geometry inCAMRAD II includes the distortion of all of these trailedlines. Entrainment of the outboard lines into a tip vortex isevident in figure 9, but requires a substantial wake age todevelop. Because of the low spanwise resolution and theabsence of viscous effects, a highly concentrated tip vortexis not produced.
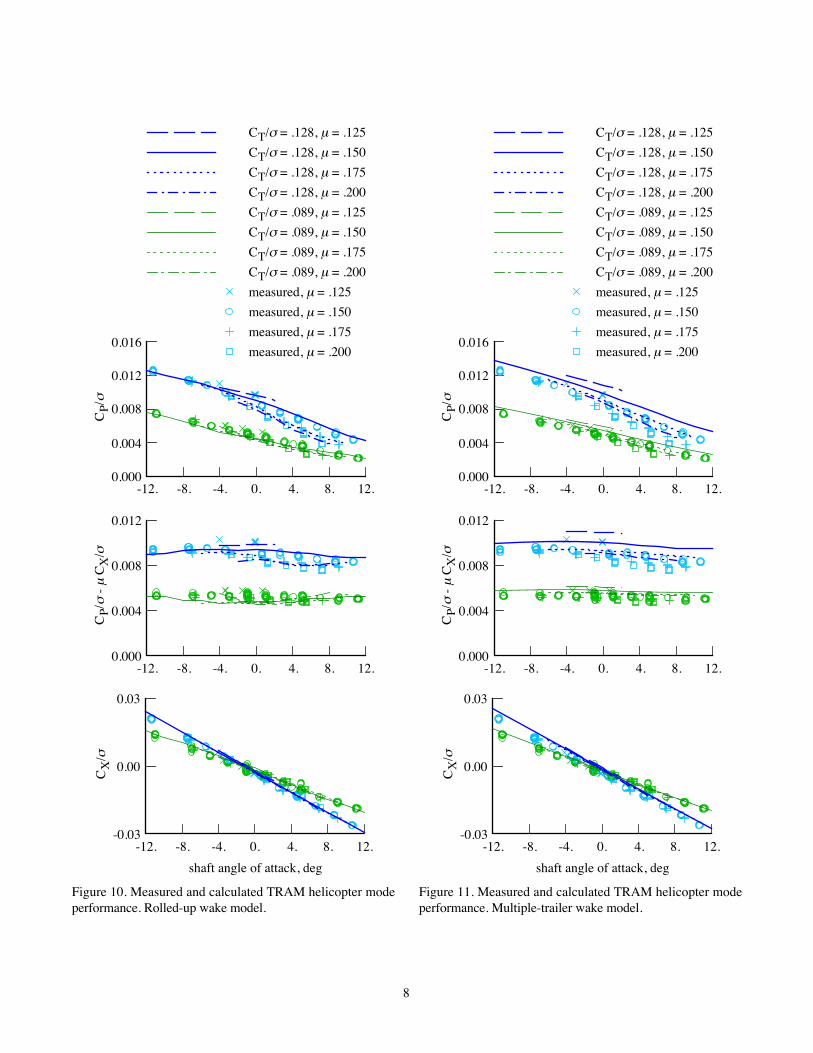
Performance and airloads calculated using the rolled-upand multiple-trailer wake models are compared with TRAMDNW measurements in reference 2. Figures 10 and 11 showthe performance comparison for the two models.Performance calculated using the rolled-up wake modelcompares well with the measurements, although the inducedpower is probably too small for low thrust. The powercalculated using the multiple-trailer wake model issignificantly larger than measured and the propulsive force islarger, in contrast to the good correlation obtained using therolled-up wake model. With the multiple-trailer wake modelthe calculated profile power is lower and the calculatedinduced power is significantly higher than with the rolled-upwake model.
Figure 12 compares the measured blade airloads (M2cn)with the calculations using the rolled-up and multiple-trailerwake models, at advance ratio μ = 0.15, +6 and –6 deg shaftangle, and two radial stations. The results at other shaftangles and other radial stations are similar. The measuredairloads and the airloads calculated using the multiple-trailerwake compare very well. The measured airloads integrate toa smaller rotor thrust, so the calculated airloads tend to havea larger mean value. The airloads calculated using the rolled-up wake model differ significantly from the measurements,particularly in the advancing side blade-vortex interactions.However, the wake geometry calculations with the multiple-trailer model do not produce a highly concentrated tip vortex.In contrast, measurements of the TRAM flow field showdistinct rolled-up vortex structures, including both positiveand negative vortices at low thrust (ref. 16). The vorticesproduce high-frequency oscillations in the measured airloads(figure 12), that this multiple-trailer wake model can neverproduce. The good airloads correlation using the multiple-trailer wake model implies that while the tiltrotor wake doesroll up into concentrated vortices, the rollup process isoccurring over a substantial wake age.
10
Thus the conclusion in reference 2 is that the rolled-upwake model gives the best correlation with performancemeasurements, while the multiple-trailer wake model is bestfor airloads calculations.
Wake Model With Consolidation
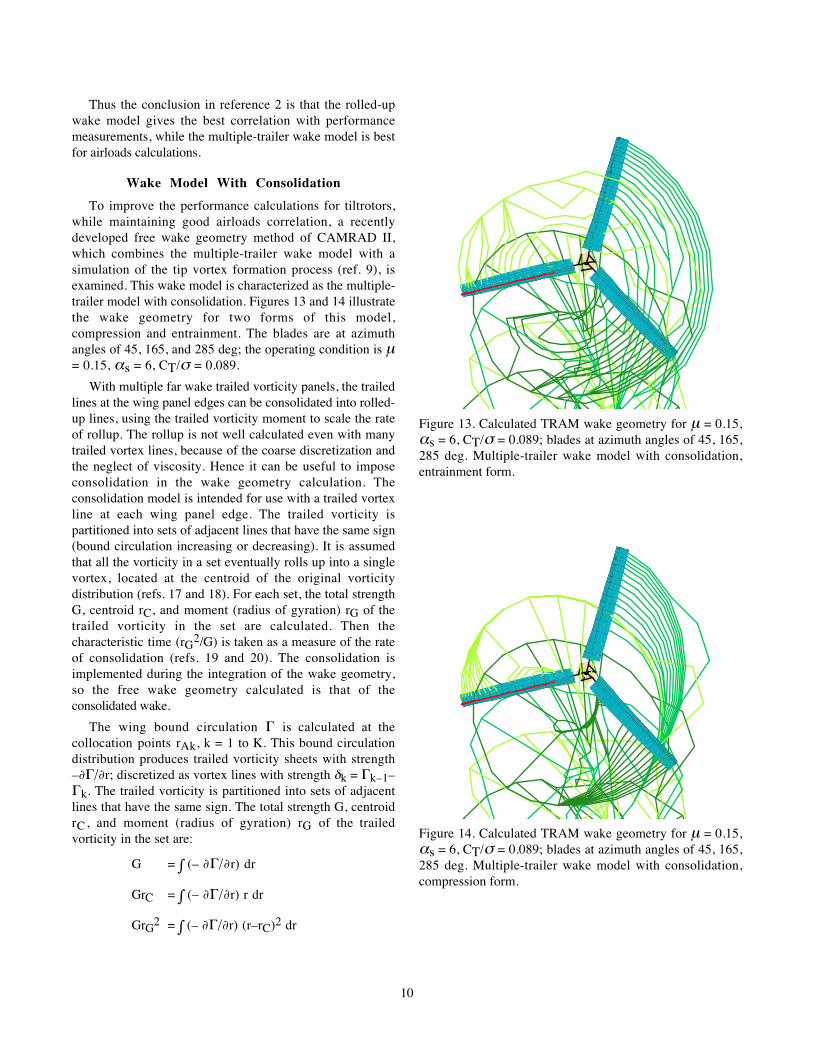
To improve the performance calculations for tiltrotors,while maintaining good airloads correlation, a recentlydeveloped free wake geometry method of CAMRAD II,which combines the multiple-trailer wake model with asimulation of the tip vortex formation process (ref. 9), isexamined. This wake model is characterized as the multiple-trailer model with consolidation. Figures 13 and 14 illustratethe wake geometry for two forms of this model,compression and entrainment. The blades are at azimuthangles of 45, 165, and 285 deg; the operating condition is μ= 0.15, αs = 6, CT/σ = 0.089.
With multiple far wake trailed vorticity panels, the trailedlines at the wing panel edges can be consolidated into rolled-up lines, using the trailed vorticity moment to scale the rateof rollup. The rollup is not well calculated even with manytrailed vortex lines, because of the coarse discretization andthe neglect of viscosity. Hence it can be useful to imposeconsolidation in the wake geometry calculation. Theconsolidation model is intended for use with a trailed vortexline at each wing panel edge. The trailed vorticity ispartitioned into sets of adjacent lines that have the same sign(bound circulation increasing or decreasing). It is assumedthat all the vorticity in a set eventually rolls up into a singlevortex, located at the centroid of the original vorticitydistribution (refs. 17 and 18). For each set, the total strengthG, centroid rC, and moment (radius of gyration) rG of thetrailed vorticity in the set are calculated. Then thecharacteristic time (rG2/G) is taken as a measure of the rateof consolidation (refs. 19 and 20). The consolidation isimplemented during the integration of the wake geometry,so the free wake geometry calculated is that of theconsolidated wake.
The wing bound circulation Γ is calculated at thecollocation points rAk, k = 1 to K. This bound circulationdistribution produces trailed vorticity sheets with strength–∂Γ/∂r; discretized as vortex lines with strength δk = Γk–1–Γk. The trailed vorticity is partitioned into sets of adjacentlines that have the same sign. The total strength G, centroidrC, and moment (radius of gyration) rG of the trailedvorticity in the set are:
G = ∫ (– ∂Γ/∂r) dr
GrC = ∫ (– ∂Γ/∂r) r dr
GrG2 = ∫ (– ∂Γ/∂r) (r–rC)2 dr
Figure 13. Calculated TRAM wake geometry for μ = 0.15,αs = 6, CT/σ = 0.089; blades at azimuth angles of 45, 165,285 deg. Multiple-trailer wake model with consolidation,entrainment form.
Figure 14. Calculated TRAM wake geometry for μ = 0.15,αs = 6, CT/σ = 0.089; blades at azimuth angles of 45, 165,285 deg. Multiple-trailer wake model with consolidation,compression form.
11
For trailed vortex elements at wake age τ, the total strengthand moment are evaluated at the time the vorticity wascreated (t–τ), and used to calculate the time constant τcons =kcons(rG 2/G). Then the fraction of rollup, fcons, isevaluated using an exponential (ref. 19), linear, or powerdependence on wake age:
fcons = 1 – exp(–(τ–τB)/τcons) exponential
= (τ–τB)/τcons linear
= ((τ–τB)/τcons)m power
The consolidation starts at wake age τB. In addition, amaximum consolidation fraction fE ≤ 1 can be specified. Forall the results presented in this paper, the linear dependenceof the rollup fraction with wake age is used; with τB = 0 andfE = 1.
The consolidation can be accomplished by entrainment orby compression. With the entrainment form, vortex lines areconsolidated into a single line of strength fconsG. For the k-th trailed vorticity line, originating from the panel edge atrEk, fk is the fraction of the vorticity in the set that iswithin the distance |rEk–rC| from the centroid. Then thevortex lines in the set that are consolidated at age τ are thosefor which fk ≤ fcons (all lines within the minimum |rEk–rC|such that the strength is fconsG). The consolidation isimplemented by replacing the position of each consolidatedline with the position of the centroid: rcons = ΣδkrWk/Σδk;where rWk is the position and δk is the strength of the k-thtrailed vortex line, and the sums are over the consolidatedlines in the set. Figure 13 illustrates the wake geometryobtained using the entrainment form.
With the compression form, fcons is the fraction ofconsolidation. If fcons ≥ 1, the position of each line isreplaced with the position of the centroid: rcons =ΣδkrWk/Σδk; where the sums are over all the lines in theset. If fcons < 1, the position of each line is replaced with(1–fcons)rWk + fconsrcons. Figure 14 illustrates the wakegeometry obtained using the compression form.
In addition, the wake models of CAMRAD II allow thevortex core radius to be defined in several ways (ref. 9). Thevortex core radius is specified by a constant term (inputfraction of chord, rc0/c); a term growing with wake age τ(using an input exponent n, and τ1 = wake age for coreradius of 100% chord); and a term that scales with the trailedvorticity moment. Hence the general expression for the coreradius is:
rc = c (rc0 / c) + c (τ / τ1)n + fM rG
where rG is the second moment about the centroid (the radiusof gyration) of the trailed vorticity, evaluated at the time thevortex element was created. This moment is obtained byintegrating the vorticity for all adjacent trailed lines of the
-12. -8. -4. 0. 4. 8. 12.0.000
0.004
0.008
0.012
0.016
CP/
σ
CT/σ = .128, μ = .125
CT/σ = .128, μ = .150
CT/σ = .128, μ = .175
CT/σ = .128, μ = .200
CT/σ = .089, μ = .125
CT/σ = .089, μ = .150
CT/σ = .089, μ = .175
CT/σ = .089, μ = .200
measured, μ = .125
measured, μ = .150
measured, μ = .175
measured, μ = .200
-12. -8. -4. 0. 4. 8. 12.0.000
0.004
0.008
0.012
CP/
σ -
μ C
X/σ
-12. -8. -4. 0. 4. 8. 12.-0.03
0.00
0.03
shaft angle of attack, deg
CX
/σ
Figure 15. Measured and calculated TRAM helicoptermode performance. Multiple-trailer wake model withconsolidation (compression form).
12
-12. -8. -4. 0. 4. 8. 12.0.000
0.004
0.008
0.012
0.016
CP/
σmeasured, CT/σ = .128
measured, CT/σ = .089
rolled-up wake
multiple-trailer wake
multiple-trailer, with consolidation
-12. -8. -4. 0. 4. 8. 12.0.000
0.004
0.008
0.012
CP/
σ -
μ C
X/σ
-12. -8. -4. 0. 4. 8. 12.-0.03
0.00
0.03
shaft angle of attack, deg
CX
/σ
Figure 16a. Influence of wake model on calculated TRAMhelicopter mode performance (μ = 0.15; heavy line CT/σ =0.128, thin line CT/σ = 0.089; compression form forconsolidation).
same sign. Equating the moment of the trailed vorticitycreated behind the blade to the moment of the rolled upvortex implies that the constant fM should be on the order of1.0 (depending on the vorticity distribution in the vortexcore).
-12. -8. -4. 0. 4. 8. 12.1.00
1.20
1.40
1.60
1.80
indu
ced
pow
er, κ
= C
Pi/C
Pide
al
rolled-up wake
multiple-trailer wake
multiple-trailer, with consolidation
-12. -8. -4. 0. 4. 8. 12.0.0000
0.0060
0.0120
0.0180
0.0240
shaft angle of attack, deg
prof
ile p
ower
, cdo
= 8
CPo
/σ
Figure 16b. Influence of wake model on calculated TRAMhelicopter mode performance (μ = 0.15; heavy line CT/σ =0.128, thin line CT/σ = 0.089; compression form forconsolidation).
Results
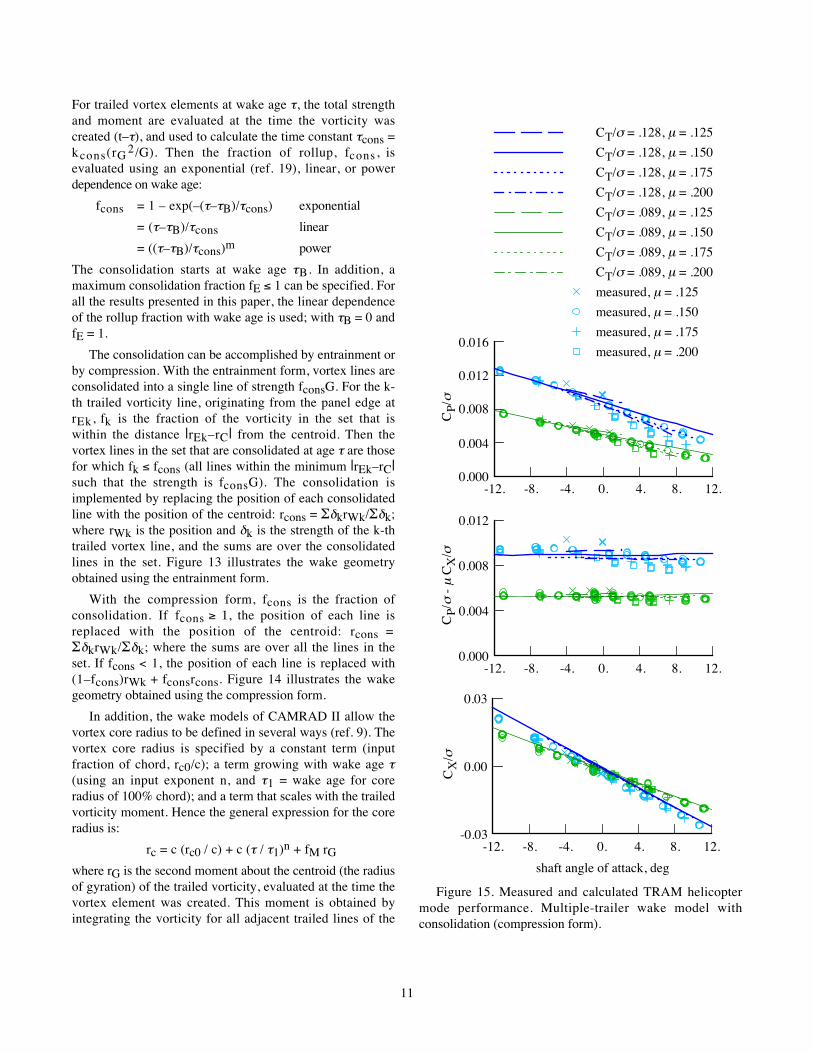
The TRAM helicopter mode performance calculated usingthe multiple-trailer wake model with consolidation is shownin figure 15. The consolidation model uses the compressionform, with linear dependence of the rollup fraction on wakeage: fcons= τ/τcons with τcons = 5(rG2/G) (kcons = 5). Thevortex core radius has a constant value of 80% mean chord(rc = 0.8c). The power calculation is much improvedcompared to the results without consolidation (figure 11),although not quite as good as the results from the rolled-upwake model (figure 10).
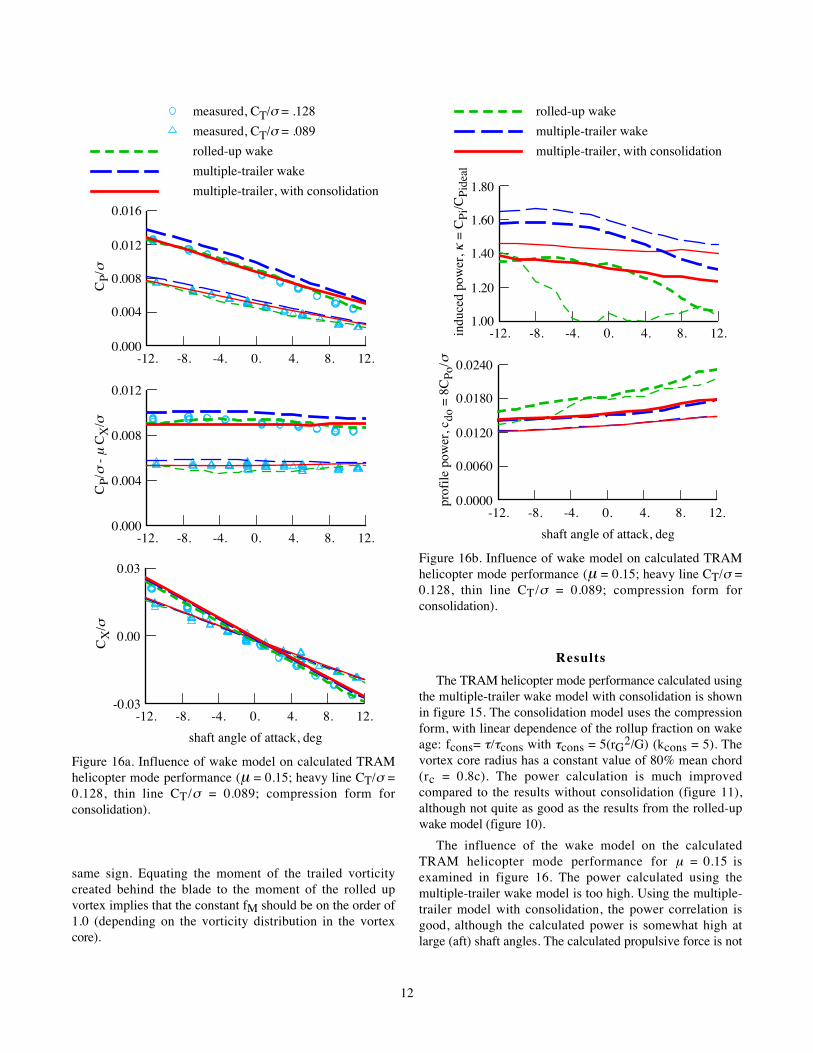
The influence of the wake model on the calculatedTRAM helicopter mode performance for μ = 0.15 isexamined in figure 16. The power calculated using themultiple-trailer wake model is too high. Using the multiple-trailer model with consolidation, the power correlation isgood, although the calculated power is somewhat high atlarge (aft) shaft angles. The calculated propulsive force is not
13
very sensitive to the wake model, but the propulsive force issomewhat high using the multiple-trailer models. Thecalculated propulsive force matches the data well, so thedifferences between measurement and calculation are similarfor power and equivalent drag. At low thrust, the inducedpower calculated using the rolled-up wake model is too low;a ratio of induced power to ideal power that is close to 1.0 isnot likely. With the multiple-trailer models, the inducedpower is higher and the profile power lower than with therolled-up wake model. Using consolidation in the multiple-trailer model lowers the calculated induced power, so thecorrelation with measured power is improved.
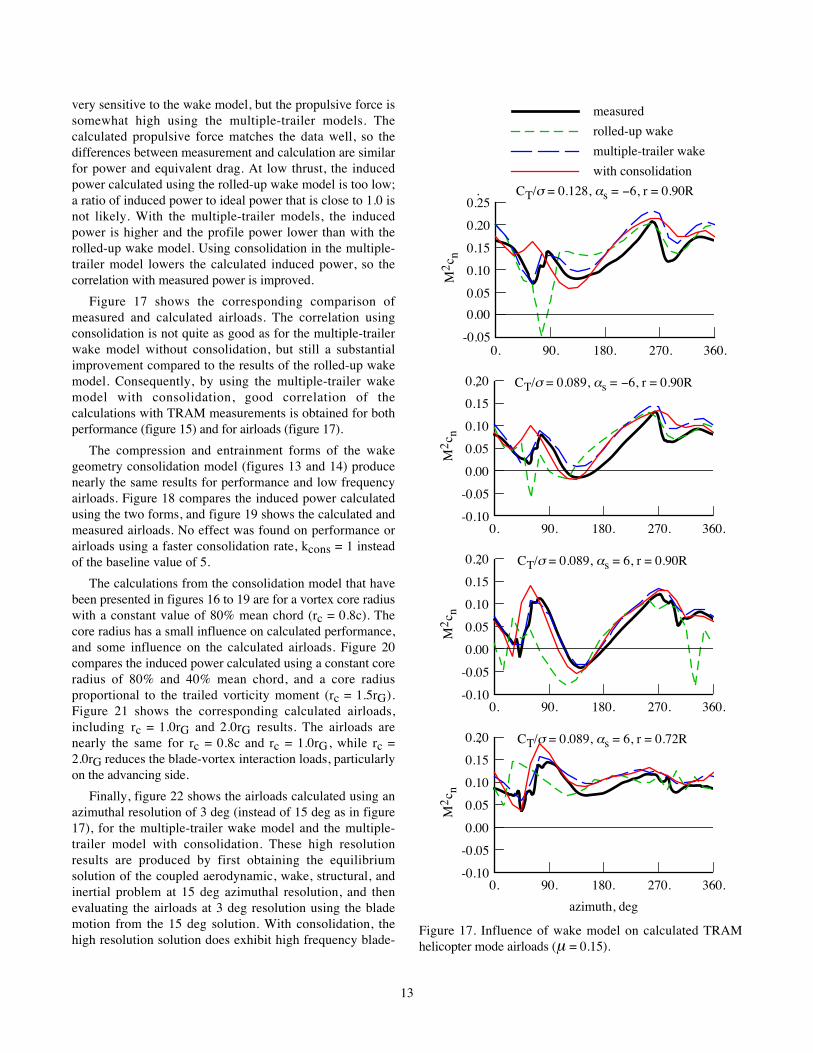
Figure 17 shows the corresponding comparison ofmeasured and calculated airloads. The correlation usingconsolidation is not quite as good as for the multiple-trailerwake model without consolidation, but still a substantialimprovement compared to the results of the rolled-up wakemodel. Consequently, by using the multiple-trailer wakemodel with consolidation, good correlation of thecalculations with TRAM measurements is obtained for bothperformance (figure 15) and for airloads (figure 17).
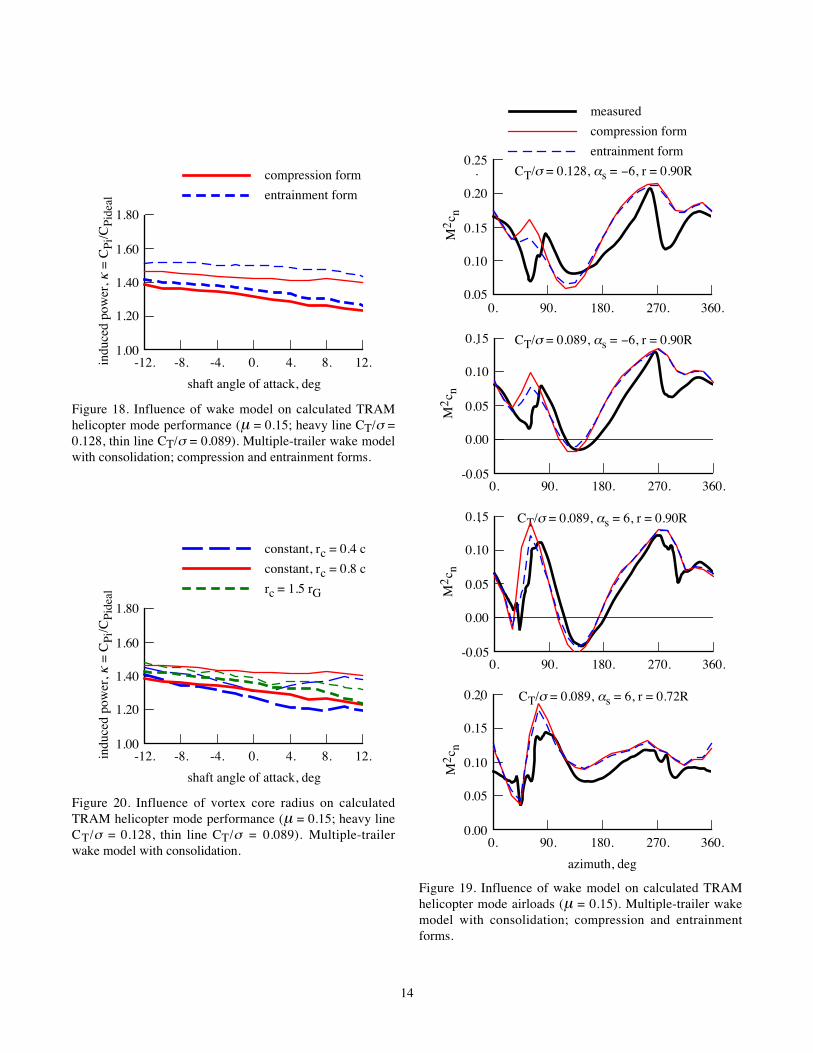
The compression and entrainment forms of the wakegeometry consolidation model (figures 13 and 14) producenearly the same results for performance and low frequencyairloads. Figure 18 compares the induced power calculatedusing the two forms, and figure 19 shows the calculated andmeasured airloads. No effect was found on performance orairloads using a faster consolidation rate, kcons = 1 insteadof the baseline value of 5.
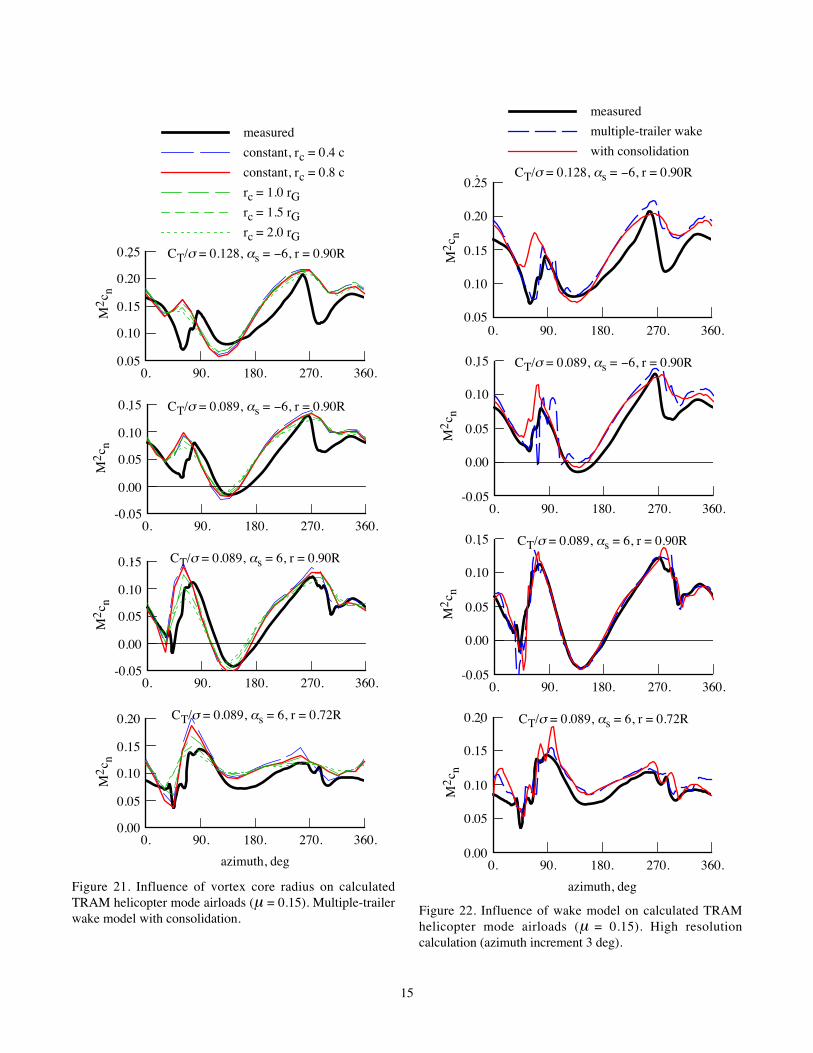
The calculations from the consolidation model that havebeen presented in figures 16 to 19 are for a vortex core radiuswith a constant value of 80% mean chord (rc = 0.8c). Thecore radius has a small influence on calculated performance,and some influence on the calculated airloads. Figure 20compares the induced power calculated using a constant coreradius of 80% and 40% mean chord, and a core radiusproportional to the trailed vorticity moment (rc = 1.5rG).Figure 21 shows the corresponding calculated airloads,including rc = 1.0rG and 2.0rG results. The airloads arenearly the same for rc = 0.8c and rc = 1.0rG, while rc =2.0rG reduces the blade-vortex interaction loads, particularlyon the advancing side.
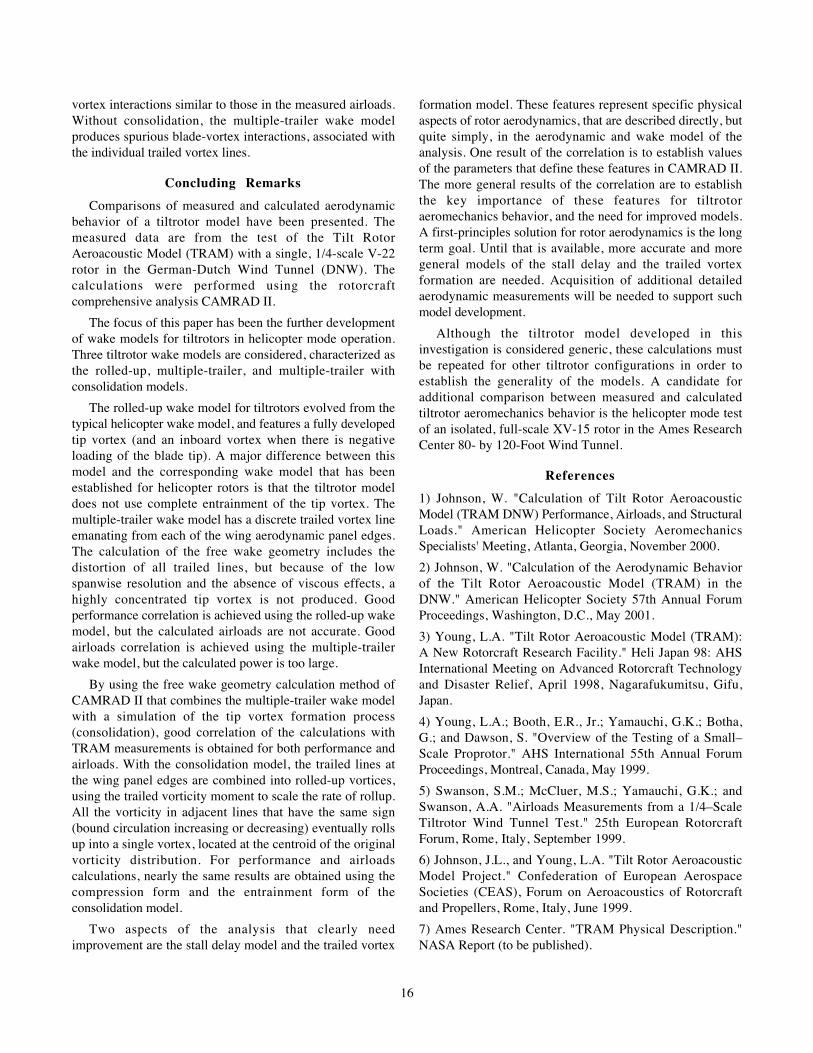
Finally, figure 22 shows the airloads calculated using anazimuthal resolution of 3 deg (instead of 15 deg as in figure17), for the multiple-trailer wake model and the multiple-trailer model with consolidation. These high resolutionresults are produced by first obtaining the equilibriumsolution of the coupled aerodynamic, wake, structural, andinertial problem at 15 deg azimuthal resolution, and thenevaluating the airloads at 3 deg resolution using the blademotion from the 15 deg solution. With consolidation, thehigh resolution solution does exhibit high frequency blade-
0. 90. 180. 270. 360.-0.05
0.00
0.05
0.10
0.15
0.20
0.25
M2 c
n
. CT/σ = 0.128, αs = −6, r = 0.90R
measured
rolled-up wake
multiple-trailer wake
with consolidation
0. 90. 180. 270. 360.-0.10
-0.05
0.00
0.05
0.10
0.15
0.20
M2 c
n
. CT/σ = 0.089, αs = −6, r = 0.90R
0. 90. 180. 270. 360.-0.10
-0.05
0.00
0.05
0.10
0.15
0.20
M2 c
n
. CT/σ = 0.089, αs = 6, r = 0.90R
0. 90. 180. 270. 360.-0.10
-0.05
0.00
0.05
0.10
0.15
0.20
azimuth, deg
M2 c
n
. CT/σ = 0.089, αs = 6, r = 0.72R
Figure 17. Influence of wake model on calculated TRAMhelicopter mode airloads (μ = 0.15).
14
-12. -8. -4. 0. 4. 8. 12.1.00
1.20
1.40
1.60
1.80
shaft angle of attack, deg
indu
ced
pow
er, κ
= C
Pi/C
Pide
al
compression form
entrainment form
Figure 18. Influence of wake model on calculated TRAMhelicopter mode performance (μ = 0.15; heavy line CT/σ =0.128, thin line CT/σ = 0.089). Multiple-trailer wake modelwith consolidation; compression and entrainment forms.
-12. -8. -4. 0. 4. 8. 12.1.00
1.20
1.40
1.60
1.80
shaft angle of attack, deg
indu
ced
pow
er, κ
= C
Pi/C
Pide
al
constant, rc = 0.4 c
constant, rc = 0.8 c
rc = 1.5 rG
Figure 20. Influence of vortex core radius on calculatedTRAM helicopter mode performance (μ = 0.15; heavy lineCT/σ = 0.128, thin line CT/σ = 0.089). Multiple-trailerwake model with consolidation.
0. 90. 180. 270. 360.0.05
0.10
0.15
0.20
0.25
M2 c
n
. CT/σ = 0.128, αs = −6, r = 0.90R
measured
compression form
entrainment form
0. 90. 180. 270. 360.-0.05
0.00
0.05
0.10
0.15
M2 c
n
. CT/σ = 0.089, αs = −6, r = 0.90R
0. 90. 180. 270. 360.-0.05
0.00
0.05
0.10
0.15
M2 c
n
. CT/σ = 0.089, αs = 6, r = 0.90R
0. 90. 180. 270. 360.0.00
0.05
0.10
0.15
0.20
azimuth, deg
M2 c
n
. CT/σ = 0.089, αs = 6, r = 0.72R
Figure 19. Influence of wake model on calculated TRAMhelicopter mode airloads (μ = 0.15). Multiple-trailer wakemodel with consolidation; compression and entrainmentforms.
15
0. 90. 180. 270. 360.0.05
0.10
0.15
0.20
0.25
M2 c
n
. CT/σ = 0.128, αs = −6, r = 0.90R
measured
constant, rc = 0.4 c
constant, rc = 0.8 c
rc = 1.0 rGrc = 1.5 rGrc = 2.0 rG
0. 90. 180. 270. 360.-0.05
0.00
0.05
0.10
0.15
M2 c
n
. CT/σ = 0.089, αs = −6, r = 0.90R
0. 90. 180. 270. 360.-0.05
0.00
0.05
0.10
0.15
M2 c
n
. CT/σ = 0.089, αs = 6, r = 0.90R
0. 90. 180. 270. 360.0.00
0.05
0.10
0.15
0.20
azimuth, deg
M2 c
n
. CT/σ = 0.089, αs = 6, r = 0.72R
Figure 21. Influence of vortex core radius on calculatedTRAM helicopter mode airloads (μ = 0.15). Multiple-trailerwake model with consolidation.
0. 90. 180. 270. 360.0.05
0.10
0.15
0.20
0.25
M2 c
n
. CT/σ = 0.128, αs = −6, r = 0.90R
measured
multiple-trailer wake
with consolidation
0. 90. 180. 270. 360.-0.05
0.00
0.05
0.10
0.15
M2 c
n
. CT/σ = 0.089, αs = −6, r = 0.90R
0. 90. 180. 270. 360.-0.05
0.00
0.05
0.10
0.15
M2 c
n
. CT/σ = 0.089, αs = 6, r = 0.90R
0. 90. 180. 270. 360.0.00
0.05
0.10
0.15
0.20
azimuth, deg
M2 c
n
. CT/σ = 0.089, αs = 6, r = 0.72R
Figure 22. Influence of wake model on calculated TRAMhelicopter mode airloads (μ = 0.15). High resolutioncalculation (azimuth increment 3 deg).
16
vortex interactions similar to those in the measured airloads.Without consolidation, the multiple-trailer wake modelproduces spurious blade-vortex interactions, associated withthe individual trailed vortex lines.
Concluding Remarks
Comparisons of measured and calculated aerodynamicbehavior of a tiltrotor model have been presented. Themeasured data are from the test of the Tilt RotorAeroacoustic Model (TRAM) with a single, 1/4-scale V-22rotor in the German-Dutch Wind Tunnel (DNW). Thecalculations were performed using the rotorcraftcomprehensive analysis CAMRAD II.
The focus of this paper has been the further developmentof wake models for tiltrotors in helicopter mode operation.Three tiltrotor wake models are considered, characterized asthe rolled-up, multiple-trailer, and multiple-trailer withconsolidation models.
The rolled-up wake model for tiltrotors evolved from thetypical helicopter wake model, and features a fully developedtip vortex (and an inboard vortex when there is negativeloading of the blade tip). A major difference between thismodel and the corresponding wake model that has beenestablished for helicopter rotors is that the tiltrotor modeldoes not use complete entrainment of the tip vortex. Themultiple-trailer wake model has a discrete trailed vortex lineemanating from each of the wing aerodynamic panel edges.The calculation of the free wake geometry includes thedistortion of all trailed lines, but because of the lowspanwise resolution and the absence of viscous effects, ahighly concentrated tip vortex is not produced. Goodperformance correlation is achieved using the rolled-up wakemodel, but the calculated airloads are not accurate. Goodairloads correlation is achieved using the multiple-trailerwake model, but the calculated power is too large.
By using the free wake geometry calculation method ofCAMRAD II that combines the multiple-trailer wake modelwith a simulation of the tip vortex formation process(consolidation), good correlation of the calculations withTRAM measurements is obtained for both performance andairloads. With the consolidation model, the trailed lines atthe wing panel edges are combined into rolled-up vortices,using the trailed vorticity moment to scale the rate of rollup.All the vorticity in adjacent lines that have the same sign(bound circulation increasing or decreasing) eventually rollsup into a single vortex, located at the centroid of the originalvorticity distribution. For performance and airloadscalculations, nearly the same results are obtained using thecompression form and the entrainment form of theconsolidation model.
Two aspects of the analysis that clearly needimprovement are the stall delay model and the trailed vortex
formation model. These features represent specific physicalaspects of rotor aerodynamics, that are described directly, butquite simply, in the aerodynamic and wake model of theanalysis. One result of the correlation is to establish valuesof the parameters that define these features in CAMRAD II.The more general results of the correlation are to establishthe key importance of these features for tiltrotoraeromechanics behavior, and the need for improved models.A first-principles solution for rotor aerodynamics is the longterm goal. Until that is available, more accurate and moregeneral models of the stall delay and the trailed vortexformation are needed. Acquisition of additional detailedaerodynamic measurements will be needed to support suchmodel development.
Although the tiltrotor model developed in thisinvestigation is considered generic, these calculations mustbe repeated for other tiltrotor configurations in order toestablish the generality of the models. A candidate foradditional comparison between measured and calculatedtiltrotor aeromechanics behavior is the helicopter mode testof an isolated, full-scale XV-15 rotor in the Ames ResearchCenter 80- by 120-Foot Wind Tunnel.
References
1) Johnson, W. "Calculation of Tilt Rotor AeroacousticModel (TRAM DNW) Performance, Airloads, and StructuralLoads." American Helicopter Society AeromechanicsSpecialists' Meeting, Atlanta, Georgia, November 2000.
2) Johnson, W. "Calculation of the Aerodynamic Behaviorof the Tilt Rotor Aeroacoustic Model (TRAM) in theDNW." American Helicopter Society 57th Annual ForumProceedings, Washington, D.C., May 2001.
3) Young, L.A. "Tilt Rotor Aeroacoustic Model (TRAM):A New Rotorcraft Research Facility." Heli Japan 98: AHSInternational Meeting on Advanced Rotorcraft Technologyand Disaster Relief, April 1998, Nagarafukumitsu, Gifu,Japan.
4) Young, L.A.; Booth, E.R., Jr.; Yamauchi, G.K.; Botha,G.; and Dawson, S. "Overview of the Testing of a Small–Scale Proprotor." AHS International 55th Annual ForumProceedings, Montreal, Canada, May 1999.
5) Swanson, S.M.; McCluer, M.S.; Yamauchi, G.K.; andSwanson, A.A. "Airloads Measurements from a 1/4–ScaleTiltrotor Wind Tunnel Test." 25th European RotorcraftForum, Rome, Italy, September 1999.
6) Johnson, J.L., and Young, L.A. "Tilt Rotor AeroacousticModel Project." Confederation of European AerospaceSocieties (CEAS), Forum on Aeroacoustics of Rotorcraftand Propellers, Rome, Italy, June 1999.
7) Ames Research Center. "TRAM Physical Description."NASA Report (to be published).
17
8) Jenks, M.D., and Narramore, J.C. "Final Report for the2–D Test of the Model 901 Rotor and Wing Airfoils (BSWT592)," Boeing Report D901–99065–1, June 1984.
9) Johnson, W. "CAMRAD II, Comprehensive AnalyticalModel of Rotorcraft Aerodynamics and Dynamics." JohnsonAeronautics, Palo Alto, California, 1992–2002.
10) Johnson, W. "Technology Drivers in the Developmentof CAMRAD II." American Helicopter SocietyAeromechanics Specialists Conference, San Francisco,California, January 1994.
11) Johnson, W. "Rotorcraft Aeromechanics Applications ofa Comprehensive Analysis." Heli Japan 98: AHSInternational Meeting on Advanced Rotorcraft Technologyand Disaster Relief, April 1998.
12) Johnson, W. "A General Free Wake GeometryCalculation for Wings and Rotors." American HelicopterSociety 51st Annual Forum Proceedings, Fort Worth,Texas, May 1995.
13) Johnson, W. "Rotorcraft Aerodynamics Models for aComprehensive Analysis." AHS International 54th AnnualForum Proceedings, Washington, D.C., May 1998.
14) Corrigan, J.J., and Schillings, J.J. "Empirical Model forStall Delay Due to Rotation." American Helicopter SocietyAeromechanics Specialists Conference, San Francisco,California, January 1994.
15) Du, Z., and Selig, M.S. "A 3–D Stall–Delay Model forHorizontal Axis Wind Turbine Performance Prediction."AIAA Paper 98–0021, January 1998.
16) Yamauchi, G.K.; Burley, C.L.; Mercker, E.; Pengel, K;and JanakiRam, R. "Flow Measurements of an IsolatedModel Tilt Rotor." AHS International 55th Annual ForumProceedings, Montreal, Canada, May 1999.
17) Betz, A. "Behavior of Vortex Systems.'' Zeitschrift fuerAngewandte, Mathematik und Mechanik, Bd. XII, Nr. 3,1932; also NACA TM 713, 1933.
18) Rossow, V.J. "On the Inviscid Rolled-Up Structure ofLift-Generated vortices." Journal of Aircraft, Volume 10,Number 11, November 1973.
19) Bilanin, A.J., and Donaldson, C.DuP. "Estimation ofVelocities and Roll-Up in Aircraft Vortex Wakes.'' Journalof Aircraft, Volume 12, Number 7, July 1975.
20) Quackenbush, T.R.; Lam, C.-M.G.; Wachspress, D.A.;and Bliss, D.B. "Computational Analysis of HighResolution Unsteady Airloads for Rotor Aeroacoustics.''NASA CR 194894, May 1994.
18
Table 2. Measured operating condition of helicopter mode points selected for detailed examination.
V/ΩΩΩΩ R = 0.15, CT /σσσσ = 0.089
nominal shaft angle –10 –6 –2 2 6 10
run 607 605 605 605 603 603
point 13 231 122 10 7 72
advance ratio, V/ΩR .1509 .1506 .1509 .1502 .1495 .1506
rotor thrust, CT/σ .08814 .08792 .08831 .08895 .08839 .08949
shaft angle of attack –9.99 –6.00 –2.03 1.99 5.94 9.95
corrected shaft angle of attack –10.92 –6.94 –2.97 1.04 4.98 9.02
tip Mach number, Mtip .6278 .6248 .6259 .6281 .6294 .6271
air density, ρ .002334 .002326 .002336 .002354 .002373 .002356
air temperature (deg F) 59.69 64.37 62.62 59.20 57.98 61.55
azimuth correction, Δψ 1.48 1.30 1.11 .94 .75 .53
rotor power, CP/σ .007386 .006516 .005567 .004656 .003683 .002603
rotor propulsive force, CX/σ .01382 .00809 .00191 –.00480 –.01091 –.01628
longitudinal gimbal tilt, β1c –.04 .07 .09 .03 –.14 –.30
lateral gimbal tilt, β1s –.08 –.09 .16 .10 –.13 –.33
CT/σ from pressures .0661 .0731 .0712 .0702 .0795 .0809
missing cn .96R .82 R .82 R
missing flap moment .365 R .365 R .365 R .365 R .365 R .365 R
missing torsion moment .76 R .76 R
V/ΩΩΩΩ R = 0.15, CT /σσσσ = 0.128
nominal shaft angle –10 –6 –2 2 6 10
run 607 605 605 605 603 603
point 68 252 177 68 13 39
advance ratio, V/ΩR .1506 .1503 .1500 .1512 .1504 .1501
rotor thrust, CT/σ .12679 .12619 .12371 .12665 .12662 .12625
shaft angle of attack –9.98 –5.99 –2.10 1.93 5.95 10.03
corrected shaft angle of attack –11.32 –7.34 –3.43 .59 4.60 8.69
tip Mach number, Mtip .6264 .6247 .6254 .6266 .6290 .6280
air density, ρ .002325 .002325 .002330 .002342 .002369 .002361
air temperature (deg F) 61.89 64.64 63.72 61.67 58.90 60.57
azimuth correction, Δψ 2.47 2.25 1.92 1.69 1.37 1.02
rotor power, CP/σ .012392 .011290 .009617 .008402 .006704 .005002
rotor propulsive force, CX/σ .02137 .01239 .00455 –.00377 –.01364 –.02190
longitudinal gimbal tilt, β1c .06 .26 .09 .10 .22 .23
lateral gimbal tilt, β1s –.03 .01 .00 .09 .31 .26
CT/σ from pressures .0986 .1084 .1045 .1050 .1145 .1136
missing cn .96R .82 R .82 R
missing flap moment .365 R .365 R .365 R .365 R .365 R .365 R
missing torsion moment .76 R .76 R