NASA TECHNICAL MEMORANDUM NASA TM-88446 … · CYROGENIC WIND TUNNELS - PROBLEMS OFCONTINUOUS...
53
NASA-TM-88446 NASA TECHNICAL MEMORANDUM NASA TM-88446 CYROGENIC WIND TUNNELS - PROBLEMS OF CONTINUOUS OPERATION AT LOW TEMPERATURES D. Fa_lmann Translation of "Souffleries Cyrogeniques - Problemes lies au fonctionnement continu en basse temperature, O.N.E.R.A., Report No. OA n. 9/5007 AYD (DERAT no. 9/5007 DY), Centre d'Etudes et de Recherches de Toulouse, France, June, 1980, pp. 1-18 (plus figures). JUL"i 5 i98i; .LANGLEYRESEAROH CENTER LIBRARY, NASA HA._IPTON, VIRGINIA NATIONAL AERONAUTICS AND SPACE ADMINISTRATION WASHINGTON D.C. 20546 JUNE 1986 https://ntrs.nasa.gov/search.jsp?R=19860018627 2018-09-21T13:00:04+00:00Z
Transcript of NASA TECHNICAL MEMORANDUM NASA TM-88446 … · CYROGENIC WIND TUNNELS - PROBLEMS OFCONTINUOUS...

NASA-TM-88446
NASA TECHNICAL MEMORANDUM NASA TM-88446
CYROGENIC WIND TUNNELS - PROBLEMS OF CONTINUOUS OPERATION ATLOW TEMPERATURES
D. Fa_lmann
Translation of "Souffleries Cyrogeniques - Problemes lies aufonctionnement continu en basse temperature, O.N.E.R.A., ReportNo. OA n. 9/5007 AYD (DERAT no. 9/5007 DY), Centre d'Etudes etde Recherches de Toulouse, France, June, 1980, pp. 1-18 (plusfigures).
JUL"i5 i98i;
.LANGLEYRESEAROHCENTERLIBRARY,NASA
HA._IPTON,VIRGINIA
NATIONAL AERONAUTICS AND SPACE ADMINISTRATIONWASHINGTON D.C. 20546 JUNE 1986
https://ntrs.nasa.gov/search.jsp?R=19860018627 2018-09-21T13:00:04+00:00Z

ST_t_OAQO TIT(._ P_GI
|. _eOe#! f4e. _. Go*eefl%n_e_! A,tc4eQ_@n /_e. .,_'. R4clpltnl'a'C4l.|e O He.
NASA TM-RR4464.Tiol,.-4_ka.11o }. _,pa,tO_e_..June ±w_oCYROGENIC WIND TUNNELS - PROBLEMS OF
CONTINUOUS OPERKTION AT LOW TEMPERATURE_ 6.e,C,_t.,o,,.,;,.,;..¢,4. ._I
7._,,(,I L P_fe_uJ,eO,06_aea:e_Ree4,tM,._
D. Faulmann NASW-400510. II'e,'_ U,III He.
(. Pe,I4,,_,:_Q O_'Cemo,eq.oe Hd_4_eend A44_ele 1|0 Go_fi'e,ce ,e0' (_ee_,l No.
Leo Kanner AssociatesRedwood City, CA 94063 t_T,,.._R.,.,,_dP.._._¢...,.,--
Translation
|_. _e_le,,.3 Age_(y _e_. e_d A44_eee
National Aeronautics and Spa'caAdminis- t4. 3_e_eo,ln3A:,_cyCo4etration, Washington D.C. 20546
I._. _'2;I,_.,.,C,F/'(o,e8
Translation of "Souffleries Cyrogeniques - Problemses liesau fonctionnement continue en basse temperature, O.N.E.R.A.Report No. OA n. 9/5007 AYD (DERAT n. 9/5007 DY), "Centred'Etudes et de Recherches de Toulouse, France, June, 1980,pp. 1-18 (plus figures).
16". *_-t,,_(,
This report describes the design of a cyrogenic wind tunneloperating continuously, capable of attaining transonic speedsat generating pressures of about 3 bars. Its stainless steelconstruction with inside insulation allows for ver_frapidtemperature variations promoted by rapid changes i-nthe li-quid nitrogen "flow.A comparative study of temperaturemeasuring probes shows agood reliability of "thin sheet" thermocouples. To measurefluctuations, only a "cold wire" makes it possible to recordfrequencies of about 300 Hr.The use of an integral computer method makes it possible todetermine the impact of the wall temperature ratio to theadiabatic wall temperature for the various parameters charac-terizing the boundary layer. These cases are processed withpositive and negative pressure gradients.
Cyrogenic wind tunnels -Induction wind tunnels - Ther- Unclassified-Unlimitedmal turbulence - Aerodynamic
noise- Liquid nitrogen injec- _-2_tion
l,._.,...,cl...,_.(._,_,...,..,1j_. s...,,,el...,.(.,,_,,,o0.)Uncalssified Unclassified I_t'"'"°_'_" jn" /__/_-__/_
SUMMARY
Description of the adjustment of a cyrogenic wind tunnel
under continuous operation, capable of attaining transonic speeds
at generating pressures of about 3 bars. Its construction in
stainless steel with an inside insulation permits very rapid tem-
perature variations csused by rapid changes in the liquid nitrogen
flow.
A comparative study of probes for measuring temperatures
shows a good reliability of "thin sheet" thermocouples. To meas-
ure fluctuations, only a "cold wire" makes it possible to record
frequencies of about 300 Hz.
The use of an integral computer method makes it possible to
determine the impact of the wall temperature ratio to the adiabatic
wall temperature for the various parameters characterizing the
boundary layer. These cases are processed with positive and nega-
tive pressure gradients.
i
TABLE OF CONTENTS
PAGES
1 - STUDY OBJECTIVE 1
2 - BENEFIT OF THE STUDY 1
2.1 - Specific Research Objectives 1
2.2 - Background of the Study and Previous Results Obtained 2
3 - CONDUCTING THE STUDY 2
3.1 - Summary of the Various Phases 2
3.2 - Results Obtained 3
3.21 - Tests on a Continuous T'3 Cyrogenic Pilot Installation 3
3.22 - Experimental And Instrumentation Techniques i0
3.23 - Problems Associated With Heat Fluxes and WithWall Temperatures 12
4 - SUMMARY OF THE RESULTS ACQUIRED 17
5 - CONCLUSIONS 18
6 - FUTURE PROSPECTS 19
7 - REFERENCES 20
LIST OF FIGURES 21
ii

CYROGENIC WIND TUNNELS - PROBLEMS OF CONTINUOUS OPERATIONAT LOW TEMPERATURES
D. Faulmann
1 - STUDY OBJECTIVE
To conduct a study on a small available installation of the
essential problems which arise for the operation of wind tunnels
at low temperatures both from the standpoint of performance and
flow qualities, and from the standpoint of instrumentation and
measuring instruments.
To specifically analyse the impact of a wall temperature which
may be different from the adiabatic on the boundary layer charac-
teristics.
The activities developed were divided into three phases:
.Phase I: Development and implementation of a small pilot instal-
lation operating continuously: cyrogenic T'3 wind tunnel.
.Phase 2: Experimentall _echniqUe and instrumentation for measure-
mentes in a cyrogenic: environment.
.Phase 3: Problems associated with thermal flows and with wall temp-
eratures.
2 - BENEFIT OF THE STUDY
2.1 - Specific Research Objectives
To use a pilot installation under continuous operation to
study the problems and to define the solutions relevant to cyro-
genic wind tunnels under continuous operation. To very specially
analyze the qualities of the flow as a function of the various
1

factors which the _arious consecutive elements represent.
.To design and implement in the available installation var-
ious experimental systems permitting the completest possible char-
acterization of the flow magnitudes at low temperatures.
.To fundamentally study the impact of an essential similarity
parameter which is the ratio of the wall temperature to the adia-
batic wall temperature on the boundary layer characteristics.
2.2 Background of the Study and Previous Results Obtained
Construction of a typical circuit of a cyrogenic wind tunnel
operating continuously permitting flows at temperatures in the vic-
inity of 120°K and pressurable to 3 bars. It was turned on in the /3
first phase with a low power blower, creating a flow at a tempera-
ture of about 120°K for low speeds.
Methods were established at DERAT for calculating turbulent
boundary layers for compressible flows to be used to study the im-
pact of the wall temperature.
3 - CONDUCTING THE STUDY
3.1 - Summary of the Various Phases
Phase 1
T'3 wind tunnel equipment of a blower with a large compression
ratio and driven by a variable speed engine with a power of 125 KW.
The performance was tested. The test section was adapted to allow
transonic speeds to be reached.
The operation of the cyrogenic wind tunnel was adjusted: flows
were created for various temperature levels and for various Mach
numbers in the test section.
2
Initial flow quality studies: measurement of the spatial
gradients and the temperature fluctuations.
Phase 2
To compare and test different measuring techniques to qualify
flows at low temperatures. To develop experimental techniques for
cyrogenic installations. Knowledge of the various flow parameters
at low temperatures is indispensable for cases of steady flows.
It becomes fundamental for cases of unsteady phenomena which occur,
for example, when starting up of gust wind tunnel or when the test
conditions are rapidly changed in a wind tunnel under continuous
operation.
Phase 3
Development of an integral computer method to determine the
impact of the wall temperature on the characteristics of turbulent
boundary layers: case of a negative pressure gradient and finally,
case of a positive pressure gradient which may lead to separation.
3.2 - Results Obtained
3.21 Tests on a Continuous T'3 Cyrogenic Pilot Installation
Figures 1 and 2 shows the T'3 continuous cyrogenic wind tunnel
which is made up of the following elements:
2i) - Test section: i00 x 120 mm section. The two side gates /4
installed on hinges, each of which has three windows, two of which
have a 50 mm diameter, and one a 150 mm diameter.
As shown in figure 3, the slope of the upper and lower wall
may be adjusted using screw jacks. Each wall is equipped with i0
3
static taps.
2) The neck element is equipped with two screw jacks
permitting a connection to the walls of the test section on the
one hand and, the formation of a neck in the case of a transonic
operation. The outlet section remains stationary (i00 x 160 mm2).
Five upper and lower static taps are connected with those of the
test section to a scanivalve connector attached to one of the three
doors of the box of the test section. Test section length: 600 mm,
neck element: 300 mm.
3) Rectangle-circle transformation piece: length 500 mm, in-2
let section 100 x 160 mm , outlet diameter DN 150.
4) Nozzle: inlet diameter DN 150, outlet diameter DN 250,
length 1,000 mm.
5) Elbow no. 1 DN 250. Spacing 300 mm. It has 5 blades
made up of a 3 mm thick sheet, bent by a 800 radius followed at
the trailing edge by a straight part 30 mm long. This straight
part is inclined about 5° to the inside with respect to the bend
axis. The blades are soldered on the inside by an ellipsis 140 mm
high and 10 mm thick.
61 DN 250 van end, height 200 mm. It is equipped with
four DN 50 tappings placed at 90 °. They may be used for obser-
vation or for injecting liquid nitrogen.
7) Elbow no. 2 DN 250. Same design as elbow no. l, but its
attachment is over the overmultiplier and the sleeve of a trans-
mission shaft made up of a tube which maintains the atmospheric
pressure in the casing and in the compressor bearing system.
8) Compressor element.
4

9) Return circuit: DN 250 inlet diameter, DN 350 outlet dia-
meter, length 1,200 mm. Four tappings with a DN 50 diameter equip
this element.
i0) Cone, length 900 mm, with DN 350 - DN 400 diameters.
ii) DN 400 cylindrical element, length 700 mm, also equipped
with four DN 50 tappings. It also has the support of the wind
tunnel and allows the wind tunnel to expand longitudinally, with
the fixed point being the geared motor located near bend no. 2.
121 Bend no. 3. Same manufacture as bend no. 1 and 2. /5
13) Bend no. 4. Identical to preceding bend.
14) Plenum chamber. A cone followed by a cylindrical part
constitutes the carcass of this part which holds the pressure.
In contrast the covering is made of a thin 1.5 mm stainless steel
sheet and has a 400 mm x 400 mm, 290 mm long square-circle trans-
formation element, three 400 x 400 mm frames 100 mm long and a
convergent 290 mm long. At the outlet of the transformation ele-
ment there is an aluminum honeycomb 40 mm long, with a 6 nun mesh.
Two grids are clamped between 400 x 400 nun frames. A cloth fil-
ter 10 mm thick (P 15 500 cadi) is attached in front of the last
grid. Any fittings with the convergent is attached on one side
to a DN 600 flange provided with a 100 x 120 mm opening (with the
insulator). The other side of this flange receives the test sec-
tion.
Thermal insulation applied to the inside of the continuous
wind tunnel has the great advantage of being able to vary the tem-
perature in relatively short periods of time, because it is not
necessary to cool the outside casing too_which undergoes pressure
stresses. This condition of a large dT/dt gradient obviously re-
quires a low heat storage capacity on the surface. In the case
of use in T'3, we are satisfied with a 5 mm thickness, since
this dimension was suitable for insulating the T2 gust wind tun-
nel with an operating time of about 30 seconds.
The use of two insulators and four different glues allowed
us to test several combinations in the various sections of the
circuit.
The insulators used were the following:
a - Cork agglomerated with Triplex, 5 mm thickness;
b - Rigid polyurethane foam (Klegecell) with Triplex, 5 mm
thickness.
"Triplex" is made up of an aluminum sheet, with a thickness
of e = 40 _, glued between two fiberglass fabric sheets and coated
with a polyurethane based glue. The advantege of this layer glued
to the insulator consists of making the insulator impervious and
protecting it from possible abrasion. The disadvantage, on the
other hand, lies in the greater surface heat storage capacity, re-
sulting in a greater liquid nitrogen consumption and in the poten-
tial for establishing a heat gradient as a function of a shorter
time.
Five glues were tested:
a - Sapropene or Bostik; contact glue.
b - Elastuff 504 (DOW): polyurethane based glue, i/i mixture, /6
fast drying.
c - Macroplast UK 8202/UK 5430 (HENKEL). Polyurethane based
adhesive free of solvents, 1/4 mixture, easy to use
d - Resin XF 415 A/XF 415 B (PROCHAL). Epoxy resin based ad-
hesive containing no solvent, 3/1 mixture, highly viscous paste.

e - Araldite AV 144/HV 997 (CIBA-GEIGY). Epoxy resin ad-
hesive without solvent, 3/2 mixture, highly viscous paste.
The following combinations are shown in figure l:
1 and 2: side walls: Klegecell + Macroplast 8202
top wall: Cork + Elastuff 504
bottom wall: Kegecell + Elastuff 504
3: Cork + Prochal 415
4: Cork + Prochal 415
5: Cork + Macroplast 8202
6: Cork + Macroplast 8202
7: Cork + Prochal 415
9: Kegecell + Macroplast 8202
i0: Klegecell + Elastuff 504
ii: Klegecell + Elastuff 504
12: Klegecell + Macroplast 8202
13: Klegecell + Macroplast 8202
14: Klegecell + Macroplast 8202
15: Transformation piece: Cork + Saproprene
Frames: Cork + Saproprene
Convergent: Cork + Araldite
For the bends, the parts between the blades were covered
with cork and fastened with Saproprene or Bostik type contact glue.
The blades themselves are not heat insulated.
Given the dimensions of the wind tunnel and the electrical
availability, we limited the power of the driving system to 125 KW.
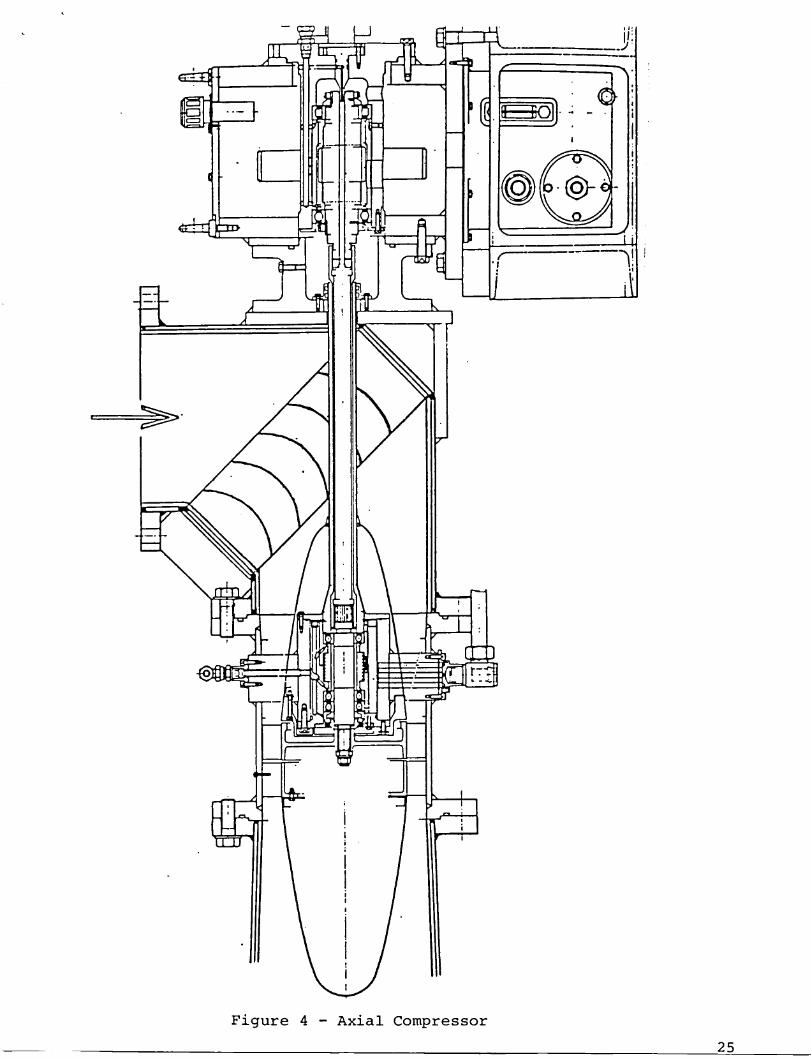
Figure 4 shows a sectional view of the axial compressor, the
connector of the driving pin in its sleeve, the 3,000 - 11,4000 rpm
multiplier with a gear stage and the speed changeable engine.
The multiplier and the engine are mounted over a chassis
7

which holds at the same time bend no. 2 and therefore the entire
rear part of the wind tunnel. A Rilson pad placed under the sup-
port of part no. ii allows the system to expand.
The one-stage compressor (Technofan ECT 900-118) is made up
of a 14-blade wheel with one 57° bitangent. A nozzle equipped
with 17 blades (79.55° bitangent) is placed downstream from the
wheel. The system is fastened with three arms in the entirely
stainless steel cylindrical carcass and which has no inside in-
sulation.
A rib is placed upstream and downstream from the compressor.
The wheel and rectifier are made of AS 7 G 06 and are subjected to
a Y 23 heat treatment. The annular passage section is formed by
the outside diameter of 247 mm and the hub diameter of 190 mm.
The wheel is driven by the transmission shaft (which can re-
volve 11,400 rpm) which crosses bend no. 2 in a 40 mm diameter
sleeve. Seals placed after the compressor bearings make it possible
to maintain the atmospheric pressure in the casing as well as inthe sleeve.
The oil tank is placed under the multiplier. The multiplier
and wheel bearing lubricator uses high fluidity oil, even at temp-
eratures as low as -50°C (Aeroshell Fluide 4). A pressure con-
troller monitors the lubrication pressure. In contrast, a thermo-
stat placed on the oil return circuit of the compressor actuates
a heating resistance in the oil tank when the oil temperature
drops too low.
The multiplier with a 3.8 ratio is driven by a C.E.M.d.c.
engine with a power of 125 KW. The regulated rotation speed is
displayed using a thyristor variator and may vary between 0 and
3,000 !_m. By subsequently connecting it to a computer it is pos-
sible to vary the rotation speed very rapidly and to thus create
8

Mach number levels which should be accompanied by an increase
or decrease in the nitrogen rate if the temperature is to be
kept constant.
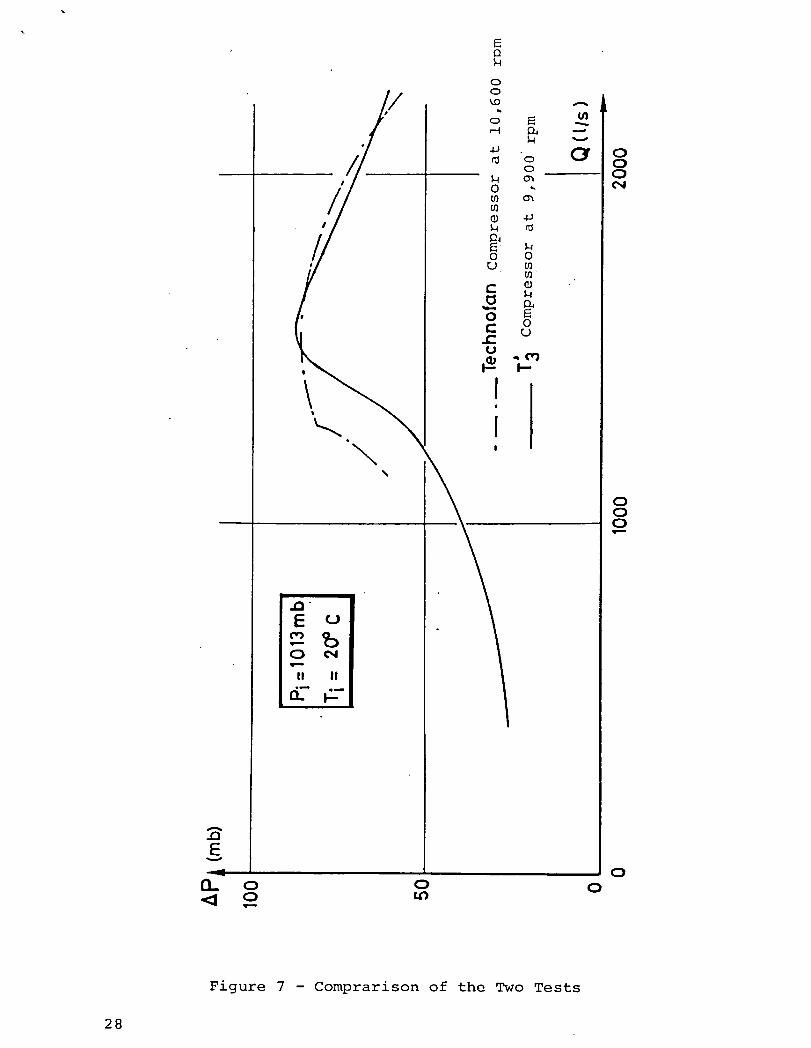
Figure 5 shows the theoretical compressor characteristics.
Figure 6 show the results obtainedwhen the equipment is accepted
and transposed forcyrogenic conditions. These tests were conducted
with suction in the open air. Figure 7 gives a comparison of the
Ap value measured at the time of acceptance in the T'3 wind tunnel.
Compared to the preceding system, for the case of very low
speeds, the liquid nitrogen injection system was modified only
very slightly. Rather than injecting in the direction of the flow,
we mounted the nozzles so that they be tangential to the wall and
sprayed perpendicular to the flow. Four nozzles may therefore be /8
installed in the three tapping sections: NW 50(6), (9) and (ii).
Figure 8 shows one of the nozzles on an NW 50 flange.
To increase the evaporation distance as far as possible in
the aerydynamic circuit and to benefit from a high kinetic energy,
we finally mounted the four nozzles at the outlet of the circle-
square transformation piece (3) behind the test section. The rods
bearing sprayers are secured by a Teflon disk and clamped between
DN 150 flanges with fastener bolts.
In regard to storage and the liquid nitrogen injector (figure
9), we simply increased the tappings on the liquid outlet of the
tank. The small dimension of the pipes (1/2") does not make it
possible to have large liquid flows when operating at high Mach
numbers and pressures of about 3 bars.
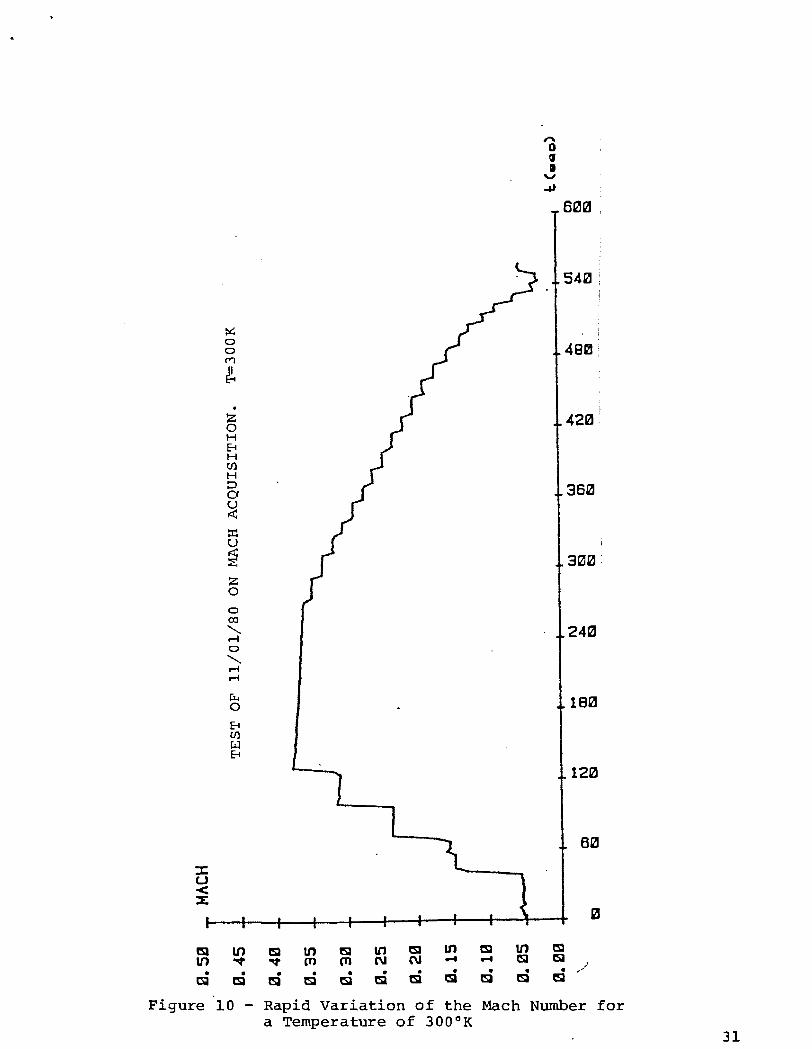
Figure i0 shows the capabilities for a rapid variation of the
Mach number (at ambient temperature).

Plate ii shows the Mach variationas a function of the
temperaturefor Pi = 1 bar and 9,880 rpm.
Figures 12 and 13 show a standard test for the temperature
and Mach number as a function of time.
3.22 - Experimental And Instrumentation Techniques
To qualify low temperature flows, we had to develop different
measuring techniques and compare them. In particular we tested the
means for measuring temperatures and their fluctuations. These
values are not only high for a wind tunnel under continuous opera-
tion, but they are also necessary to characterize the process of
rapid changes in the test conditions and for all unsteady phenomena
occurring, for example, when a gust wind tunnel is put into service.
To measure the temperatures, we have:
Platinum resistors which are also used for calibrating other
measuring systems. The response time of these probes is very high.
A platinum wire wound around a silicon rod and covered with an in-
sulator for protection (resistance of about i00 _) is used.
The thermocouples: For the temperature level which interests
us, the use of constant copper wires is generally recommended.
The wire diameter (about i/i0 mm) and the weld determines the re-
sponse time (a few Hz). The aging of the weld (preferably electri-
cal) alters the measuring reliability of the couples.
A very definite improvement in the measuring accuracy via
electromotive force is provided by sheet thermocouples made by an
evaporation process under vacuum. The thickness is so thin that
the thermocouple must be maintained over a think insulating sheet.
The response time is definitely higher compared to conventional
thermocouples.
i0
To measure the temperature fluctuations, we tested cold wires
which are therefore heat'resistant sensors powered under a low cur-
rent (hot wire). The sensors used, during tests performed by DERMES
are made from standard supports (55-P-01 type DISA probes) equipped
with platinized tungsten wires with a 9 _ diameter. This diameter
was adopted for reasons of mechanical strength. Preliminary tests
showed an excessive fragility of wires with smaller diameters (2.5
or 5 _), for flow velocities exceeding M = 0.2.
The sensors were calibrated between 300°K and II0°K and the
results showed a linear response and sensitivity of 5 mV/K for the
measuring current used. The measuring equipment is made up of a
constant current power supply (I = 4 mA), the voltage received at
the terminals of the sensor is then amplified in a 100 ratio. For
such power conditions and in flows with velocities exceeding M = 0.2,
the self-heating of the wire due to the power dissipated by Joule
effect remains less than 0.15°K, given the sensitivity of the back-
ground noise of the apparatus and this self-heating value. The ac-
curacy of the temperature measurements may be assessed to be _ 0.2°
with respect to temperature fluctuations. Measurements of the sen-
sor _ response times performed using pulse techniques, lead to an
assessment of the wire time constant between 500 and 600 _s in
flows at a temperature of 120°K and at a speed equal to M = 0.2,
i.e a bandwidth of about 250 Hz to 300 Hz.
In current tests, this bandwidth seems to be adequate. How-
ever, if this feature proved to be inadequate, the measuring ap-
paratus makes i% possible to perform field measurements of the
sensor time constant. It is then possible to correct the raw in-
dication of the termometer to characterize the temperature fluc-
tuations in a higher frequency range than the natural bandwidth
of the wire.
In effect, by illustrating the wire with a first order model,
we may express:
Ii

dTT _ + T = Tf
where T = time constant of the sensor
T = instantaneous temperature indicated by the sensor
Tf= instantaneous temperature of the fluid.
If we know T, by deriving the signal T, then multiplying and
adding to the signal we. are able to calculate the temperature :
Tf in a frequency band 5 to i0 times higher than the cut-off fre-quency relative to the time constant of the wire, or for wires
currently used, frequencies of the order of 2 kHz.
Figure 14 gives a comparison of the response time of the /10
sheet thermocouples and of the cold wire.
Figures 15 and 16 show two vertical scannings of the T'3 test
section. In the first case, the mean temperature, measured with
a thermocouple and a platinum resistor was 108°K. The engine speed:
1,500 rpm; (M = 0.4), wire diameter: 9 _. The pmobe (A) was fas-
tened to a displacement device capable of scanning the test sec-
tion vertically, whereas probe (B) was stationary in the middle
of the test section and placed about 340 mm downstream from probe
A_._ Given the scanner path, the sounding does not account for the
boundary layer thickness.
Figure 18 summarizes the development of a gust recorded this
time with two cold wires, one of which was used for sounding in the
two previous figures.
3.23 Problems Associated with Heat Fluxes and With Wall Temperatures
Besides the Reynolds number, an essential similarities para-
meter is the temperature at which the model walls actually form
during cyrogenic wind tunnel tests. The essential question is to
estimate the impact of a deviation between this temperature and
the adiabatic wall temperature corresponding to a zero heat flux.
12
We analyzed this problem using the test acquired at DERAT
in the theoretical and calculation range for boundary layers
while applying methods of calculating turbulent boundary layers
developed for compressible flows with heat flux.
Method of Calculation Used
The method of calculation primarily.used in these applica-
tions is an integral method which consists of solving overall
equations of boundary layer momentum and energy to which an over-
all equation of continuity (or,equation of drive) is included.
Additional relationships between the various integral magnitudes
of the boundary layer, required for closure, are derived from
similarities solutions formed using a diagram of the mixing length.
The method enables the main typical boundary layer thicknesses to
be calculated (displacement thickness 6., momentum thickness 8,
parameters in compressible and incompressible form, H and Hi,
as well as the local friction factor Cf and the heat flux factorCn"
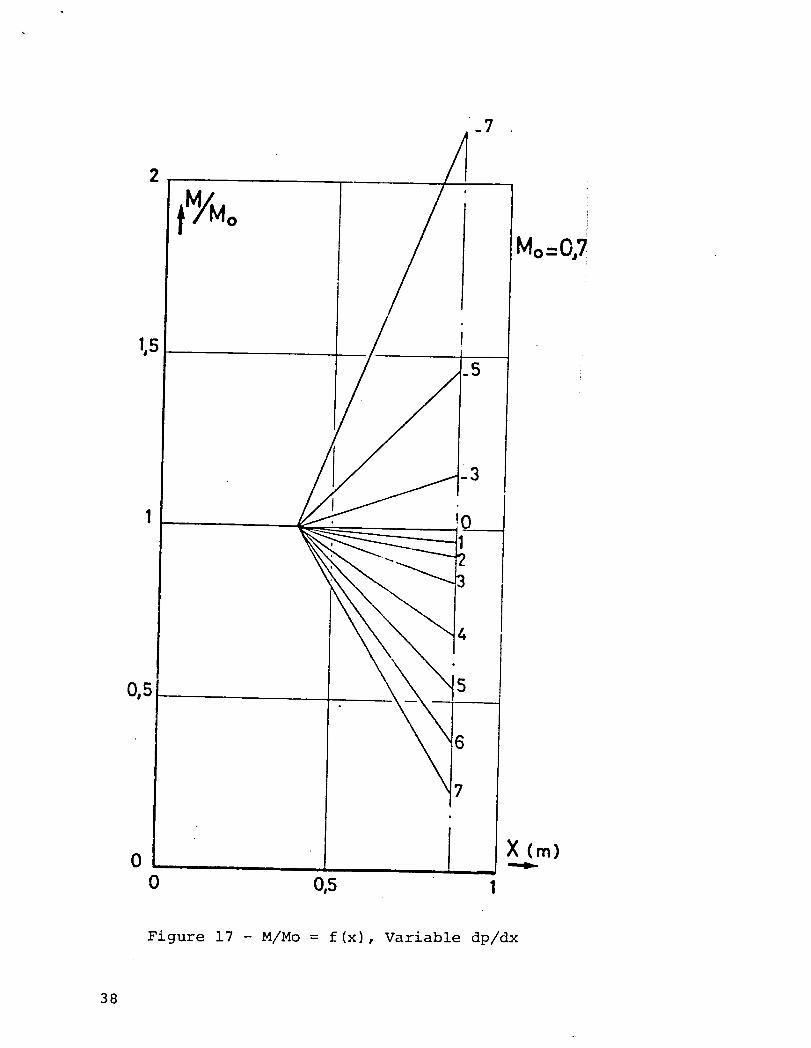
Configurations Studied /ll
Since the goal is to analyze the impact of the wall tempera-
ture as a function of the pressure gardients which may appear on
two-dimensional obstacles, in applying the calculation method, we
considered various distributions of the Mach number of the flow
outside the boundary layer. These distributions are shown in fi-
giure 17.
A uniform flow at M = 0.7 is primarily formed over a 0.4 mo
length.
Various distributions of the Mach number then give negative
puressure gradients (-7, -5, -3), a zero gradient (0) and positive
pressure gradients of variable intensity (i, 2, 3, 4, 5, 6, 7)
capable of leading to a separation of the boundary layer, assumed
13

to be turbulent from the beginning.
The total length calculated is L = 0.86 m.
The calculations were performed for three generating pres-
sures, P. = 0.1, 1 and i0 bars, for a cyrogenic flow temperaturelOT. = 120°K.lO
The Reynolds numbers based on the Mach number M = 0.7 areorespectively:
PoVoL= 3.82.106; 3.82.107 ; 3.82.108
_o
We will more especially analyze the results relative to P.lo
= 1 bar, the Reynolds number of which is the order of magnitude
of one flight Reynolds number.
To demonstrate as clearly as possible the impact of the wall
temperature, our calculations included large temperature varia-
tions, considering one case of a cold wall T = 60°K, one adia-P
batic case T = 118.9 and two hot call cases T = 200°K and T =P P P
250°K. The ratios of these temperatures to the adiabatic wall
temperature corresponding to M = 0.7 are respectively:o
T-_P = 0.5; l; 1.68; 2.1
Tfo
Results Obtained
The results for the case of an adiabatic wall (Tp = I18.9°K)for P. = 1 bar, are shown in figures 18 and 19.
10
The variation of the dispalcement thickness and of momentum
for various pressure gradients is shown in figure 18. We see very
clearly the essential impact of the pressure gradient on the
14

thickening of the boundary layer after X - 0.4 m. The negative
gradients lead to a decrease in 61and in e with respect to thecase of a zero pressure gradient. The positive gradients result
in a cons£derable increase in these thicknesses.
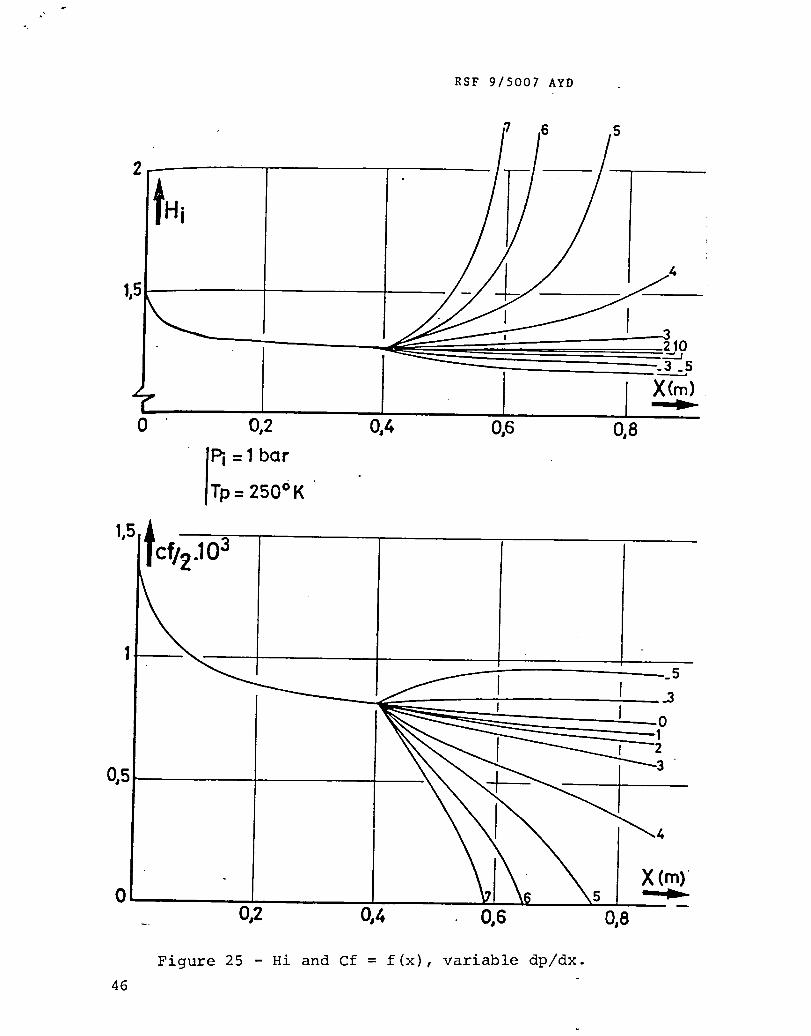
., characteris-Figure 19 gives the incompressible parameter Hl
tic of the shape of the speed profile of the turbulent boundary
layer, as well as the coefficient of local friction Cf. The im-
pact of the pressure gradient is also very important, especially
for positive gradients. Depending on their intensity, there is
a considerable increase in the shape parameter and a definite
decrease in the coefficient of friction. We are thus led to a zero
coefficient of friction, namely to a separation of the boundary
la_er whose position advances :as the pressure gradient increases.
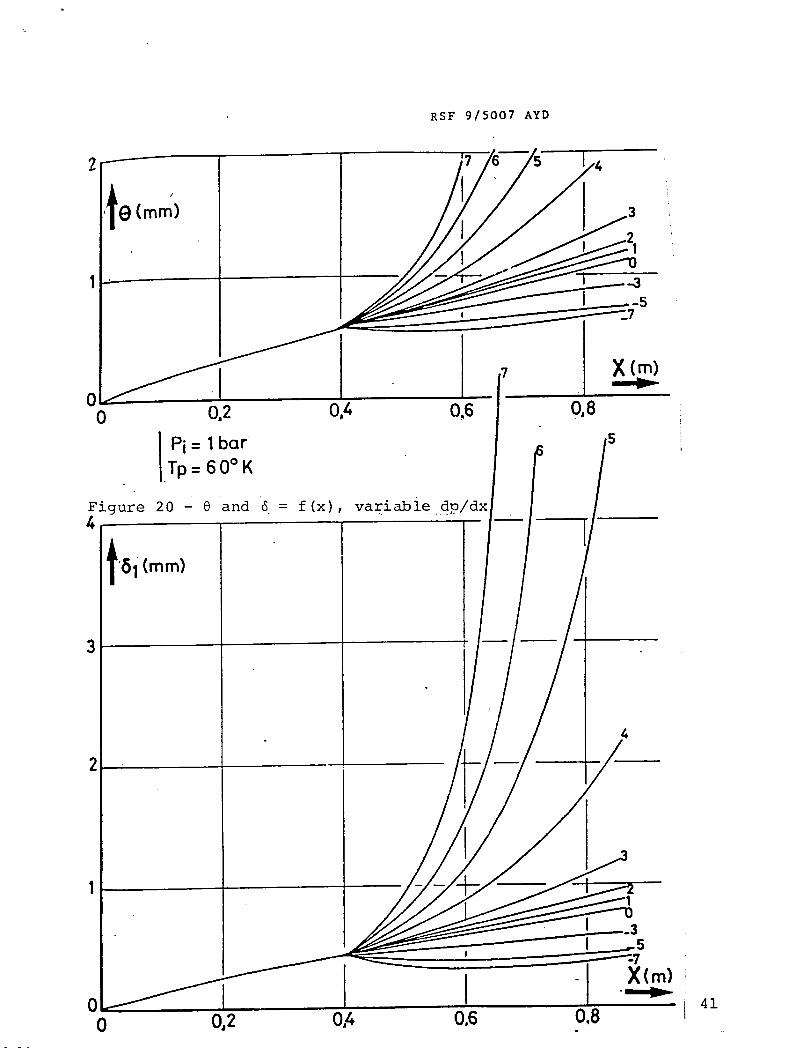
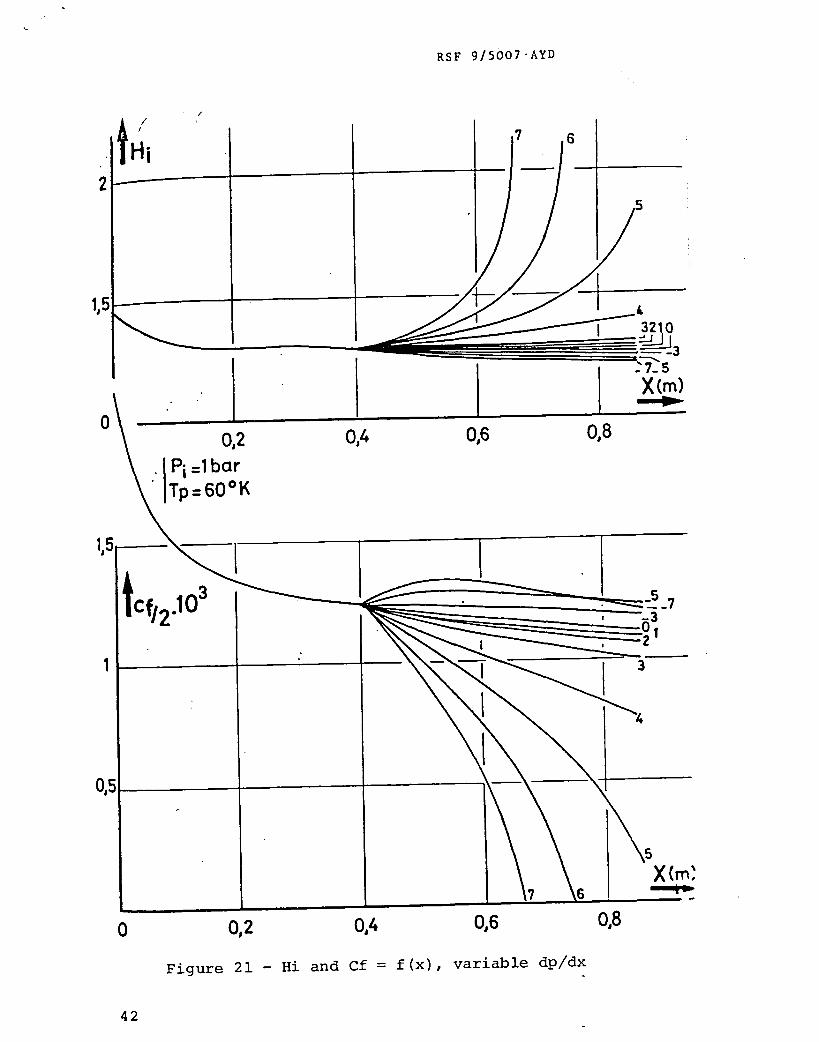
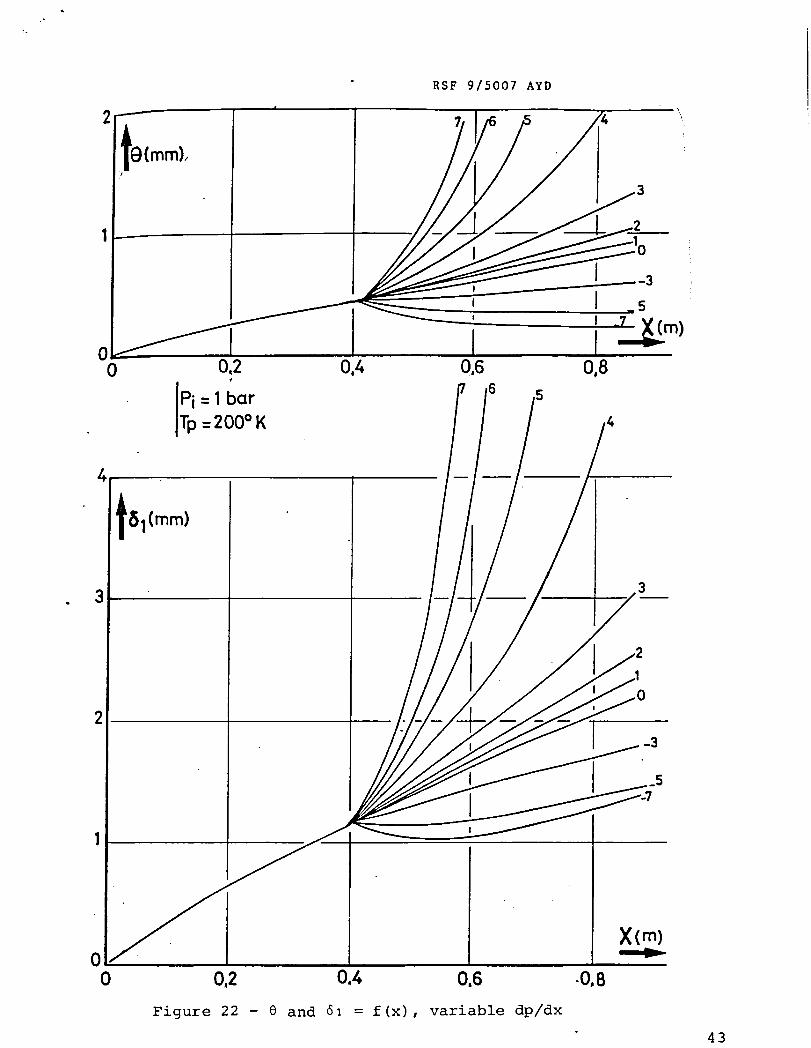
The results on the other various wall temperature values are
shown in the same way in figures 20 and 21 for T = 260°K, 22 andP23 for T = 200°K, 24 and 25 for T = 250°K.
P P
Qualitatively, the observations are perfectly comparable
to those made for the adiabatic case: the positive pressure gra-
dients always result in a considerable thickening of the boundary
layer and in a decrease in the coefficient of friction, namely
to a separation.
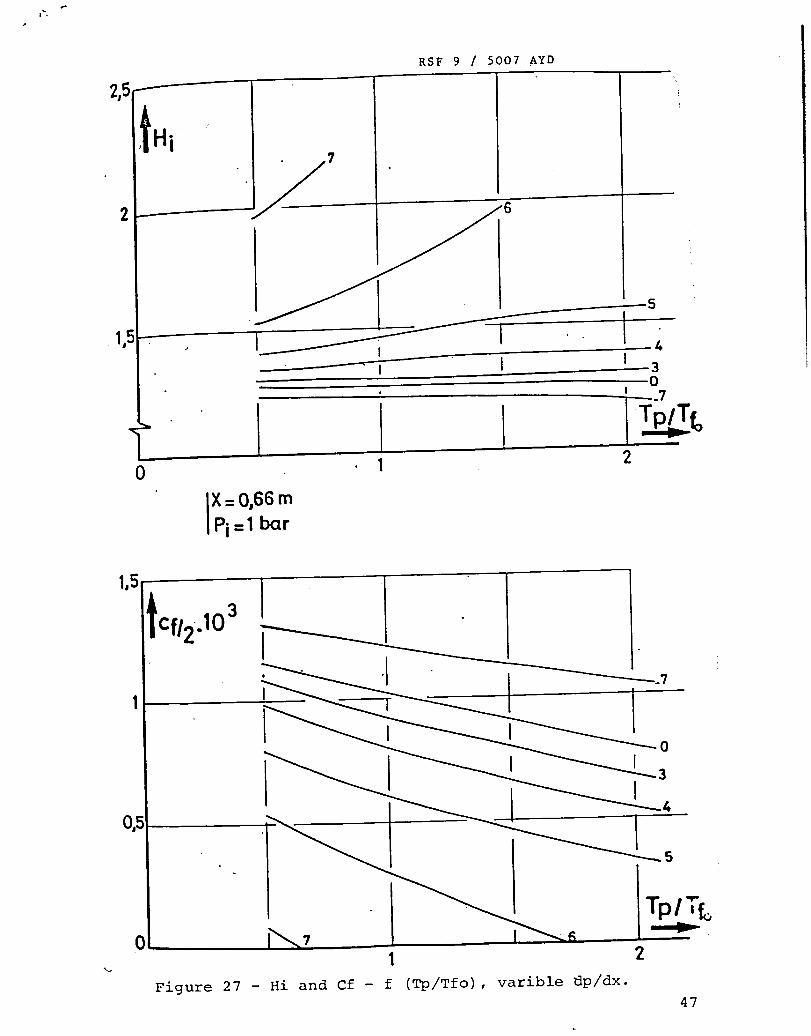
Figures 26 and 27 demonstrate the impact of the wall temper-
ature. To accomplish this, we started with a fixed abscissa, X =
0;6 mm, i.e. at about the middle of the pressure gradient part.
We plotted for the various pressure gradient cases the variation
in the thicknesses, in the shape parameter, and in the friction
as a function of the wall temperature.
The main observations are therefore the following:
.The displacement thickness increases in all cases with the
15
wall temperature level. The effect increases with the pressure
gradient.
The effect of the wall temperature on the momentum thick-
ness is much smaller. The latter increases slightly with Tp/Tffor the case of intense positive pressure gradients. On the con-
trary it tneds to decrease when Tp/Tf increases when we switchfrom intense positive gradients to negative gradients.
In regard to the impact on the shape parameter of the speed
profile, we see that the negative pressure gradients involve low
H. values. The impact of the wall temperature is too low It1
increases only for intense positive gradients resulting in speed
profiles and shape parameters which are close to those of a separ-ation.
The impact on the friction coefficient is very clear: an in- /13
crease in Tp/Tf leads in all cases to a decrease in Cf, whichconsiderably increases the tendency for separation.
Figure 28 shows simultaneously the impact of three parameters:
pressure gradient, wall temperature and pressure (or Reynolds num-
ber) on the separation of a turbulent boundary layer.
We see on the distribution curves of the outside Mach number
the position of the separation calculated for various wall temper-
atures, for P. = 0.i and 1 and i0 bars successively.10
It is clear that the separation advances _s the intensity of
the gradient increases, and as the wall temperature increases.
We also find more advanced separations as the generating pres-
sure decreases, a phenomenon which is obviously associated with
a thickets, boundary layer.
16

4 - SUMMARY OF THE RESULTS ACQUIRED
Phase i: Adjustment of A Cyrogenic T'3 Wind Tunnel
Assembly and adjustment of a cyrogenic wind tunnel under con-
tinuous operation. Installation of a new compressor with its
driving system made up of an overmultiplier with a 3.8 ratio and
a direct current engine of 125 KW. Designed for regulating the
engine speed between 0 and 3,Q00 rotations per minute.
Study of compressor performance.
Adaptation of test section to achieve transonic speeds in
the temperature range of about 120°K.
Feasibility testing of the various insulators and glues which
should hold at low temperatures.
Phase 2: Experimental Technique and Adjusting Instrumentationfor a Cyrogenic Environment
Comparison of various heat sensors to determine the response
time. Study of temperature fluctuations near 120°K.
Sensor calibration. Verification of bandwidths of about 250
to 300 Hz.
Phase 3: Problems Associated with H at Fluxes and With Wall Temp-eratures /14
Analysis of the problem of the main parameters characterizing
the boundary lyaer, namely: displacement thickness, momentum thick-
ness, shape parameter, friction coefficient and heat flux coeffi-
cient as a function of the various pressure gradients and of the
various temperature ratios Tp/Tfo. Considerable impact of positive
17

pressure gradients on the boundary layer and displacement thick-
nesses as well as on the shape parameter and on the friction coef-ficient.
Increase in the displacement thickness with the temperaturelevel.
Considerable increase in the shape parameter for intense
positive pressure gradients up to values near separation.
Decrease in the friction coefficient with an increase in the
ratio of Tp/Tf.
5 - CONCLUSIONS
Although it operates differently than a wind tunnel with
conventional gust, we were able to show that a wind tunnel under
continuous operation makes it possible to study and solve many
problems which arise when building a wind tunnel operating at
very low temperatures. The availability of the driving energy
also allows very rapid variations in the test generating condi-
tions, such as the Mach number, pressure or temperature. The
graident of the rotation speed of the compressor depends only on
the mechnical strength of the compressor and on its multiplier.
The variation in the engine speed is virtually instantaneous.
Inside insulation makes it possible to quickly vary the temp-
erature levels by varying the liquid nitrogen injection rate which
is not required to also cool the outside wall of the wind tunnel,
for example. As it is made entirely of stainless steel, a con-
tinous operation is possible.
The installation of a compressor ofr temperatures of about
120°K shows us that a construction in aluminum alloy holds well
despite the high temperature gradients it undergoes during thevarious tests.
18

A comparative study of several temperature probes, such as
a thermocouple, resistance probes, a sheet thermocouple and cold
wires enabled us to determine their response time. Use of a cold
wire with a diameter of 9 _ is very useful for measruing tempera-
ture fluctuations up to frequencies of the order of 250 to 300 Hz.
The first theoretical calculations of the variation of the /15
various parameters characterizing a boundary layer as a function
of the ratio of the Temperatures Tp/Tfo for negative and positivepressure gradients make it possible to predict tendencies for these
parameters to increase or decrease.
6 - FUTURE PROSPECTS
The first adjustment tests on the cyrogenic wind tunnel under
continuous operation and using liquid nitrogen injection into the
aerodyanmic circuit has shown the good performance of the system
and the feasibility of testing and determining the various para-
meters to characterize a transonic flow at low temperatures.
The installation of a very simple model should allow us to
check a certain number of theoretical calculations performed as
of now. The feasibility of a rapid variation in ithe rotation
speed of the compressor, in conjunction with an increase or decrease
in the injection of liquid_nitrogen into the circuit should per-
mit a very broad variation in the parameters. A data acquisition
system which is highly performing during the assembly will facil-
itate this operation.
An increase in the capacity of the liquid nitrogen tank
stored at a pressure of 12 bars, also makes it possible to increase
the speeds in the test section while the wind. tunnel is operating
under pressure.
At the same time, we will continue to perfect the theoretical
studies to have a better understanding of the droplet evaporation
phenomenon for different storage conditions.
19

REFERENCES
1. Houdeville R., Cousteix J., "Two-Dimensional Turbulent Boun-dary Layers With Heat Flux", DERAT Technical Reports No.3/5005, 4/5005, 5/5005, 6/5005.
2. Faulmann D., "Wind Tunnel With Injections At Low Temperatures",Technical Report No. 1/1977, Januayr 1977.
3. Faulmann D. Prieur J., Vergnolle J.F., "Preliminary Tests ona Transonic Installation Operating With Cyrogenic Gusts",14th Symposium of Applied Aerodynamics, AAF, Toulouse, Novem-ber 1977.
4. Michel R., Faulmann D., "Preliminary Tests in a CyrogenicTransonic Wind Tunnel Driven By Injection", Spring Meeting ofSupersonic Tunnel Association, E1 Segundo, California, USA,April 17-18, 1978, T.P. ONERA No. 1978-48 E.
5. Prieur J., Dor J.B., "Assessment of Heat Losses and Calcula-tions of the Characteristics of Flows in a Wind Tunnel With
Cyrogenic Gusts", ONERA/CERT/DERAT Technical Report No.4/5007 AND, June 1978.
6. Blanchard A., Faulmann D., "Progress Report on a CyrogenicPilot Transonic Wind-Tunnel Driven by Induction", Symposiumon Cyrogenic Wind Tunnels, Southampton, G.B., April 3-5, 1979.
7. Mignosi A., Archambaud J.P.", "Prediction of Thermal Lossesand Transient Flows in a Cyrogenic Wind Tunnel", Symposiumon Cyrogenic Wind Tunnels, Southampton, G.B., April 3-5, 1979.
2O

LIST OF FIGURES
Figure i: Diagram of the T'3 Cyrogenic Wind Tunnel
Figure 2: The T'3 Cyrogenic Wind Tunnel
Figure 3: Test Section and Neck Element.
Figure 4: Axial Compressor
Figure 5: Theoretical Performance of the Compressor
Figure 6: Experimental Results
Figure 7: Comparison of the Two Tests
Figure 8: Nitrogen Injector Installed over a NW 50 Flange.
Figure 9: Storage and Liquid Nitrogen Injection System.
Figure 10: Rapid Variation of the Mach Number for a Temperatureof 300°K.
Figure ii: Influence of t_e Temperature on the Mach Number.
Figure 12: Standard Tests For the Study of T Fluct_ations.
Figure 13: Variation of the Mach Number in the Test Section as
a Function of Time
Figure 14: Response Time of Sheet Thermocouples and of a Cold Wire.
Figure 15: Scanning in a Test Section.
Figure 16: Vertical Scanning in a Test Section.
Figure 17: M/Mo = f (x_, Variable dp/dx.
Figure 18:8 and 61 = f(x), variable dp/dx, Pi = 1 bar, Ti = I18.9°K.
Figure 19: Hi and Cf = f (x), variable dp/dx, Pi = 1 bar,T. = i18.9°K.l
Figure 20:8 and 61 = f (x), variable dp/dx, pi - 1 bar, Tp 60°K.
Cf =Figure 21: Hi and = f (x), variable dp/dx, Pi = 1 bar, Tp 60°K.
Figure 22: e and 61 = f (x), variable dp/dx, Pi = 1 bar, Tp 200°K.
Figure 23: Hi and Cf = f (x), variable dp/dx, P. = 1 bar, T = 200°K.1 pFigure 24:8 and 6_ = f (x), variable dp/dx, P. = 1 bar, T = 250°K.
l p
Figure 25: H.land Cf = f (x), variable dp/dx, P.l = 1 bar, Tp = 250'K..
Figure 26: 8 and _I = f (Tp/Tfo), variable dp/dx, X - 0.66 m,P. = 1 bar.l
Figure 27: Hi and Cf = f (Tp/Tfo), variable dp/dx, X = 0.66 m,P. = 1 bar.l
Figure 28:M/M = f (x) for P. = i0 bars, 1 bar, 0.i bar.o l
21

/i
/ I
{
\
®
i22 Figure 1 - Diagram of the T'3 Cyrogenic Wind Tunnel

Figure 2 - The T'3 Cyrogenic Wind Tunnel
23

Figure 3 - Test Section and Neck Element
24
- i
%
Figure 4 - Axial Compressor
25

Figure 5 - Theoretical Performance of the Compressor
26

Figure 6 - Experimental Results27
_ o 0 0 °
Figure 7 - Comprarison of the Two Tests
28

Flexible 1/2"
Connector
' Pressure Tao PiJ
Stainless Stee_15121
Teflon Seal
Klinqerite Seal
Tap _50
_ Wall •,, 6ram
%
njecteur IsolantInjector Insulator
Fiugre 8 - Nitrogen Injector Installed Ona NW 50 Flange.
29
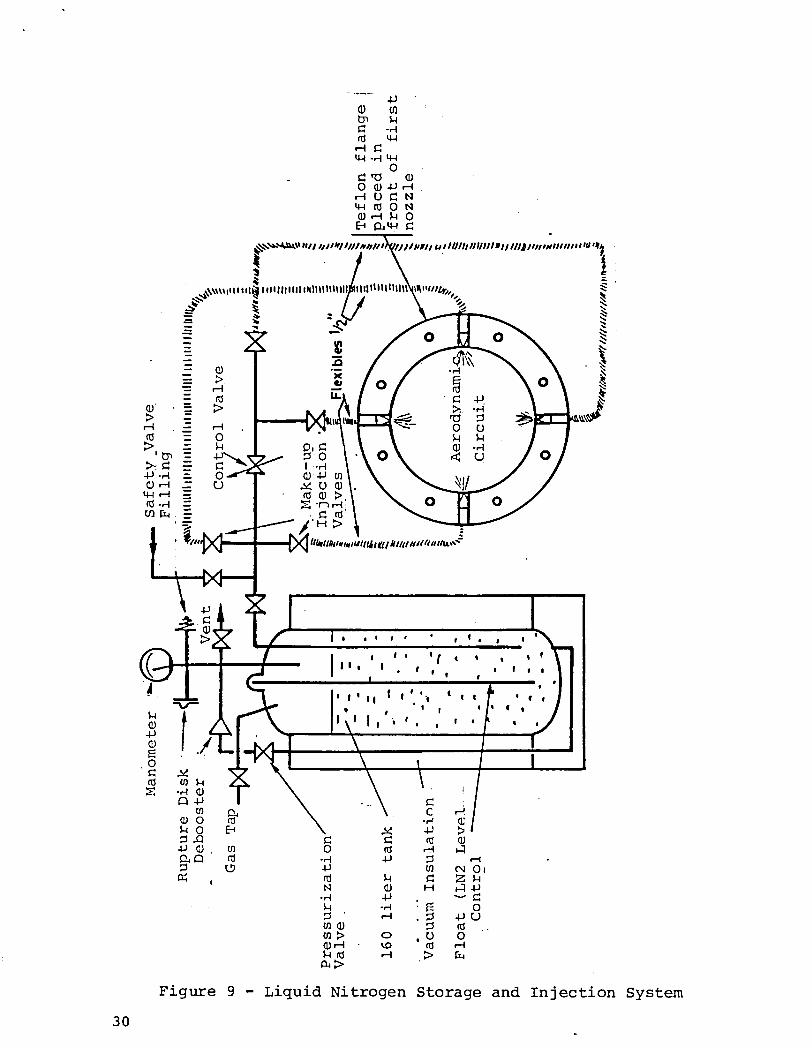
Figure 9 - Liquid Nitrogen Storage and I n j e c t i o n System
G 3 i n Q v > c a i n G 3 m = m ^ i n  ¥ f - 4 - ( n r n c y ( V  ¥ - à §  ¥ i a i a t a Q 6 a 6 a & Q Q G ] ~ * ~
Figure 1 0 - Rapid Variation of the Mach Number f o r a Temperature of 300aK

Figure 11 - Impact of Temperature on the Mach Number

Figu re 12 - Standard T e s t f o r t h e Study of T F l u c t u a t i o n s

F i g u r e 1 3 - V a r i a t i o n of Mach Number i n T e s t S e c t i o n 3 4 A s a Funct ion o f T ime

0
0
Haul llJz €-
_"' I
_:_ o ov
Figure 14 - Response Time of Sheet Thermocouplesand of Cold Wire
35

) Upper Floor at
/ 30 mm _
tP
-- .
/ Fixed Probe A
Mobile Probe B/
--A-8
T Lower Floor at _o____20 mm !
Cold Wire Test of 9 Z, Ti=108°K, Engine Speed: 1500 rpm
Figure 15 - Scanning the Test Section
36

-- L |- - ,
i 5 Upper F'loor
at 25 mm
Y
1
Fixed Probe
Lower Floorat 25 mm
2000 rpmCold Wire Test of 9_, Tl=158°K Engine Speed:
Figure 16 - Vertical Scanning of Test Section
37
_7
2
°Mo=O,7
1,5 I.5
I !,)___
0,5 5
6
7t
0 X (m)0 O,5 1
Figure 17 - M/Mo = f (x), Variable dp/dx
38

z!_ . I '(ram)'
,II
3
i .-sI ---7
00 02 0,4 0°6 0,8
I Pi = 1bar 7 s lTi I18,9°K6
61(ram) 4
3 I
32
°0
.-3
I -5i
G
I0 X(m)
0 %2 _0,4 o,s o,8Figure 18 - 8 and 61 = f(x), variable dp/dx
39

--7Zs
I X(m)00 0.2 0,4 0,6 0,8
IPi = 1barTi = 118.9°K Figure 19 " Hi and Cf = f(x),variable dp/dx.
2
1,5
7
' .3I
O,5
X(m)0 s
0 0.2 0,4 0.6 0,8
4O
RSF 915007 AYD
/
_g(ram)
X (m)
o_ I /_o o.2 0,4 o,6 %8
I Pi = I bar s.Tp= 60°K
Figure 20 - O and _ = f(x), variabie.d.p/dx4
t61 (ram)
3
4
I __5
'-,,-,ID-.o 410 O,2 0,4 0.6 0,8
RSF 9/5OO7"AYD
/ •
I 6
1,5
{ 3210JJJ-3
×(m)0 _
0,2 0,4 0,6 0,8
• IPi=1barITp=60°K
0,5
5
X(m',L
0 0,2 0,4 0,6 0,8
Figure 21 - Hi and Cf = f(x), variable dp/dx
42
RSF 9/5007 AYD
f
re(ram),
I ----3I
, I s
' I -_.m)
0 0.2 0,4 0,6 0,8
jP;,or ° '=200° K 4
4
t61(mm)
• 3 3
2-3
_5
I X(m)0 0,2 0.4 0.6 -0.8
Figure 22 - e and 61 = f(x), variable dp/dx
43

J
RSF 9/5007 AYD
,IHi2
41,5
.=._57X(m)
O. 0,2 0,4 .%6 0,8= 1bar
Tp=200° K
X(m)O"0 0,2 %4 o,6 %8
Figure 23 = Hi and Cf - f(x), variable dp/dx
44

._
RSF 9/5OO7 AYD
2--
t_O (ram)
I _3I a
-SX(m)o I I Io [----o 0,2 0,4 7 0,8
ITp=250OK s i
t61(mm)3
.
_5
I
1
X (n ._OJ0 0.2 _ 0.4_ 0,6 " 0,8
Figure 24 - 8 and 6z = f(x), variable dp/dx 45
RSF 9/5OO7 AYD
6 5
I
.3.s
X(m)0 %2 %4 %6 %8
PI = 1barTp= 250°K
1,Stcf/2.103
1,_5
I I _3i I o
II 2
o.s
X(m)0 ----I--
o,2 %4 o,6 %8
Figure 25 - Hi and Cf = f (x), variable dp/dx.
46
RSF 9 / 5007 AYD
Hi _
2 ._7
!
5
1.5 .. I J_f I--j I ! 3
0' ! .7
0 I 2
X=0,66rnPi=Ibar
1,5
I
__ 1 2Figure 27 - Hi and Cf - f (Tp/Tfo), varible dp/dx.
47

RSF 9/5007 AYD
250°K
0,5 118,9"K 5 Pi =10bars60o14
6
7
X(m)0
0,4 0,6 0,8 11
250°K118,9°K
0,5 5 pi =O,lbar6
7
X(m)0
0,4 0,6 0,8 11
250"14 200°K118,9o K 5 PI = 1bar
o,s6
I X(m)0,4 0,6 0,8 1
Figure 28 - M/Mo = f(x)
48

flliiiiTliiliiiiiii_iillI_._31176 001_90.6974