NASA Technical 943
15
r NASA Technical 943 P Jack Telesman Lewis Research Center Cleveland, Ohio and University June 1988
Transcript of NASA Technical 943
r
NASA Technical 943
P
Jack Telesman Lewis Research Center Cleveland, Ohio
and
University
June 1988
c
P
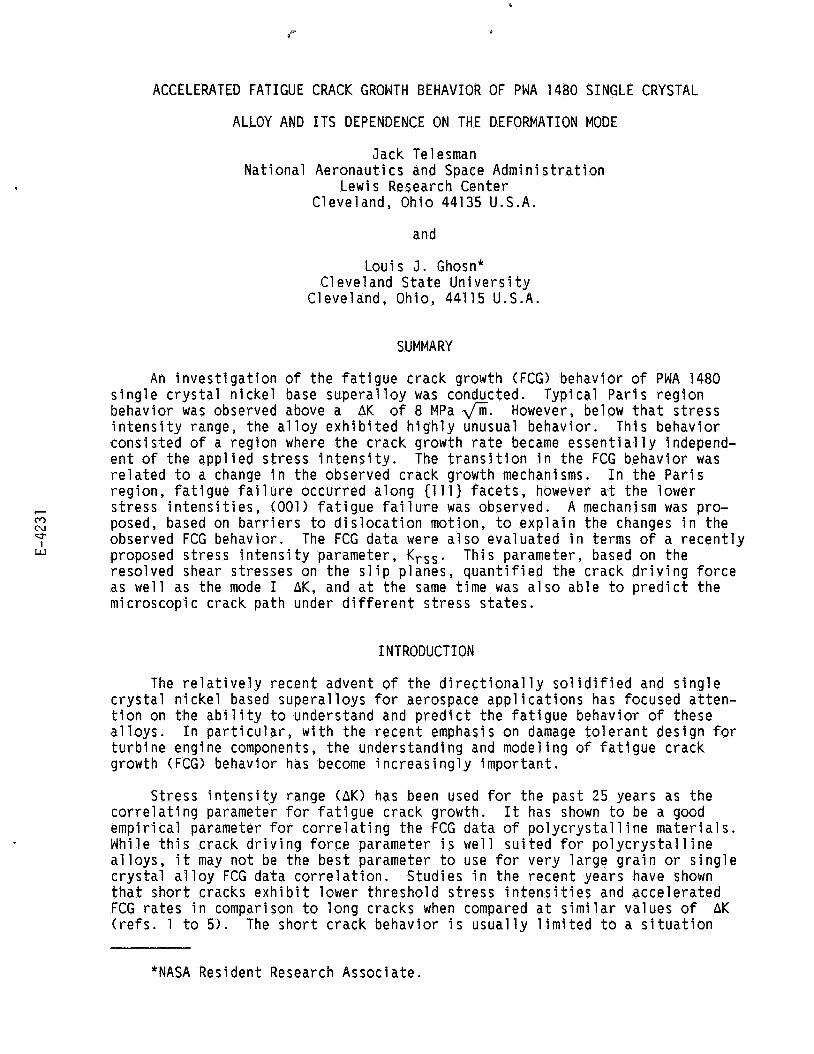
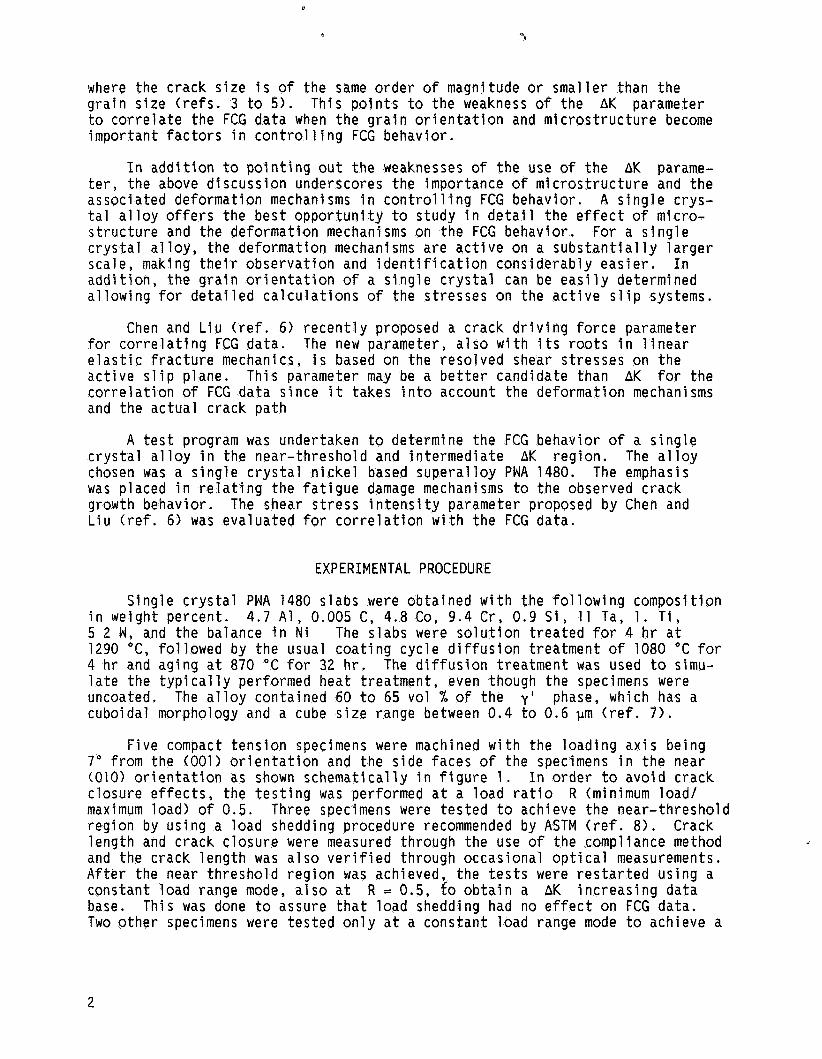
ACCELERATED FATIGUE CRACK GROWTH BEHAVIOR OF PWA 1480 SINGLE CRYSTAL
ALLOY AND I T S DEPENDENCE ON THE DEFORMATION MODE
Jack Telesman Nat ional Aeronaut ics and Space Admin i s t ra t i on
Lewis Research Center Cleveland, Ohio 44135 U.S.A.
and
Louis J. Ghosn* Cleveland Sta te U n i v e r s i t y
Cleveland, Ohio, 44115 U.S.A.
SUMMARY
An i n v e s t i g a t i o n o f the fa t i gue crack growth (FCG) behavior o f PWA 1480 s i n g l e c r y s t a l n i cke l base supera l loy was conducted. Typica l Pa r i s reg ion behavior was observed above a AK o f 8 MPa fi. However, below t h a t s t ress i n t e n s i t y range, the a l l o y e x h i b i t e d h i g h l y unusual behavior. This behavior cons is ted o f a reg ion where the crack growth r a t e became e s s e n t i a l l y independ- en t o f the app l ied s t ress i n t e n s i t y . The t r a n s i t i o n i n the FCG behavior was r e l a t e d t o a change i n the observed crack growth mechanisms. reg ion, f a t i g u e f a i l u r e occurred a long {lll} face ts , however a t the lower
I n the Par i s
7 s t r e s s i n t e n s i t i e s , (001) f a t i g u e f a i l u r e was observed. A mechanism was pro- M c\I posed, based on b a r r i e r s t o d i s l o c a t i o n motion, t o exp la in the changes i n the
I observed FCG behavior. The FCG data were a l s o evaluated i n t e r m s o f a r e c e n t l y W e
proposed s t r e s s i n t e n s i t y parameter, K r s s . reso lved shear stresses on the s l i p planes, quan t i f i ed the crack d r i v i n g f o r c e as w e l l as the mode I AK, and a t the same t i m e was a l s o able to p r e d i c t the microscopic crack path under d i f f e r e n t s t r e s s s ta tes .
This parameter, based on the
INTRODUCTION
The r e l a t i v e l y recent advent o f the d i r e c t i o n a l l y s o l i d i f i e d and s i n g l e c r y s t a l n i c k e l based superal l o y s for aerospace appl i cat ions has focused a t ten- t i o n on the a b i l i t y to understand and p r e d i c t the f a t i g u e behavior o f these a l l o y s . I n p a r t i c u l a r , w i t h the recent emphasis on damage t o l e r a n t design for tu rb ine engine components, t he understanding and modeling o f f a t i g u e crack growth (FCG) behavior has become i n c r e a s i n g l y impor tant .
S t r e s s i n t e n s i t y range (OK) has been used fo r the pas t 25 years as the c o r r e l a t i n g parameter f o r f a t i g u e crack growth. I t has shown to be a good empi r i ca l parameter fo r c o r r e l a t i n g the FCG data o f p o l y c r y s t a l l i n e m a t e r i a l s . While t h i s crack d r i v i n g f o r c e parameter i s w e l l s u i t e d f o r p o l y c r y s t a l l i n e a l l o y s , i t may no t be the bes t parameter t o use for very l a rge g r a i n or s i n g l e c r y s t a l a l l o y FCG data c o r r e l a t i o n . Studies i n the recent years have shown t h a t sho r t cracks exhi b i t lower th resho ld s t r e s s i n t e n s i t i e s and acce le ra ted FCG ra tes i n comparison t o long cracks when compared a t s i m i l a r values o f AK ( r e f s . 1 t o 5) . The sho r t c rack behavior i s u s u a l l y l i m i t e d t o a s i t u a t i o n
*NASA Resident Research Associate.
where the crack s i ze i s of the same order o f magnitude o r smal ler than the g ra in s ize ( r e f s . 3 t o 5). This p o i n t s t o the weakness o f the AK parameter t o c o r r e l a t e the FCG da ta when the g r a i n o r i e n t a t i o n and m ic ros t ruc tu re become important fac to rs i n c o n t r o l l i n g FCG behavior.
I n a d d i t i o n to p o i n t i n g o u t the weaknesses o f the use o f the AK parame- t e r , the above d iscuss ion underscores the importance o f m ic ros t ruc tu re and the associated deformat ion mechanisms i n c o n t r o l l i n g FCG behavior. A s i n g l e crys- t a l a l l o y o f f e r s the bes t oppor tun i t y t o study i n d e t a i l the e f f e c t o f micro- s t ruc tu re and the deformat ion mechanisms on the FCG behavior. For a s i n g l e c r y s t a l a l l o y , the deformat ion mechanisms are a c t i v e on a s u b s t a n t i a l l y l a r g e r scale, making t h e i r observa t ion and i d e n t i f i c a t i o n considerably eas ie r . I n add i t i on , the g r a i n o r i e n t a t i o n of a s i n g l e c r y s t a l can be e a s i l y determined a l l ow ing for d e t a i l e d c a l c u l a t i o n s o f the s t r e s s e s on the a c t i v e s l i p systems.
Chen and L i u ( r e f . 6) r e c e n t l y proposed a crack d r i v i n g f o r c e parameter f o r c o r r e l a t i n g FCG data. The new parameter, a l s o w i t h i t s r o o t s i n l i n e a r e l a s t i c f r a c t u r e mechanics, i s based on the reso lved shear s t r e s s e s on the ac t i ve s l i p plane. This parameter may be a b e t t e r candidate than AK f o r the c o r r e l a t i o n o f FCG da ta s i n c e i t takes i n t o account the deformat ion mechanisms and the ac tua l crack pa th
A t e s t program was undertaken to determine the FCG behavior o f a s i n g l e c r y s t a l a l l o y i n the near- threshold and in te rmed ia te AK reg ion. The a l l o y chosen was a s i n g l e c r y s t a l n i c k e l based supera l loy PWA 1480. The emphasis was placed i n r e l a t i n g the f a t i g u e damage mechanisms t o the observed crack growth behavior. The shear s t r e s s i n t e n s i t y parameter proposed by Chen and L i u ( r e f . 6) was evaluated for c o r r e l a t i o n w i t h the FCG data.
EXPERIMENTAL PROCEDURE
Sing le c r y s t a l PWA 1480 slabs were obta ined w i t h the fo l l ow ing composi t ion i n weight percent. 4.7 A I , 0.005 C, 4.8 Co, 9.4 C r , 0.9 S i , 1 1 Ta, 1 . T i , 5 2 W , and the balance i n N i The slabs were s o l u t i o n t rea ted for 4 h r a t 1290 "C, fo l lowed by the usual coa t ing cyc le d i f f u s i o n t reatment o f 1080 "C fo r 4 h r and aging a t 870 "C for 32 h r . l a t e the t y p i c a l l y performed heat t reatment, even though the specimens were uncoated. The a l l o y conta ined 60 t o 65 vo l % o f the y ' phase, which has a cuboidal morphology and a cube s i ze range between 0.4 t o 0.6 pm ( r e f . 7 ) .
The d i f f u s i o n t reatment was used to simu-
F i v e compact tens ion specimens were machined w i t h the load ing a x i s being 7" f rom the (001) o r i e n t a t i o n and the s ide faces o f the specimens i n the near (010) o r i e n t a t i o n as shown schemat ica l l y i n f i g u r e 1 . I n o rder t o avo id crack c losure ef fects , the t e s t i n g was performed a t a load r a t i o R (minimum load/ maximum load) o f 0.5. Three specimens were tes ted t o achieve the near- threshold reg ion by us ing a load shedding procedure recommended by ASTM ( r e f . 8) . Crack length and crack c losure were measured through the use o f the compliance method and the crack length was a l s o v e r i f i e d through occasional o p t i c a l measurements. A f t e r the near th resho ld reg ion was achieved, the t e s t s were r e s t a r t e d us ing a constant load range mode, a l s o a t R = 0.5, fo o b t a i n a hK inc reas ing data base. This was done to assure t h a t load shedding had no e f f e c t on FCG data. Two o the r specimens were tes ted o n l y a t a constant load range mode to achieve a
2

FCG data base i n the in te rmed ia te AK reg ion . A l l the t e s t s , w i t h one excep- t i o n , were conducted i n l abo ra to ry environment and a t room temperature. One t e s t i n the near th resho ld reg ion was conducted i n a n i t rogen atmosphere t o analyze any poss ib le environmental e f f e c t s on FCG behavior. A l l the t e s t i n g was done a t a frequency o f 20 Hz. For comparison purposes, th ree a d d i t i o n a l t e s t s were performed on a r e a d i l y a v a i l a b l e p o l y c r y s t a l l i n e n i c k e l base super- a1 loy . Waspaloy d i s k f o r g i n g under t e s t cond i t ions i d e n t i c a l to those o f PWA 1480, w i t h the except ion t h a t no n i t rogen t e s t i n g was performed.
These t e s t s were performed on specimens machined from a p o l y c r y s t a l 1 i ne
The s t ress and displacement f i e l d s , a long a g iven crack path, were deter- mined for FCG data c o r r e l a t i o n us ing the two dimensional boundary i n t e g r a l equat ion (BIE) method ( r e f . 9). separate subregions w i t h appropr ia te c o n t i n u i t y a long the i n t e r f a c e . A t y p i c a l two-dimensional mult idomain B I E mesh f o r the compact tens ion specimen i s shown i n f i g u r e 2. The number o f elements and the r i g i d body cons t ra in t s a re a l s o shown. Quadra t ic v a r i a t i o n s o f the displacements and t r a c t i o n s are assumed. i s o t r o p i c s o l u t i o n i s used s ince i t has been shown by Chan and Cruse ( r e f . 10) t h a t the d i f f e r e n c e between an iso t rop i c and i s o t r o p i c so lu t i ons are n e g l i g i b l e f o r the s i n g l e c r y s t a l n i c k e l based supera l loy. The shear s t ress i n t e n s i t y f a c t o r parameter was determined from the s t r e s s f i e l d s o l u t i o n near the crack t i p by the p r o j e c t i o n o f the t r a c t i o n on a s l i p plane i n the d i r e c t i o n o f s l i p , as proposed by Chen and L i u ( r e f . 6). d e t a i l i n a l a t e r sec t ion .
The two surfaces o f the crack are modeled i n
An
This procedure i s expla ined i n more
REGION I
4
$3 QUADRAT IC 4 7%
ELEMENT
FIGURE 2, . TWO-DIMENSIONAL MULTIWMAIN BOUNDARY INTE- GRAL MESH,
3
RESULTS
Macroscopic Observations of Failed Specimens
For all the PWA 1480 specimens tested, the macroscopic failure planes were approximately 7" to the plane of the starter notch. Thus the macroscopic fail- ure occurred on the (001) plane. Small amounts of secondary cracking were observed on the (111) type planes at higher stress intensity ranges. Waspaloy specimens failed in the plane o f the starter notch.
The
Fatigue Crack Growth Results
Chan and Cruse (ref. 10) have shown that the ASTM stress intensity solu- tion for a mode I crack is valid for single crystal compact tension specimens having an inclined crack, provided that the crack angle i s less than 30" from the starter notch. angle, thus mode I solutions were used to correlate the FCG data.
The PWA 1480 specimens tested exhibited only a 7" crack
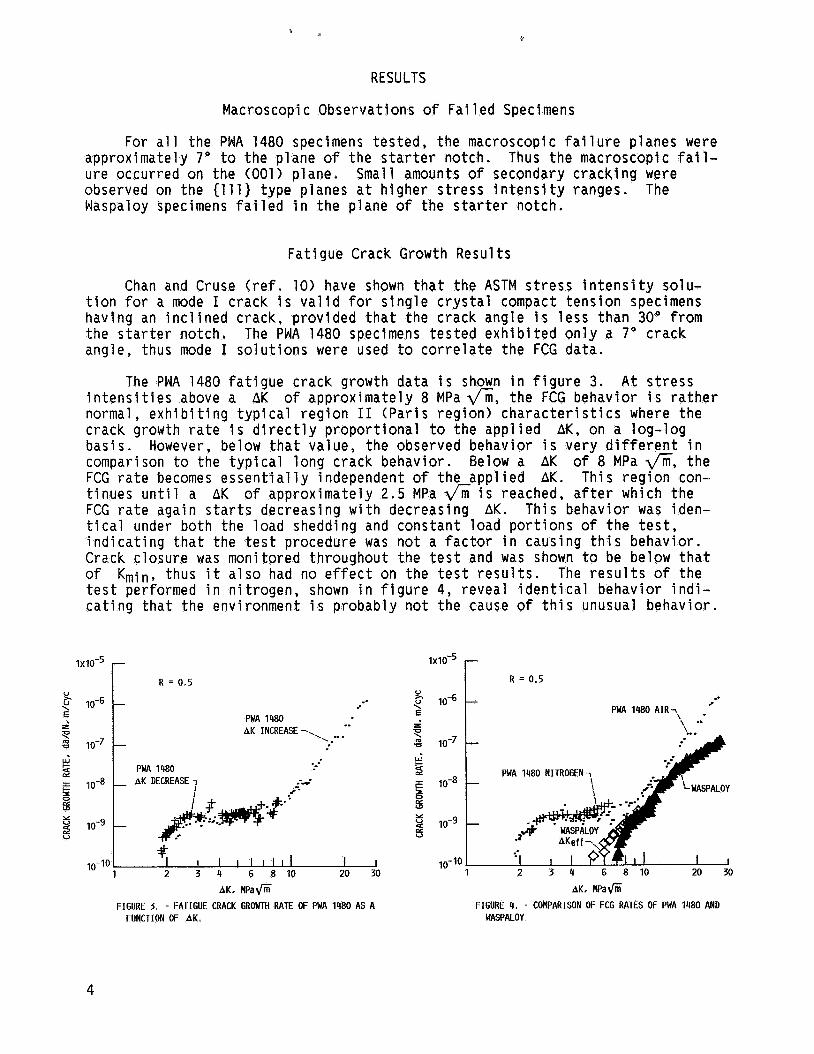
The PWA 1480 fatigue crack growth data is shown in figure 3 . At stress intensities above a AK of approximately 8 MPa 6, the FCG behavior is rather normal, exhibiting typical region I1 (Paris region) characteristics where the crack growth rate is directly proportional to the applied AK, on a log-log basis. However, below that value, the observed behavior is very different in comparison to the typical long crack behavior. Below a AK of 8 MPa 6, the FCG rate becomes essentially independent of the applied AK. This region con- tinues until a AK of approximately 2.5 MPa 6 is reached, after which the FCG rate again starts decreasing with decreasing AK. This behavior was iden- tical under both the load shedding and constant load portions of the test, indicating that the test procedure was not a factor in causing this behavior. Crack closure was monitored throughout the test and was shown to be below that of Kmin, thus it also had no effect on the test results. The results of the test performed in nitrogen, shown in figure 4, reveal identical behavior indi- cating that the environment is probably not the cause of this unusual behavior.
10-7 r 1x10⁻⁵ r R = 0.5 U h
Y
2 LLi
E
L U
U
+ 4 &
I
!3 W
Y d V
.. 8
.. PWA 1480 AK INCREASE-.. ... '.
.. I PWA 1480
+- I I I I I I I I I I
1 2 3 4 6 8 1 0 20 30 10-10
AK, w a f i
FIGURE 3, - FATIGUE CRACK GROWTH RATE OF PWA 1480 AS A FUNCTION OF A K ,
t 1x10⁻⁵ r R = 0.5
U =.. Y
2
d
E
L U
U
e $ CIC
W
Y U 4 & V
.- PWA 1480 A I R 7 .' ', ..
2 3 4 G 8 1 0 20 30
AK, MpaG FIGURE 4. - COMPARISON OF FCG RATES OF PWA 1480 AND
WASPALOY
4
0 L PAGE IS OF POOR QUALITY
A comparison of the FCG behavior of PWA 1480 and Waspaloy is also shown in figure 4. Waspaloy FCG behavior is quite different and resembles that of typi- cally observed long crack growth curves. For Waspaloy, in the near threshold regime, the crack closure stress intensity factor, Kcl, was reached at K val- ues somewhat above the Kmin. also shown in figure 4 based on the effective AK, (AKeff). The corrected data still exhibits the typically observed FCG trends.
The data was corrected for crack closure and is
Review of the literature failed to reveal any previous observations in a
Nor was any near-threshold single polycrystalline alloy under prevailing linear elastic conditions, which are similar to the observed PWA 1480 behavior. crystal data found in the literature to which the current results could be compared.
The region of unusual FCG behavior of PWA 1480 is similar in appearance to the accelerated crack growth behavior reported for short cracks (refs. 1 to 5) . Whether this similarity is coincidental or whether it is an indication of a single phenomenon is a topic for future studies.
Fractography of PWA Specimens
A detailed fractographic evaluation was performed on the PWA 1480 speci- mens to determine the microscopic deformation modes and their relationship to the observed FCG behavior.
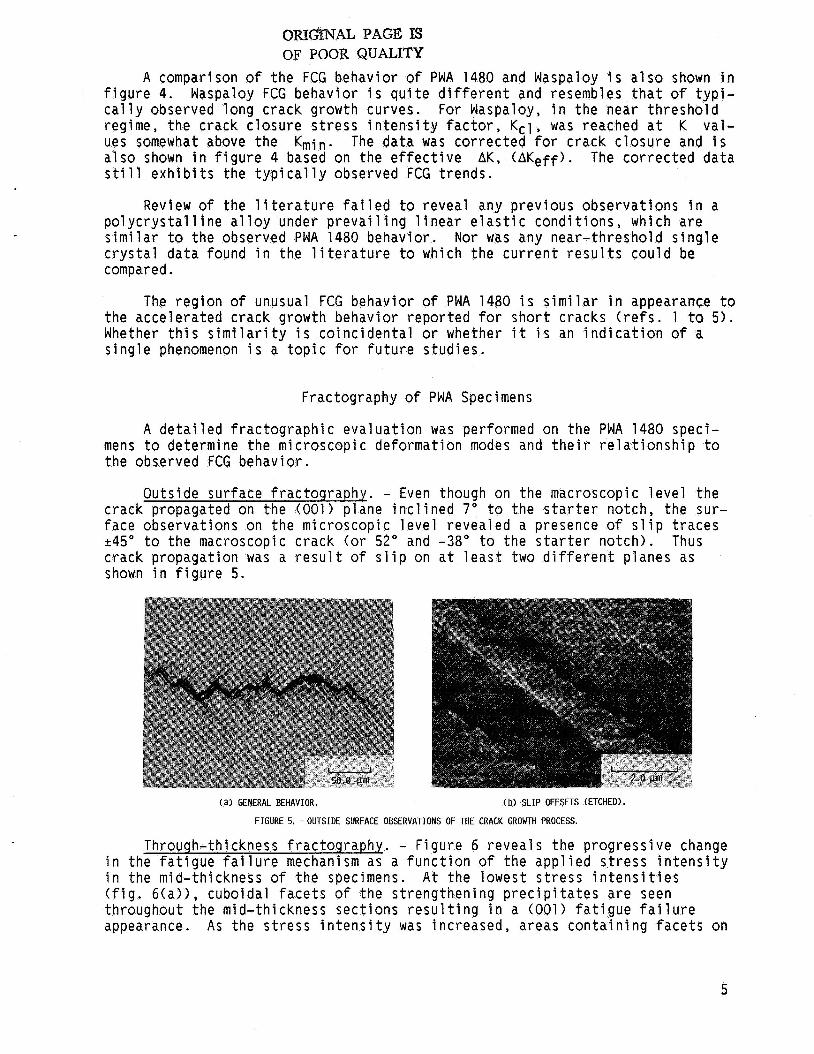
Outside surface fractography. - Even though on the macroscopic level the crack propagated on the (001) plane inclined 7" to the starter notch, the sur- face observations on the microscopic level revealed a presence of slip traces *45" to the macroscopic crack (or 52" and -38" to the starter notch). Thus crack propagation was a result of slip on at least two different planes as shown in figure 5.
(a ) GENERAL BEHAVIOR. (b) SLIP OFFSETS (ETCHED).
FIGURE 5. - OUTSIDE SURFACE OBSERVATIONS OF THE CRACK GROWTH PROCESS.
Through-thickness fractography. - Figure 6 reveals the progressive change in the fatigue failure mechanism as a function of the applied stress intensity in the mid-thickness of the specimens. At the lowest stress intensities (fig. 6(a>), cuboidal facets of the strengthening precipitates are seen throughout the mid-thickness sections resulting in a (001) fatigue failure appearance. As the stress intensity was increased, areas containing facets on
5

(111) planes also became apparent (fig. 6(b)>. stress intensity, the (001) fatigue failure completely disappeared, and was replaced by the (111) fatigue failure (figs. 6(c) and ( d ) ) . figures, the increase in the AK resulted in an increase in the size of the (111) failure facets. all four (111) planes.
With a further increase in the
As seen in these
Also, in the mid-thickness areas the failure occurred on
(a) AK = 2.2 MPafi (ETCHED). (b) AK = 8.9 MPafi.
(c) AK = 18.5 PlPafi. (d) FINAL FAILURE A K =-40 MPafi.
FIGURE 6. - MID-THICKNESS FAILURE APPEARANCE AT VARIOUS AK.
An interesting phenomenon was observed with regard to the (001) fatigue failure. Examination of the small ridges (or steps) on the etched failure sur- face, as viewed in figure 6 ( a ) and at a higher magnification in figure 7, sug- gests that the failure was confined only to the matrix phase. obtained by Miner et al. (ref. 1 1 ) can be used to support the above suggestion. They have shown that only octahedral (111) slip is active for a (001) oriented single crystal at room temperature. Since no (111) facets were visible on the failure surface at low AK, and (001) cube slip is unlikely, the only plausible mechanism which could explain the presence of (001) y ' cuboidal facets on the failure surface is the confinement of the (111) slip deformation to the matrix network. mission electron microscopy (TEM). A hypothesis explaining why such mechanism is occurring and its influence on the FCG behavior is described later on in the paper.
The results
The (111) matrix slip deformation cannot be resolved without trans-
6
_. QlUGINfi PAGE 1s BOOR QUALITY
,.
!
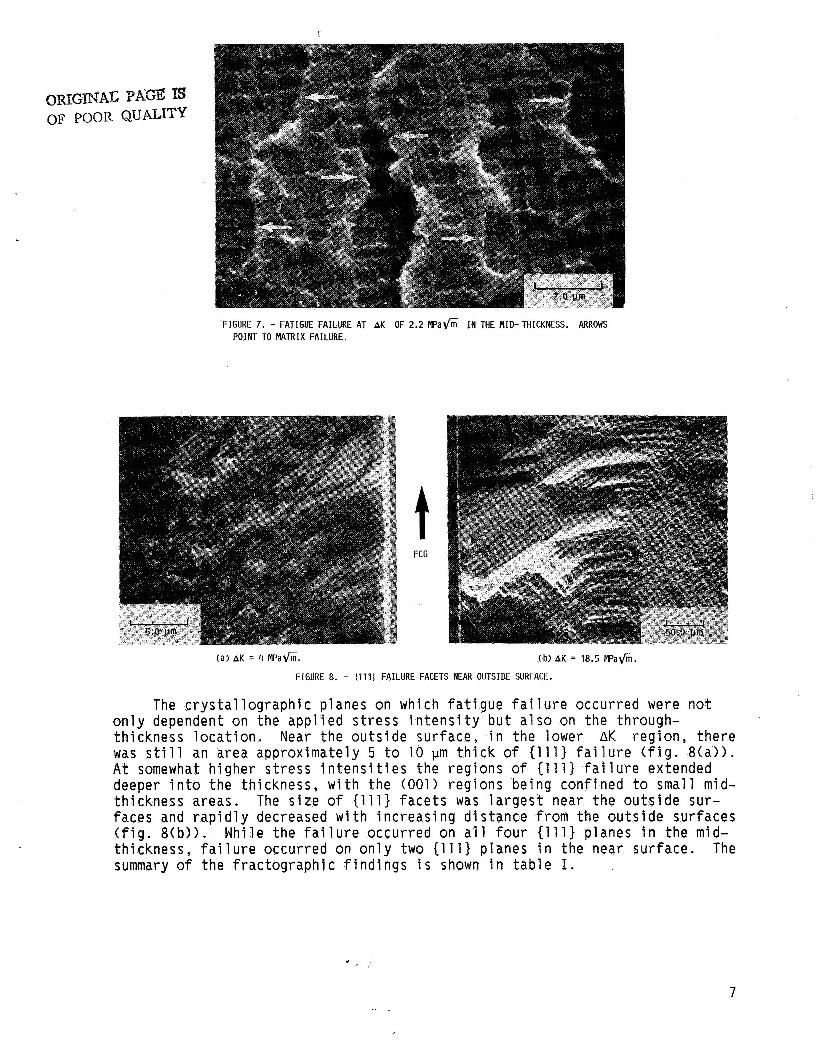
FIGURE 7. - FATIGUE FAILURE GT AK OF 2.2 MPafi IN THE MID- THICKNESS. ARROWS POINT TO MATRIX FAILURE.
t FCG
(b) AK = 18.5 NPafi.
FIGURE 8. - (111) FAILURE FACETS NEAR OUTSIDE SURFACE.
The crystallographic planes on which fatigue failure occurred were not only dependent on the applied stress intensity but also on the through- thickness location. Near the outside surface, in the lower AK region, there was still an area approximately 5 to 10 pm thick of (111) failure (fig. 8(a>>. At somewhat higher stress intensities the regions of (111) failure extended deeper into the thickness, with the (001) regions being confined to small mid- thickness areas. faces and rapidly decreased with increasing distance from the outside surfaces (fig. 8(b>>. thickness, failure occurred on only two (111) planes in the near surface. The summary of the fractographic findings is shown in table I.
The size of (111) facets was largest near the outside sur-
While the failure occurred on ail four (111) planes in the mid-
7
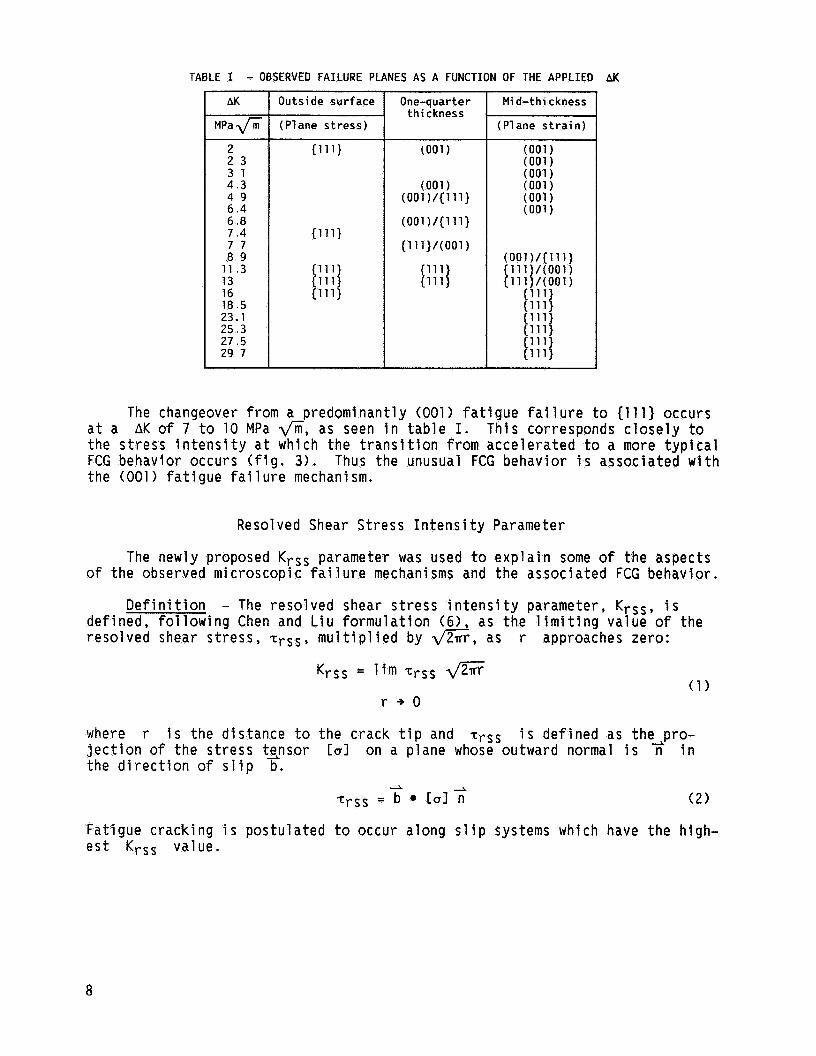
TABLE I - OBSERVED FAILURE PLANES AS A FUNCTION OF THE APPLIED AK
AK
MPa fi 2 2 3 3 1 4 3 4 9 6 4 6 8 7 4 7 7 8 9
1 1 3 13 16 18 5 23.1 25 3 27 5 29 7
Outside surface
(Plane stress)
One-quarter thickness
(001 1
Mid-thi ckness
(Plane strain)
The changeover from a predominantly (001) fatigue failure to (111) occurs at a AK of 7 to 10 MPa fi, as seen in table I. the stress intensity at which the transition from accelerated to a more typical FCG behavior occurs (fig. 3 ) . Thus the unusual FCG behavior is associated with the (001) fatigue failure mechanism.
This corresponds closely to
Resolved Shear Stress Intensity Parameter
The newly proposed K,,, parameter was used t o explain some o f the aspects o f the observed microscopic failure mechanisms and the associated FCG behavior.
Definition - The resolved shear stress intensity parameter, is defined, following Chen and Liu formulation (61, as the limiting value of the resolved shear stress, zrss, multiplied by fir, as r approaches zero:
r + O
where r is the distance to the crack tip and TrSS is defined as the-pro- jection of the stress t3nsor CUI on a plane whose outward normal is n in the direction of slip b.
Fatigue cracking is postulated to occur along slip systems which have the high- est Krss value.
8
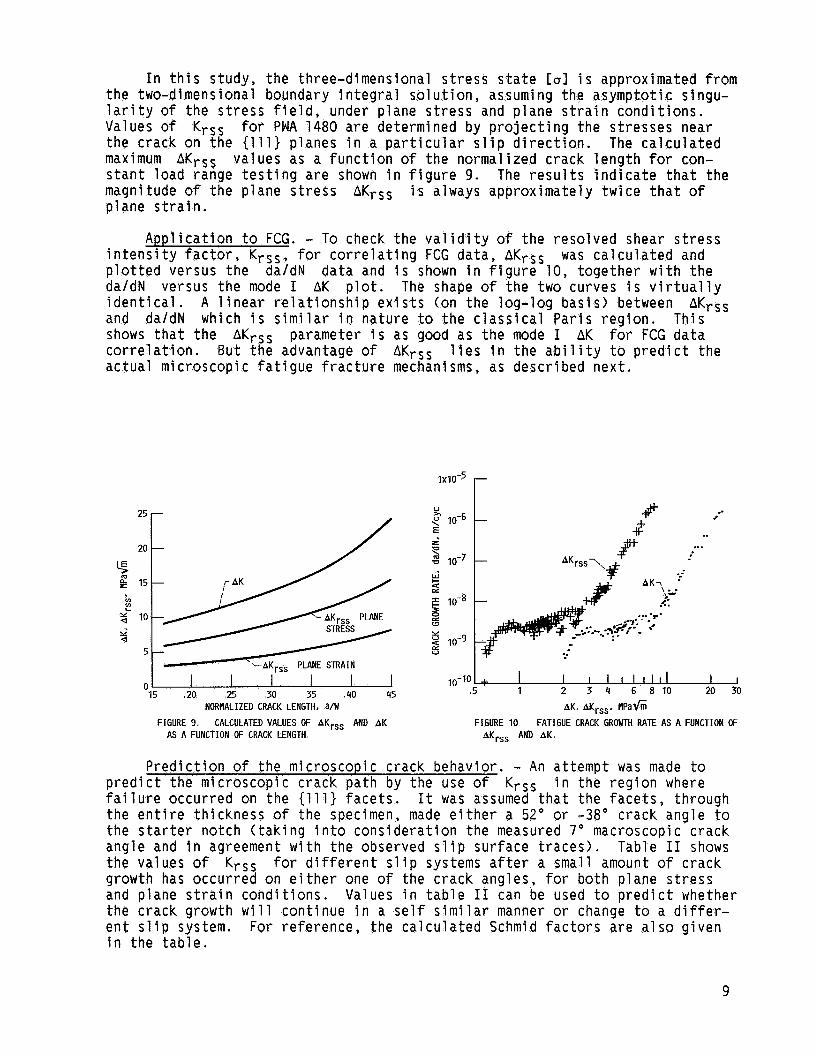
In this study, the three-dimensional stress state Col is approximated from the two-dimensional boundary integral solution, assuming the asymptotic singu- larity of the stress field, under plane stress and plane strain conditions. Values of Krss for PWA 1480 are determined by projecting the stresses near the crack on the (111) planes in a particular slip direction. maximum AKrss values as a function of the normalized crack length for con- stant load range testing are shown in figure 9. The results indicate that the magnitude of the plane stress AKrss pl ane s trai n.
The calculated
is always approximately twice that of
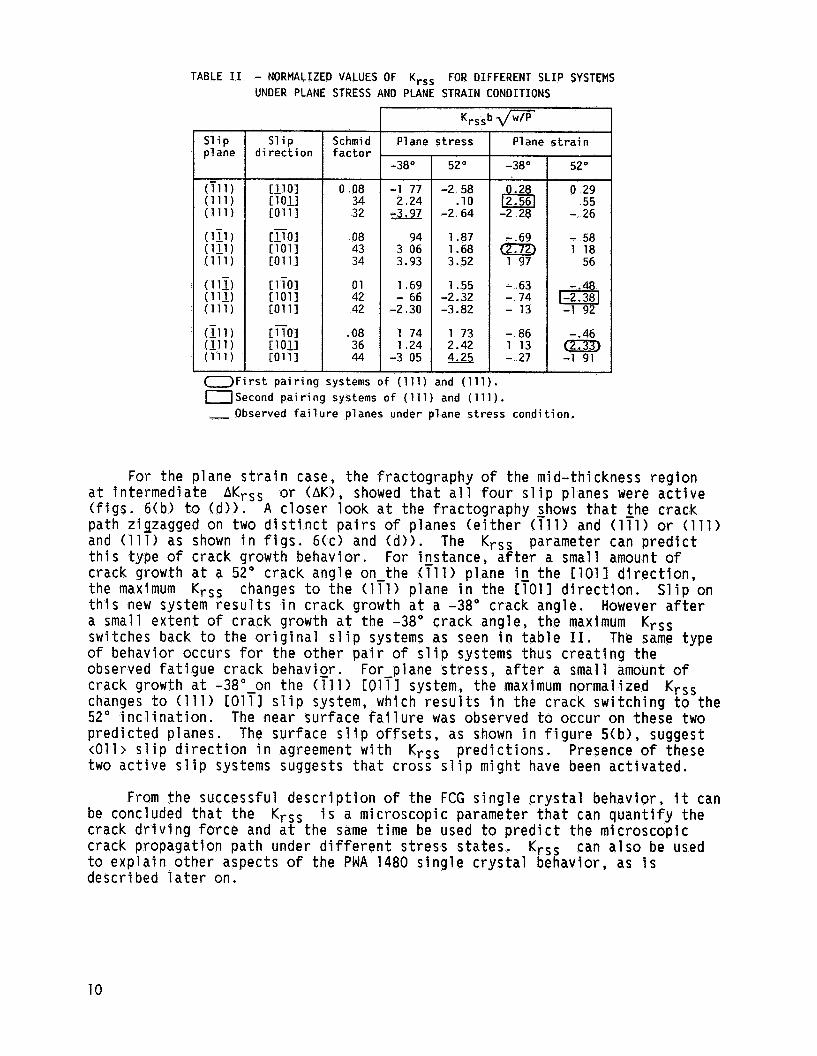
Application to FCG. - To check the validity of the resolved shear stress intensity factor, Krss, for correlating FCG data, AKrss was calculated and plotted versus the da/dN data and is shown in figure 10, together with the da/dN versus the mode I AK plot. The shape of the two curves is virtually identical. and da/dN which is similar in nature to the classical Paris region. This shows that the AKrss parameter is as good as the mode I AK for FCG data correlation. But the advantage of AKrss lies in the ability to predict the actual microscopic fatigue fracture mechanisms, as described next.
A linear relationship exists (on the log-log basis) between AKrss
25 r
20 c /
I 15 ,20 25 30 35 ,110 115
NORMALIZED CRACK LENGTH. a/W FIGURE 9, CALCULATED VALUES OF AI(,.,, AND A K AS A FUNCTION OF CRACK LENGTH
1x10⁻⁵
V g 10-6 E L
2 10-7
5 5 10-8
J
s y 10-9
10-10
W
Y
V
I I I I I 1 1 1 1 1 I I 1 2 3 11 6 8 1 0 20 30
AK, AK,.,,, wad6 FIGURE 10 FATIGUE CRACK GROWTH RATE AS A FUNCTION OF AK,,, AND AK,
Prediction of the microscopic crack behavior. - An attempt was made to in the region where predict the microscopic crack path by the use of Krss
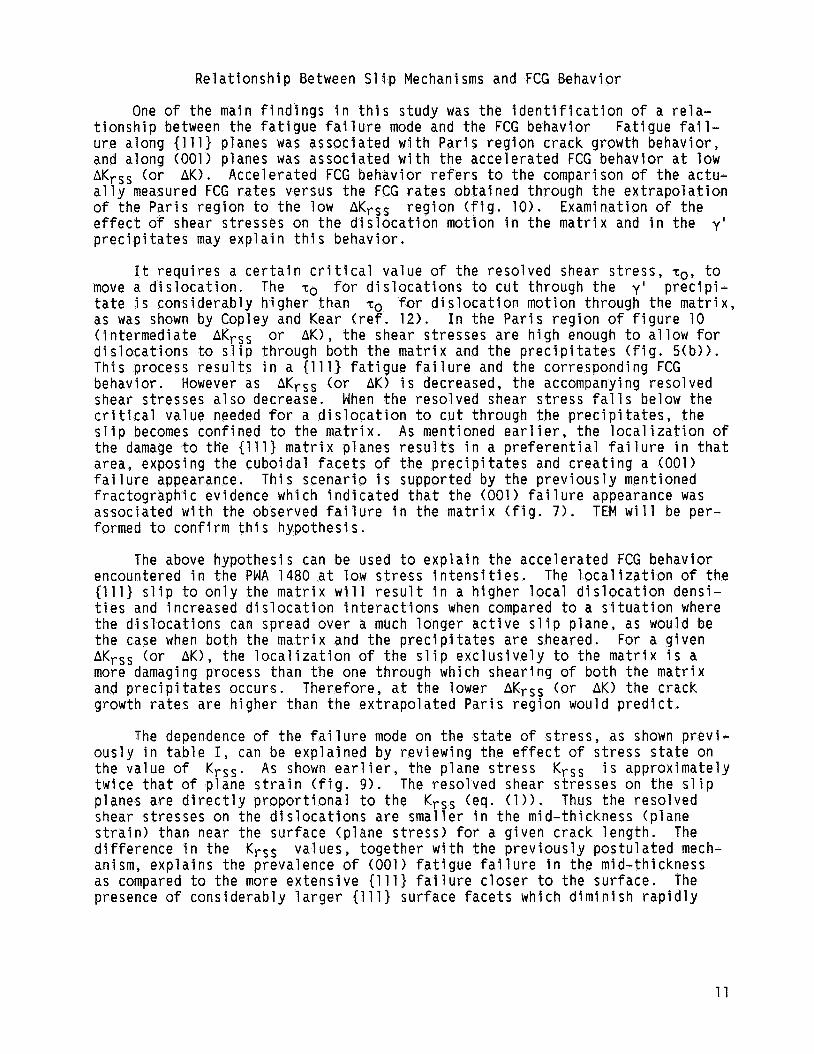
failure occurred on the (111) facets. It was assumed that the facets, through the entire thickness of the specimen, made either a 52" or -38" crack angle to the starter notch (taking into consideration the measured 7" macroscopic crack angle and in agreement with the observed slip surface traces). Table I1 shows the values of Krss for different slip systems after a small amount of crack growth has occurred on either one of the crack angles, for both plane stress and plane strain conditions. the crack growth will continue in a self similar manner or change to a differ- ent slip system. For reference, the calculated Schmid factors are also given in the table.
Values in table I1 can be used to predict whether
9
Sl ip S l ip Schmid plane direction factor
(Til) c1101 0.08 ( 1 1 1 ) c 1011 34 (111) lo111 32
(111) E o 1 p 08 (111 ) [loll 43 (111) COlll 34
( 1 11) [iioi #01 ,42 ( 1 11) c1011
(111) EO111 ,42
(11 1) E701 .08 (11 1) I: 1011 36 (111) i-0111 44
For the plane s t r a i n case, the f ractography o f the mid-thickness reg ion a t in termediate A K r s s o r (AK), showed t h a t a l l f o u r s l i p planes were a c t i v e ( f i g s . 6(b) t o ( d ) ) . A c l o s e r look a t the f ractography Shows t h a t t h e crack path zigzagged on two d i s t i n c t p a i r s o f planes ( e i t h e r (111) and ( 1 1 1 ) or (111) and ( 1 1 1 ) as shown i n f i g s . 6(c> and (d ) ) . The Kr,, parameter can p r e d i c t t h i s type o f crack growth behavior. crack growth a t a 52" crack angle on-the (111) plane in the E1011 d i r e c t i o n , the maximum Krss changes to t h e ( 1 1 1 ) plane i n the El011 d i r e c t i o n . S l i p on t h i s new system r e s u l t s i n crack growth a t a -38" crack angle. However a f t e r a small ex ten t o f crack growth a t the -38" crack angle, the maximum K r s s switches back to the o r i g i n a l s l i p systems as seen i n t a b l e 11. Thk same type o f behavior occurs f o r the o t h e r p a i r o f s l i p systems thus c r e a t i n g the observed f a t i g u e crack behavior. crack growth a t -38O-m the (711) E O 1 1 1 system, the maximum normalized K r s s changes t o ( 1 1 1 ) C O l l l s l i p system, which r e s u l t s i n the crack swi tch ing to the 52" i n c l i n a t i o n . The near sur face f a i l u r e was observed to occur on these two pred ic ted planes. The surface s l i p o f f s e t s , as shown i n f i g u r e 5 ( b ) , suggest ~ 0 1 1 ) s l i p d i r e c t i o n i n agreement w i t h K r s s p r e d i c t i o n s . Presence o f these two a c t i v e s l i p systems suggests t h a t cross s l i p might have been a c t i v a t e d .
For instance, a f t e r a small amount o f
For-plane s t r e s s , a f t e r a small amount of
Krssb fl Plane strain
-38" 52" -38" 52"
Plane s t res s
0,29 #+& .55 -1 77 -2.58 2,24 .10 -- -2,64 -2 28 - 26 94 1.87 -.69 - ,58
3 06 1.68 1 18 3.93 3.52 1 97 56
1 .69 1.55 - 66 -2.32 I ;: e] -2.30 -3.82 - 13 -1 92
1 74 1 73 - 86 -.46
-3 05 4.25 - 27 -1 91 1.24 2.42 1 13
From the successful d e s c r i p t i o n o f the FCG s i n g l e c r y s t a l behavior, i t can be concluded t h a t the K r s s crack d r i v i n g force and a t the same t ime be used t o p r e d i c t the microscopic crack propagat ion path under d i f f e r e n t s t ress s tates. to e x p l a i n o ther aspects o f the PWA 1480 s i n g l e c r y s t a l behavior, as i s described l a t e r on.
i s a microscopic parameter t h a t can q u a n t i f y the
K r s s can a l s o be used
10
Relationship Between Slip Mechanisms and FCG Behavior
One of the main findings in this study was the identification of a rela- tionship between the fatigue failure mode and the FCG behavior Fatigue fail- ure along (111) planes was associated with Paris region crack growth behavior, and along (001) planes was associated with the accelerated FCG behavior at low AKrss (or AK). Accelerated FCG behavior refers to the comparison of the actu- ally measured FCG rates versus the FCG rates obtained through the extrapolation o f the Paris region to the low AKrss region (fig. 10). Examination of the effect of shear stresses on the dislocation motion in the matrix and in the y ' precipitates may explain this behavior.
It requires a certain critical value of the resolved shear stress, z0, to move a dislocation. The T~ for dislocations to cut through the y ' precipi- tate is considerably higher than T~ for dislocation motion through the matrix, as was shown by Copley and Kear (ref. 12). In the Paris region of figure 10 (intermediate AKrss or AK), the shear stresses are high enough to allow for dislocations to slip through both the matrix and the precipitates (fig. 5(b)). This process results in a (111) fatigue failure and the corresponding FCG behavior. However as AKrss (or AK) is decreased, the accompanying resolved shear stresses also decrease. When the resolved shear stress falls below the critical value needed for a dislocation to cut through the precipitates, the slip becomes confined to the matrix. A s mentioned earlier, the localization of the damage to the (111) matrix planes results in a preferential failure in that area, exposing the cuboidal facets of the precipitates and creating a (001) failure appearance. This scenario is supported by the previously mentioned fractographic evidence which indicated that the (001) failure appearance was associated with the observed failure in the matrix (fig. 7) . TEM will be per- formed to confirm this hypothesis.
The above hypothesis can be used to explain the accelerated FCG behavior encountered in the PWA 1480 at low stress intensities. The localization of the (111) slip to only the matrix will result in a higher local dislocation densi- ties and increased dislocation interactions when compared to a situation where the dislocations can spread over a much longer active slip plane, as would be the case when both the matrix and the precipitates are sheared. For a given AKrss (or AK), the localization of the slip exclusively to the matrix is a more damaging process than the one through which shearing of both the matrix and precipitates occurs. Therefore, at the lower AKrss (or AK) the crack growth rates are higher than the extrapolated Paris region would predict.
The dependence of the failure mode on the state of stress, as shown previ- ously in table I, can be explained by reviewing the effect of stress state on the value of Krss. As shown earlier, the plane stress KrSs i s approximately twice that of plane strain (fig. 9). The resolved shear stresses on the slip planes are directly proportional to the Krss (eq. (1)). Thus the resolved shear stresses on the dislocations are smaller in the mid-thickness (plane strain) than near the surface (plane stress) for a given crack length. The difference in the Krss values, together with the previously postulated mech- anism, explains the prevalence of (001) fatigue failure in the mid-thickness as compared to the more extensive (111) failure closer to the surface. The presence o f considerably larger (1 11) surface facets which diminish rapidly
1 1
w i t h the d is tance f rom the ou ts ide sur face ( f i g . 8(b)) , i s due to a decrease i n the K r s s caused by the change from plane s t r e s s near the sur face t o a mixed s t r e s s s t a t e away from the sur face.
CONCLUSIONS
1 A t AK g rea ter than 8 MPa fi, the FCG r a t e e x h i b i t e d the c l a s s i c a l l i n e a r r e l a t i o n on a log- log bas i s between da/dN and AK (Pa r i s reg ion ) . I n t h i s reg ion the microscopic c rack propagat ion was a long (111) s l i p planes. I n the mid-thickness, a l l four planes were ac t iva ted , however near the sur face o n l y two ( 1 1 1 ) s l i p planes were a c t i v e .
app l ied AK. The change i n the FCG behavior was r e l a t e d to a change i n the f a t i g u e f a i l u r e mechanism. With the decrease i n the app l i ed AK, the (001) f a t i g u e f a i l u r e appearance became p rog ress i ve l y more dominant.
mechanisms A t lower AK, wh i l e the (001) f a i l u r e predominated i n the mid- th ickness reg ions, the near sur face reg ions s t i 11 e x h i b i t e d (1 11) f a t i g u e f a i 1 ure.
2 A t AK below 8 MPa fi, the FCG r a t e became almost independent o f the
3 The s t a t e o f s t r e s s had a subs tan t i a l i n f l uence on the f a t i g u e f a i l u r e
4 A mechanism was proposed, based on the b a r r i e r s to d i s l o c a t i o n motion, t o exp la in the changes i n the observed FCG behavior.
5 The FCG data was a l s o evaluated i n terms o f a reso lved shear s t ress i n t e n s i t y parameter, K r s s . reso lved i n t o the s l i p planes, q u a n t i f i e d the crack d r i v i n g f o r c e as we l l as mode I AK, and a t t he same t i m e p red ic ted the crack path. The d i f f e r e n c e s i n the K r s s f a i l u r e mode on the s t a t e o f s t r e s s .
Th is parameter, based on the shear s t resses
values were used t o e x p l a i n the observed dependence o f the f a t i g u e
ACKNOWLEDGMENTS
The authors wish t o thank Dr. R.V. Miner for h e l p i n g to i n t e r p r e t t he f rac tog raph ic r e s u l t s and D r . H.W. L i u fo r h i s suggestions on the methods o f a n a l y t i c a l ca l cu la t i ons .
REFERENCES
1 . S. Pearson: Enq. F rac t . Mech., 1975, Vol. 7, pp. 235-247.
2 W.L. Morris: Me ta l l . Trans. A, 1980, Vol. 11, pp. 1117-1123.
3. J . Lankford: Fat igue Eng. Mater. S t ruc t . , 1982, Vol. 5, pp. 233-248.
4 . P. Newman and C.J. Beevers: i n Small Fat igue Cracks, R.O. R i t c h i e and J. Lankford, eds., pp. 97-116, AIME, Warrendale, PA, 1986.
5. J. Telesman, D.M. F isher , and D. Holka: NASA TM-87208, 1985.
12
6. Q. Chen, and H . W . L iu : NASA CR-182137, 1988.
7. R.V. Miner, J.Gayda and M.G. Hebsur, i n , ASTM STP-942, H.D. Solomon, ed., pp. 371-384, American Society for Tes t i ng and Ma te r ia l s , Phi ladelph ia, PA, 1987.
8. Standard Test Method for Measurements o f Fat igue Crack Growth Rates, E-647-86a, ASTM Book o f Standards, American Society for Test ing and Ma te r ia l s , Ph i l ade lph ia , PA, 1987.
9 . L,.J. Ghosn: To appear i n J. Tr ibo logy, Vol. 110, J u l y 1988.
10. K.S. Chan and T.A. Cruse: Eng. F rac t . Mech., 1986, Vol. 23, pp. 863-874.
1 1 . R.V. Miner, R.C. Voigt , J.Gayda and T.P. Gabb: M e t a l l . Trans. A, 1986, Vol. 17, pp. 491-496.
12. S.M. Copley and B.H. Kear: Trans. AIME, 1967, Vol. 239, pp. 984-992.
13
N/\sA National AemnaUucS and Report Documentation Page Space Administrauon
1 Report No. 2. Government Aocession No. NASA TM-100943
4. Title and Subtitle
Accelerated Fatigue Crack Growth Behavior of PWA 1480 Single Crystal Alloy and Its Dependence on the Deformation Hade
Jack Telesman and Louis J. Ghosn 7 Author@)
9. Performing Organization Name and Address
National Aeronautics and Space Administration Lewis Research Center C1 eve 1 and , Ohio 441 35-31 91
12 Sponsoring Agency Name and Address
National Aeronautics and Space Administration Washington, D.C. 20546-0001
3. Recipient's Catalog No.
5. Report Date
June 1988 8. Performing Organization Code
8. Performing Organization Report No. E-4231
10. Work Unit No.
505-63- 1 B 11. Contract or Grant No.
13. Type of Report and Period covered
Technical Memorandum 14. Sponsoring Agency Code
15. Supplementary Notes
T h i s report was prepared f o r presentation a t the Sixth Internat ional Conference on Superalloys, sponsored by the American I n s t i t u t e of Mining, Metallurgical and Petroleum Engineers, Seven Springs, Pennsylvania, September 18-22, 1.988. Jack Telesrnan NASA Lewis Research Center: Louis J . Ghosn, Cleveland State University, Cleveland, Ohio 44115 and NASA Resident Research Associate.
16. Abstract
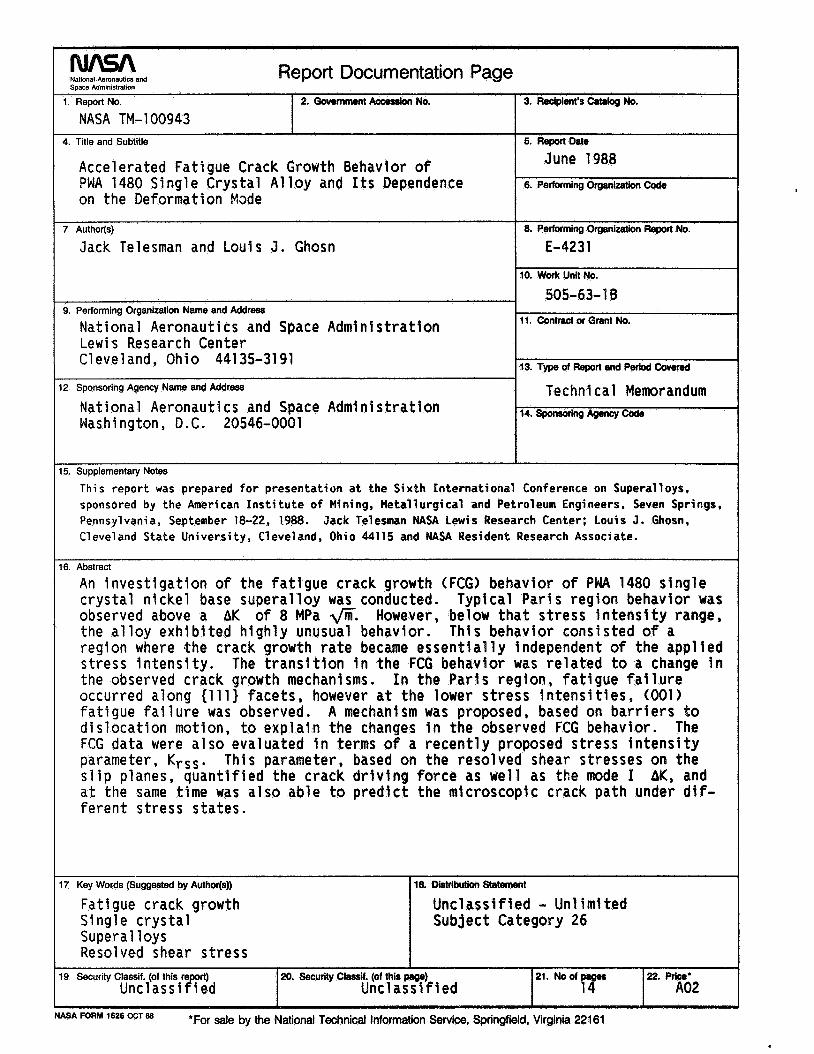
An investigation of the fatigue crack growth (FCG) behavlor of PWA 1480 single crystal nickel base superalloy was conducted. Typical Paris region behavior was observed above a AK of 8 MPa fi. However, below that stress intensity range, the alloy exhibited highly unusual behavior. region where the crack growth rate became essentially independent of the applied stress intensity. The transition in the FCG behavior was related to a change In the observed crack growth mechanisms. In the Parls region, fatigue failure occurred along ( 1 1 1 ) facets, however at the lower stress intensities, (001) fatigue failure was observed. A mechanism was proposed, based on barriers to dislocation motion, to explain the changes in the observed FCG behavior. The FCG data were also evaluated in terms of a recently proposed stress intensity parameter, Krss. This parameter, based on the resolved shear stresses on the slip planes, quantified the crack driving force as well as the mode I AK, and at the same time was also able to predict the microscopic crack path under dif- ferent stress states.
This behavior consisted of a
Fatigue crack growth Single crystal Subject Category 26 Superalloys Resolved shear stress
Unclassified - Unl !mi ted
I 22. Price'
A02 19 Security Classif. (of this report) 20. Security Classif. (of this page)
Uncl ass i f i ed Uncl ass1 f i ed
'For sale by the National Technical Information Service, Springfield, Virginia 22161 NASA FORM 1626 OCT 88