NASA · PDF fileexamination of the costs, benefits and energy conservation aspects of the nasa...
66
(J NASA-29 EXAMINATION OF THE COSTS, BENEFITS AND ENERGY CONSERVATION ASPECTS OF THE NASA AIRCRAFT FUEL CONSERVATION TECHNOLOGY PROGRAM prepared by ULTRASYSTEMS, INC. 2400 Micheison drive Irvine, California 92715 (714)752-7500 15 November 1975 Report No. 8291 -01 NASA National Aeronautics arta 1 ^ Space Administration https://ntrs.nasa.gov/search.jsp?R=19770016063 2018-05-22T10:54:07+00:00Z
Transcript of NASA · PDF fileexamination of the costs, benefits and energy conservation aspects of the nasa...

(J
NASA-29
EXAMINATION OF THE COSTS,BENEFITS AND ENERGY CONSERVATION
ASPECTS OF THE NASA AIRCRAFTFUEL CONSERVATION TECHNOLOGY
PROGRAM
prepared by
ULTRASYSTEMS, INC.2400 Micheison drive
Irvine, California 92715(714)752-7500
15 November 1975
Report No. 8291 -01
NASANational Aeronautics arta1^Space Administration
https://ntrs.nasa.gov/search.jsp?R=19770016063 2018-05-22T10:54:07+00:00Z

EXAMINATION OF THE COSTS,BENEFITS AND ENERGY CONSERVATIONASPECTS OF THE NASA AIRCRAFTFUEL CONSERVATION TECHNOLOGY
PROGRAM
PREPARED BYULTRASYSTEMS, INC,
2400 MICHELSON DRIVEIRVINE, CALIFORNIA 92715
752-7500
PREPARED FORNATIONAL AERONAUTICS AND SPACE ADMINISTRATION
WASHINGTON, D.C,(UNDER CONTRACT No, NASW-2859)
15 NOVEMBER 1975

ABSTRACT
This report is concerned with an investigation into the costsand benefits of the NASA Aircraft Fuel Conservation Technology Program.Consideration is given to a present worth analysis of the planned pro- 'gram expenditures, an examination of the fuel savings to be obtained bythe year 2005 and the worth of this fuel savings relative to the invest-ment required, a comparison of the program funding with that planned byother Federal agencies for energy conservation, an examination of theprivate industry aeronautical research and technology financial posturefor the period FY 76 - FY 85, and an assessment of the potential impactson air and noise pollution.
To aid in the analysis of this NASA program, a computerizedfleet mix forecasting model was developed. This model enables the esti-mation of fuel consumption and present worth of fuel expenditures forselected commercial aircraft fleet mix scenarios. A detailed descriptionof this model is presented in Appendix A of this report.

TABLE OF CONTENTS
Section Page
1.0 INTRODUCTION 1
1.1 Overview of NASA Program 11.2 Program Costs 3
2.0 FUEL SAVINGS ANALYSIS . . 4
2.1 Fuel Consumption Forecasts 42.2 Parametric Analysis of Fuel Savings 12
2.3 Program Costs Versus Fuel Savings Cost ... 16
2.4 Impact on Project Independence Scenarios . . 18
3.0 FEDERAL ENERGY R, D & D PROGRAMS AND ACTIVITIES . 23
3.1 Relationship to ERDA Technology Goals. ... 233.2 Comparison with Other Agency R, D & D
Efforts 23
3.3 Comparison with FEA Activities 27
4.0 COMPARISON WITH FEDERAL AND INDUSTRIALAERONAUTICAL R&D FUNDING 29
5.0 ENVIRONMENTAL CONSIDERATIONS 34
5.1 Introduction 34
5.2 Air Pollution 34
5.2.1 Aircraft Emission Characteristics . . 345.2.2 Impact of Fuel Conservation Program
on Emission Characteristics 355.3 Noise Pollution 36
5.3.1 Sources of Noise in Aircraft 365.3.2 Impact of Improving SFC on Noise
Characteristics 365.4 Summary of Air and Noise Impacts 39
6.0 SUMMARY AND CONCLUSIONS 41
BIBLIOGRAPHY 43
APPENDIX A: U.S. DOMESTIC AIR TRAVEL FUEL CONSUMPTION MODEL . 44
APPENDIX B: COMPARISON OF FUEL CONSUMPTION ANALYSES 49
APPENDIX C: COMPUTER INPUTS FOR BASELINE AND NASA PROGRAMFUEL CONSUMPTION CALCULATIONS ..... 56
iii

LIST OF FIGURES
Figure
2.1
2.2
2.3
Revenue Passenger Mile Forecast Based on Implementationof the NASA Aircraft Fuel Conservation TechnologyProgram
Comparison of U.S. Airlines Fuel Consumption BaselineWithout NASA Program Versus Baseline With NASAProgram
Project Independence Scenarios of Petroleum Consumption(Base on $11 Oil)
Page
13
15
21
iv

LIST OF TABLES
Table Page
1.1 NASA Aircraft Fuel Conservation Technology ProgramFunding (in millions) 3
2.1 Baseline Without NASA Program Forecast of AircraftFleet Mix 8
2.2 Baseline With NASA Program Forecast of AircraftFleet Mix 11
2.3 Comparison of U.S. Airlines Fuel ConsumptionBaseline Without NASA Program Versus Baseline WithNASA Program 14
2.4 Parametric Analysis of Fuel Savings as Result ofNASA Aircraft Fuel Conservation Technology Program . . 17
2.5 Present Worth (at 10%) in FY76 Dollars of FuelSavings Versus Investment Costs 18
2.6 Aircraft Fuel Consumption Usage of the Baseline andTotal Program Relative to the Project IndependenceScenarios 22
3.1 Characteristics of ERDA Selected Energy TechnologyGoals 24
3.2 Estimated FY 76 Energy Research, Development andDemonstration (R, D & D) Budgets (in millions) .... 25
3.3 Selected Federal Energy R&D FY 76 Estimated Budgets(in Millions) by R&D Area 26
3.4 FEA Office of Conservation and Environment FY 76R&D Budget Estimates and 1985 Energy Savings by Sector 27
3.5 NASA Aircraft Fuel Conservation Technology ProgramSavings 28
4.1 Comparison of Federal Aeronautical R&D Funding (inMillions) with Industrial Aeronautical R&D Expendi-tures and Gross National Product (GNP) 30
4.2 Comparison of Commercial Aircraft Related R&DExpenditures (in Millions) with Sales . 31

LIST OF TABLES (Continued)
Table Page
4.3 Comparison of NASA Aircraft Fuel ConservationTechnology Program Funding with Industry CommercialAircraft R&T Expenditures (in Millions) 33
5.1 Estimated Noise Levels and Fuel Consumption Improve-ments for Refanned JT3D and JT8D Aircraft " . 38
5.2 Summary of Impact of Fuel Conservation on AirPollution and Noise 40

INTRODUCTION
Overview of NASA Program
The NASA Aircraft Fuel Technology Program consists of six majorprograms which could result in conservation of fuel use in air transport.Three of these are evolutionary improvements in propulsion and aero-dynamics, whereas the other three (turboprops, laminar flow control andcomposite primary aircraft structures) represent attempts to developtechnology that is considerably different from that in current use in civilair transports.
The specific technology programs within the overall program canbe summarized as follows:
(1) Engine Component Improvement
• Develop improved performance components for newproduction of current engines.
• Conduct diagnostic testing of in-service engines toidentify sources of performance degradation.
t Estimated average fuel savings of 5% over currentengines.
(2) Fuel Conservative Engine
• Explore the potential of advanced technology turbofansand unconventional propulsion concepts to reduce energyrequirements for future aircraft.
• Estimated average fuel savings of 10-15% relative tothe technology now available.
(3) Turboprop
t Demonstrate acceptable performance and passenger comfortof a turboprop transport for Mach 0.8 at 30,000 ft.altitude.
• Estimated average fuel savings of 15-20% over turbofanengines employing the same level of technology in thecore.

(4) Fuel Conservative Transport
• Demonstrate the fuel conservation potential of advancedaerodynamic technology, improved propulsion systemintegration, and the incorporation of active controlsin aircraft design.
0 Estimated average fuel savings of 10-20% as comparedto the technology incorporated in the current wide-body transports.
(5) Laminar Flow Control
• Develop and demonstrate a practical, reliable andmaintainable boundary-layer suction system for viscousdrag reduction.
• Estimated average fuel savings of 20-40% depending onthe extent of application and on airplane range.
(6) Composite Primary Aircraft Structures
t Accelerate the introduction of composite primarystructural components in new production aircraft.
• Estimated average fuel savings of 10-15% compared toall-metal aircraft.
The key to success in this fuel conservation program lies in theindividual program implementation and subsequent acceptability of itsresults by the aircraft manufacturers. The Engine Component ImprovementProgram could lead to the incorporation of technology improvements infuture production of current engines if economically desirable. The purposeof the Fuel Conservative Engine Program would be to supplement the on-goingactivities in engine design of NASA, the engine manufacturers and theDepartment of Defense with new efforts that are especially pertinent to fuelconservation and to accelerate the process of making these technologiesready for application to future engines. The Turboprop Program is structuredto advance propeller aerodynamics and structures to attain high-speed, high-loading designs that couple high efficiency with low levels of cabin noise

and vibration. The Fuel Conservative Transport Program is based on theneed to develop a broader experimental data base and to improve andvalidate three-dimensional wing design procedures in order for the air-
frame manufacturers to employ these concepts most effectively in aircraftdesigns optimized for fuel efficiency. The Laminar Flow Control Programis based on the results of early experiments with the USAF X-21A airplaneand recent developments in other technologies, such as lightweight porouscomposites and pumping systems, to provide the potential for economically
viable systems that are reliable and maintainable. Finally, the CompositePrimary Aircraft Structures Program is intended to supplement the on-goingresearch efforts of NASA, DOD and the airframe manufacturers to develop
the confidence and technology needed to exploit composite structures, andis structured to minimize the risks associated with the use of compositesin new production aircraft by industry.
1.2 Program Costs
The funding requirements for the Aircraft Fuel Conservation Tech-nology Program are summarized in Table 1.1, showing a total of $490 millionfor the Baseline Program and $670 million for the Total Program over the
period Fiscal 76 through Fiscal 85. At a 10% cost of capital these amount
to a present worth (in FY 76 dollars) of $315 million and $425 million,
respectively.
TABLE 1.1 NASA Aircraft Fuel Conservation TechnologyDS)
Total Program
$ 104488150148987341153
|670
Fiscal Year
76777879808182838485
Present Worth (inat 10% InterestEquivalent Annual10% Interest
Program Funding (in mil
Baseline Program$ 10
4167101109854618103
1490
FY 76 dollars)$315
Cost at$ 51
3
$425
$ 69

FUEL SAVINGS ANALYSIS
Fuel Consumption Forecasts
A fuel consumption model was developed (see Appendix A fordetails) in order to forecast commercial aircraft fuel consumption as
a function of fleet mix for selected time periods. In the development
of this model it was assumed that aircraft acquisition is linear (i.e.,at a constant rate) starting with the first date and ending with thelast date a particular aircraft is acquired, and that aircraft retire-ment schedule is the mirror image of the acquisition schedule. In
addition, the model provides for consideration of a number of other factors
such as: base year fleet mix inventory, aircraft service lifetime, aircraft
fuel consumption rate, average annual revenue passenger miles flown per
aircraft, introduction dates of new and derivative aircraft, annual fore-
casts of revenue passenger miles, block hours per airborne hour by air-
craft type, available seat miles per airborne hour by aircraft type,fuel consumption per block hour by aircraft type, and average number of
seats per aircraft.
In order to use this model for evaluation of the Aircraft FuelConservation Technology Program, two scenarios of aircraft usage were
postulated, namely: (1) Baseline Without NASA Program and (2) Baseline
With NASA Program. Before describing the two scenarios used by Ultra-
systems for the analysis of potential savings resulting from the NASA
research effort the following comments appear appropriate:
a) The entire airline growth and new equipment requirements
situations are in an extremely unstable condition. Thishas been brought on by a number of factors, some of which
are (1) the world-wide, unsettled, economic situation
(recession accompanied by inflation); (2) the rapid escala-
tion of fuel costs in the last 2-3 years; (3) the apparent

over-buy of new wide-body aircraft which has taken placein the last five years; (4) the lack of any consistenttrends in the traffic growth/decline picture; and (5) thepotential for deregulation actions by the CAB.
b) As a result of the above, estimates concerning both short- andlong-term outlook for the airlines can vary greatly. Many
times, estimates reflect experience of the individual estimator,
i.e., a particular airline's problems, a manufacturer^ desirefor sales or a politician's position on regulation. Even whena rational group of people from the various segments of thecommercial airline community try to produce an objective
assessment of the future, estimates can vary.c) The scenarios that Ultrasystems proposes for use in this analysis
have been created as objectively as possible. All of the recentdata made available to NASA by the various manufacturers andairlines, under contract to NASA-Ames, have been examined. Manyother pieces of data available from ATA, the CAB and the mostrecent articles in aviation/trade journals have been examined.The scenarios do not reflect individual airlines or airlinemanufacture problems or postulates. Rather they reflect anoverall assessment of how the industry as a whole will grow/change/etc, over the thirty year period 1975-2005. NASA-Ames has concurred in the reasonableness of the Ultrasystems1
scenarios.d) When the estimates of fuel consumption, shown in this section,
are examined, it should be kept in mind that the absolute valuescan be different if one postulates different scenarios. On
the other hand, if one examines the parametric analysis results,shown in Table 2.4, it is clear that the factors which have themost effect on fuel savings remain so, under varying conditions.
In addition, when the parameters which have bearing on postulated
fuel savings are varied over a range which includes almost

everyone's range of estimates, the variation in savings varies±4%, except for delay in introduction date (Item (3), Table 2.4),This parameter must, under any analysis, be considered the most
critical to achievement of incremental fuel savings due to theproposed NASA Technology Program.
In the first scenario development consideration was given torecent airline action on new aircraft buys, the types of derivative/
new aircraft which the aircraft manufacturers are presently discussing(such as 747SR - multiple configurations, DC-X-200, L-1011 modifications -stretch and shorten, etc.), and NASA estimates of new technology incorpora-
tion into commercial airlines without the expended NASA research effort.The specific characteristics of the Baseline Without NASA Program scenario
can be described as follows:
LONG-RANGE AIRCRAFT
a) It is estimated that a derivative four-engine (747-SR class)aircraft will be introduced by 1980. This aircraft will takeadvantage of improved engine fuel consumption technology,
some composite structures and perhaps the supercritical wing.
Overall fuel savings is estimated at 18%.b) By 1990, essentially a new 3/4 engine aircraft will be intro-
duced. Size-wise it will be equivalent to a stretchedB-747. It will use the latest propulsion technology, super-
critical wing, extensive use of composite structures and
active controls. Overall fuel savings is estimated at 35%.c) Various improved versions or models of the three engine
wide-body aircraft will be introduced into the fleet by 1980.
These will utilize available improved propulsion and somecomposite structures for an estimated overall savings of 10%.

MEDIUM-RANGE AIRCRAFT
a) It is postulated that the present fleet of three-enginenarrow-body aircraft will be continued beyond the normal
fifteen year service life. This extension is estimatedto be seven additional years based on:
• Rework of the aircraft, thus adding approximately 20,000hours capability to the airframe.
t Average utilization of 3,000 hours/year
Overall fuel savings will be minimal, say, 2-5% per year.
b) Ultrasysterns is postulating a 2/3 engine wide-body replacement
for this aircraft in 1983. It is believed that the design of
aircraft is such today that the distinction between narrow-
body/wide-body will have essentially disappeared by this time,i.e., designs will be based essentially on existing wide-bodytechnology. Increased capacity and technology improvementsin propulsion and supercritical wing will result in an esti-mated overall fuel savings of 20%.
c) A derivative of this aircraft will appear by 1995 which willincorporate, in addition to the above, extensive use ofcomposite structures and active controls. Overall fuelsavings is estimated at 30%.
SHORT-RANGE AIRCRAFT
a) A derivative two-engine narrow body should be available by
1982. Improved propulsion will provide overall estimatedfuel savings of 5%.
b) A new two-engine narrow-body will be introduced in 1990.
This aircraft will include supercritical wing, compositestructures and active controls plus additional propulsiontechnology. Overall fuel savings is estimated at 25%.
Table 2.1 provides a summary of this forecast.

VO
o8
.
W>
§
i
f>K
CM
g
pM
i
mS ro
u«»• >
Z M CU
o 2CO u
co n ^LU h- COSZ U.
—1 0.
m
U»z »—LU r
- ^^ J^
oo LU coCO t- —
3
ino ro
co en3 nUI II•o- z*~~- t— toro z u.z •— a.
oin CMCO
nco n3 >•LU (— COro z u.O "I Cu
8 su
ca nUJ »— COro z u.Q — i 0.
•r—
o3 T
ZLU O
CM ro T
CO Lu, O00 1— ••Xo
ino ro
m en3 UIff II
• I- coro z u.Z •— CU
oin CMCO
CO II3 S-LU 1— COro z u.o — • cu
oO r—CO
nS u
>UJ H* COro z u.O -i 0,
CO3
ca in1— z r-»z LUUI •oc roce t-3 t £
oCM
1CO
*Oeneno
^-* »CO LU COZ O I
<£ 013 1- 0Z COLU -
o r~ro "» z o
O r^OO LU _l 1oo i— — -ao
d ~
m roS °* iLU nro ^• 1— coCM Z U-O i— i Cu
X
O_. ro CM9° co3s uCU -||ro •»!-" " » ( — « / »CM z u.Z 1-1 Cu
Z co J^JZCM ocOC LU 1** >•cc ro i
ICO
*oeneni
--~ ollJC9 «
CO «£ COZ t— 1
CO Uo oZ ZLU 3
«» «f O Oui r-.
OO LU Z 1OO 1— ~— CO
"
Iu
1C CDT- >
•r-O ^ 4^Z O n>UJ >CO flj -r-LU <4-> t._J <O HI
5 o
oin roco en
£ A 5;S 5 t
o« s 7lAj Uro >•- I— COCM Z U.Z — CU
UJu.
«5 ?i £Its s
^»
i1
^J
COCO 1
z -ui r*.
oin rr t~.
ico -3 eoCO h-
_ju
.>«>> oc x> .0
ID Oi- cu ja tO C 0JS ••- 0) UU 0) -O U3 C ••- <Or- UI 36 Z
u. eo caf- LU S Z
oin roco enUJ IIro s*^ 1— COCM Z U.a —• a.
oCO CO
LU IIro >CM Z Luz — cu
• cozoui r-~
CMvo ro t>-
oo u. eooo t— — •
"
I">at*~ 4^
§ ^•*- u a.
c I0 L J "C
41 £ 3ro o. z h-
•~» tn ex.ro u. z K-
Cu
m
•CO *X >
* •- Cu
CM en00
z *LU U, CO<M Z U.Q « CU
JZ
10
CO
0?CD 1
ZUI r
rot>- CM IN.
1CO U. COCO H* * ^
f %
(US-o
O
O.
oo
O)
(OCU t-c o
•I- I-
coro <4-
CO O
c\j
8

The second scenario represents the incorporation of the anti-cipated Aircraft Fuel Technology Program results into the firstscenario - thus called the Baseline With NASA Program scenario. As aresult, the specific characteristics of this scenario can be describedas follows:
LONG-RANGE AIRCRAFT
a) As in the baseline case, it is assumed that a derivativefour engine (747-SR class) aircraft will be introducedby 1980. The aircraft will take advantage of improvedengine fuel consumption technology, some composite struc-tures and perhaps the supercritical wing. Overall fuelsavings is estimated at 18%.
b) The new 3/4 engine aircraft proposed for introduction by1990 in the baseline case, will be available in 1985 with theNASA technology program. It will be equivalent to a stretchedB-747, use late propulsion technology, supercritical wing,make extensive use of composite structures and incorporatesome active controls. Overall fuel savings is estimated at 30%.
c) As in the baseline case, a stretched derivative of the presentthree engine wide-body aircraft will be introduced by 1980.Overall fuel savings is estimated at 10%.
d) Various derivatives of the three engine wide-body aircraftwill be introduced into the fleet by 1985. These aircraftwill be stretched, have improved propulsion and some com-posite structure technology incorporated. Overall fuelsavings is estimated at 28%.
e) By 1992 a new 3/4 engine wide body aircraft making maximumutilization of the output from the NASA technology programwill be introduced. This aircraft will incorporate in additionto stretching, improved propulsion, extensive use of compositesand active controls, and laminar flow control. Overall fuelsavings is estimated at 50%.

MEDIUM RANGE AIRCRAFT
a) Incorporation of the NASA technology program output will
allow earlier introduction of a new 2/3 engine wide bodyreplacement aircraft by 1982. rather than 1983 as shown in thebaseline program. Overall fuel savings will be improved
from the baseline program by 5%, for an overall fuel savingsof 25%.
b) A new 2/3 engine wide-body aircraft will be introduced by
1990. This aircraft will incorporate all available propul-sion, composite structure, super critical wing and activecontrols capability. In addition, it will incorporateturboprop or laminar flow control technology. Overallfuel savings is estimated at 50%.
SHORT RANGE AIRCRAFT
a) The derivative short range aircraft available by 1982 (as shownin the baseline program) should be available with an additional
5% fuel savings capability due to NASA technology program inputs,Overall fuel savings is estimated at 10%.
b) A new two-engine turboprop narrow-body transport utilizinglatest propulsion technology, composite structure, super-critical wing and active controls will be introduced by
1990. Overall fuel savings is estimated at 50%.
Table 2.2 provides a summary of this forecast.
To evaluate the impact of the NASA Aircraft Fuel ConservationTechnology Program on the projected growth in revenue passenger miles,
the previously described fleet model was used together with the follow-ing assumptions:
(1) there will be an increase of 7% per year in RPM from1975 until 1985 and thereafter the annual increase
will be 5.5% until 2005;
10

(J(U
cnoO. -r-
</J -I-)«< a)
01 S-C U•r- i-
co
OQ O
e\jUJ
—IOQ
VO
oi
u>ofi
voi
as
CVJ
o
_
ai
CO S» °2 ItUl II
-^ t- coro z u.Z ii 0,
o
UJ ||is!
§ -nCO II
UJ t— CO«t z u.0 . n 0.
ca
z • —uj r-.
4^r~* t p^i
CO U. COCO t- —
u
oCM in
Ul || "** >
ro" *~ lfl
z 5 ct
COin CMCO
nCO II
UJ t- COro z u.o •— a.
O i—co
uco nUJ I— COro z u-0 — • 0-
^~*• —o
CO t—2 iUJz •Ul O
r~CM ro i
oCO U. OCO (- ^—
0
o*V| If)
S C* II<S- M
**• h- CO2 z u.Z » a.
coin CMCO
nCO II
UJ t— COro z u.0 — a.
oo —CO
n
CO z U.a n a.
CO^(9 en
ct ro "
3 * g
CM
1CO
•toeneniu
CO UJ COz ei i
<X uo >— aZ COUJ . -
to i».ro v r: o
O r^CO U. .J 1CO 1— --CO
O
oo in
Ul Uro >^ 1- COCM Z U.z •— Q.
inCM CMCO
nm nUl K- COCM Z U.z •— a.
COz uj
u.
1 . 1 * J^* .„
g U. CO CM
^^
1
O -CO <C COZ 1— 1
CO U
UJ Z> «
•o- ^ o oUJ f~-
CO U. £ 1co t—'—'ca— i
eo
u
]§
c at
o <* - • • ->z o nUJ >O <U t-UJ *• l-^1 (Q QJ
a a
£ Q
oo in
S enn
UJ IIro >^v (- CO
S £ ct
inCM CMco
IIm n3 >UJ >— COCM Z U.z •— a.
CO2j UJ
O — •
uj CM cece ro r- >-ce i=> U. CO CM
oCO
o
COCO 1
z •UJ f>-o
in - ri
CO r~3 COCO 1- ~—
u
c T? jaIO O
«*- 01 J2 Xo c oU CD "D »-3 C -^ <0
1— UJ 3 Z
u. co cauj z
S enu
UJ If
. \- COCM Z U.Z — IX
CM J(jCO CO3 nuj nro :»* 1- COCM Z U.Z n Q-
CQzoz — .
CMID ro r*.
iCO U. COCO h~ ^*^>
d
v»ate•r"
IOtn
s ^w b ^*• t- U
«>• C .,- Q.01 10 o
t- U S0 1- X k
01 « 3
>•» CO 0,m u. x >-
£ 8 s£ »- 5>CM Z U.X » 0.
oCO
CO * "z >UJ t- COCM Z U.a « a.
r—|T
1
CO
o>CO 1
ouj ^^
ror» CM r
iCO U. COCO \— '—'
3
n

(2) aircraft service life is 15 years for all aircraft exceptthe B-727 which is assumed to be 22 years;
(3) load factor is constant at 55%(4) the distribution of RPM by stage length is 44% for long
range and medium range aircraft and is 12% for short
range aircraft.
Figure 2.1 provides an illustration of this impact, showing a
projected increase from 195 billion RPM in 1975 to 1.106 trillion RPMin 2005 (i.e., 567% or, eguivalently, an average of approximately 6%
per year). These results were derived using the Baseline With NASA
Program scenario forecast of Table 2.2.
Table 2.3 provides a comparison of the projected annual fuel
consumption in billions of barrels of oil for the Baseline Without NASA
Program and the Baseline With NASA Program for the time period 1975-2005.By 2005 the projected savings to be obtained as the result of implementingthe Aircraft Fuel Conservation Technology Program is estimated to be247.3 million barrels of oil annually or, equivalently, 677,500 barrelsper day (BPD). The cumulative savings over the 30-year period is esti-
mated at 2.075 billion barrels of oil, which amounts to an overall savingsof nearly 12%. Figure 2.2 provides a graphical illustration of thiscomparison based on identification of significant aircraft introductions.
2.2 Parametric Analysis of Fuel Savings
In order to examine the sensitivity of the projected fuel savings
from implementation of the NASA Aircraft Fuel Conservation Technology Pro-'gram due to changes in the assumptions employed, the fleet model was usedto assess the impact due to the following types of changes:
(1) changing the service life from 15 years to 20 years forall aircraft except the present B-727 fleet
(2) reducing the projected fuel savings by 5% and 10% (i.e.,a 50% savings would be reduced to 45% and 40%, respectively,
but in no case would it be reduced below zero or the assumedbaseline case savings)
12

FORECAST U. S. AIRLINE FLEET DISTRIBUTIONRPM GROWTH RATE-7%/YEAR TO 1985
-5.5%/YEAR T01985-2005
1200-1
New 2 EngineTurbo-prop Introduction -1990,Fuel Savings =50%
Derivative 2 EngineNarrow Body Intro-duction - 1982,FuelSavings = 10% w 2/3 Engine Wide
Body.lntroductlon -1990.Fuel Sovlngs>50%
ContinuingAcquisition
& Utilization ofExisting Aircraft
Engineody.lntroductlon
1982,Fuel
New 3/4 Engine WideBody, Introduction -1992.Fuel Savings -50%
Continuing Acquisition& Utilization of ExlstinAircraft erf votive 3
Wide Body, IntroductgS.Fuel Savings =28 % - 30%
Derivotive 3/4 EngineWide Body.lntroductlon-198Fuel 5ovings=10-18%
ontinuing Acquislt& Utilization of ExistingAircraft
1975 1980 1985 1990
CALENDAR YEAR
1995 2000 2005
FIGURE 2.1 Revenue Passenger Mile Forecast Based on Implementationof the NASA Aircraft Fuel Conservation Technology Program
13

TABLE 2.3 Comparison of U.S. Airlines Fuel ConsumptionBaseline Without NASA Program Versus BaselineWith NASA Program
Year
1975197619771978197919801981198219831984198519861987198819891990199119921993199419951996199719981999200020012002200320042005
TOTAL
Annual Fuel Consumption(in billion barrels)
Baseline
.2587
.2760
.2935
.3114
.3307
.3515
.3736
.3973
.4222
.4436
.4609
.4809
.5008
.5202
.5410
.5632
.5864
.6107
.6361
.6627
.6909
.7116
.7335
.7559
.7790
.8029
.8300
.8576
.8882
.9209
.9556
17.948
NASA Program
.2587
.2760
.2935
.3114
.3307
.3515
.3736
.3973
.4170
.4384
.4559
.4754
.4938
.5092
.5259
.5439
.5571
.5711
.5802
.5900
.6006
.6108
.6219
.6294
.6353
.6415
.6523
.6625
.6736
.6857
.7083
15.873
Savings(in billionbarrels)
00000000
.0052
.0052
.0050
.0055
.0070
.0110
.0151
.0193
.0293
.0396
.0559
.0727
.0903
.1008
.1116
.1265
.1437
.1614
.1777
.1951
.2146
.2352
.2473
2.075
PercentSavings
000000001.21.11.01.11.42.12.83.45.06.58.810.913.114.215.216.718.520.121.422.824.225.525.9
11.6
NOTE: Inputs used in the computer model togenerate these results are presentedin Appendix C.
14

f~O
X•1«k.
j=
O
180-
170-
160-
150-
140-
130-
120-
110-
O
»ui
100^
90-
70H
i son5
40-
30-
20-
10-
1975
Dot el Ine WithoutNASA\ Program
Assumed Growth Rate7%/Yeorto19855.5%/Year Thereafter55% Load Factor
2.08x10*Barrels Savings
BaselineWith NASAProgram
Introduction of NewLong-Range 3/4Engine Wide Body,50% Fuel Savings
Introduction of NewMedium Range 2/3Engine Wide Body,50% Fuel Savings;Introduction of NewShort Range Turbo-Prop,50% FuelSavings
1980 1985 1990
CALENDAR YEAR
1995 2000 2005
FIGURE 2.2 Comparison of U.S. Airlines Fuel ConsumptionBaseline Without NASA Program Versus BaselineWith NASA Program
15

(3) delaying the introduction dates of new and derivativeaircraft by 2 and 5 years
(4) varying the assumed annual growth rate in revenuepassenger miles to 2%, 4% and 8%
(5) varying the assumed constant load factor to 60% and 65%.
In each case the corresponding changes, if necessary, were madein the computations of fuel consumption for the Baseline Without NASAProgram scenario fleet mix. Table 2.4 provides a summary of the results
obtained. Recalling from Table 2.3 that the overall savings to beobtained using the basic, or unchanged, assumptions is 11.6%, it can beobserved that the projected fuel savings is strongly dependent upon twofactors, namely: (1) the estimates of fuel savings to be obtained, and(2) the acceptability or willingness, by the airline industry to introducethe new or derivative fuel efficient aircraft when they are available.For example, if each projected fuel savings is high by at most 10%, thenthe projected fuel savings would only be 4.8% or 854 million barrels ofoil over the time period 1975-2005. If the airlines do not adopt the
new or derivative fuel efficient aircraft until as much as 5 years afterthey become available, then the projected fuel savings would only be
1.3% or 233 million barrels of oil over the same time period. Any combina-tion of over estimation in fuel savings and airline industry purchase delays
could drastically reduce the potential benefits to be derived from theAircraft Fuel Conservation Technology Program.
2.3 Program Costs Versus Fuel Savings Costs
Table 2.3 provided a summary of the estimated annual fuel savingswhich are expected for Baseline With NASA Program scenario relative to theBaseline Without NASA Program scenario, which represents a program ofon-going as well as industry fuel efficiency improvements.
It is of interest to compare the present worth of these savingsin terms of the cost for purchased fuel with the program research cost.
Two scenarios for fuel prices are assumed. Scenario No. 1 assumes that1980 domestic fuel prices will reach the level of present international
16

TABLE 2.4 Parametric Analysis of Fuel Savings asResult of NASA Aircraft Fuel ConservationTechnology Program
Case
CumulativeFuel Consumption(in billion barrels)
(1) Service Life Increase
Changed to 20 years forall aircraft exceptB-727
(2) Reduction in FuelSavings Projections
5% Decrease10% Decrease
(3) Delay in IntroductionDates of Derivativeand New Aircraft
+ 2 Years
+ 5 Years
(4) Variation in RPMAnnual Growth Rate
2% Per Year
4% Per Year
8% Per Year
(5) Variation in Load Factor
60%
65%
16.256
16.576
17.094
16.641
17.715
8.466
11.270
21.200
14.550
13.431
Savings Relativeto BaselineWithout NASA ProgramIncremental Percent
1.992*
1.372
0.854
1.307
0.233
0.750*
1.253*
3.428*
1.902*
1.756*
10.9
7.6
4.8
7.3
1.3
8.1
10.0
13.9
11.6
11.6
Same changes were made in the Baseline scenarioin order to obtain the true relative savings.
17

fuel prices, which is 35 cents per gallon, and thereafter will increaseat the rate of 7% per annum. Scenario No. 2 assumes that 1980 domestic
fuel prices will be 35 cents per gallon and remain at this price through
2005. Assuming a 10% interest rate (or cost of capital), Table 2.5provides an economic evaluation of the worth of these savings relativeto the worth of the research investment in the total NASA program. Ascan be seen, the benefit-to-cost ratio, measured by the ratio of thepresent worth of the fuel savings to the present worth of the researchinvestment cost, ranges from 7.5 to 26 for the NASA Aircraft Fuel Conser-vation Technology Program. This means that for every research dollarspent, the return in savings for purchased fuel ranges from $7.50 to $26.
TABLE 2.5 Present Worth (at 10%) in FY76Dollars of Fuel Savings VersusInvestment Costs
SCENARIO NO. 1 SCENARIO NO. 2
PresentWorth ofFuelSavings($106)
Ratio ofFuel SavingsWorth toInvestmentCost
PresentWorth ofFuelSavings($106)
Ratio ofFuel SavingsWorth toInvestmentCost
NASA ProgramRelative toBaseline $11,058 26.0 $3,186 7.5
2.4 Impact on Project Independence Scenarios
In FEA's Project Independence a number of strategies representingdifferent national energy policies were evaluated. This evaluation focussedon how much production could be achieved for each of the various sources of
energy under different world oil prices using the AUI-Brookhaven ReferenceEnergy System. In each case, account was taken of the lead times associatedwith increasing production from each of these sources. Separate projections
of supply as a function of price were made up through 1985 for oil, naturalgas, coal, nuclear, synthetic fuels, shale oil, solar and geothermal energy.
18

The demand for each energy product as a function of price was developed.In addition to reductions in demand induced by higher prices, the impactof specific conservation measures was also forecast.
Four strategies considered involved a policy of Business-as-Usualand a policy of Accelerated Supply, each with and without conservation. Thecharacteristics and features of these policies can be described as follows:
(a) Business-As-Usual
This policy assumes the continuation of policies in effect prior
to 1973 (except for those controlling oil prices), but that domestic energydemand will grow at substantially lower rates than it has in the past. Coalproduction will increase significantly and nuclear power will grow to nearlyone-third of the total electric power generation. Synthetic fuels will notplay a major role between now and 1985. Similarly, it is assumed that geo-thermal, solar and other advanced technologies will not contribute to ourenergy requirements until after 1985.
(b) Accelerated Supply
This policy assumes changes in policies to encourage domesticpetroleum exploration and production, including accelerated offshore
leasing, opening up military reservations for exploration and production,increasing Federal support for petroleum research and development, end ofprice controls on oil, and removal of regulatory delays in nuclear power
development.
(c) Conservation
By conservation is meant the reduction in demand for petroleum
by such actions as the setting of minimum mileage standards for new auto-
mobiles and providing incentives and standards to increase residential insula-tion and energy-use efficiency. Incentives would include a gasoline tax and taxcredits for retrofit of homes and commercial buildings. Standards includethermal standards for new homes and offices, commercial lighting standards,
and appliance efficiency standards.
19

In summary, the basic policy scenarios considered are:
(1) Business-As-Usual Without Conservation(2) Business-As-Usual With Conservation(3) Accelerated Supply Without Conservation
(4) Accelerated Supply With Conservation
Figure 2.3 presents a forecast of annual petroleum consumptiondemand for the transportation sector based on these four policy scenarios.The Project Independence forecast data covered the period up to 1985 andso beyond 1985 the consumption forecasts are extrapolations, as shown bythe dashed segments.
In order to examine the benefits to be derived from the NASAprogram relative to the Baseline it is of interest to investigate aircraftfuel consumption relative to the consumption demand forecasts of Figure2.3. For example, Table 2.6 shows that in the case of the Baseline "pro-gram the percentage of consumption in the transportation sector couldrange from a low of 12% in 1985 to a high of 24% in 2005 depending on thescenario used, whereas the NASA program would imply a range with a lowof 12% in 1985 to a high of 18% in 2005. At the present time, the avia-tion subsector uses on the order of 13% of the total transportation sec-tor energy. Implementation of the NASA program would thus imply a usagemore compatible with the present level of use.
20

Accel eroted SupplyWithout Comervotlon
6000-1
5000-
56"5u M
-
4000-.
iic
Ul
3000-
Business-os-UsuolWithout Corwervotlon
/ Acceleroted SupplyWith Conservotion
Buslness-os-Usuol/WlthConservotion
1975 1985
YEAR
1995 2005
FIGURE 2.3 PROJECT INDEPENDENCE SCENARIOS OF PETROLEUMCONSUMPTION (BASED ON $11 OIL)

TABLE 2.6 Aircraft Fuel Consumption Usageof the Baseline and Total ProgramRelative to the Project IndependenceScenarios
Aircraft Fuel Consumption Percentage
Scenario
Business-As-UsualWithout Conser-vation
Business-As-UsualWith Conserva-tion
Accelerated SupplyWithout Conser-vation
Accelerated SupplyWith Conser-vation
Year Forecast(1)19851990199520002005
19851990199520002005
19851990199520002005
19851990199520002005
3.844.264.785.396.10
3.293.423.563.764.02
3.934.685.94(2)(2)
3.463.794.244.775.36
Baseline
12.013.214.514.915.7
14.016.519.421.423.8
11.712.011.6
13.314.916.316.817.8
Total Program
11.912.812.611.911.6
13.915.916.917.117.6
11.611.610.1
13.214.414.213.413.2
Differencein Percentage
0.10.41.93.04.1
0.10.62.54.36.2
0.10.41.5
0.10.52.13.44.6
(1) In billions of barrels(2) Unable to meaningfully estimate.
22

FEDERAL ENERGY R, D & D PROGRAMS AND ACTIVITIES
Relationship to ERDA Technology Goals
The National Plan for Energy Research, Development and Demon-
stration recently prepared by ERDA contains six basic technology goals.Their respective characteristics are presented in Table 3.1. The Air-
craft Fuel Conservation Technology Program would be classified under
Goal VI: Increase End-Use Efficiency - in particular, under Transpor-tation Efficiency. In this technology area, the expected impact would
be 4.50 million BPD savings in the year 2000. Referring to Table 2.3,
the Aircraft Fuel Conservation Technology Program would contribute.442/4.50=.098 or nearly 10% to this savings. Since civil aircraft useon the order of 8-10% of the total energy consumed in the transportation
sector, this savings is in proportion to energy usage. The near term,
or pre 1985, impact of the NASA program would be negligible.
3.2 Comparison with Other Agency R, D & D Efforts
Table 3.2 provides an illustrative comparison of the AircraftFuel Conservation Technology Program budget for FY 76 with the estimated
energy R, D & D budgets for six other Federal agencies, the DOT and
NASA budgets are the lowest; however, none of the estimated DOT $9.45
million is allocated to the FEA.
Table 3.3 presents FY 76 budget estimates for seventeen Federal
agencies, other than ERDA, across twenty one selected R&D areas. Using
the ERDA estimate from Table 2.2, an estimate of the total Federal FY 76
energy R&D budget is given by $2.400 +$0.803= $3.203 billion. Approximately2.4% of these funds are allocated in the transportation energy conservation
area. Implementing the Aircraft Fuel Conservation Technology Program in
FY 76 would add another $10 million, thus increasing this percentage to(88.2/3213) x 100 = 2.7%. By comparison, the transportation sector con-
sumes 25% of the total energy, which is an order of magnitude larger than
the corresponding percentage allocation of energy R&D funds.
23
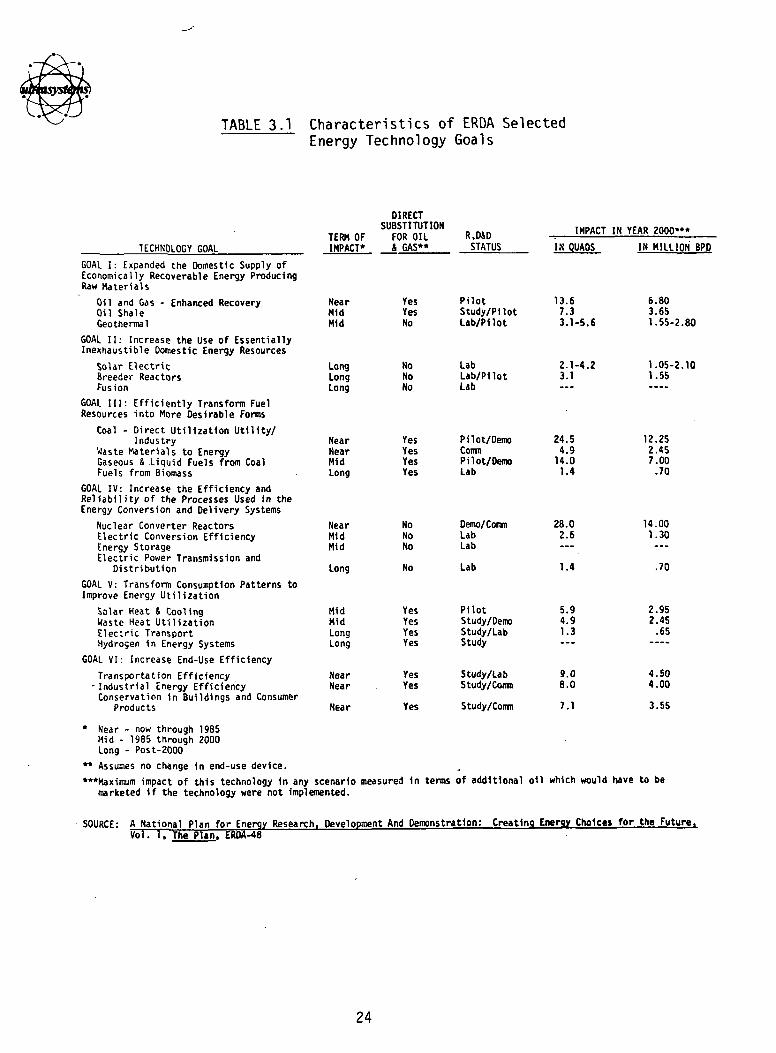
TABLE 3.1 Characteristics of ERDA SelectedEnergy Technology Goals
TECHNOLOGY GOALTERM OFIMPACT*
NearMidMid
LongLongLong
NearNearM1dLong
NearMidM1d
Long
M1dMidLongLong
.NearNear
DIRECTSUBSTITUTION
FOR OIL& GAS**
YesYesNo
NoNoNo
YesYesYesYes
NoNoNo
No
YesYesYesYes
YesYes
R.D&DSTATUS
PilotStudy/PilotLab/Pilot
LabLab/PilotLab
Pilot/DemoConnPilot/OemoLab
Demo/ ComLabLab
Lab
PilotStudy/DemoStudy/LabStudy
Study/LabStudy/Comm
IMPACT IN YEAR 2000***
IN MILLION BPD
GOAL I: Expanded the Domestic Supply ofEconomically Recoverable Energy ProducingRaw Materials
011 and Gas - Enhanced RecoveryOil ShaleGeothermal
GOAL II: Increase the Use of EssentiallyInexhaustible Domestic Energy Resources
Solar ElectricBreeder ReactorsFusion
GOAL III: Efficiently Transform FuelResources into More Desirable Forms
Coal - Direct Utilization Utility/Industry
Waste Materials to EnergyGaseous & Liquid Fuels from CoalFuels from Biomass
GOAL IV: Increase the Efficiency andReliability of the Processes Used in theEnergy Conversion and Delivery Systems
Nuclear Converter ReactorsElectric Conversion EfficiencyEnergy StorageElectric Power Transmission and
Distribution
GOAL V: Transform Consumption Patterns toImprove Energy Utilization
Solar Heat & CoolingWaste Heat UtilizationElectric TransportHydrogen 1n Energy Systems
GOAL VI: Increase End-Use Efficiency
Transportation Efficiency•Industrial Energy EfficiencyConservation in Buildings and Consumer
Products
* Near - now through 1985Mid - 1985 through 2000Long - Post-2000
** Assumes no change 1n end-use device.***Maximum impact of this technology 1n any scenario measured 1n terms of additional oil which would have to be
marketed 1f the technology were not Implemented.
Near Yes Study/Comm
13.67.33.1-5.6
2.1-4.23.1
24.54.9
14.01.4
28.02.6
1.4
5.94.91.3
9.08.0
7.1
6.803.651.55-2.80
1.05-2.101.55
12.252.457.00
.70
14.001.30
.70
2.952.45
.65
4.504.00
3.55
SOURCE: A National Plan for Energy Research. Development And Demonstration:Vol. 1. The Plan. EROA-48
Creating Energy Choices for the Future.
24

v^cfl
4-c_
CO1—J7i"3c£
1 *t"- f-1
J ^^ Q;</> 0
» C 'O: o ct
o> -r- z:FCLr—0 -i-
c"" b_
cu r-ib_
O) •!—
Q
•f—
» VIj_i
U (US- 0><oOJ(/)
•o3
CQ
>> E«— >> CO no
vi c ro c cn >, s- j_+j - t -EOi- co " cu cn
+J C T3 i- •.- (U L. I/I C OC ro T3 C I/I CU -M C ( U E < U S-cu -u c ro •— JC ro cu c ro a.E O 3 ro ro 4J > CU L- •— *-!/) +J i — l/l O O S- i- CO ro :>> OV»>> i — QE CO CU CO ro « O C O> t-CU CO CU T3 O <U COl/ICU - M L - O OI/IO CTICOLoa- t - 1 > , C i — C O-'r- r— VI(/It— (OH) VI C O - O O O I + J O <"•ao E - O Q > » 01 .03 s^nJ c o
c S- tJc «n •— 10 c C L ? C ^ : ••-CUJZ - O C i O " Oi — " O O L . O Ooo <u o:>> c o 4-> 13 s_ •»-> cu cu -cI.QJ i— F vi *"> ^ : v » c c v i - t - n j - M +-> O3-i-> n 3 c u + - > > > c u o euro E > ^ * cO - t - > i - O + J l 4 - C O ' E n j c s - i - c >I/I CU C Z3 CU CU «O •*-* +-* O- " t- CU C7> O "CU> C U V I * 4 - < * - V I CO- * - 3 O> CUT3 ••- *-i_ «r- p fO *i n3 "O CU i — • C O T3 L- C -M d
4 J C C U C U l / l * ( X 3 E C U G J L - C I O n j C• o OE vi oo .>E o . n j " > L"-1
>>rtj L - ^ I i . - a L - O C U Q . + • > • • V-l_S- -t- T3 4J 10 S- ^3i — T3O C C C V I <U C7CU+J > C » — CUnJ C U t — O O C U - « - V I C>X C n J I O r — 3 " * ->>>CU -r- -r- E l/> C •«"o c u c u c u o c n o < u c n > • M + J O - > > o * J
O " c* 3 CU *O i- CU <O <^J O t^ O ^CU "O c" lv- v> C i - C 0> "O > > ^~ *O ^i - c o o E t - n j v i o > > c : L . L . C U C r - t -
« 3 l _ C U O > > V I C U ' t — C7>CU"U C U C U > n a C U < - >VI fti C -4^ i- "U •+-* L- C +-> V) to CU 3( O C T I C U O V I c n O C - i - » O C U X > i O C : C C - O T 3 H-o » c « r t - i - > > c 4 J O 3 4 J c a i c u o o c c
•f— CU +-* VI -r— ifl "D* C Q> O -C E O O CO *O •*-* ^T 3 C I _ H J L . E V I C U C O O . O V I S - • • -c-t- ' i - > ) O S - c u c n E i — n j i - O X j ^ i - ^ l - n j *•ro E O > Cn 4J -r- *t— c CU 'r— > n3 ^— CO Ol 3 O ' ~ S- rt
•t- C U U - i — «»- -a T- i— I / ITJCUCU i- L- O •«— <O O L-i — TJ I / I t — CU C C r 3 + J O - V l n 3 V I > CU CO VI •— •«— L- *•*•i- C nj -— C O O - U - r - E O C U O J C C Q J O ' t - T - VIO n J O Q < £ C U E t _ ) V I V ) i — i 4 - o a i _ - a l - U L i J S - Q - n 3 ' = C C
£oo
<U -r,O£
>Qi
^<* UJ
*° ogIb.
LU
VO»^
>-LU
•Qri ivi/4-*roE4J
COLU
OJ
^^ro
LU1
CQgJ—
ui za" |— CO
o; 5» g 10i— i t*.
— \—5 00 >-O UJ U.
•r™4->frt24->01COc
Q
>-Oz:UI13<£
c(O
10 •••»
* ro. SC 3 L O O O O O I C M o Sv o L O s r c n c s » » • ^ - £i— i — i— «W O
CM CU</>• •</>• •(/> </>• /> •</>• V> V>- >cu
Q
^JCos_n3cuV)<ua:
>> +J >o c cu oC C C U C O * -cu o E no as <u
c cn -r- o. o ••- o. cO c f V J O - i — 4 J O O U J
•f— i/i i — +J nj4 J C T - Q J l O l - T 3 * -( O O E > + J + J C O
l _ - O - t - E CU S-« (O "-O C -M O Q O ••-• I — 3 O O O . C I / I CS- O CU T3 < / > • » - o "JO ) U - * J > > C C E - r - r —*J O 4- «JC I O T 3 +->C Q-C CU i- O O L - * t 3O• - • O Q . -U J=-r- f— OJ-r- •—
C n J O - t J >> C-U ">> » - c U t — t— L. n j i » - c n o<o c:O ••- >O 3 <Oi- OJ- S - S - O
O+J O> CU-U CU CU*-> ••-• M O O C C U Vll/l 4 - > C c£VI * - >c CD a: cu -r- cui -t- «aC U t — E O i C C U r — C ' - S :E < O C L . T - E > — r o - t - O O• t J c o < o > > E - M n j C E U J ' <
oo>»1
<f.aOSUJ
*c:roa.
<ujr
.—
^^
o
•>1)3J3
u
t- o s- Q) o>x> u t. o -a <->CO -r- T- F- 1_ cf ro CO -i- rf OCO - 4 J > O C U O . X > * J Z D - — • •a i i a c 3 c c u c u < a O t —O Z L v l Z UJ QU. Z OO — •
Q00cn>.
JD
EnjS-CroS-Q.
QCJa:1—oQ
-I-J1-oo.cu
cn
cu0V-ou.JCV<o
1 ^
ErcS-Olo!_ex>,cnc
*cc
JZ0cu
(—co•r-4Jro>s-cuVIco
<_>
'cuZJu.4Jl«-ro1-oL.
• r—
<tctooct•z.
10r^cy>
L.rocu>-
rooVI•r-u.t-oVI
I/I>,
rocet
co*Jros_
+•*I/)c:ogQ
-ocCO
-I-Jca>Qo
f—cucua
JC0L.rocuI/Icua:
c c0 0•r- -r-*-> 4-><a <a+J 4->S- t-o oa. a.V) VIc cra rOi- S-
t— r—
.14-U3
r—CT>
LITr .cn
t»r-01
VIL.f^a>-
<ooVI
J£
L.o4-
I/Ir-.
cu>cu
1
EroL.crot.cx. .
VIcu>
*J0cu.0o-1-1cy
ucrrO
a
o
4Ja.cuQ
o1
ir>f^
«.yl— •.3a
C5
§•(-> •»-s- -tJO rOCX (.(U 4->a: M
•r-cu cO T-
«- e> T3L. «Ccu00 4J
ec c cu0 0 gr- -r- O.4-> 4J Ord (O t—E (- a*' - * - • >0 VI CU>«- f- ac c•-< v- T»
>, | Sr- JC> >. 0r- cn i.U t . r Oo a* «t: c vi
UI 91C Q£o •—t- re >>ro L. O>cu ai L.vi -a cucu 35 c2: u. ui
'
CM ro TT in
25

TABLE 3.3 Selected Federal* Energy R&D FY 76 EstimatedBudgets (in Millions) by R&D Area
EstimatedFY 76 Budget
Area (in Millions)
Oil and Gas from Underground Sources $ 1.0
Exploration and Resource Mining 43.2
Energy Resource Mining Technology 56.7
Non-Breeder Reactors 71.9
Direct Solar Conversion 7.9
Solar Electric Applications 15.0
Geothermal 6.0
Fusion 0.4
Breeder Reactors 8.3
Derived Fuels 9.1
Heat and Power from Coal 5.0
Advanced Electric Generation Systems 4.6
Conservation in Electric Energy Systems 7.7
Energy Conservation in Industry 31.8
Conservation in Buildings 33.1
Conservation in Transportation 78.2
Cross Sectoral Conservation 12.1
Environmental Control Technology 105.4
Support to Commercial Nuclear Fuel Cycle 2.8
System Studies and Analyses 23.7
Basic Research 279.3
TOTAL $803.2
SOURCE: A National Plan for Energy Research, Development and Demonstration:Creating Energy Choices for the Future, Vol. 1, The Plan, ERDA-48
*Seventeen agencies represented,not including ERDA.
26

3.3 Comparison with FEA Activities
The primary energy conservation efforts within the FEA are focussedin the activities of the Office of Conservation and Environment. These ef-forts include four basic sectors (besides system studies), namely, buildings,industrial, transportation and utilities. Table 3.4 provides a performancecomparison of these sector activities in terms of the proposed FY 76 sectorbudgets and the payoffs (i.e., savings in BPD) to be obtained in 1985 as theresult of these expenditures. For example, the 1985 savings in BPD per FY 76research dollar invested ranges from .18 to .65.
TABLE 3.4 FEA Office of Conservation andEnvironment FY 76 R&D BudgetEstimates and 1985 Energy Savingsby Sector
Sector
Buildings
Industrial
Transportation
Utilities
1985 EnergySavings in BPD
1,653,000
803,000
2,078,000
756,000
FY 76Estimate(in millions)
$7.21
4.54
3.20
2.00
Savings PerDollar
.23
.18
.65
.38
SOURCE: FEA Office of Energy Conservation and Environment Fiscal 1975Contract Justification, September 1974
As a comparison of the expected "performance" of the NASA Air-craft Fuel Conservation Technology Program with these FEA efforts, Table3.5 shows that the savings in BPD to be obtained in 1985 per FY 76 researchdollar invested ($425 million at 10% interest) is on the order of .00003and increases to .0016 by 2005. The NASA program clearly is not a short-term program vis-a-vis the FEA efforts in terms of its payoffs, but isdesigned to yield long-term payoffs in aircraft fuel consumption.
27

TABLE 3.5 NASA Aircraft Fuel ConservationTechnology Program Savings
Savings Payoff in Savings perYear in BPD Research Dollar Invested
1985 13,700 .00003
1990 52,900 .00012
1995 247,400 .00058
2000 442,200 .00100
2005 677,500 .00160
28

COMPARISON WITH FEDERAL AND INDUSTRIAL AERONAUTICAL R&D FUNDING
Table 4.1 provides a historical summary of Federal aeronautical
R&D funding in the defense and non-defense areas of research and technology
and development, industrial R&D funding for aeronautics and a comparisonof these funding histories with the gross national product. In thesehistories, Federal defense funds include those for the Army, Navy, AirForce, Advanced Research Projects Agency, the Aircraft Nuclear PropulsionProgram of the Atomic Energy Commission, and the R&D funds reimbursed bythe Government to industry as allowable overhead charges on procurementcontracts. Federal non-defense funds include those for NASA and the FAA.Industry funds include non-reimbursed industry independent research anddevelopment (IR&D) and specific development funds, and those funds provided
by universities and foundations. IR&D funds include independent researchnot reimbursed to industry including that IR&D allocated to civilian sales,
other technical effort and bid and proposal activities. Specific development
funds include only civil type aircraft, whereas development funds formilitary aircraft are included under Federal defense funds.
Several observations regarding the data of Table 4.1 are as follows;
(1) Industry funds for aeronautical R&D have increased only 42%
since 1963 (an approximate annual increase of 3-1/2%), from$284 million in 1963 to $402 million in 1973, while from1968 to 1973 these industry funds have decreased by 33%.It appears that industry will contribute less in the futurethan it has in the past to aeronautical technical advances.
(2) Federal funds for aeronautical R&D are distributed on theorder of 22-21% for research and technology and 73-78% for
development. Recent trends show 23* for research and tech-
nology and 77% for development.(3) Industry R&D funds represent approximately 11% of the total
(industry plus Federal) annual aeronautical R&D funds. This
percentage has been steadily declining from a high of 23%
in 1968.
29

c/1 C3c —*o•i- 4->i— Or— 3•r- "O2: oC O.
(0CD CC O
10-
toO (/)08 Ooc s_
ro T3O C
<UC S-e
<t'•— 0)(O Q.$- XO) LU•o(1) OU. oO
o:<*-o •—
ITJc oo ••-
<O CQ. O
O Vo <:
00
—
o o o o o o o o o o
o o o o o o o o o o o
o o o o o o o o o o o
§ i i § g § § § § § §
00 r- *-
r — \ O C S I O O l i r > C \ J f f » O »
^r r* O^ r. o.
o\ f* •&r^ — vo
= S
tQ.
6
*c3
oo F- *—
l£ § S O8*I -IfI l/l
S5
S
30

(4) Total aeronautical R&D funds account for approximately (on
the average) 0.34% of the gross national product. Federalfunds represent 0.29% and industry funds 0.05%, on theaverage. The latter has been declining in recent years to
0.03%.(5) Over the time period 1968-1973, non-defense research and
technology has averaged 2.6% of the total Federal aeronauti-cal R&D funding — actually ranging from a low of 1.9% in
1966 to a high of 3.4% in 1973.
A general rule of thumb is that IR&D funds represent approximately5-1/2% of net sales and specific development funds represent approximately1-1/2% of net sales. As a basis of comparison, an attempt was made to esti-
mate how much industry spends for R&D related to commercial aircraft by re-viewing 1974 corporate annual reports of the leading airframe and componentmanufacturers. Table 4.2 provides a summary of the results obtained andshows that an estimated $468 million was spent for commercial aircraft R&Din 1974, which was nearly 5.9% of commercial sales.
TABLE 4.2 Comparison of Commercial AircraftRelated R&D Expenditures (inMillions) with Sales
Lockheed
Boeing
United Aircraft
McDonnell-DouglasGeneral Electric
$2,131
1,773
1,338
1,916
$7,969
R&D
$ 28
102
152
60
126
$468 (5.9%)
(1) L-1011 TriStar transport only.(2) Estimated commercial transportation equipment and
related services.(3) Power sales only.(4) Commercial aircraft sales.(5) DC-10 only.
31

In order to compare the planned NASA Aircraft Fuel Conservation
Technology Program funding with industry non-reimbursable expenditures andits ability to support such a program itself, suppose that the GrossNational Product increases at the annual rate of 3-1/2%, but industry
aeronautical R&D remains constant at 0.03% of GNP. Federal R&D expen-
ditures average 23% for research and technology. Private industry wouldnot necessarily be expected to spend their R&D funds according to thesame distribution as the Federal Government - in fact, it would most likely
spend less for research and technology. For this reason, three possiblecases are considered: 10%, 15% and 20% for research and technology.Table 4.3 provides a comparison of the NASA program with these industry
research and technology cases on both a present worth and an annual costbasis (at 10% cost of capital).
With a 15% or more commitment of aeronautical R&D funds forresearch and technology, private industry would be spending $54-108
million per year over the period FY 76 - FY 85 for on-going efforts.In order for private industry to fund the research efforts of the NASA
program would require an additional $69 million per year, thus nearly
doubling its present annual investment;hence, it is extremely unlikelythat private industry could meet the expected capital requirements ofthe NASA program and, consequently, Federal support is necessary.
32

TABLE 4.3 Comparison of NASA Aircraft Fuel
FiscalYear
7677
78
79
80
81
82
83
84
85
ConservationFunding withAircraft R&T
Technology PrograiIndustry CommerciExpenditures (in 1
Industry R&T
10%
$ 43.0 $
44.6
46.2
47.8
49.4
51.2
53.054.8
56.8
58.8
15% 20%
64.5 $ 86.0
66.9 89.2
69.3 92.4
71.7 95.6
74.1 98.8
76.8 102.4
79.5 106.0
82.2 109.6
85.2 113.6
88.2 117.6
NASAProgram*
$ 1044
88
150
148
98
73
41
15
3
PresentWorth @ 10%
EquivalentAnnual CostG> 10%
$332
$ 54
$498
$ 81
$664
$108
$425
$ 69
Total + On-Going
33

ENVIRONMENTAL CONSIDERATIONS
5.1 Introduction
The environmental impact of the NASA fuel conservation pro-gram was investigated with respect to the impact on air pollution emis-sions generated by low fuel consumption aircraft and the noise genera-tion characteristics of the fuel conservative aircraft.
The objective of this analysis is to describe the impact, ifany, that a fuel conservation program will have on aircraft air pollutionlevels and noise generation characteristics. There are three technologyareas undergoing investigation for possible conservation of fuel. Theseare propulsion systems, aerodynamics, structures and materials. Of these,
propulsion systems has the most potential for impact on aircraft air pol-lutant emissions and noise levels. Aerodynamic and structures improvementsin aircraft imply an improvement in flight characteristics which inherently
imply lower thrust requirements for the engines and hence lower fuel consump-
tion, lower air pollutant emission rates and lower noise levels. Aerodyna-
mic improvements may have an impact on airframe generated noise levels. Air-craft air pollution emissions are treated in Section 5.2 and noise genera-
tion is treated in Section 5.3.
5.2 Air Pollution
5.2.1 Aircraft Emission Characteristics
A detailed description of pollutant formation in jet turbineengines is beyond the scope of this analysis; however, a brief discussionof aircraft emission characteristics is included here by way of introduc-
tion to concepts that are introduced later in the analysis.
Aircraft emissions can be divided into two categories, namely,
those pollutants formed because of incomplete or inefficient combustionand those pollutants formed because of high combustion temperatures. Carbonmonoxide (CO) and hydrocarbons (HC) are examples of pollutants formed
because of incomplete combustion. Hydrocarbons are emitted as a result
34

of unburned fuel and partially oxidated hydrocarbon combustion productspassing through the combustion zone before complete combustion has takenplace. Carbon monoxide is emitted when combustion generated CO has nothad sufficient time at combustion temperatures to oxidize to C(L, the
product of ideal combustion. Nitrogen oxides are a result of high com-bustion temperatures which increase the rate of reaction of free nitrogenand free oxygen to form NO.
It is a further characteristic of jet aircraft engines thatcombustion efficiency increases with temperature and temperature increaseswith engine speed. Therefore, at low engine speeds, such as idle conditions,the emissions of CO and HC are at a maximum and NO is at a minimum. Con-
A
versely, at high engine speeds, such as during takeoff, the combustionefficiency is very near 100 percent and temperatures are at a maximum and
therefore NO emissions are at a maximum. During takeoff HC and CO/\
emissions are quite low.
5.2.2 Impact of Fuel Conservation Program on Emission Characteristics
The propulsion improvement programs for improving fuel consumption
have three areas of concentration: engine component improvement, develop-ment of a fuel conservative engine, and development of turboprops as anattractive alternative to jet turbine aircraft. With the exception of theturboprop program, all propulsion improvements for increased fuel economywould involve improving combustion efficiency. This is most importantat low power settings such as idle conditions where combustion is leastefficient. Improving combustion efficiency would be consistent with andcomplimentary to efforts for decreasing the emissions of CO and HC atidle conditions (see Refs. (1) -(5)).
The relation between fuel economy and the formation of nitrogen
oxides is not as clear cut. As the engine operating temperature increases,the combustion efficiency improves, but there is also an increase in therate of formation of nitrogen oxides. It could be construed from thisthat an improvement in fuel economy (combustion efficiency) will cause acorresponding increase in nitrogen oxides emissions; however, recent research
35

programs have indicated that nitrogen oxide emissions can be reduced with-out compromising combustion efficiency. The two methods of doing this arewater injection into the primary zone and modification of the combustordesign. Neither method has a direct impact on combustion .efficiency al-though water injection may increase fuel consumption during takeoff becauseof the weight penalty of carrying the water.
NASA programs have shown that combustor modification can signi-ficantly reduce NO emissions without compromising combustion efficiency.
A
Two such designs are the "swirl-can" combustor design and the doubleannual combustion design.
In summary, it can be concluded from available data that thefuel conservation program will help to reduce the emissions of carbonmonoxide and hydrocarbon emissions from jet turbine engines. Also,nitrogen oxide emission increases due to improved combustion efficiencyat low power settings can be offset by combustor design or water injectioninto the primary zone.
5.3 Noise Pollution
5.3.1 Sources of Noise in Aircraft
The two primary sources of noise from aircraft are engine noiseand airframe (aerodynamic) noise. Of these, engine noise is the most sig-nificant. There are several sources of noise in jet turbine engines.First, most jet turbine engine noise is generated in the fan, whilesecondary noise sources are core noise and jet noise.
5.3.2 Impact of Improving SFC on Noise Characteristics
5.3.2.1 Jet Turbine Noise
NASA efforts to reduce jet engine noise have been focused atthree programs: Refan of current aircraft, Quiet Nacelle Program andQuiet Engine Program. Both the Refan Program and Quiet Engine Programtake advantage of higher bypass ratio fan technology which allows fora significant reduction in fan noise and a reduction in specific fuelconsumption.
36

Table 5.1 shows a comparison of estimated noise reduction andspecific fuel consumption reduction for JT3D and JT8D aircraft enginesretrofitted to take advantage of higher bypass ratio fan technology.More recent data taken from actual flight test measurements indicatethat these estimates were in fact realized. Retrofitting 727 aircraftwith new quiet fans resulted in 6 to 7 dB noise reductions and 1 to 3%
increase in block fuel consumption.* It has been assumed here thatchanges in block fuel consumption due to engine improvements are directlyproportional to improvements in specific fuel consumption. On DC-9 air-
craft refan programs resulted in 5 to 11 dB noise reductions and .5-1.0%reduction in block fuel consumption. It is important to note that the
data regarding improvements on fuel consumption are estimates only and
the refan program is expected to have little if any impact on fuel con-sumption.
Quiet engine technology employing high bypass ratio technologyhas resulted in considerable noise reductions over conventional engines.
The employment of high bypass ratio fan technology will also result indecreased SFC (Reference 4).
Other engine component improvements are likely to reduce SFCand improve noise characteristics of new generation aircraft. Forexample, data reported by Pratt and Whitney (Reference 5) indicate that2 to 5 dB noise reductions can be achieved with a 0-2% reduction in SFC
with new mixer technology.
5.3.2.2 Impact of Aerodynamic Improvements for Reduced Fuel Consumptionon Aircraft Noise
The two areas of aerodynamic changes that may affect airframenoise are wing design and use of high lift devices. Because these areasof improvement represent the development of new technology, little data
can be presented that indicate trends in fuel consumption and noise gen-
eration.
* "Block fuel consumption" is the actual amount of fuel used from onegate at airport to next gate at destination airport.
37

TABLE 5.1 ESTIMATED NOISE LEVELS AND FUELCONSUMPTION IMPROVEMENT FORREFANNED JT3D AND JT8D AIRCRAFT
EngineType
JT3D
JT8D
AircraftType &Series
DC-8-61DC-8-54F
DC-8-51
DC-8-62
DC-8-63
707-320
DC-9-32
727-200
AVERAGE
Noise Reduction DueTo Refan of Aircraft
(PNdB)
Sideline
9
7
7
8
9
13
1010
9.4
Takeoff(no cutback)
_ _
—8
11
12
15
11--
11.4
Approach
19
1818
19
18
21
1113
16.3
Reductionin SpecificFuel Con-sumptionPercent
3.11.61.6.2.2
3.9
-7.73.4 to -2.4
.79 to .06
SOURCE: Noise Source Abatement Technology and Cost Analysis IncludingRetrofitting, EPA, Aircraft/Airport Noise Study Report, July1973.
38

Fuel conservation aerodynamic designs such as high lift devicesincluding externally blown flap aircraft are expected to reduce the impactof noise because of their steep ascent and descent flight paths. This,however, has not been flight tested and represents estimates of design per-sonnel (Reference 7).
In summary, the impact of the fuel conservation program will notinterfere and will in most cases be consistent with the noise control pro-grams under development.
5.4 Summary of Air and Noise Impacts
Based on the most current data and estimates available, the pro-gram will result in lower aircraft air pollution emission levels and lower
noise levels. This conclusion is examined for each program element inTable 5.2! Current programs in reducing air pollution levels and air-craft noise levels have also resulted in lower specific fuel consumption.Efforts to further lower aircraft fuel consumption will result in cleaner,quieter engines and better performance aircraft which implies reduced air-craft emissions and noise levels.
39

TABLE 5.2 Summary of Impact of Fuel Conservationon Air Pollution and Noise
NASA Fuel ConservationProgram Element
GO
UJ
1 • 1 '
o0£Q_
0
GO
Q_
OC£Q_
ImproveEngineComponents
DevelopFuelConservativeEngine
DevelopViableTurbopropAircraft
DevelopFuelConservativeTransport
DevelopLaminarFlow ControlAircraft
DevelopCompositePrimaryAircraftStructures
Impact onAir Pollution
Emissions
Application of advanced fantechnology will reduce HCand CO emissions 30 to 60percent at Idle conditions.
Will reduce levels of allpollutants.
Will result in significant-ly lower NO Emission Indexlevels. x
Will reduce levels of allpollutants.
(See Note)
(See Note)
Impact onNoise GenerationCharacteristics
Application of advancedfan technology and noisesuppression materialwill significantly lowernoise levels.Noise levels will prob-ably be 10 to 20 dBlower than currentengines (7 to 10 dBlower than FAR36).
Turboprop aircraft aresignificantly quieterthan jet turbine air-craft.
Negligible impact.
No impact.
(See Note)
NOTE: Air pollution levels and noise levels will be reduced due to reducedweight of aircraft and corresponding lower thrust requirements.
40

6.0 SUMMARY AND CONCLUSIONS
Observations that can be made regarding the NASA Aircraft FuelConservation Technology Program are as follows:
t The complete program, on-going plus proposed technologyprogram, which will require an expenditure of $670million over the time period FY 76-FY 85, has a presentworth (in FY 76 dollars) of $425 million at 10% cost ofcapital. This is equivalent to an annual expenditure of
$69 million.
• Implementation of the results of the NASA program willlead to a daily savings of 677,500 barrels of oil by the
year 2005, which amounts to a 12% savings relative to noprogram implementation. In addition, over the time period
1975-2005 the cumulative savings would be 2.08 billion
barrels of oil.
• The projected savings to be derived as the result of theNASA program are strongly dependent on the assumed fuel
savings to be derived from each of the six technology pro-grams and how quickly the airlines acquire the new andderivative aircraft incorporating the results of thisprogram.
• For every research dollar invested in the NASA programthere is a savings of $7.50-$26 in fuel purchase costs.
t By the year 2000, the NASA program would contribute 10% tothe National energy savings goal in the area of transporta-
tion efficiency.
• The NASA program is designed to yield long-term benefitsin the sense that the long-run payoff (i.e., through 2005)
to be achieved in terms of savings in barrels per day per
FY 76 research dollar spent is on the order of .002, whereasFEA programs in the Buildings, Industrial, Transportation
41

and Utilities sectors are short-term oriented and are ex-pected to yield payoffs in the range of .18- .65 BPD perFY 76 research dollar spent by 1985.
• Industry funds for aeronautical R&D have decreased by 33%since 1968, thus indicating that industry will contributeless in the future than it has in the past to aeronauticaltechnical advances; hence, in order to achieve technologicalimprovements in aircraft fuel efficiency, Federal programsupport becomes increasingly more necessary.
• In order to obtain the expected fuel conservation resultsof the NASA program via private funding would require thatprivate industry double their present level of expendituresfor independent research and development.
• In the context of the Project Independence scenarios, im-plementation of the NASA program would imply a 12-18% trans-portation energy consumption range in the aviation subsectorrelative to a present usage of 13%, whereas no program im-plementation would imply a 12-24% transportation energyconsumption range over the period 1985-2005.
t Environmental impacts are expected to include a reductionof carbon monoxide and hydrocarbon emissions from jet tur-bine engines, and conformance with noise control programsunder development.
42

BIBLIOGRAPHY
1. Aircraft Engine Pollution Reduction, NASA, 1972.
2. Aircraft Emissions: Impact on Air Quality and Feasibility of Control,EPA.
3. The Federal Aircraft Emission Control Program: Standards and TheirBasis, APCA, January 1974.
4. Aeronautical Propulsion, A Conference Held at Lewis Research Center,NASA, May 1975.
5. Airline Engines of the Future, Airline Symposium, Pratt and WhitneyAircraft, May 1975.
6. Aircraft Engine Noise Reduction, NASA, May 1972.
7. "Noise Source Abatement Technology and Cost Analysis IncludingRetrofitting," EPA, Aircraft/Airport Noise Study Report, July 1973.
8. Aircraft Fuel Conservation Technology Task Force Report, Office ofAeronautics and Space Technology, NASA, 10 September 1975.
43
APPENDIX A - U.S. DOMESTIC AIR TRAVEL FUEL CONSUMPTION MODEL
Based on domestic aircraft fleet data for a given base year, apostulated schedule for the introduction of new and derivative aircraftfrom the base year to a specified future reference year, estimated fuelsavings of each new or derivative aircraft that is postulated, and apassenger demand forecast, Ultrasysterns has developed a computerizedmodel whose primary output is the fuel consumption of the U.S. domesticaircraft fleet for each year from the base year to the future referenceyear. Some additional outputs available from the model include the fuelconsumption rate of each aircraft type in the fleet, the revenue passengermiles (RPM) flown by each aircraft type in each year beginning with thebase" year, and the total fuel consumed by the fleet from the base yearto the future reference year. If the cost of fuel and the cost ofcapital for each year is input, Ultrasystems model also yields the presentworth (in base-year dollars) of the total fuel consumed.
In the subsequent paragraphs of this appendix a detailed des-cription of Ultrasystems1 fuel consumption model is presented. Tofacilitate the description of this model the following notational con-vention will be adopted. The base year aircraft fleet inventory ispartitioned into classes according to type and usage. For example, atypical class might consist of four-engine narrow-body aircraft used onmedium stage length routes. These classes will be denoted Class I Mod 1,I = 1,2,... . A postulated aircraft that is to be introduced into thefleet will be designated Class I Mod J if it replaces a Class I aircraftand is the (J + 1) new or derivative aircraft in that class.
We begin the description of the fuel consumption model by listingthe required inputs using the notational convention described:
Input Data
AC(I,1) = Number of aircraft Class I Mod 1 in the inventoryin the base year
FBH(I,1) = Fuel consumption per block hour for aircraftClass I Mod 1 (gals)
44

BHAH(I,1) = Block hour per airborne hour for aircraft Class IMod 1
SMAH(I,1) = Available seat miles per airborne hour for aircraftClass I Mod 1
ANS(I,1) = Average number of seats on aircraft Class I Mod 1
BKSP(I.l) = Block speed of aircraft Class I Mod 1 (mph)
TAH(I.l) = Total airborne hours per aircraft per year foraircraft Class I Mod 1
NCLAS = Number of aircraft classes
LT(I,J) = Lifetime of aircraft Class I Mod J (yrs)
PFSV(I.J) = Percent fuel savings of aircraft Class I Mod Jover aircraft Class I Mod 1
INDT(I,J) = Year aircraft Class I Mod J is ready for introductioninto the fleet
MCLAS(I) = Number of modifications (new or derivative aircraft)of aircraft Class I
PGROW(L) = Percent growth in revenue passenger miles for year Lover year L-l
ELFAC = Estimated load factor (percent)
JZ(I) = Year aircraft Class I Mod 1 was introduced intothe fleet
KZ(I) = Purchase period (prior to base year) of aircraftClass I Mod 1 (yrs)
PRICE(L) = Price per barrel of fuel in year L
DRATE = Discount rate
NYEAR = Number of years between base year and futurereference year
We now proceed with a description of the computational methodology
employed in Ultrasystems model. The computer program consists of eight
subroutines each of which is detailed below.
45

(1) Fuel Consumption Rate Subroutine
This subroutine calculates the fuel consumption rate in barrels perthousand revenue passenger miles for each aircraft. If the aircraft is inthe fleet in the base year (Class I Mod 1) then the fuel consumption rate(FCRT) is obtained via
FCRT(I.l) = (355.4)(PFASM(I,1))/ELFAC (1=1,2,...,NCLAS)
wherePFASM(I.l) = Pounds of fuel per available seat mile for
aircraft Class I Mod 1= (6.7)(FBH(I,1)-BHAH(I,1)/SMAH(I,1)
For the new or derivative aircraft introduced into the fleet (Class I Mod J,
1 = 1,2 NCLAS; 0=2,3 MCLAS(I)) the fuel consumption rate is given by
FCRT(I.O) = FCRTd.Dd - PFSV(I,0)/100.0) .
(2) Base Year Aircraft Retirement Schedule Subroutine
For each aircraft in the inventory in the base year this sub-routine computes the number retired in subsequent years. Here a linearbuy and linear retirement are assumed; that is, the number of aircraftof each Class I Mod 1 in the fleet can be represented as illustrated inthe diagram below
U1LU
o: >—"<_>OC i—t—<
<C OO
UJ (/•>CO C/0
JZ(I
K AC(I,D
BASE YEAR
KZ(I)YEAR
46

Consequently, letting ACRT(I,1,L) denote the number of Class I Mod 1
retired in year L, the model yields for 1=1,2,...,NCLAS)
, JZ(I) + LT(I)<L<JZ(I) + LT(I) + KZ(I)ACRT(I,1,L) =
0, Otherwise
(Note: In the Ultrasystems1 computer model the base year is designated
year 1 for computational convenience).
(3) RPM By Aircraft Class and Modification for Base YearSubroutine
This subroutine is used to compute for each aircraft its contri-
bution to the total revenue passenger miles (RPM) flown in the base year.
Letting RPM(I,J,1) denote the RPM's flown by aircraft Class I Mod J in
the base year the model yields
AC(I,J) • RPMACd.J), J=lRPM(I.J) =
0, J
where
RPMAC(I.l) = Average revenue passenger miles flown each yearfor each aircraft Class I Mod 1
= (ELFAC • ANS(I,1) • BKSP(I.l) • BHAC(I,1))/100.0
BHAC(I.l) = Block hours per aircraft Class I Mod 1
= BHAH(IJ) • TAHd.l)
(4) JMAX Subroutine
This subroutine computes for each aircraft class (1=1,2,...,NCLAS)
and each year L>1 the latest new or derivative aircraft available in that
year. This quantity denoted by JMAX(I,L) is used in the subsequent sub-
routines.
47

(5) RPM By Aircraft Class and Modification After BaseYear Subroutine
This routine is an iterative scheme for computing the RPMflown by aircraft Class I Mod J in year L>1, RPM(I,J,L). Two assumptionsare inherent in this computation:
1) Any replacement aircraft required (due to retirement orRPM growth) for Class I aircraft in year L are replacedby latest replacement aircraft available, i.e., by air-craft Class I Mod JMAX(I,L).
2) The rate of growth of the RPM per aircraft class in anygiven year is the same as the overall rate of growth ofRPM for that year.
(6) Total Fuel Consumption by Year Subroutine
This subroutine computes the total fuel consumption in barrelsfor each year L and is denoted by TFC(L). This subroutine utilizesFCRT(I,J) and RPM(I,J,L) and is calculated via
NCLAS MCLAS(I)+1TFC(L) = £ 2 (RPM(I,J,L) • FCRT(I,J))/1000.0
1=1 J=l
(7) Total Fuel Consumption Subroutine
Here the fuel consumption by year computed in the previous sub-routine is cumulated to give the total fuel consumption TOTFC. Thus
NYFAR
TOTFC = TFC(L)L=l
(8) Present Worth Subroutine
Here the present worth (in base year dollars) of the total fuelconsumed is computed. Letting PREW denote this quantity, the programyields
NY EARpREW= £ TFC(L) PRICE(L)
L=l [1 + DRATE]L
48

APPENDIX B - COMPARISON OF FUEL CONSUMPTION ANALYSES
In Section 2.1 fuel consumption forecasts were developed for
two basic scenarios, namely: (1) Baseline Without NASA Program and
(2) Baseline With NASA Program. These scenarios were developed according
to assumptions and considerations presented in Section 2.1. On the other
hand, slightly different scenarios can be constructed using the informa-
tion developed by the Task Force and presented in Reference 8, and which
can be referred to as the Task Force Baseline and the Task Force Total
Program. The assumed characteristics of these scenarios are as follows:
CASE: Task Force Baseline
(a) In 1978, a derivative medium-range aircraft will be intro-
duced into service to replace the current fleet of 3-enginenarrow body aircraft. This new aircraft could be the
refanned B-727-300, or, somewhat later, an aircraft usingthe high-bypass-ratio GE/Snecma CFM56 or the P&W JT10D
engines, or possibly a derivative twin-engine wide-body.
This new aircraft is estimated to have a 15% improvement
in SFC over the current B-727 fleet, to provide an averagefuel use of 1.251 bbl per thousand RPM.
(b) In 1983, a derivative long-range aircraft will be introduced
into service. This aircraft will most likely be a stretchedversion of the current B-747, DC-10 or L-1011. The improve-
ment in fuel consumption as compared to the existing wide-body aircraft is estimated at 10%, to give an average fueluse of .793 bbl per thousand RPM.
(c) In 1988, at the projected growth rate, the short-range market
will require the introduction of a new aircraft to satisfy
the demand. This aircraft will probably not be very differentfrom the existing DC-9's because of the special constraintsof the short-haul market, particularly in terms of average
stage length, traffic density and number of competitors.
49

This aircraft is assumed to be 20% more efficient than thecurrent two-engine narrow-body aircraft and to provide anaverage fuel consumption of 1.182 bbl per thousand RPM.
Table B.I provides a summary of this forecast.
CASE: Task Force Total Program
(a) Continued Production Aircraft
The results of the Engine Component Improvement program will beavailable in 1980 and could be used on new production of existing enginetypes shortly thereafter. An improvement of 5% in SFC for all twin-enginenarrow-body aircraft introduced into service after 1982 is estimated toresult from this technology element.
(b) Derivative Aircraft
The derivative three-engine narrow-body aircraft produced after
1978 would also benefit from the Engine Component Improvement program and
would be!5%more efficient than aircraft that would have been produced
without this technology. The net result would be that the derivative
medium-range aircraft introduced into service after 1982 would have a
20% improvement in fuel consumption as compared with current three-enginenarrow-body aircraft.
It is expected that the derivative three- or four-engine wide-
body aircraft introduced in 1983 would benefit from both the Engine
Component Improvement program and from the Fuel Conservative Transport
program. This aircraft would have reduced static stability for lowertrim drag and an improved wing in addition to a more efficient engine.These two technologies would result in a 10% improvement over the aircraft
that would have otherwise been produced, or a 20% improvement in fuel useas compared to the current wide-body aircraft.
50

OJ(U
s-(J
<c<+-o
(OoQJ
01c
OJ
<OCQ
o;o
CO<:
VD
O
8
\e>
i
i
i
pF
.
_ » * * > • "5 * .a ii
eo
13Z ^ui r-
*- *t r*.1/1 u. co«u
CO O
Ul5: _ 5;S 5 ct
* »*—o
CO •—
cfl ~*ui o
CM CO 1
t/> U. O</> t- .«--
«*
°
O«*» r-
s *°•*» t- «/>o Z u.o •-> o.
i
h- z rvz ui
1 « "
0CM
1co
oeneniu
CO Ul COZ O 1
o t- oZ I/IUl
f) ^J- Z O
</) U. _l 1l/l H-«-'OB
0
in00 r-
u
o •-• a.
COzu in
z £ ""OS «n "
3 t g
1CO
oeneni
CO <COZ K- I •
I/) U0 OZ ZUl 3 -
«f O- So
I/) U. 3£ il/l h- ^CO
d
eo
u
|C 91
•r*a <»-•<->z o <o«3 OJ -Ul 4-> 4.
— ' So
5 o
u>co >-
Ul ^ l/>«*> z u.O •-* Ck
au in
»- as t«»z ui« m 'o: i-3 fc 2
-*.
§CO
O
<D °?
CSz •ui r~-
Oin «• r
i«/> -3 CO<
U
•o*C -O JD10 O
o c 6/> tff QJ ^
U Cfl X3 t.a c •*- <at- ui at z
»t u/ S S
inCO >-
z >UJ t— </)
S 5 £
03z
Ul P>CM
\O CO Is.1
c/> u. ca<tu
inenc"5Mvt
•— *>at «*-3 <a
<r c *- a.u S * 1'o u » T:at C 3
«r> o. z >—
; * £ * & -a.
-
'
oCD CM
. . 'Z »•Ul t— UOSZ U.
— Ok
•*~
1o^5 '
enca i
u> °z •Ul O.
f^ CM rv00 U. CO(,0 |_ ^
"
51

(c) New Production Aircraft
The new medium-range aircraft introduced in 1985 would benefitfrom the use of composites in the vertical tail and in secondary structuressuch as the floorboards, elevens, slats, etc. The new aircraft would be15% more efficient than the 1982 derivative three-engine narrow-bodyaircraft, and provide a 35% improvement in fuel use as compared withcurrent aircraft.
By 1988, when a new narrow-body short-range aircraft is introduced,it should be possible to make extensive use of composites for the primarystructures and to incorporate substantial aerodynamic improvements in theaircraft design. Assuming that a reliable turboprop engine has been demon-strated, this new short-haul aircraft would be a likely candidate for thatpropulsion system. The combination of all these technology elements isestimated to result in a new aircraft that is 45% more efficient than the1982 continued-production aircraft, or 50% better than the twin-enginenarrow-body aircraft in the current fleet.
Partly because of the expected benefits of this concentratedtechnology development program, two additional aircraft are expected to beintroduced into service before the end of the century. The first of these,a new long-range wide-body aircraft, could be introduced in 1990 and isexpected to provide a 30% improvement in fuel use as compared to thederivative wide-body aircraft, or 50% as compared to the existing B-747's,DC-lO's, and L-1011's. This new aircraft would have an improved engine,composite primary structures, active controls, optimized aerodynamicdesign, and could also have a laminar flow control system, provided thetechnology demonstration is successful.
The second aircraft to be introduced in the 1990's would be anew medium-range transport that could come into service in 1995. Thisaircraft would incorporate many of the improvements that were applied to the1990 wide-body aircraft. A turboprop propulsion system might also proveto be very attractive for an aircraft of this size and design range. Thisnew aircraft is estimated to be 25% more efficient than the new medium-range aircraft introduced in 1985, ten years earlier, and would provide
52

an overall improvement in fuel use of 50% as compared to the existing
B-727's.
Table B.2 provides a summary of this forecast.
Table B.3 provides a comparison of the Task Force scenarios withthe Ultrasystems scenarios postulated in Section 2.1. As can be seen, the
Ultrasystems scenarios are more conservative in the estimates of savingsobtained; however, they show a larger fuel consumption because of thehigher annual growth rate in RPM.
53

aicu
ro
oS-
uai
03
CDO
Q.
ns-Mo
O)<J
C\J
03
co<c
*o
i
N
if^
Bf•11
1
*
oo in
co en3 u
f-o z EZ « Q.
oCO CM
S C OII
S " >•>. I— tom z u.a — a.
CO
CD
£ rTF" f r*^
100 U. CO</» f— >-»_lo
oo in
m enac nUJ II
^- >- toro z u.z •— Q.
m S °
1: sS £ ct
*"
oCO r—2 1
C9Z •LU O
CM n iCO U. O
5J *~ ""
CJ
_ oo in
co en3E IILU II
^ i— toz 5 ct
CO OCO 00 CM
S *r> z 12O «-" CL
§o in
*~ 5 **"UJ uoc ro
5 £ 5
oCM
1CO
oeni
^^COUJCOZ O I
co2oZ COLU 1 «
PO «• z o
CO I—— 'CO
u
t-^0. OH- m LO•— en
nCO II
LU t— tOro z u.Z >-i O-
m ro00
CO II "
UJ t- tO
Z ~. 0.
CM CM
IIco nz >UJ h- CO
O 1-1 Q.
inCD "~r^ n
oo nLu t- oom x u.O "i O>
«
z ui' tN>
^ ^ •ee. ^_
o
2
8eni
UJ
CO ct COZ 1— 1
co ocs o£!L-
«3- *f QO
a fc£«d
^^^0. O^ in in• » en
uCO «
LU 1— COro z u.Z >-i Ck
inin ro00
nm nLU t— 00
z •— o-
oCM CMCO
co nUJ t— CO
O i— i O.
inCO "~r^ ti
CO B3C ^*LU t— COn z u.0 « 0.
CO
Z LU
^^ nO£ ^O
io
ooco T
C9Z •UJ r~o
in «• r~CO O CO
«td
o. in ini- eng n "i-U >- 00
z S et
inin roCO
Noo a
UJ t- S
z 5 It
OCM CMCO
Hca n
| g |
in
_ . ^" •CO II3^ ^^UJ 1— 00ro z u.0 •- 0.
ca
C3«C " ^ui r*,
CMu> ro r«.00 U. CO
d
V)
fVI
>> ai s-•0 3 10o «- u o.
x o- c ••- exQ W *O Ou o t sT*O 4) flJ 3z ro CL zf-
ea - u. exz rocL z f-
g IUJ Vto ouj 3
C Of
"" f- C •$<*- <-> 10 oO ID <»- 0) JQ
> O C<U >r~ " *r* QJ *•U <- fc. 01-0
t-UJ»
Z U, CO
^— CO OCL CO in
ecT3C ^*
CM Z U.z —• a.
z ' >UI H- COCM Z U.a 5 Q.
P
TCO
enca i
C9z •LU 1*-
cop^ CM P»
1oo u. coiS *~ ~~_l
54

UJ O> •— I in
.— 1—0(— Q- O<c s: CM
or-.
o en
CO *3-CO O
CO i—
en CMCM •CM •—
CO CO
CO
in CM i—
IT) S«r-. too •
10
1X3CO
.o
CO
C 10o -M
•i- Ul•M (OQ. O
12tO Oc u_o
CJ Olo
'cu o3 LI-LI-
^<*- toO rtJ
o <:10 CO•r- <tS- Z«o
zo>— *h-exy3oo_^
o
1UJ
LJL.
•a:IDzz<:
inooCM
j-oento
#
0o0CM
COoin•
LOenen
oen
-*
oenento^o*
inCOen
intoj-co
in
i —r—**•
OOr_
O*lco•
00
enCO
*
toCM
co•
o
•co
en *eCM inr— •CM en• oo
_— to &«en oen •i— in• co
—.
CM &«
S to•
o r-.'C
o &«CM cnCO •or-. - — '
in s«in to0 •O r-
toincn•
cnCMOCO•
cn0
to*
CMCOtoin*
cnoto
COCOor*%.•
to~^VO•
toooto•
cnco«in"
cninin~
co sr-* cn^^ •CM in• CM
^j- ^r rto •i— O• CM
— '-CO *9
O r—cn •O CO
'C.
co s«cn «*t— •O CO. •*-*
o &sin o0 •Oi—
a.a:
in•
in•oc
incoen
i- S-ro tO •cu cu m
CM
OO
coCO
CO<c
o00
O)c
cu(/I•. OQ
8o
I/)(O
E(O
O
a.
cuoo
to(O
nj CMc «^_^cn £O <T3i- S-o. cn
o<X fc-oo o.
toC7>c
CO
o
0)C
oo<c
O)
o>c
oo
i. t. CMa> cu ia. o-to
cocu cu en+j +Ji—rO (OS- S- C
4J +J i-
§ as <oo cuS- S- >>CJ) O>
5: s: cuO. O. Q.o; o;
cu»€
at
cu cuto to<o <t>
CO CD
v\ tocu cu
IO (O Oto to t-
«C < C7)
i— CM
55

C -
56
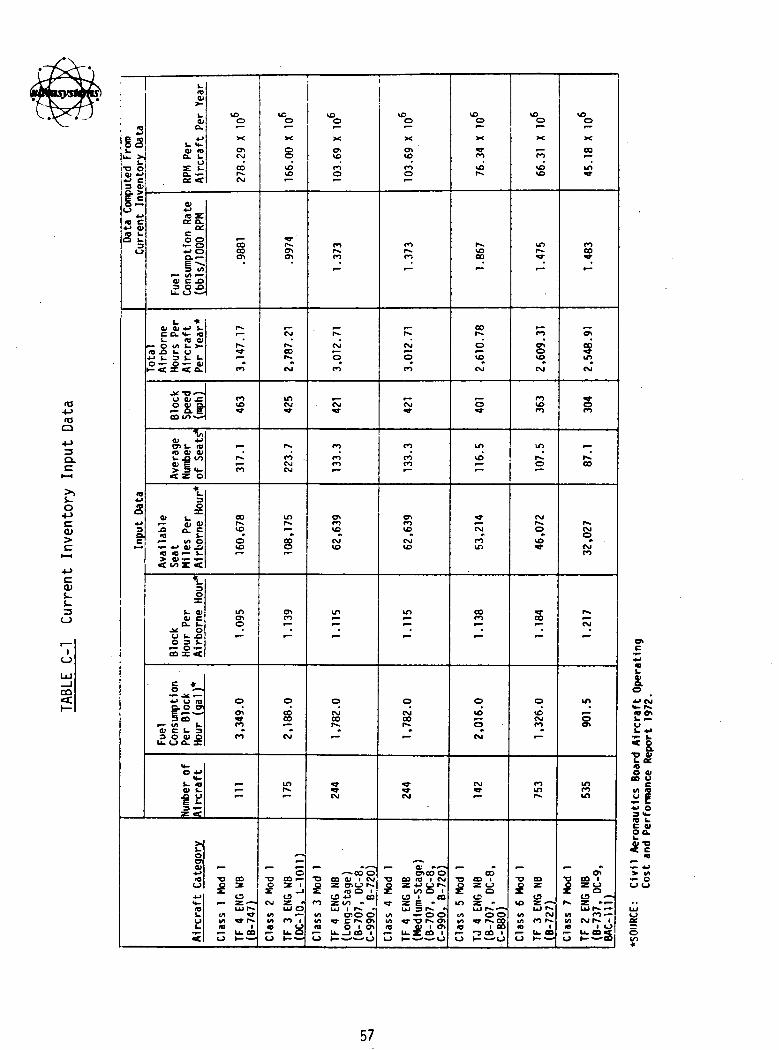
roO
3a.c
O•»->ccu
OJ
S-3o
CO•a:
2§3
LL. >.L.
•0 OO> 4J" C3 01
E' C
4-*10 C4-> OlID L.
3
IO• 4-*
s3
C
i.•0Ol
uo>o.4J
L. «*-Ol 10O. i-
u
ce 5
VO0*^
X
CM
CO
CM
ro 3Cce o.co o4-* O
3 I/)P— in r—0) C J33 O .Ob- Oo-
U *
C CL It- 10L. IO 01
— O U1 1_ >-•0 .O 1_ (J4-> L. 3 i- t.o — o — Hi1- «t Z«X 0-
§
0*
r^f^
»ro
u oixf] ro
Sell) *
InOl 4JOl L. IOro Oi 01i- .O ">> 5 t-
•X Z O
3O
Ol 1_— at <vJO o. C
• 4-> O) XlIO 10 •— U
1. Ol01 CO. L.
.* oU k. JOO 3 Ut- 0 —CO X «C
4«* u ID
t o 015""^
>— in L.0) C L. 3
u-
t- IO01 I-
S-0
Ol
IO
4J
IOL.U
5
ro
co
^O
ovo
ino
o
^^
ro
^_
•o co
LUIO*n ^>
in - roID I— U. CO0 l-o-
voo^X
8<£>f—
enen
f.—CM
CO
CM
inCM
ro .CMCM
inrw
•
§
m•
oCOCO
CM
in
—^ ^o
•D CO r-
OCM Z •
LU O
VI CO 1
0 (-0.
VO0*—X
o\VO
o
ron.pj
^r^CM
O
CO
CM
rororo
OlrovoCMvo
in
i
O
CMCO
"
CM
^- »^~*—~<a o
T3 CO Ol I CMO Z o><-> roS. 10 O 1^ CJ 4J _CO
LU i ro .i/> cno o
•2 LL.5cO ?
VDO^
X
OlVO
roO
rororo,-1
r_p^
CM
O
ro
CMTi-
ro
roro
0>rovoCMvo
in
«
OCOCO
"
CM
*— o; »^ocnco O
TJ CD IO 1 CMO Z 4-> oro£ I/) O 1
is i mw Z E -
LU 3 ro »in i- O OID a; i enr- u-£ m i
voo*"~X
ro
vo
voCO.
co
ovoCM
O
inVD
^w
^f
CNJ
ro\f>
ro•
ovoo*CM
CM
^ „
CO•o co iQ Z (->
0 °m z •
LU ro^-^in OOin *r ro co10 i co•- 1 00 1O ^o^vj
10o^~X
ro
us
inro
^«
^^ro
o>Ovo
CM
roVDro
inroO
CMroOVO
co•
oVDCMro
"
roinro
^•D CO
LU roin CMin ro roIO 1
•— U. CO0 \-—*
VD0*~>c
CO
in
roCO
^_
r*en
5CM
i
CO
roCMoCMro
rofBB
CM
m
C3
inroin
fm, „
13 to I
r* z "-turo p-
« ro i—in CM ro i(0 1 0— U. CD<o t-o^co
57

t-o
X(O T-
a>O)
(Oo
Q.c
OT S-c o
•r- S-> •!-
(O efCO
M-•— Oa>3 +->
LU I/)fO
•a cjC O)03 S-
oOJ Lu
<os-O)oa.
CO
0)o
OJCO
a>(OQ
O 3
u c3 -r-
T3 i—O (US- u>
4-> (0C CQ
CMI
CJ
<£>
QO
LO
00
^~
o0s:
CO
oo?*
CM
O0s:
^~
QO^
LULO LU
O CO l— ien _i
itII C£.
1— coZ Lu LOi— i Q. i—
LiJCO Lu
O r— •-•00 —I
IIII CC
\— coZ LU LOi-l CU i—
CO3 LU
LuCO *— '^^ **™^ !t ' i r*^
i— «3- t >-i
CO Lu CO LOCO \—- 1—
I
LULO LU
O CO •— •en _i
iiII OL
> >-1— CO"Z. LU LO1— 1 CU 1—
LUo u-
LO CM i— i00 _J
II
1— COZ LU LOt-i CU i—
O LuO i— i— i00 —I
IIII QL
\- COZ Lu LO>-l Ou i—
1 ',__O
00 r—3 1 LU
_J LUco i--*"^ " !
LU O•— o:
CM CO 1 >-C_}
CO Lu O LOCO 1— *~T-
<
0
LULO LU
O CO •-<CT> _l
IIII C£
1— COZ LU LOI— l CU r—
LUt~~) l i
LO CM i— i00 — 1
IIII C£
^> ^-h- COZ LU LOt-l CU r—
LUO U_
O •— •-•00 _l
IIII OL
\- coZ Lu LOi— i CU i—
003 1 .LJ-
LUCO LO i— •
LUii o;
CO >-
Lu Z LOI— 1-1 f—
oCM
1CO
CDeneni0
„
CQ CU 1z cne_} LU
(O O LuCO +•> i— <z co -_jLU i r--
cno o:co •* c r-. >-
O 1co u 1 CQ un
jo
LUO Lu
LO CO i— <
IIII CC
\— coZ Lu LOt-i CU i—
LUO LU
CO CM i— iCO _l
nII C£
t— coz: LU LOl— l CU r—
oo co00 r—
LU COz:< Qoo d S
.CM
1CQ
oenenio
CU •>0>CO
CQ rO I•Z. 4-> CJ LU
CO Q LuCO 1 >-iZ E »_iLU 3 r^
•r- o a:CU 1
CO LU 5£ CO LOCO |— - — r—<f
*O
LU0 Lu
LO CO «-t
IIii ce:
1— COZ LU LO1— 1 CU .—
LUO Lu
CO CM l— i00 —1
IIii o:
u- COZ Lu LO1— 1 CU r—
CO <£>
co f—
<C -i Qoo o £
oCO00
1
o„
00co iZ O LU
a u.CD 1-1Z • _lLU r
O OLLO «* I** >-
CO --3 CQ LOCO 1 1—
o
LUO Lu
CO CO •— ien _i
nIi ce:
f— coZ LU LO1— 1 CU 1—
U.O Lu
CO CM t— iCO —1
IIii a:
H- COZ Lu LO•-i CU r—
COZ LU
LuCO 1—1^y ^— 1
LU rCM a:
vo co r"» >-i
CO Lu CO CMCO 1 CM<CCJ
LUCO LU
O CM >— icn _i
iin a:
1— COZ LU LO« Cu •—
u.LU
CVJ CO <-•CO —1
IIII OL
• >-l— coZ U- LO•— i Cu i —
••1
oCO„
enco iz o LU
O LU
z *_iLU r -
co a:i CM r >•ico LU co enCO I '•—<co
S8

J_o
<0 .4->ro -MO O)
at
exc +->
roCO
(Oi.CJ
at -t->3 </>
U. ro
ro
•i- ro_l J_
CU OO i-•r- O->i- <C<1) CO
CO «C
CO .£=<U -t->+J -I-& 3
O)C CO -r-
-(-> a>o co3 ro
T3 COO
COI
O
CO
Q
uo
QOs:
*QO
ai
CM
Q
g
r—
oo
LUO Lu
CM LO H- 1O1 _J
||II OL
\ — coZ Lu LO*-• O- r—
LUr"^ ' '
UO CO <~>
00 ,1 -1
II CCL
t— COz LU inH- 1 Q. I—
LUCO Lu
O r— H-ICO _l
II
1— COZ Lu LO
co3 LU
Luf n >— <Z^-»_l1 1 1 r-~
iCO LU CO LOCO u-^_x,_
i
gJ LO *-
IIn o;
1— COZ Lu LO>-i O_ r—
LULu
88SII
II OH
(— COZ LU IT)i— ' CU •—
LUO LU
0 r- H-<CO _J
IIII C£
1— COZ LU LOH-l Q. 1—
' •
,
OCO F—2 1 LU
_l LUC3 *— i~^ •* iLU O
r— CCCM CO 1 >-
OCO LU O LOCO | r—
IO
LU
IIII CtL
\- COZ Lu LOi— i Q- i—
LU
00 CVI —II
'I O;
I— COZ LU LOH-I a. r—
LUO Lu
O r- H-.CO —I
IIn a:
(— COZ Lu LOH-l O_ 1—
CO3 LU
LuCD LO H-I
LUII CC.
CO >-H-
Lu Z LO1— l-i r-
0CM
1CO
OCT>CT%
1
*-*„
- — > COCO tt) 1•Z. CDCJ LU
ro O LuCJ 4J i— iZ CO » 1LU i r .
CDO Oico «* c r-* >-
O 1CO U 1 CO LOCO H- . ,-<f.
1
0
LU
2 LO — 'a^ in
II C£
t— COZ LU LOt— < Q. r—
LU
LO U-
00™ HjII
n o:1— COZ LU LOH- . a. i—
COVO
co <—LU CO2! <f O^ _J Qco o S-
oCM
1co
oenCT>
10
0) »CDCO
CO ro 1Z -4-> O LU
CO Q LuO 1 •—Z E ~_iLU 3 1 —
•i- o a:cu i
CO Lu 2! CO LOco i — ,—i
o
LU_ 0 LuO LO *-lcr> i
nII C£
H- COZ LU LO•— i Q. i—
LULO 1 '
CM fyj H-.CO _l
IIn a:
1— COZ Lu LOi—< CU r-
CO.,0
co >-~LU CO21 cl
co o zt
oCOCO
1<->
^CO
co iZ 0 LU
O Luo —•Z " 1LU r
o o£LO ^J- 1 — >-
CO >~3 CO LOCO I 'i—
o
LU1 1
IIn a:
u- COZ LU LOH-I CL. f—
LU
«^^IIu ct:
K- COZ LU LOH-l CU I—
coZ LU
LUCO H-i
LU rCM ct:
us co r >-iCO Lu CO CMCO h- CMeC
O
LU— _ lj
IIn ex.
t— COZ U. LOH-l Q. f—
LU
co •— !ljII
1— COZ LU LOHI Q. f—
•
^_\0
CO
^en
co iZ CJ LU
Q LuCD H-<
LU rCO OC.
r-- CM r >-iCO U_ CO LOCO 1 'i—<f.
0
59