NAPLAN test reporting guide 2019€¦ · NAPLAN Data Service 2 Access to NAPLAN writing test images...
76
NAPLAN test reporting guide 2019 VICTORIAN CURRICULUM AND ASSESSMENT AUTHORITY
Transcript of NAPLAN test reporting guide 2019€¦ · NAPLAN Data Service 2 Access to NAPLAN writing test images...
NAPLAN testreporting guide 2019
V I C T O R I A N C U R R I C U L U MA N D A S S E S S M E N T A U T H O R I T Y
2019NAPLAN test reporting guide


2019 NATIONAL ASSESSMENT PROGRAM – LITERACY AND NUMERACY (NAPLAN)
REPORTING GUIDE
YEAR 3, YEAR 5, YEAR 7 AND YEAR 9
© 2019

NAPLAN 2019 Reporting Guide ii
Authorised and published by the Victorian Curriculum and Assessment Authority Level 7, 2 Lonsdale Street Melbourne VIC 3000
ISBN: 978-1-74010-400-5
© Victorian Curriculum and Assessment Authority 2019
No part of this publication may be reproduced except as specified under the Copyright Act 1968 or by permission from the VCAA.
For more information go to: www.vcaa.vic.edu.au/Pages/aboutus/policies/policy-copyright.aspx
The VCAA provides the only official, up-to-date versions of VCAA publications. Details of updates can be found on the VCAA website: www.vcaa.vic.edu.au
This publication may contain copyright material belonging to a third party. Every effort has been made to contact all copyright owners. If you believe that material in this publication is an infringement of your copyright, please email the Copyright Officer: [email protected]
Copyright in materials appearing at any sites linked to this document rests with the copyright owner/s of those materials, subject to the Copyright Act. The VCAA recommends you refer to copyright statements at linked sites before using such materials.
The VCAA logo is a registered trademark of the Victorian Curriculum and Assessment Authority.
iiiNAPLAN 2019 Reporting Guide
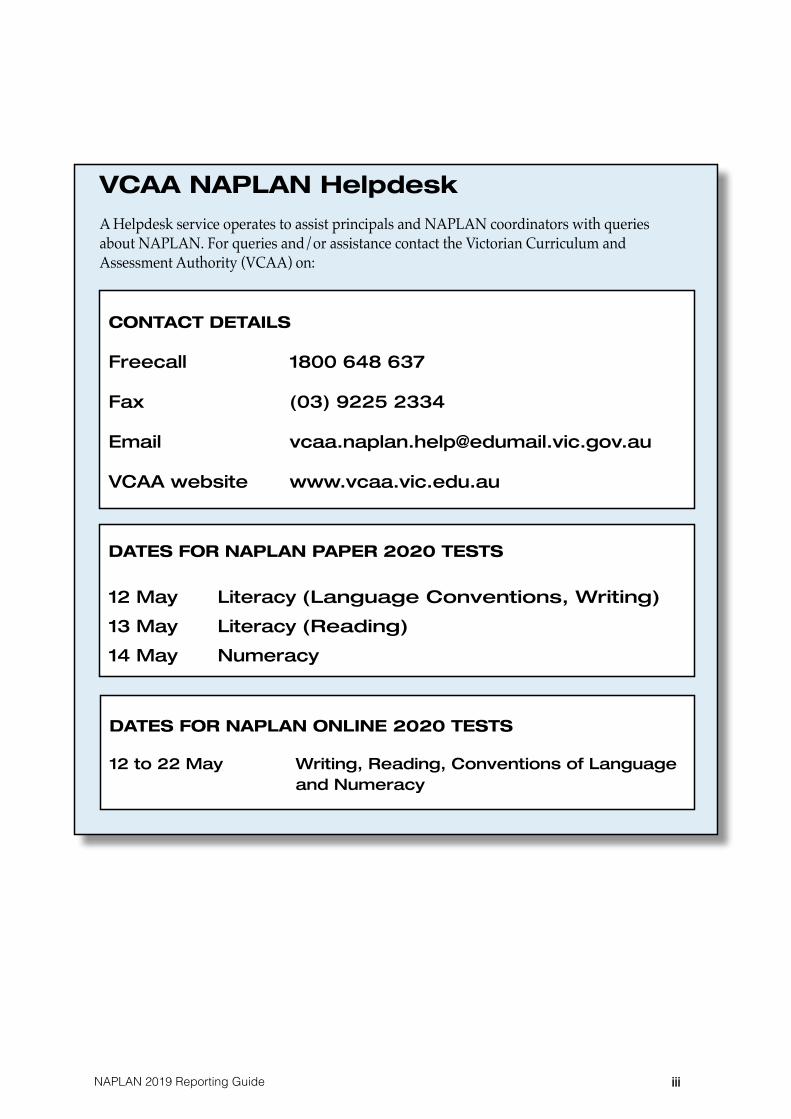
CONTACT DETAILS
Freecall 1800 648 637
Fax (03) 9225 2334
Email [email protected]
VCAA website www.vcaa.vic.edu.au
DATES FOR NAPLAN PAPER 2020 TESTS
12 May Literacy (Language Conventions, Writing)
13 May Literacy (Reading)
14 May Numeracy
VCAA NAPLAN Helpdesk
A Helpdesk service operates to assist principals and NAPLAN coordinators with queries about NAPLAN. For queries and/or assistance contact the Victorian Curriculum and Assessment Authority (VCAA) on:
DATES FOR NAPLAN ONLINE 2020 TESTS
12 to 22 May Writing, Reading, Conventions of Language and Numeracy
NAPLAN 2019 Reporting Guide iv
ContentsVCAA NAPLAN Helpdesk iiiDATES FOR NAPLAN 2020 TESTS iiiIntroduction 1
Privacy Policy 1
NAPLAN Data Service 2 Access to NAPLAN writing test images 2Reports on a national scale 2Scaled scores 2National minimum standards 3Trend data and growth 3Individual student report format 4Release of data 4Reference guides for analysing NAPLAN data 4
Section 1: NAPLAN Data Service Access 5Changing the password 6Accessing a report 7Selection criteria 8Assign Students to Classes function 8Previewing and printing reports 9Extract function 10
Section 2: NAPLAN Data Service Reports 11Summary of reports available 11List of reports and functions 11School Summary Report 13Group Summary Report 14Assessment Area Report 15Writing Criteria Report 16 Item Analysis Report 17Student Response Report 18Student Achievement Level Report 20Five Year Trend Report 22School Comparison Report – matched school group 23 School Comparison Report – matched student group 24 Scaled score summary table 25School-Student Comparison Report 25Relative Growth Report 27Transitional Relative Growth Report 29
Section 3: Interpretation of Results 30Making comparisons 30School and subgroup comparisons 30Individual comparisons and improvement 31
Section 4: Individual Student Reports 32Sample page 1 of the Individual Student Report 33NAPLAN Data Service reports 34Confidentiality of results 34Distribution of Individual Student Reports 34Replacement of Individual Student Reports 34Queries about Individual Student Reports 34
Appendix 1: NAPLAN 2019 Question Details 35Year 3 Reading 35Year 5 Reading 37Year 7 Reading 39Year 9 Reading 41Year 3 Language Conventions 43Year 5 Language Conventions 45Year 7 Language Conventions 47Year 9 Language Conventions 49Year 3 Numeracy 51Year 5 Numeracy 53Year 7 Numeracy (Non-Calculator) 55Year 7 Numeracy (Calculator) 55Year 9 Numeracy (Non-Calculator) 58Year 9 Numeracy (Calculator) 58
Appendix 2: NAPLAN 2019 Data Service Report Summary 61Glossary 66Data presentation 66

1NAPLAN 2019 Reporting Guide
IntroductionThe National Assessment Program - Literacy and Numeracy (NAPLAN) conducted in May 2019, assessed Years 3, 5, 7 and 9 students across the nation in literacy and numeracy.
All tests were constructed by the Australian Curriculum, Assessment and Reporting Authority (ACARA), in consultation with all states and territories. For the literacy assessment, Years 3, 5, 7 and 9 students completed three tests consisting of a Reading test, a Writing test and a Language Conventions test. For numeracy, Years 3 and 5 students completed one Numeracy test for which a calculator was not permitted. Years 7 and 9 students completed two Numeracy tests, the first of which permitted the use of a calculator.
The Victorian Curriculum Assessment Authority (VCAA) provides reports on individual student results and school data to all Victorian schools through the secure web-based NAPLAN Data Service.
Privacy Policy
The Victorian Curriculum and Assessment Authority (VCAA) is committed to the protection of student information generated by NAPLAN. All personal information collected during NAPLAN is used in accordance with the Privacy and Data Protection Act 2014.
In order to conduct the NAPLAN tests, the VCAA collects names and achievement data of all students who undertake the Year 3, Year 5, Year 7 and Year 9 tests. The VCAA also collects information on student gender, language background, Aboriginal and Torres Strait Islander (ATSI) status, Victorian Student Number (VSN) and date of birth.
The VCAA supports schools’ privacy compliance with NAPLAN testing requirements by encouraging principals to ensure that their parent communities are aware of the purposes for which NAPLAN data will be used.
The VCAA uses the student information provided by schools to pre-print individual student details on the front cover of the test books and to report to parents on their child’s performance. This data is also provided to the school to assist principals to analyse the effectiveness of their school programs and to identify individual students’ strengths and weaknesses.
Schools across Australia are required to collect background characteristic information for all students participating in NAPLAN. The VCAA, on behalf of the Department of Education and Training (DET), is responsible for the management and supply of this information for national reporting purposes.
The information that will be required for each student is as follows: • parental school education (mother and father as applicable) • parental non-school education (mother and father as applicable) • main language spoken at home (student) • main language spoken at home (mother and father as applicable) • parental occupation • country of birth.
No individual student will be identifiable in the information released for national reporting purposes.
The principal will ensure that all student details and results are confidential.
The VCAA privacy policy can be found at: www.vcaa.vic.edu.au/Pages/aboutus/policies/privacypolicy.aspx
NAPLAN 2019 Reporting Guide 2
NAPLAN Data ServiceThe Years 3, 5, 7 and 9 NAPLAN data is available for Victorian schools to access online, via the secure NAPLAN Data Service. All student and school results from 2008 to 2019 can be accessed by schools on this website. Schools must use their unique login and security password to access their results. Access to NAPLAN writing test images
Victorian schools can access images of their students’ NAPLAN writing test responses to assist with interpretation of their NAPLAN writing results. Downloaded images of the writing responses are also used by teachers to provide feedback to students on their NAPLAN writing performance.
The Writing test images will be available via the NAPLAN Test Administration website (www.naplanadmin.vic.edu.au). It is anticipated that access to the images will be provided from the week beginning 2 September 2019 which will coincide with the release of NAPLAN 2019 reports. The images will then be available until the end of term 4.
Details on how to access the website and instructions on how to download images will be sent to school principals with the NAPLAN school reporting packages.
Please note that schools have access only to images of their own students’ Writing tests and those images are available strictly for internal school use.
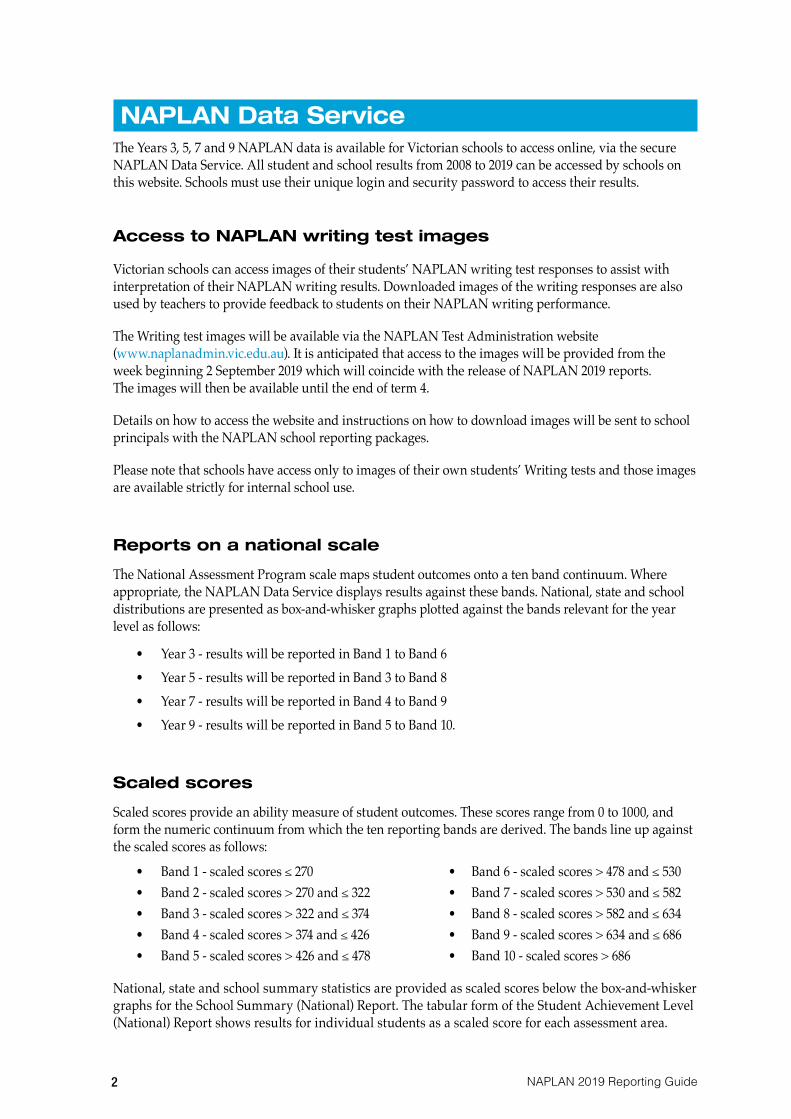
Reports on a national scale
The National Assessment Program scale maps student outcomes onto a ten band continuum. Where appropriate, the NAPLAN Data Service displays results against these bands. National, state and school distributions are presented as box-and-whisker graphs plotted against the bands relevant for the year level as follows:
• Year 3 - results will be reported in Band 1 to Band 6• Year 5 - results will be reported in Band 3 to Band 8• Year 7 - results will be reported in Band 4 to Band 9• Year 9 - results will be reported in Band 5 to Band 10.
Scaled scores
Scaled scores provide an ability measure of student outcomes. These scores range from 0 to 1000, and form the numeric continuum from which the ten reporting bands are derived. The bands line up against the scaled scores as follows:
• Band 1 - scaled scores ≤ 270 • Band 6 - scaled scores > 478 and ≤ 530• Band 2 - scaled scores > 270 and ≤ 322 • Band 7 - scaled scores > 530 and ≤ 582• Band 3 - scaled scores > 322 and ≤ 374 • Band 8 - scaled scores > 582 and ≤ 634• Band 4 - scaled scores > 374 and ≤ 426 • Band 9 - scaled scores > 634 and ≤ 686• Band 5 - scaled scores > 426 and ≤ 478 • Band 10 - scaled scores > 686
National, state and school summary statistics are provided as scaled scores below the box-and-whisker graphs for the School Summary (National) Report. The tabular form of the Student Achievement Level (National) Report shows results for individual students as a scaled score for each assessment area.
3NAPLAN 2019 Reporting Guide
Scaled scores can be directly compared across time within any given assessment area. However, comparison of scaled scores across different assessment areas is not meaningful and is not recommended.
National minimum standards With the introduction of NAPLAN in 2008, single point national benchmarks were replaced with a national minimum standard, defined by a particular band at each year level as follows:
• For Year 3, the national minimum standard is Band 2• For Year 5, the national minimum standard is Band 4• For Year 7, the national minimum standard is Band 5• For Year 9, the national minimum standard is Band 6.
Students with results in these bands have typically demonstrated the basic elements of literacy and numeracy for their year level. Students with results in the lowest band for their year level have not achieved the National Minimum Standard, and are likely to require focused intervention or specialised support to fully participate in schooling.
Details of the general skills associated with the National Minimum Standards are provided, for each domain, on the ACARA website at http://www.nap.edu.au/naplan
Trend data and growth
The Five Year Trend Report displays a full five year data set, and provides schools with an opportunity to make comparisons between their NAPLAN results over the five years from 2015 – 2019.
Three further reports are available which help establish growth patterns.
The School Comparison Report shows the distribution of results for Year 3, (5 or 7) students in 2017, and that for the same students in Year 5 (7 or 9) in 2019.
The School-Student Comparison Report shows the relative position of 2017 and 2019 results for a selected student, with respect to national, state and, where applicable, school results.
The Relative Growth Report shows the level of growth for each student relative to students who had the same NAPLAN score two years ago.
The Transitional Relative Growth Report provides grouped results of Year 5 students who sat the NAPLAN tests at the school two years ago and for whom a current Year 7 result can be found.
More detailed information about these reports is provided in Section 2.
NAPLAN 2019 Reporting Guide 4
Individual Student Report format
The format of the NAPLAN Student Reports is similar for all states and territories. A sample NAPLAN Student Report for 2019 is provided on page 33.
Release of data
It is likely that some national data will not be available at the time of the Data Service release. In these cases, national results will be withheld and a note will appear indicating that additional data will be provided when available.
Reference guides for analysing NAPLAN data The VCAA has developed some examples of the ways in which NAPLAN data can be used at the classroom level which can be found in the Teacher’s Guide to using NAPLAN data diagnostically at: http://usingassessmentdata.vcaa.vic.edu.au/naplan/
Additionally, a reference guide outlining the structure and function of the new Relative Growth Report is available at: http://www.vcaa.vic.edu.au/Documents/naplan/GuidetoRelativeGrowthReport.pdf

5NAPLAN 2019 Reporting Guide
Section 1: NAPLAN Data Service Access
The NAPLAN 2019 student results and school data are available on the secure NAPLAN Data Service website. Principals should ensure that all personnel who are given access to their school’s data treat that information in a confidential manner.
To access this website, go to: https://naplands.vcaa.vic.edu.au
This screen will appear:
Click on ‘NAPLAN Data Service System Login’.
You will see the login screen.
Enter the school identification login name (User ID) and password, then left click on the ‘Login’ button. Passwords are case sensitive.

NAPLAN 2019 Reporting Guide 6
This screen will appear:
Note: When a school logs on to the NAPLAN Data Service, the test frame on the ‘Reports Parameters‘ screen will be customised to the year level and type of tests completed by students at that school. The screen will vary depending on the tests attempted by students in that school in the period from 2008 to 2019.
The drop-down menu options will also match the testing history of the school.
For 2019, the ‘Reporting Years’ menu can offer NAPLAN results for 2008 to 2019. The ‘Report Name’ menu will contain reports relevant to the year level and reporting year for your school. Check the table ‘NAPLAN 2019 Data Service Report Summary’ on page 61 to see which reports relate to the NAPLAN 2019 tests.
Please note: To ensure data security, school passwords are changed annually. Passwords for 2019 have been supplied to principals. If a password is lost, the principal should send an email to: <[email protected]>. Please include ‘Password Request’ in the subject line.
Changing the password
The school identification login (User ID) is a permanent name which has been programmed for the school and cannot be changed. The password may be changed by accessing the ‘Change Password’ option at the top right of the initial ‘NAPLAN Reports Parameters’ screen.
Note: A password must consist of a minimum of six characters (no spaces), and must include at least one letter and one number. Passwords are case sensitive.
2019

7NAPLAN 2019 Reporting Guide
Accessing a report
Log into the NAPLAN Data Service and from the ‘Report Parameters’ screen:
1. Select the required year level in the ‘Test’ frame2. Select 2019 from the ‘Reporting Year’ drop-down menu3. Select the report required from the ‘Report Name’ drop-down menu.
When a report is selected, additional parameters will be displayed, as shown below for the Group Summary Report.
2019
2019

NAPLAN 2019 Reporting Guide 8
Selection criteria
The selection criteria are the additional options that are available once the Report Name has been selected. The available options will vary for each specific report. Selection criteria may include:
• Group selection
This allows reporting on students by gender, Language Background Other Than English (LBOTE) and Aboriginal and Torres Strait Islander (ATSI) status.
• Class selection
Reporting on a class can be generated by selecting a class from the ‘Class Code’ drop-down menu on the ‘Report Parameters’ screen. See below for details on how to assign students to classes.
• Student selection
Some reports allow reporting on all students or, by selecting the required name from the ‘Student Name’ drop-down menu, one specific student.
Assign Students to Classes function
For 2019 reports, this function can be accessed from all reports except the School Summary Report, the Five Year Trend Report, the School Comparison Report and the School-Student Comparison Report.
The ‘Assign Students to Classes’ function allows the creation of classes and the assigning of students to those classes.
Click on the ‘Assign Students to Classes’ button. This takes you to the ‘Assign Students to Classes’ screen.
A list of the names of the selected group of students will appear on the screen with a ‘Class’ drop-down menu available against each student name.

9NAPLAN 2019 Reporting Guide
If schools provided class information to the VCAA during the enrolment phase, this information will be included in the NAPLAN Data Service next to student names.
Classes can be created using the ‘Create/Delete Classes’ button on the top right hand side of the ‘Assign Students to Classes’ screen. This will open the ‘Create/Delete Classes’ window.
A class can be deleted at any time by clicking the ‘Delete’ column next to the class name.
To create a new class, select the ‘Reporting Test’ required and enter the new class code in the available field, then click on the Save button. Please note that class names can not be greater than 12 characters.
After the required class or classes are created, close this window by clicking on the ‘Close’ link at the top right of this window. You will be returned to the ‘Assign Students to Classes’ screen where the new class will appear in the ‘Class’ drop-down menu next to the student name.
Note: Students do not have to be assigned to a class unless a report is needed for that particular group of students.
Previewing and printing reports
When the required report has been chosen and the appropriate criteria selected for the report, click on the ‘Preview Report’ button located on the bottom left of the screen. This will display the report on the screen.
The following functions are available at the top right of the preview report screen:
Preview All Pages I Print I PDF I Word I Close
‘Preview All Pages’ enables you to view all the pages of a longer report on a single screen.
‘Print’ enables you to print out part or all of a report. Check your print page layout before printing the reports. The Student Achievement Level Report, the Group Summary Report and the Writing Summary Report are best printed in portrait layout while all the other reports should be printed in landscape.
‘PDF’ enables the report to be exported to PDF format to allow for storage or printing.
‘Word’ enables you to send the report to MS Word where you can store it or place it in another Microsoft Word or Microsoft Excel document. ‘Export to Microsoft Word’ will only work with versions of Microsoft Word 2002 or later.
‘Close’ closes the ‘Preview Reports’ screen.

NAPLAN 2019 Reporting Guide 10
Extract function
The NAPLAN Data Service has an extract function that enables schools to extract report data in a tabular format. The selected data is extracted into a comma separated values (CSV) file format that can either be saved as an MS Excel document or imported into MS Access for further analysis and charting.
Schools are able to extract data at both the school level and student level, and can also extract national and state means and percentiles for outcome scores.
The extract function can be accessed through the ‘Extract’ link located at the top of the initial ‘Report Parameters’ screen.
The ‘Extract’ screen is shown below. Instructions on how to run the extract function can be found in the ‘Help’ link located at the top of the screen.
2019
2019
11NAPLAN 2019 Reporting Guide
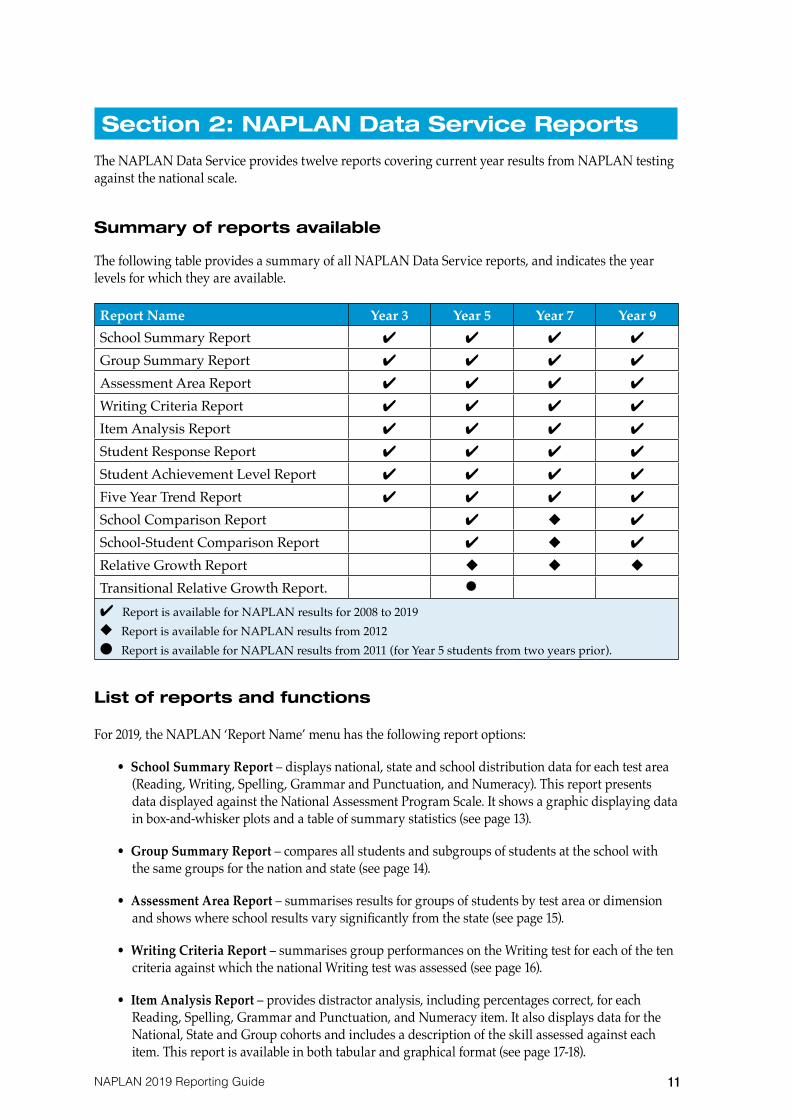
Section 2: NAPLAN Data Service Reports The NAPLAN Data Service provides twelve reports covering current year results from NAPLAN testing against the national scale.
Summary of reports available
The following table provides a summary of all NAPLAN Data Service reports, and indicates the year levels for which they are available.
Report Name Year 3 Year 5 Year 7 Year 9School Summary Report 4 4 4 4
Group Summary Report 4 4 4 4
Assessment Area Report 4 4 4 4
Writing Criteria Report 4 4 4 4
Item Analysis Report 4 4 4 4
Student Response Report 4 4 4 4
Student Achievement Level Report 4 4 4 4
Five Year Trend Report 4 4 4 4
School Comparison Report 4 u 4
School-Student Comparison Report 4 u 4
Relative Growth Report u u u
Transitional Relative Growth Report.4 Report is available for NAPLAN results for 2008 to 2019 u Report is available for NAPLAN results from 2012● Report is available for NAPLAN results from 2011 (for Year 5 students from two years prior).
List of reports and functions
For 2019, the NAPLAN ‘Report Name’ menu has the following report options:
• School Summary Report – displays national, state and school distribution data for each test area (Reading, Writing, Spelling, Grammar and Punctuation, and Numeracy). This report presents data displayed against the National Assessment Program Scale. It shows a graphic displaying data in box-and-whisker plots and a table of summary statistics (see page 13).
• Group Summary Report – compares all students and subgroups of students at the school with the same groups for the nation and state (see page 14).
• Assessment Area Report – summarises results for groups of students by test area or dimension and shows where school results vary significantly from the state (see page 15).
• Writing Criteria Report – summarises group performances on the Writing test for each of the ten criteria against which the national Writing test was assessed (see page 16).
• Item Analysis Report – provides distractor analysis, including percentages correct, for each Reading, Spelling, Grammar and Punctuation, and Numeracy item. It also displays data for the National, State and Group cohorts and includes a description of the skill assessed against each item. This report is available in both tabular and graphical format (see page 17-18).

NAPLAN 2019 Reporting Guide 12
• Student Response Report – provides detailed information on results for either one student or for a group of students (see page 18-19).
• Student Achievement Level Report – provides summary information on results for either one student or for a group of students. This report can be printed in graphic and tabular formats. This data is displayed against the National Assessment Program Scale (see pages 20-21).
• Five Year Trend Report – presents national, state and school data from 2015 to 2019 as box-and-whisker plots on the national scale. These are provided separately for each test area (Reading, Writing, Spelling, Grammar and Punctuation and Numeracy). In addition, national, state and school scaled score means are plotted on a line graph over the five year period of comparison (see page 22).
• School Comparison Report – compares results of students at the school who undertook the Year 5 (7 or 9) tests in 2019 with their results, if available, for the tests they undertook in Year 3 (5 or 7) in 2017. National, state and (where applicable) school results are also shown for each of the two testing periods (see pages 23-25).
• School–Student Comparison Report – shows, for an individual student, Year 3 (5 or 7) results from 2017 and Year 5 (7 or 9) results from 2019 with respect to the distribution of national, state and (where applicable) school outcomes (see pages 25-26).
• Relative Growth Report – this report shows the level of growth for each student relative to similar ability students. Each student’s level of relative growth is determined by comparing their result to results of Victorian students who had the same NAPLAN score two years ago. The tabular version of the report shows the scaled score outcomes and relative growth category (‘high’, ‘medium’ or ‘low’) for each student at the school that participated in NAPLAN assessment. The graphical version of the report provides a summary of these relative growth levels, and also displays them with respect to achievement levels from two years prior (see pages 27-28). Note: this report is available for Year 5, Year 7 and Year 9.
• Transitional Relative Growth Report – this report provides the graphical version of the Relative Growth Report for students who sat the NAPLAN tests at the school two years prior to the current test year, for whom current Year 7 result can be found from a different school. This group level report shows the overall percentages of students from the Year 5 cohort two years prior who achieved high, medium or low relative growth in Year 7. This information is also shown with respect to the relevant Year 5 NAPLAN bands results. Note that the report is accessed from the reporting year option for the Year 5 cohort of interest – not from the current reporting year (see page 29).
13NAPLAN 2019 Reporting Guide
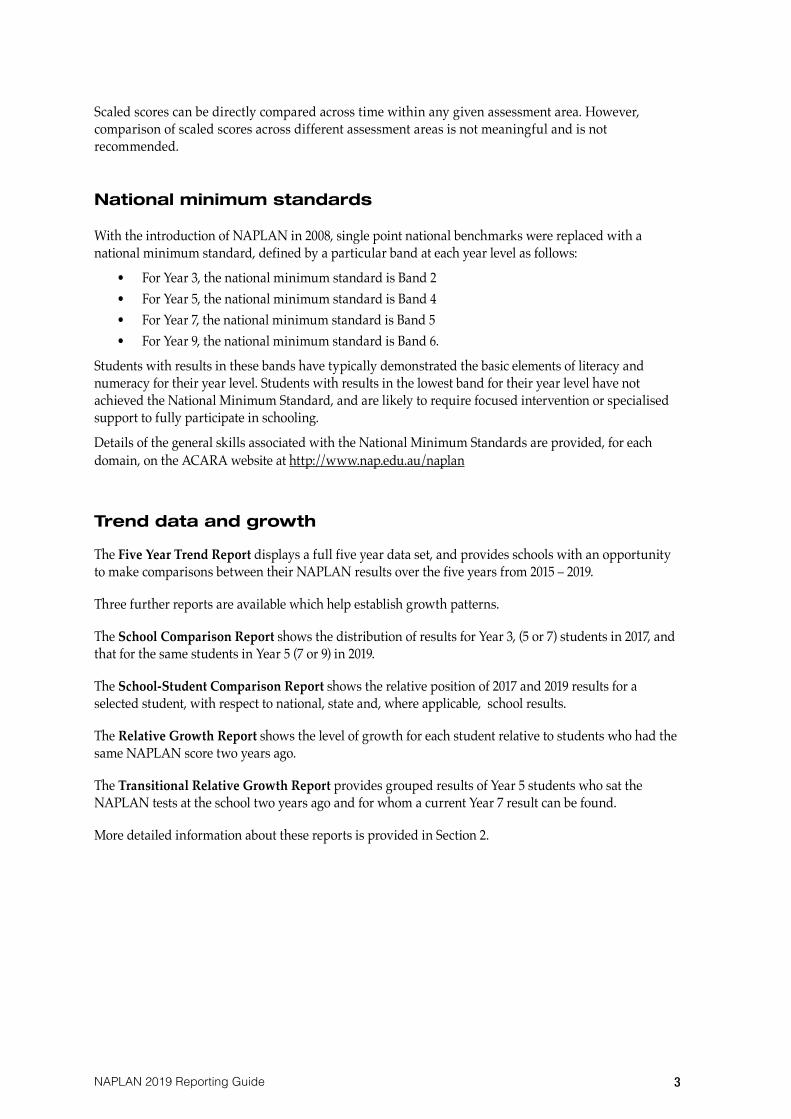
School Summary Report
This report provides data on groups of students who completed the Years 3, 5, 7 and 9 NAPLAN tests and reports on Reading, Writing, Spelling, Grammar and Punctuation, and Numeracy. The School Summary Report displays the national, state and school distribution data for each test area on the National Assessment Program scale (National Band results).
The report can be viewed for all students or by subgroup (Girls, Boys, LBOTE and ATSI) and provides a graphic displaying data in box-and-whisker plots. A table showing summary statistics is included below the graphs. For the National Report, these statistics are given as scaled scores.
Example of School Summary Report
Note: Where there are fewer than ten students in the selected group, the box-and-whisker presentation is replaced by a series of dots. Each dot represents a specific student, except when there are students who receive the same result.
These graphs show the distribution of national, state and school results on the (ten band) National scale.
This table provides the scaled score summary statistics at national, state and school levels.
NAPLAN 2019 Reporting Guide 14
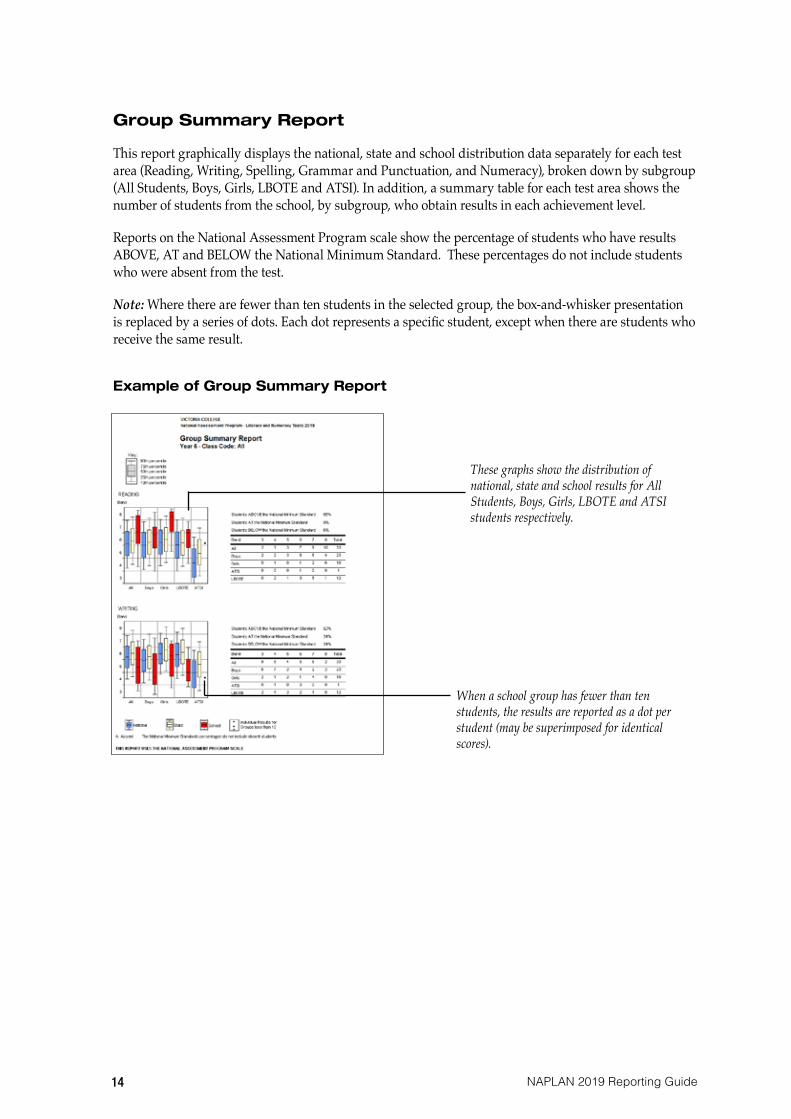
Group Summary Report
This report graphically displays the national, state and school distribution data separately for each test area (Reading, Writing, Spelling, Grammar and Punctuation, and Numeracy), broken down by subgroup (All Students, Boys, Girls, LBOTE and ATSI). In addition, a summary table for each test area shows the number of students from the school, by subgroup, who obtain results in each achievement level.
Reports on the National Assessment Program scale show the percentage of students who have results ABOVE, AT and BELOW the National Minimum Standard. These percentages do not include students who were absent from the test.
Note: Where there are fewer than ten students in the selected group, the box-and-whisker presentation is replaced by a series of dots. Each dot represents a specific student, except when there are students who receive the same result.
Example of Group Summary Report
These graphs show the distribution of national, state and school results for All Students, Boys, Girls, LBOTE and ATSI students respectively.
When a school group has fewer than ten students, the results are reported as a dot per student (may be superimposed for identical scores).
15NAPLAN 2019 Reporting Guide
Assessment Area Report
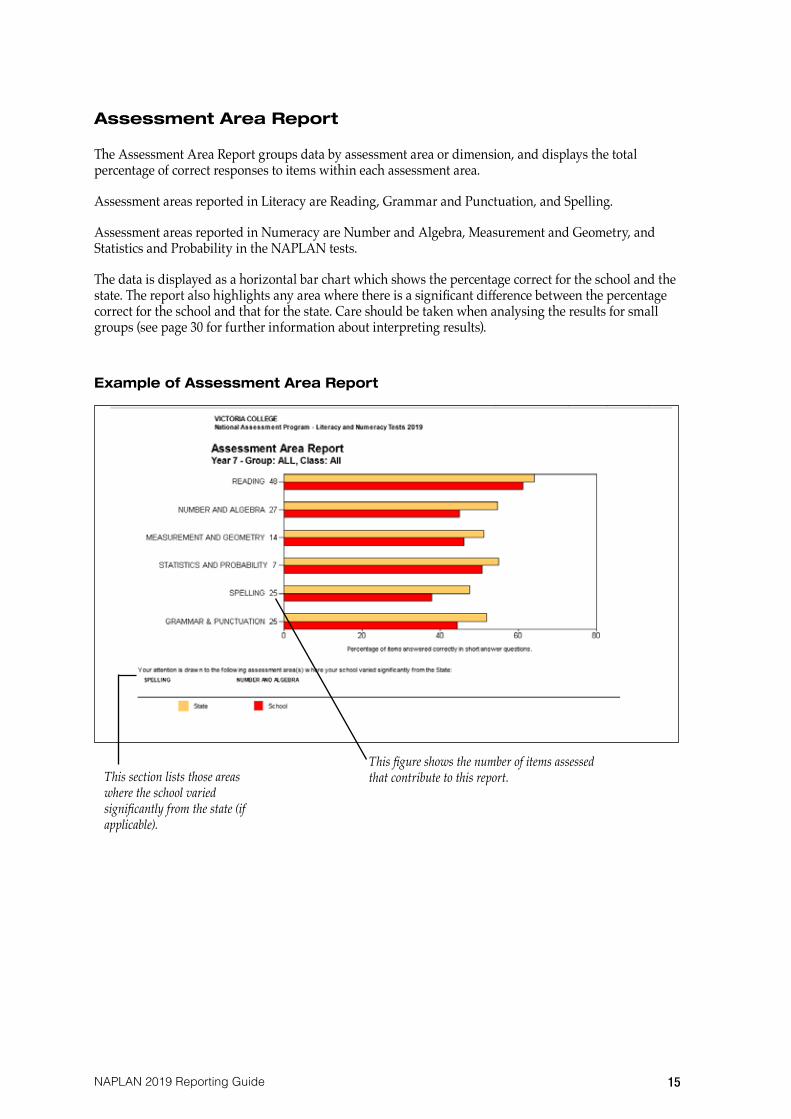
The Assessment Area Report groups data by assessment area or dimension, and displays the total percentage of correct responses to items within each assessment area.
Assessment areas reported in Literacy are Reading, Grammar and Punctuation, and Spelling.
Assessment areas reported in Numeracy are Number and Algebra, Measurement and Geometry, and Statistics and Probability in the NAPLAN tests.
The data is displayed as a horizontal bar chart which shows the percentage correct for the school and the state. The report also highlights any area where there is a significant difference between the percentage correct for the school and that for the state. Care should be taken when analysing the results for small groups (see page 30 for further information about interpreting results).
Example of Assessment Area Report
This section lists those areas where the school varied significantly from the state (if applicable).
This figure shows the number of items assessed that contribute to this report.
NAPLAN 2019 Reporting Guide 16
Writing Criteria Report
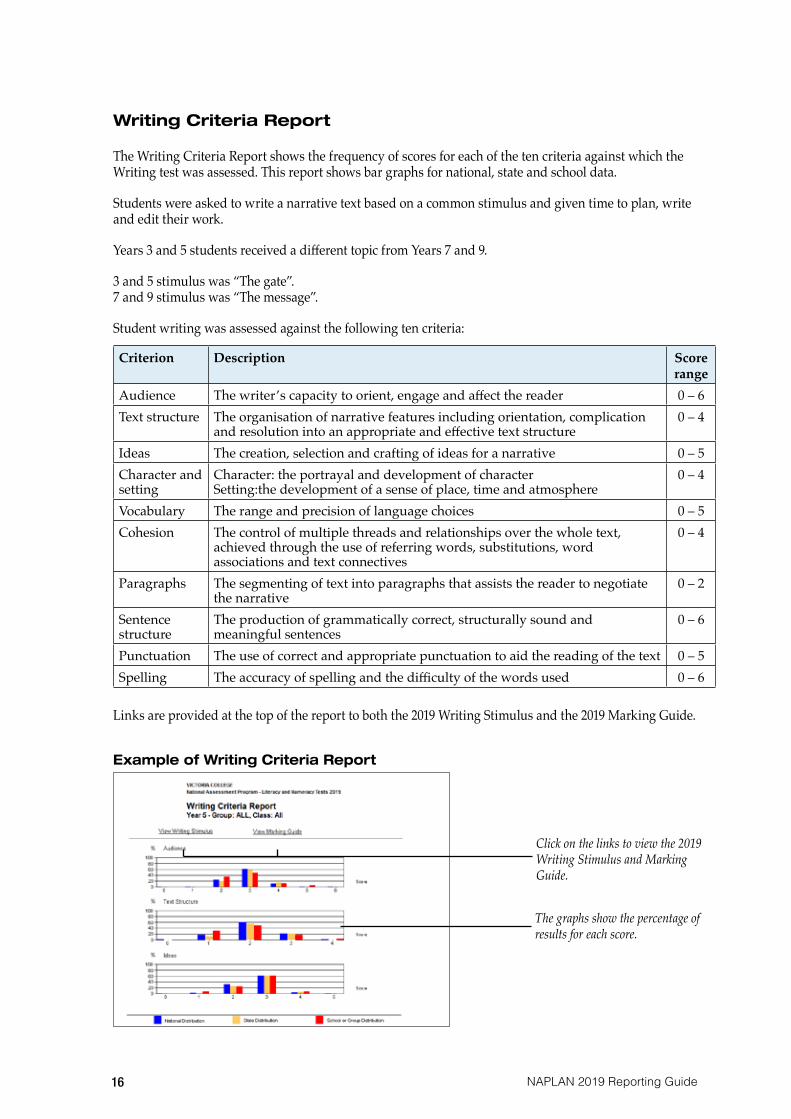
The Writing Criteria Report shows the frequency of scores for each of the ten criteria against which the Writing test was assessed. This report shows bar graphs for national, state and school data.
Students were asked to write a narrative text based on a common stimulus and given time to plan, write and edit their work.
Years 3 and 5 students received a different topic from Years 7 and 9.
3 and 5 stimulus was “The gate”. 7 and 9 stimulus was “The message”.
Student writing was assessed against the following ten criteria:
Criterion Description Score range
Audience The writer’s capacity to orient, engage and affect the reader 0 – 6Text structure The organisation of narrative features including orientation, complication
and resolution into an appropriate and effective text structure 0 – 4
Ideas The creation, selection and crafting of ideas for a narrative 0 – 5Character and setting
Character: the portrayal and development of characterSetting:the development of a sense of place, time and atmosphere
0 – 4
Vocabulary The range and precision of language choices 0 – 5Cohesion The control of multiple threads and relationships over the whole text,
achieved through the use of referring words, substitutions, word associations and text connectives
0 – 4
Paragraphs The segmenting of text into paragraphs that assists the reader to negotiate the narrative
0 – 2
Sentence structure
The production of grammatically correct, structurally sound and meaningful sentences
0 – 6
Punctuation The use of correct and appropriate punctuation to aid the reading of the text 0 – 5Spelling The accuracy of spelling and the difficulty of the words used 0 – 6
Links are provided at the top of the report to both the 2019 Writing Stimulus and the 2019 Marking Guide.
Example of Writing Criteria Report
Click on the links to view the 2019 Writing Stimulus and Marking Guide.
The graphs show the percentage of results for each score.

17NAPLAN 2019 Reporting Guide
Item Analysis Report
The tabular version of the Item Analysis Report provides summary information about items in Reading, Spelling, Grammar and Punctuation, and Numeracy. All reports are available by item order or by difficulty order. In addition, Numeracy reports can be run by dimension order. For Years 7 and 9, the Numeracy reports are available either for the calculator and non-calculator tests separately, or as a combined report.
This report provides item distractor analysis information, including the percentage correct for each question for the national, state and school cohorts, and a description of the skill assessed for each item. For multiple choice questions, the percentage for each item response is also given.
A link is provided from each item number (in column 1) to the test item in the relevant NAPLAN 2019 test paper. A document providing summary information about the test can be accessed via a link above the table in the report.
Example of Item Analysis Report - tabular format
Each item number is a link to the test question.
This link displays a summary document for this test.
NAPLAN 2019 Reporting Guide 18
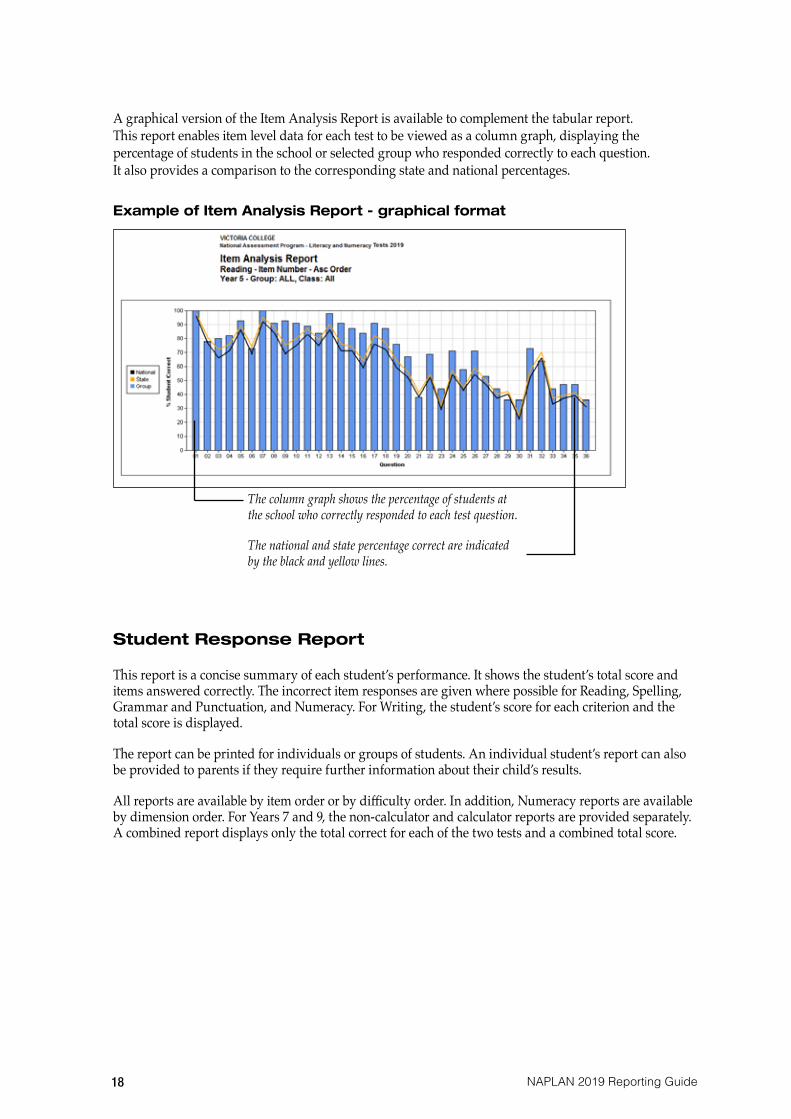
A graphical version of the Item Analysis Report is available to complement the tabular report. This report enables item level data for each test to be viewed as a column graph, displaying the percentage of students in the school or selected group who responded correctly to each question. It also provides a comparison to the corresponding state and national percentages.
Example of Item Analysis Report - graphical format
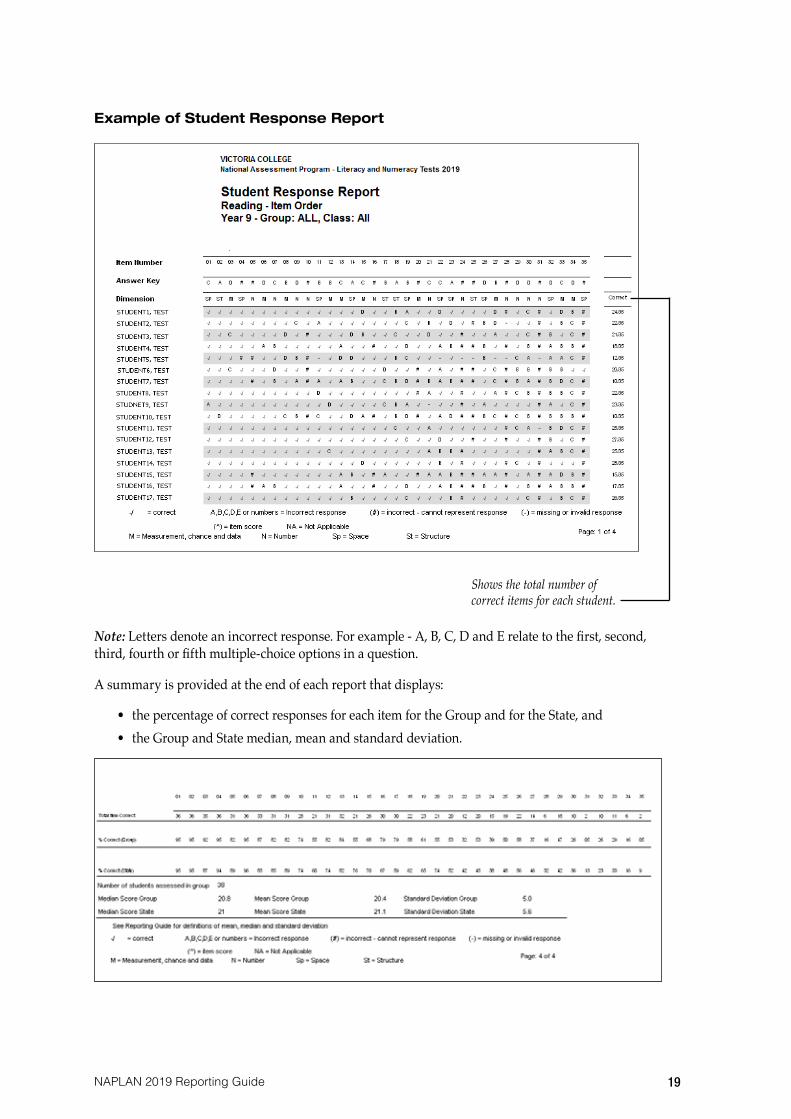
Student Response Report
This report is a concise summary of each student’s performance. It shows the student’s total score and items answered correctly. The incorrect item responses are given where possible for Reading, Spelling, Grammar and Punctuation, and Numeracy. For Writing, the student’s score for each criterion and the total score is displayed.
The report can be printed for individuals or groups of students. An individual student’s report can also be provided to parents if they require further information about their child’s results.
All reports are available by item order or by difficulty order. In addition, Numeracy reports are available by dimension order. For Years 7 and 9, the non-calculator and calculator reports are provided separately. A combined report displays only the total correct for each of the two tests and a combined total score.
The column graph shows the percentage of students at the school who correctly responded to each test question.
The national and state percentage correct are indicated by the black and yellow lines.
19NAPLAN 2019 Reporting Guide
Example of Student Response Report
Note: Letters denote an incorrect response. For example - A, B, C, D and E relate to the first, second, third, fourth or fifth multiple-choice options in a question.
A summary is provided at the end of each report that displays:
• the percentage of correct responses for each item for the Group and for the State, and • the Group and State median, mean and standard deviation.
Shows the total number of correct items for each student.
NAPLAN 2019 Reporting Guide 20
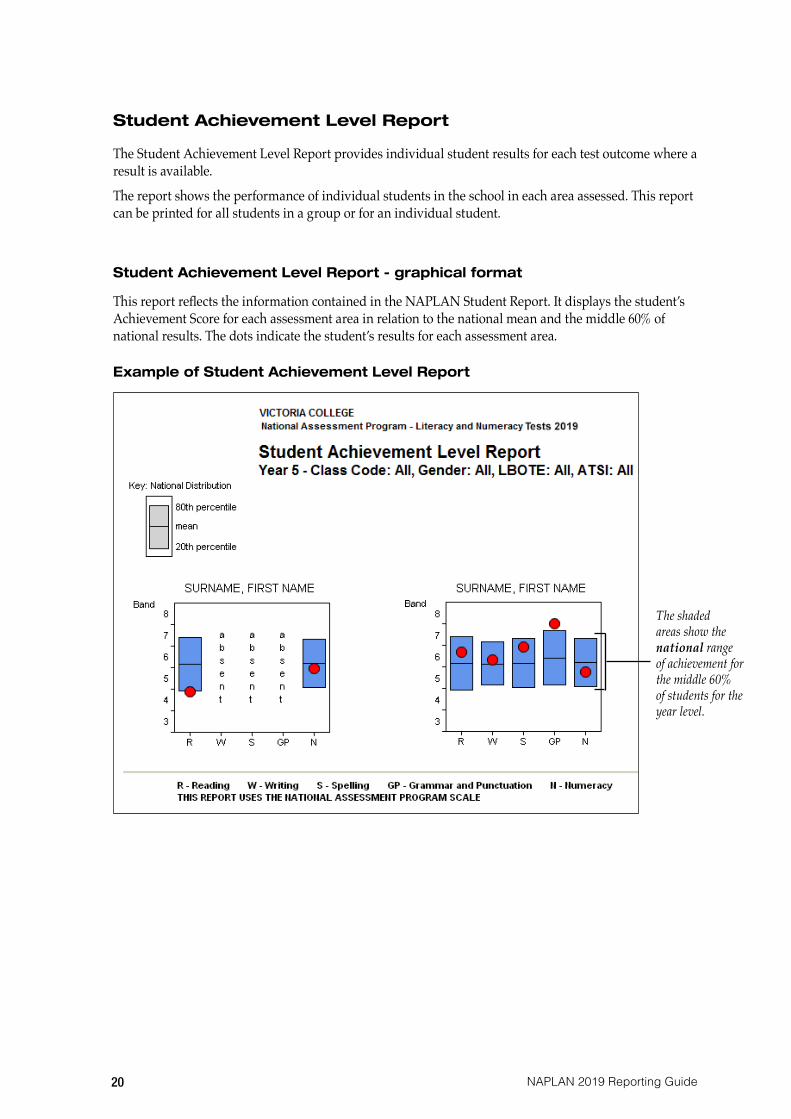
Student Achievement Level Report
The Student Achievement Level Report provides individual student results for each test outcome where a result is available.
The report shows the performance of individual students in the school in each area assessed. This report can be printed for all students in a group or for an individual student.
Student Achievement Level Report - graphical format
This report reflects the information contained in the NAPLAN Student Report. It displays the student’s Achievement Score for each assessment area in relation to the national mean and the middle 60% of national results. The dots indicate the student’s results for each assessment area.
Example of Student Achievement Level Report
The shaded areas show the national range of achievement for the middle 60% of students for the year level.

21NAPLAN 2019 Reporting Guide
Student Achievement Level Report - tabular format
The tabular form of this report gives the Scaled Score outcome for each student in the group, and for each test for which a result is available.
Reports student achievement in scaled scores.

NAPLAN 2019 Reporting Guide 22
Five Year Trend Report
This report provides trend data on groups of students who have completed the NAPLAN tests.
The report shows summary results in the form of box-and-whisker graphs for students in Years 3, 5, 7 and 9 in the areas of Reading, Writing, Spelling, Grammar and Punctuation, and Numeracy. Results are given for the national, state and school groups. The report can be run for the whole group (All), or by Gender, LBOTE or ATSI status.
In addition, a line graph is provided showing the national, state and school mean scaled scores plotted over time. These means are also displayed numerically in a table at the end of the report.
Example of Five Year Trend Report
This graph plots the mean of the selected outcome for the national, state and school group for each year of NAPLAN.
This table displays the means as a scaled score and includes a count of students in the school group.
These graphs show the national, state and school distribution of results for the selected outcome for each year of NAPLAN.
23NAPLAN 2019 Reporting Guide
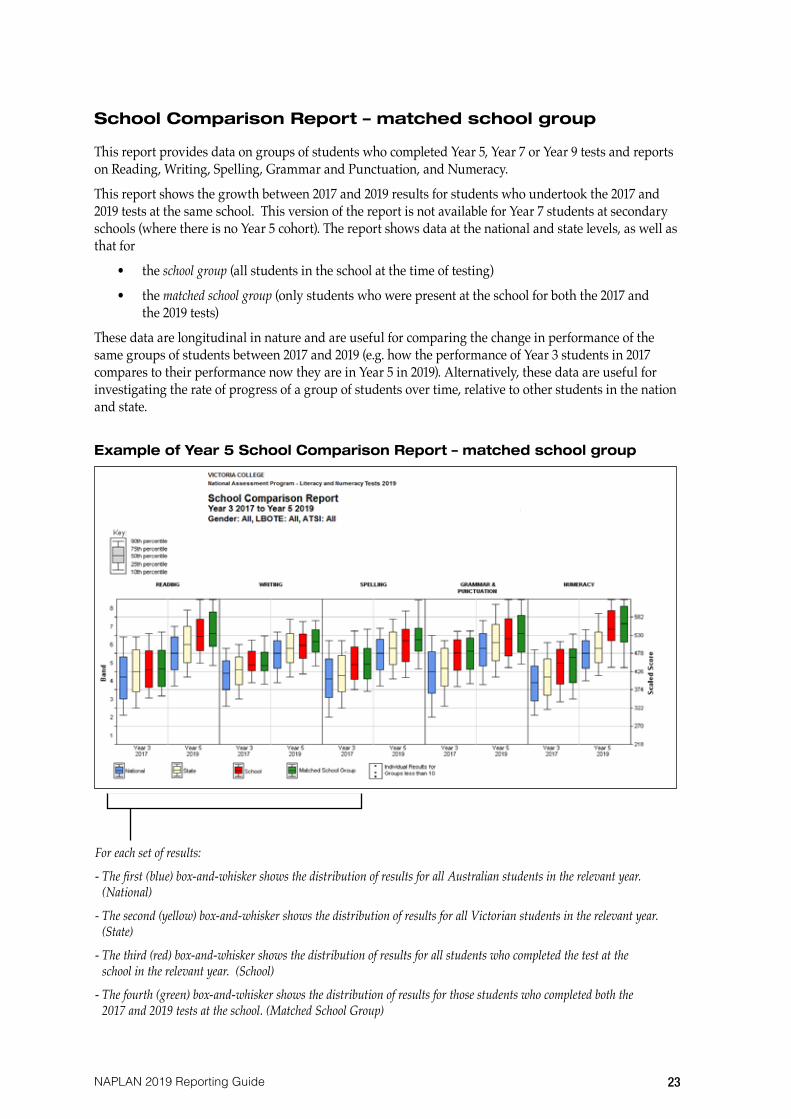
School Comparison Report – matched school group
This report provides data on groups of students who completed Year 5, Year 7 or Year 9 tests and reports on Reading, Writing, Spelling, Grammar and Punctuation, and Numeracy.
This report shows the growth between 2017 and 2019 results for students who undertook the 2017 and 2019 tests at the same school. This version of the report is not available for Year 7 students at secondary schools (where there is no Year 5 cohort). The report shows data at the national and state levels, as well as that for
• the school group (all students in the school at the time of testing)
• the matched school group (only students who were present at the school for both the 2017 and the 2019 tests)
These data are longitudinal in nature and are useful for comparing the change in performance of the same groups of students between 2017 and 2019 (e.g. how the performance of Year 3 students in 2017 compares to their performance now they are in Year 5 in 2019). Alternatively, these data are useful for investigating the rate of progress of a group of students over time, relative to other students in the nation and state.
Example of Year 5 School Comparison Report – matched school group
For each set of results:
- The first (blue) box-and-whisker shows the distribution of results for all Australian students in the relevant year. (National)
- The second (yellow) box-and-whisker shows the distribution of results for all Victorian students in the relevant year. (State)
- The third (red) box-and-whisker shows the distribution of results for all students who completed the test at the school in the relevant year. (School)
- The fourth (green) box-and-whisker shows the distribution of results for those students who completed both the 2017 and 2019 tests at the school. (Matched School Group)

NAPLAN 2019 Reporting Guide 24
School Comparison Report – matched student group The Matched Student Group version of the School Comparison Report is available for all schools with a Year 7 cohort. P-12 schools can also see this version of the report for Year 5 and Year 9 students. This report is similar to the Matched School Group version described above, but contains the following adjustments:
• There is no ‘School’ group (red) for 2017
• The ‘Matched School’ group (green) is replaced by a ‘Matched Student’ group (orange). This is the group of students who sat the 2019 test at the school and who have a 2017 result from this or another school.
Example of Year 7 School Comparison Report
For each set of results:
- The first (blue) box-and-whisker shows the distribution of results for all Australian students in the relevant year. (National)
- The second (yellow) box-and-whisker shows the distribution of results for all Victorian students in the relevant year. (State)
- The third (red) box-and-whisker shows the distribution of results for all students who completed the 2019 test at the school. (School – current year only)
- The fourth (orange) box-and-whisker shows the distribution of results for those students who completed the 2019 tests at the school, and who have a 2017 result from this or another school. (Matched Student Group)

25NAPLAN 2019 Reporting Guide
Scaled score summary table
The scaled score summary table (formerly found at the top of the Student Comparison Report) has been appended to the School Comparison Report, so that schools are still able to view the average scaled score differences between testing periods for national, state, school and (where applicable) matched school or matched student groups. Example of Scaled Score summary table showing Year 3 to Year 5 comparisons
Note: In the Year 7 report for schools with no Year 5 cohort, no 2017 Year 5 ‘School Mean’ is given, and the statistics for the ‘Matched School’ group are replaced with those for the ‘Matched Student’ group.
School-Student Comparison Report
This report provides data on individual students who completed Year 5, Year 7 or Year 9 tests and reports on Reading, Writing, Spelling, Grammar and Punctuation, and Numeracy.
For Year 5 and Year 9, this report shows the achievement levels for an individual student in 2017 and 2019, with respect to the corresponding national, state and school data for those years. The school data provided represents the complete school group (all students at the school at the time of testing).
A School-Student Comparison Report is available for Year 5 to Year 7. For schools that have both Year 5 and Year 7 enrolments, it follows the same format as that described above for Year 5 and Year 9 students. For other secondary schools, the report is the same except that the 2017 Year 5 ‘School’ distributions cannot be provided, and hence the (red) box-and-whiskers for 2017 Year 5 are not shown on the graph for these schools.
These data are useful for determining the change in a student’s performance between 2017 and 2019 (e.g. how the student’s Year 7 performance in 2017 compares to their performance in Year 9 in 2019). These data are also useful for determining a student’s rate of progress over time relative to other students in the national, state or school groups.

NAPLAN 2019 Reporting Guide 26
Example of Year 9 School–Student Comparison Report
For each set of results:
- The first (blue) box-and-whisker shows the distribution of results for all Australian students in the relevant year. (National)
- The second (yellow) box-and-whisker shows the distribution of results for all Victorian students in the relevant year. (State)
- The third (red) box-and-whisker shows the distribution of results for all students who completed the test at the school in the relevant year. (School)
Note: The 2017 Year 5 ‘School’ distribution is not provided for Year 7 students, unless there were Year 5 students enrolled at the school in 2017.
These dots show the result for the nominated student for the tests in Year 7 and Year 9 respectively.

27NAPLAN 2019 Reporting Guide
Relative Growth Report
The Relative Growth Report shows the level of growth for each student relative to similar ability students and enables schools to make more informed judgements about a student’s progress between testing periods. Each student’s level of relative growth is determined by comparing their result to results of Victorian students that had the same NAPLAN score two years ago. If, compared to the current year scores for this group of ‘similar’ students, the student’s current year NAPLAN score is in the:
• highest 25%, their growth is categorised as ‘High’ (Green),
• middle 50%, their growth is categorised as ‘Medium’ (Yellow),
• lowest 25%, their growth is categorised as ‘Low’ (Red).The tabular version of the report shows the scaled score outcomes and relative growth category (high, medium or low) for each student at the school that participated in NAPLAN assessment. The report may be ordered by students’ prior or current scores, or by student name, and may be viewed at a class or school level. A link is provided at the top of the report to a document containing further details about this report and some examples of how it may be used and interpreted. Example of Year 7 Relative Growth Report - tabular format
Link to Reference document
For a given student, ‘similar students’ are those Victorian students that had the same NAPLAN score in 2017.

NAPLAN 2019 Reporting Guide 28
The graphical version of the report provides a summary of these relative growth levels, and also displays them with respect to achievement levels from two years prior.
Example of Year 7 Relative Growth Report - graphical format
29NAPLAN 2019 Reporting Guide
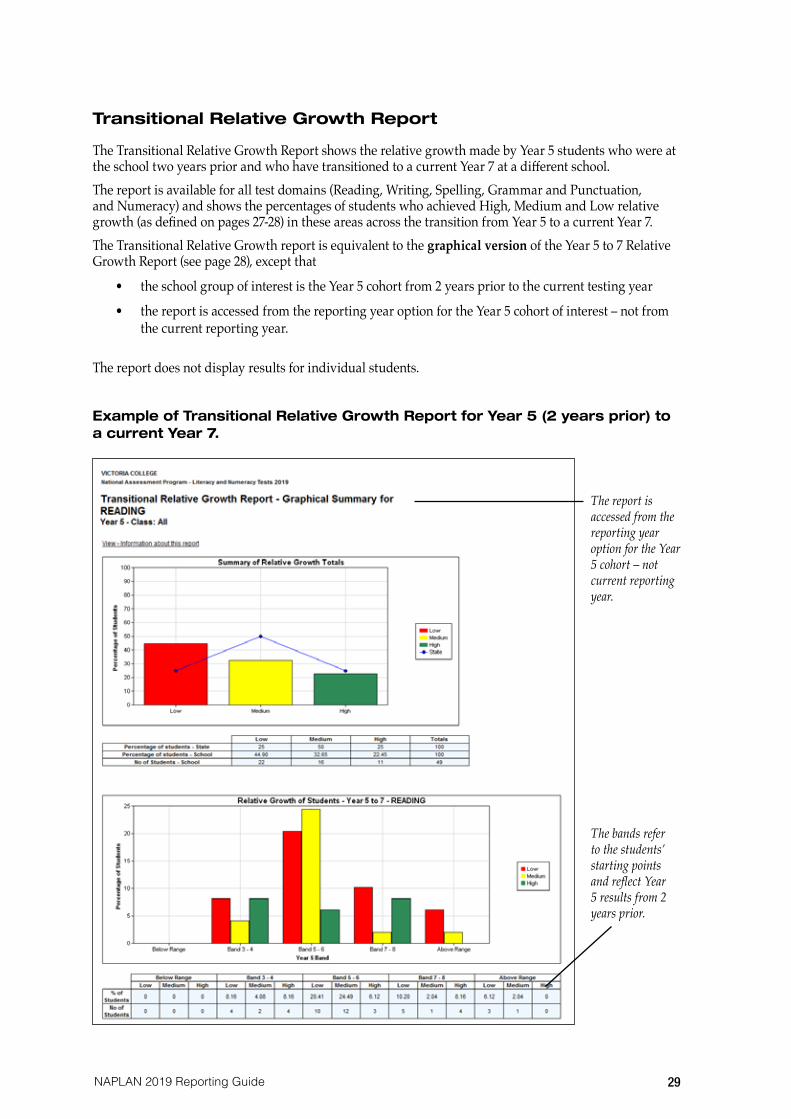
Transitional Relative Growth Report
The Transitional Relative Growth Report shows the relative growth made by Year 5 students who were at the school two years prior and who have transitioned to a current Year 7 at a different school. The report is available for all test domains (Reading, Writing, Spelling, Grammar and Punctuation, and Numeracy) and shows the percentages of students who achieved High, Medium and Low relative growth (as defined on pages 27-28) in these areas across the transition from Year 5 to a current Year 7.The Transitional Relative Growth report is equivalent to the graphical version of the Year 5 to 7 Relative Growth Report (see page 28), except that
• the school group of interest is the Year 5 cohort from 2 years prior to the current testing year
• the report is accessed from the reporting year option for the Year 5 cohort of interest – not from the current reporting year.
The report does not display results for individual students.
Example of Transitional Relative Growth Report for Year 5 (2 years prior) to a current Year 7.
The report is accessed from the reporting year option for the Year 5 cohort – not current reporting year.
The bands refer to the students’ starting points and reflect Year 5 results from 2 years prior.

NAPLAN 2019 Reporting Guide 30
Section 3: Interpretation of ResultsAll reports in the NAPLAN Data Service are provided using the National Assessment Program scale.
NAPLAN results between 2008 and 2019 are based on the scaled scores which form the numeric continuum from which the ten national reporting bands are derived. (See pages 2-3 for further information on scaled scores and national reporting bands.) Reports showing national, state, school or subgroup distributions are generally presented as box-and-whisker graphs and referenced to the national reporting bands. The underlying summary statistics which generate these graphs are displayed, where appropriate, as scaled scores.
Scaled scores can be directly compared across time within any given assessment area. However, comparison of scaled scores across different assessment areas is not meaningful and is not recommended.
The national data used in the NAPLAN Data Service has been drawn from a large, scientifically constructed sample of results from across Australia. Graphs and tables for state data use results from the full Victorian testing cohorts of over 70,000 students at each of Years 3, 5, 7 and 9, spread across approximately 2,300 primary and secondary schools.
Making comparisons
A number of factors should be taken into account when making comparisons using school, subgroup or individual student data. In particular, schools should consider:
• the size of the group• the size of the difference between groups.
School and subgroup comparisons
Group level achievement data is more stable and more reliable when it is based on large groups. In general, the larger the group, the more reliably representative the data will be. For example, the national and state data presented in the Data Service has been based on very large numbers of students and will accurately reflect general achievement across Australia and Victoria respectively. With the exception of very small schools, school level data is also generally reliable, and meaningful comparisons may be made between the school performances and those of the state or the nation.
For schools with very small student numbers, care must be taken when making such comparisons as the difference may simply reflect the normal variation that occurs whenever student performance is measured. Similarly, in drawing conclusions about subgroup or class differences, consideration must be given to the size of the group. Group level results for a group with fewer than ten students cannot be used to provide accurate or meaningful comparisons.
The data for a complete Five Year Trend Data Report has been supplied, allowing schools to compare results for 2015, 2016, 2017, 2018 and 2019.
As with school or subgroup comparisons made within a testing year, the validity of comparisons made over time will depend on both the size of the group and the size of the observed differences between groups.
If observed differences between groups are large, schools can be confident that they reflect a true disparity. Small differences may occur just by chance, especially when the groups are relatively small. Even for large groups, very small differences are unlikely to be of great practical significance, unless they form a consistent pattern over time.

31NAPLAN 2019 Reporting Guide
Individual comparisons and improvement
NAPLAN consists of a number of single point-in-time tests designed to complement and confirm other classroom assessments, and should generally provide a very good indication of student ability at an individual level. However, occasional anomalies will occur, and if the test results for an individual student vary considerably from teacher expectations, teachers are encouraged to investigate the performance more closely. It is possible, for example, that the student was unwell on the day of the test and did not perform to the best of his or her ability.
For students in Year 5, Year 7 or Year 9 in 2019 it is possible to compare current NAPLAN results with those from Year 3, Year 5 or Year 7 in 2017. This can be done either by:
• looking at the results for a selected student in any test area (Reading, Writing, Spelling, Grammar and Punctuation or Numeracy) with respect to national, state and school outcomes, and noting any shift in relative performance. (School-Student Comparison Report)
• comparing the relative growth from 2017 to 2019 for a selected student in any test area and noting whether this is classified as ‘high’, ‘medium’ or ‘low’ with respect to gains made by similar students. (Relative Growth Report).
Both the relative position of a student’s outcome with respect to national, state or school results, and his or her relative growth categorisation, enable schools to make more informed judgements about the student’s progress than can be achieved by just looking at the scaled score differences between testing periods. This is because scaled score differences vary greatly depending on the student’s starting point from two years prior. It must still be remembered however, that individual results are subject to a greater degree of variation than those for larger groups of students, and that, as noted above, anomalies at the individual level will occasionally occur.

NAPLAN 2019 Reporting Guide 32
Section 4: Individual Student ReportsAn Individual Student Report is provided for the parents for each student who undertook the Years 3, 5, 7 or 9 tests.
The format of the Individual Student Reports is the same for all states and territories and has been set nationally for reporting student achievement results to parents for NAPLAN in 2019.
Each Individual Student Report will include:
• student and school details• information about the NAPLAN tests• a ‘How to read the student report’ section • a pictorial example • individual student’s achievement results for Reading, Writing, Language Conventions (Spelling,
Grammar and Punctuation) and Numeracy on the National Assessment Program scale• an indicator for each assessment area that shows the national average and the middle 60% of
national results• a written description for each assessment area identifying the types of skills assessed • a ‘Summary of Skills and Understandings Assessed’ table describing what students are likely to
demonstrate in each of the bands.

33NAPLAN 2019 Reporting Guide
Sample page 1 of the Individual Student Report
Student report 2019
This report shows the results for How to read the student report
Student report 2019National Assessment Program —
Literacy and Numeracy
Year
7
Year
7
Band
Summary of skills assessedThe skills described in the following table represent those typically assessed in NAPLAN tests for Year 7 students. These skills increase in difficulty from the lowest to the highest band. A student achieving a result in a particular band is likely to have correctly answered questions involving skills in that band and in each band below it.
9
8
7
6
5
4
Reading Writing Language Conventions NumeracyProcesses and interprets ideas that are implicit in a range of complex narrative and informative texts. Analyses and evaluates evidence in persuasive texts and identifies language features to infer an author’s intended purpose and audience.
Incorporates elaborated ideas that reflect a worldwide view of the topic. Makes consistently precise word choices that engage or persuade the reader and enhance the writer’s point of view.Punctuates sentence beginnings and endings correctly and uses other complex punctuation correctly most of the time. Shows control and variety in paragraph construction to pace and direct the reader’s attention.
Identifies errors and correctly spells words with difficult spelling patterns (miniature, severely, technological ).Demonstrates knowledge of grammar and punctuation conventions in more complex texts, such as the correct use of possessive pronouns (its).
Solves complex reasoning problems. Uses square roots and powers. Evaluates algebraic expressions and solves equations and inequalities using substitution. Interprets simple linear graphs. Interrogates data and finds measures of centre. Calculates elapsed time across time zones. Determines angle size, area and volume of polygons and diameter and circumference of circles. Recognises congruence and uses similarity in regular shapes.
Interprets ideas and processes information in a range of complex texts. Understands how character traits and behaviours are used to develop stereotypes. Analyses and interprets persuasive texts to infer a specific purpose and audience. Uses the context to interpret vocabulary specific to a text or topic.
Writes a cohesive text that begins to engage or persuade the reader. Makes deliberate and appropriate word choices to create a rational or emotional response.Attempts to reveal attitudes and values and to develop a relationship with the reader. Constructs most complex sentences correctly. Spells most words, including many difficult words, correctly.
Identifies errors and correctly spells most words with difficult spelling patterns (echoes, principle, angrily, encouraged ).Demonstrates knowledge of grammar and punctuation conventions in more complex texts, such as appropriate sentence structure, the correct use of pronouns, pairs of conjunctions (neither, nor), forms of adverbs (more deeply), complex verb forms and quotation marks for effect.
Solves non-routine problems and compares common fractions, decimals and percentages. Continues linear patterns and identifies non-linear rules. Solves perimeter and area problems. Determines probabilities of outcomes of experiments. Classifies triangles and uses their properties. Identifies transformations of shapes and visualises changes to 3D objects. Determines direction using compass points and angles of turn.
Applies knowledge and understanding of different text types to process ideas, draw conclusions and infer themes and purpose. Identifies details that connect implied ideas across and within texts including character motivation in narrative texts, the writer’s values in persuasive texts and the main ideas in informative texts.
Develops ideas through language choices and effective textual features.Joins and orders ideas using connecting words and maintains clear meaning throughout the text.Correctly spells most common words and some difficult words, including words with less common spelling patterns and silent letters.
Identifies errors and correctly spells words with common spelling patterns and some words with difficult spelling patterns (temporary, ineffective, excellent, circulated ). Demonstrates knowledge of grammar and punctuation conventions in more complex texts, such as the correct use of compound verbs (could have), apostrophes for possession (nobody’s) and quotation marks for speech.
Solves multi-step problems involving relational reasoning. Calculates missing values in equations. Interprets rules and patterns and completes simple inequalities. Finds perimeters and areas of composite shapes. Calculates elapsed times across midday and midnight. Expresses probability as a fraction. Compares and classifies angles and solves problems involving nets. Uses scale to determine distance on maps.
Makes meaning from a range of text types of increasing difficulty and understands different text structures. Recognises the purpose of general text features such as titles and subheadings. Makes inferences by connecting ideas across different parts of texts. Interprets figurative language and identifies the main differences between characters in narrative texts.
Organises a text using paragraphs with related ideas. Uses some effective text features and accurate words or groups of words when developing ideas.Punctuates nearly all sentences correctly with capitals, full stops, exclamation marks and question marks.Correctly uses more complex punctuation markers some of the time.
Identifies errors and correctly spells most words with common spelling patterns (soldiers, address, meant, activity).Demonstrates knowledge of grammar and punctuation conventions in more complex texts, such as appropriate and clear sentence structure and the correct use of varied conjunctions (whether ).
Solves multi-step problems including those involving directed numbers, decimals, fractions and percentages. Continues patterns to higher terms. Finds unknowns in simple equations. Converts between familiar units of measure. Calculates durations of events. Interprets and uses data from a variety of displays. Recognises nets of familiar 3D objects and symmetry in irregular shapes. Interprets maps using scales, legends and coordinate systems.
Uses clearly stated information in familiar text types to draw some conclusions and inferences. Draws conclusions about a character in narrative texts. Connects and sequences ideas in longer informative texts and identifies opinions in persuasive texts.
Structures a text with a beginning, complication and resolution; or with an introduction, body and conclusion. Includes enough supporting detail for the text to be easily understood by the reader, although the conclusion or resolution may be weak or simple. Correctly structures most simple and compound sentences and some complex sentences.
Identifies errors and correctly spells one- and two-syllable words with common spelling patterns (grown, drafting, message).Recognises grammar and punctuation conventions in standard sentences and speech, such as the correct use of verb forms, synonyms, connecting words (however ), brackets and apostrophes for contractions (he’s).
Solves routine problems using a range of strategies. Demonstrates knowledge of fractions and decimals to hundredths. Continues number and spatial patterns. Uses familiar measures to estimate, calculate and compare area or volume. Reads graduated scales. Compares likelihood of outcomes in chance events. Recognises the effect of transformations on 2D shapes. Uses compass points and angles of turn to interpret maps.
Locates clearly stated information in narrative and informative texts to connect ideas and make inferences.Identifies the meaning of some unfamiliar words from their context and finds key information in longer texts including those with tables and diagrams.
Writes a text in which characters or setting are briefly described; or in which ideas on topics are briefly elaborated.Correctly punctuates some sentences with both capital letters and full stops. May demonstrate correct use of capitals for names and some other punctuation.Correctly spells most common words.
Identifies errors and correctly spells some one- and two-syllable words with common spelling patterns.Recognises grammar and punctuation conventions in standard sentences and speech, such as consistency within sentences, the correct use of verb forms and appropriate order of phrases.
Solves problems involving unit fractions, combinations of addition and subtraction of two-digit numbers and number facts to 10 x 10. Identifies division as the inverse of multiplication. Interprets timetables and calendars and reads time on clocks to the quarter hour. Locates information in tables and graphs. Recognises familiar 2D shapes after a transformation and identifies a line of symmetry. Visualises 3D objects from different viewpoints.
A student’s result is shown on an achievement scale for each assessment area. Results across the Years 3, 5, 7 and 9 literacy and numeracy assessments are reported on a scale from Band 1 to Band 10.
The achievement scale represents increasing levels of knowledge, understanding and skills demonstrated in the assessments. Results for Year 7 are reported across the range of Band 4 to Band 9, with Band 5 representing the national minimum standard for this year level.
The national average and the range of achievement for Year 7 students are also shown on the scale.
Your child’s results are shown on the inside pages of this report.
In May 2019, national literacy and numeracy assessments were administered to students in Years 3, 5, 7 and 9 throughout Australia. This report shows your child’s achievement in those assessments.
These assessments provide a snapshot of your child’s achievement at a point in time. The information contained in this report should be considered together with school-based assessments and reports.
NAPLAN is moving from a paper test to an online test to provide more accurate and precise information about what students know and can do. This means that during this period some students take NAPLAN on paper, while others sit the tests online.
For the 2019 transition year, the online test results were equated with the pen-and-paper tests. Results for both the tests are reported on the same NAPLAN assessment scale.
NAPLAN results, however, should always be interpreted with care. This is particularly the case this year for some students who experienced disruptions due to connectivity issues. Your child’s teacher will have the best insight into your child’s educational progress.
Literacy assessmentThe literacy assessments measured student achievement in reading, writing and language conventions.
ReadingStudents were required to read a range of texts similar to those used in Year 7 classrooms and answer questions of varying difficulty to show their understanding of the material.
WritingStudents were instructed to respond to a writing prompt. This writing task required students to generate and organise ideas and demonstrate their skills in vocabulary use, sentence structure, spelling and punctuation.
Language ConventionsStudents were required to identify and correct spelling errors and answer questions on aspects of grammar and punctuation.
Numeracy assessmentThe numeracy assessment measured student achievement across number and algebra; measurement and geometry; and statistics and probability. Questions required students to apply mathematical knowledge, skills and understanding in a variety of contexts.
Band 9
Band 8
Band 7
Band 6
Band 5
Band 4
If a student’s result is here, it means the result is well above the expected level of achievement for Year 7 students.
Year 7 students with results in Band 4 are below the national minimum standard.
The lightly shaded area shows the range of achievement for the middle 60% of Year 7 students in Australia.
The triangle shows the national average for Year 7 students.
The dot shows an individual student’s result.

NAPLAN 2019 Reporting Guide 34
NAPLAN Data Service Reports
The NAPLAN Data Service Reports can be used to supplement information in the Individual Student Reports. Teachers are advised to become familiar with the content of the reports so they can answer parents’ questions about particular aspects of their children’s results.
Confidentiality of results
When discussing Individual Student Reports with parents, teachers should point out that the information about each child is confidential to the child’s parents, the teacher and the school.
Distribution of Individual Student Reports
It is important that teachers be fully informed of the detailed results of each student and of the results for their class as a whole, and that parents have the opportunity to discuss the results with the school.
The results sent to the school provide detailed information about the achievement of each student.
This information can be used to place the NAPLAN Student Reports in a wider context that enables strategies and suggestions for learning improvement to be discussed with parents.
Parental interest in NAPLAN results is very high and it is essential that Individual Student Reports are delivered as soon as possible after their arrival at the school. Individual Student Reports are confidential documents that contain personal information about each student and, given the need for confidentiality, the VCAA asks all schools to consider a direct mail out to parents or to issue the reports directly, through, for example, an information night or by collection from the school by parents.
Schools should retain evidence of distribution of reports to parents at the school, for example, a letter addressed to parents or notification in the school newsletter, and schools are strongly advised to make a copy of each report and retain it at the school.
Replacement of Individual Student Reports
The VCAA provides only one set of Student Reports to the school for distribution. Schools may photocopy the printed report sent to the school or access a similar report through the NAPLAN Data Service (see the Student Achievement Level Report on page 20).
Individual Student Reports which carry an incorrect name as a result of incorrect information provided by the school may be replaced on request.
Queries about Individual Student Reports
Parents who contact the VCAA with queries about their child’s report will, in most circumstances, be referred to the school. If the school has queries about results for particular students, it should contact the NAPLAN Helpdesk on freecall 1800 648 637 or email: [email protected]
35NAPLAN 2019 Reporting Guide
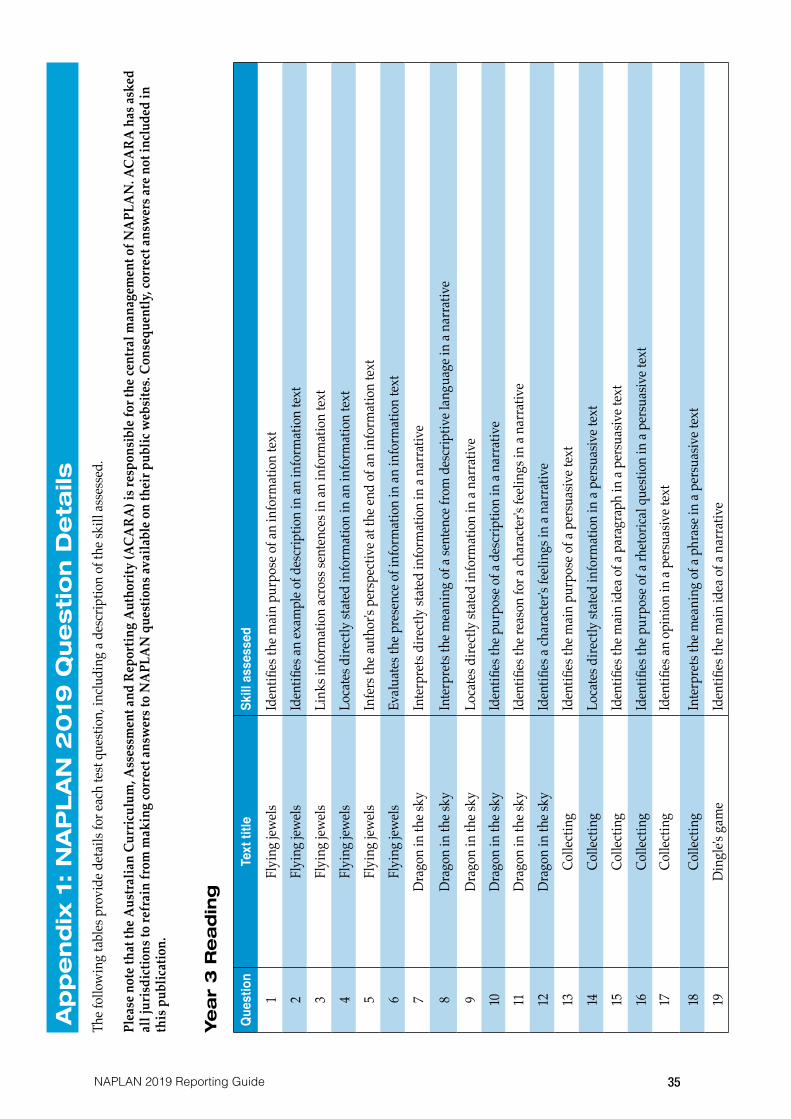
Ap
pe
nd
ix 1
: N
AP
LA
N 2
019
Qu
esti
on
De
tails
The f
ollo
win
g ta
bles
pro
vide
det
ails
for e
ach
test
ques
tion,
inclu
ding
a de
scrip
tion
of th
e ski
ll as
sess
ed.
Plea
se n
ote t
hat t
he A
ustra
lian
Curr
icul
um, A
sses
smen
t and
Rep
ortin
g A
utho
rity
(ACA
RA) i
s res
pons
ible
for t
he ce
ntra
l man
agem
ent o
f NA
PLA
N. A
CARA
has
ask
ed
all j
uris
dict
ions
to re
frai
n fr
om m
akin
g co
rrec
t ans
wer
s to
NA
PLA
N q
uest
ions
avai
labl
e on
thei
r pub
lic w
ebsi
tes.
Cons
eque
ntly
, cor
rect
ans
wer
s are
not
incl
uded
in
this
pub
licat
ion.
Ye
ar
3 R
ea
din
g
Ques
tion
Text
title
Skill
ass
esse
d
1Fl
ying
jew
els
Iden
tifies
the m
ain
purp
ose o
f an
info
rmat
ion
text
2Fl
ying
jew
els
Iden
tifies
an ex
ampl
e of d
escr
iptio
n in
an in
form
atio
n te
xt
3Fl
ying
jew
els
Link
s inf
orm
atio
n ac
ross
sent
ence
s in
an in
form
atio
n te
xt
4Fl
ying
jew
els
Loca
tes d
irect
ly st
ated
info
rmat
ion
in an
info
rmat
ion
text
5Fl
ying
jew
els
Infe
rs th
e aut
hor's
per
spec
tive a
t the
end
of an
info
rmat
ion
text
6Fl
ying
jew
els
Eval
uate
s the
pre
senc
e of i
nfor
mat
ion
in an
info
rmat
ion
text
7D
rago
n in
the s
kyIn
terp
rets
dire
ctly
stat
ed in
form
atio
n in
a na
rrat
ive
8D
rago
n in
the s
kyIn
terp
rets
the m
eani
ng o
f a se
nten
ce fr
om d
escr
iptiv
e lan
guag
e in
a nar
rativ
e
9D
rago
n in
the s
kyLo
cate
s dire
ctly
stat
ed in
form
atio
n in
a na
rrat
ive
10D
rago
n in
the s
kyId
entifi
es th
e pur
pose
of a
des
crip
tion
in a
narr
ativ
e11
Dra
gon
in th
e sky
Iden
tifies
the r
easo
n fo
r a ch
arac
ter's
feel
ings
in a
narr
ativ
e
12D
rago
n in
the s
kyId
entifi
es a
char
acte
r's fe
elin
gs in
a na
rrat
ive
13Co
llect
ing
Iden
tifies
the m
ain
purp
ose o
f a p
ersu
asiv
e tex
t
14Co
llect
ing
Loca
tes d
irect
ly st
ated
info
rmat
ion
in a
pers
uasiv
e tex
t
15Co
llect
ing
Iden
tifies
the m
ain
idea
of a
par
agra
ph in
a pe
rsua
sive t
ext
16Co
llect
ing
Iden
tifies
the p
urpo
se o
f a rh
etor
ical q
uesti
on in
a pe
rsua
sive t
ext
17Co
llect
ing
Iden
tifies
an o
pini
on in
a pe
rsua
sive t
ext
18Co
llect
ing
Inte
rpre
ts th
e mea
ning
of a
phr
ase i
n a p
ersu
asiv
e tex
t
19D
ingl
e's g
ame
Iden
tifies
the m
ain
idea
of a
nar
rativ
e

36 NAPLAN 2019 Reporting Guide
20D
ingl
e's g
ame
Iden
tifies
the p
urpo
se o
f the
ope
ning
par
agra
ph in
a na
rrat
ive
21D
ingl
e's g
ame
Inte
rpre
ts th
e mea
ning
of a
sim
ile in
a na
rrat
ive
22D
ingl
e's g
ame
Inte
rpre
ts th
e mea
ning
of a
phr
ase i
n co
ntex
t in
a nar
rativ
e
23D
ingl
e's g
ame
Iden
tifies
the p
urpo
se o
f ita
licise
d te
xt in
a na
rrat
ive
24D
ingl
e's g
ame
Inte
rpre
ts in
form
atio
n in
a na
rrat
ive
25D
ingl
e's g
ame
Iden
tifies
an ex
ampl
e of d
escr
iptio
n in
a na
rrat
ive
26W
elcom
e to
the C
ape L
ight
hous
eIn
terp
rets
dire
ctly
stat
ed in
form
atio
n in
a pe
rsua
sive t
ext
27W
elcom
e to
the C
ape L
ight
hous
eLi
nks i
nfor
mat
ion
acro
ss se
nten
ces i
n a p
ersu
asiv
e tex
t
28W
elcom
e to
the C
ape L
ight
hous
eIn
terp
rets
dire
ctly
stat
ed in
form
atio
n in
a pe
rsua
sive t
ext
29W
elcom
e to
the C
ape L
ight
hous
eId
entifi
es a
pers
uasiv
e dev
ice in
a pe
rsua
sive t
ext
30W
elcom
e to
the C
ape L
ight
hous
eIn
terp
rets
the m
eani
ng o
f a d
escr
iptio
n in
a pe
rsua
sive t
ext
31W
elcom
e to
the C
ape L
ight
hous
eIn
terp
rets
the m
eani
ng o
f a p
hras
e fro
m co
ntex
t in
a per
suas
ive t
ext
32Sp
acem
an Y
uri
Iden
tifies
the m
ain
idea
of a
par
agra
ph in
an in
form
atio
n te
xt
33Sp
acem
an Y
uri
Infe
rs th
e rea
son
for a
n ev
ent i
n an
info
rmat
ion
text
34Sp
acem
an Y
uri
Ana
lyse
s the
impa
ct o
f an
even
t in
an in
form
atio
n te
xt
35Sp
acem
an Y
uri
Inte
rpre
ts di
rect
ly st
ated
info
rmat
ion
in an
info
rmat
ion
text
36Sp
acem
an Y
uri
Inte
rpre
ts th
e sig
nific
ance
of a
n ev
ent i
n an
info
rmat
ion
text
37Sp
acem
an Y
uri
Inte
rpre
ts di
rect
ly st
ated
info
rmat
ion
in an
info
rmat
ion
text

37NAPLAN 2019 Reporting Guide
Ye
ar
5 R
ea
din
g
Ques
tion
Text
title
Skill
ass
esse
d
1H
ow to
look
afte
r you
r gui
nea p
igId
entifi
es th
e mai
n pu
rpos
e of a
n in
form
atio
n te
xt
2H
ow to
look
afte
r you
r gui
nea p
igIn
terp
rets
dire
ctly
stat
ed in
form
atio
n in
an in
form
atio
n te
xt
3H
ow to
look
afte
r you
r gui
nea p
igLo
cate
s dire
ctly
stat
ed in
form
atio
n in
an in
form
atio
n te
xt
4H
ow to
look
afte
r you
r gui
nea p
igSu
mm
arise
s inf
orm
atio
n in
a se
ctio
n of
an in
form
atio
n te
xt
5H
ow to
look
afte
r you
r gui
nea p
igId
entifi
es th
e pur
pose
of a
sent
ence
in an
info
rmat
ion
text
6H
ow to
look
afte
r you
r gui
nea p
igA
naly
ses t
he eff
ect o
f voc
abul
ary
choi
ces i
n an
info
rmat
ion
text
7D
ingl
e's g
ame
Iden
tifies
the m
ain
idea
of a
nar
rativ
e
8D
ingl
e's g
ame
Iden
tifies
the p
urpo
se o
f the
ope
ning
par
agra
ph in
a na
rrat
ive
9D
ingl
e's g
ame
Inte
rpre
ts th
e mea
ning
of a
sim
ile in
a na
rrat
ive
10D
ingl
e's g
ame
Inte
rpre
ts th
e mea
ning
of a
phr
ase i
n co
ntex
t in
a nar
rativ
e
11D
ingl
e's g
ame
Iden
tifies
the p
urpo
se o
f ita
licise
d te
xt in
a na
rrat
ive
12D
ingl
e's g
ame
Inte
rpre
ts in
form
atio
n in
a na
rrat
ive
13D
ingl
e's g
ame
Iden
tifies
an ex
ampl
e of d
escr
iptio
n in
a na
rrat
ive
14W
elcom
e to
the C
ape L
ight
hous
eIn
terp
rets
dire
ctly
stat
ed in
form
atio
n in
a pe
rsua
sive t
ext
15W
elcom
e to
the C
ape L
ight
hous
eLi
nks i
nfor
mat
ion
acro
ss se
nten
ces i
n a p
ersu
asiv
e tex
t
16W
elcom
e to
the C
ape L
ight
hous
eIn
terp
rets
dire
ctly
stat
ed in
form
atio
n in
a pe
rsua
sive t
ext
17W
elcom
e to
the C
ape L
ight
hous
eId
entifi
es a
pers
uasiv
e dev
ice in
a pe
rsua
sive t
ext
18W
elcom
e to
the C
ape L
ight
hous
eIn
terp
rets
the m
eani
ng o
f a d
escr
iptio
n in
a pe
rsua
sive t
ext
19W
elcom
e to
the C
ape L
ight
hous
eIn
terp
rets
the m
eani
ng o
f a p
hras
e fro
m co
ntex
t in
a per
suas
ive t
ext
20W
elcom
e to
the C
ape L
ight
hous
eEv
alua
tes t
he p
rese
nce o
f inf
orm
atio
n in
a se
ctio
n of
a pe
rsua
sive t
ext
21W
elcom
e to
the C
ape L
ight
hous
eEv
alua
tes t
he ac
cura
cy o
f sta
tem
ents
usin
g in
form
atio
n fro
m a
pers
uasiv
e tex
t
22Lo
st!Se
quen
ces t
he o
rder
of e
vent
s in
a nar
rativ
e
23Lo
st!In
terp
rets
the m
eani
ng o
f voc
abul
ary
in co
ntex
t in
a nar
rativ
e
24Lo
st!Id
entifi
es th
e rea
son
for c
hara
cter
s' ac
tions
in a
narr
ativ
e
25Lo
st!Id
entifi
es th
e effe
ct o
f per
soni
ficat
ion
in a
narr
ativ
e
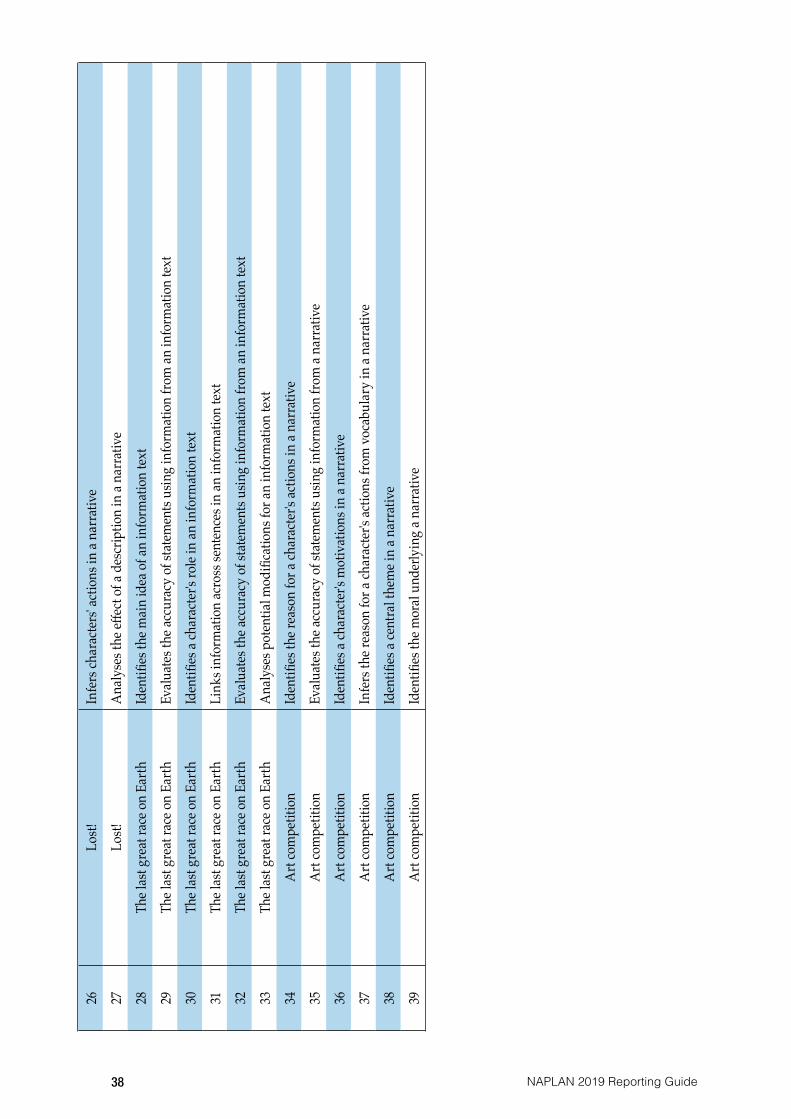
38 NAPLAN 2019 Reporting Guide
26Lo
st!In
fers
char
acte
rs' a
ctio
ns in
a na
rrat
ive
27Lo
st!A
naly
ses t
he eff
ect o
f a d
escr
iptio
n in
a na
rrat
ive
28Th
e las
t gre
at ra
ce o
n Ea
rthId
entifi
es th
e mai
n id
ea o
f an
info
rmat
ion
text
29Th
e las
t gre
at ra
ce o
n Ea
rthEv
alua
tes t
he ac
cura
cy o
f sta
tem
ents
usin
g in
form
atio
n fro
m an
info
rmat
ion
text
30Th
e las
t gre
at ra
ce o
n Ea
rthId
entifi
es a
char
acte
r's ro
le in
an in
form
atio
n te
xt
31Th
e las
t gre
at ra
ce o
n Ea
rthLi
nks i
nfor
mat
ion
acro
ss se
nten
ces i
n an
info
rmat
ion
text
32Th
e las
t gre
at ra
ce o
n Ea
rthEv
alua
tes t
he ac
cura
cy o
f sta
tem
ents
usin
g in
form
atio
n fro
m an
info
rmat
ion
text
33Th
e las
t gre
at ra
ce o
n Ea
rthA
naly
ses p
oten
tial m
odifi
catio
ns fo
r an
info
rmat
ion
text
34A
rt co
mpe
titio
nId
entifi
es th
e rea
son
for a
char
acte
r's ac
tions
in a
narr
ativ
e
35A
rt co
mpe
titio
nEv
alua
tes t
he ac
cura
cy o
f sta
tem
ents
usin
g in
form
atio
n fro
m a
narr
ativ
e
36A
rt co
mpe
titio
nId
entifi
es a
char
acte
r's m
otiv
atio
ns in
a na
rrat
ive
37A
rt co
mpe
titio
nIn
fers
the r
easo
n fo
r a ch
arac
ter's
actio
ns fr
om v
ocab
ular
y in
a na
rrat
ive
38A
rt co
mpe
titio
nId
entifi
es a
cent
ral t
hem
e in
a nar
rativ
e
39A
rt co
mpe
titio
nId
entifi
es th
e mor
al u
nder
lyin
g a n
arra
tive
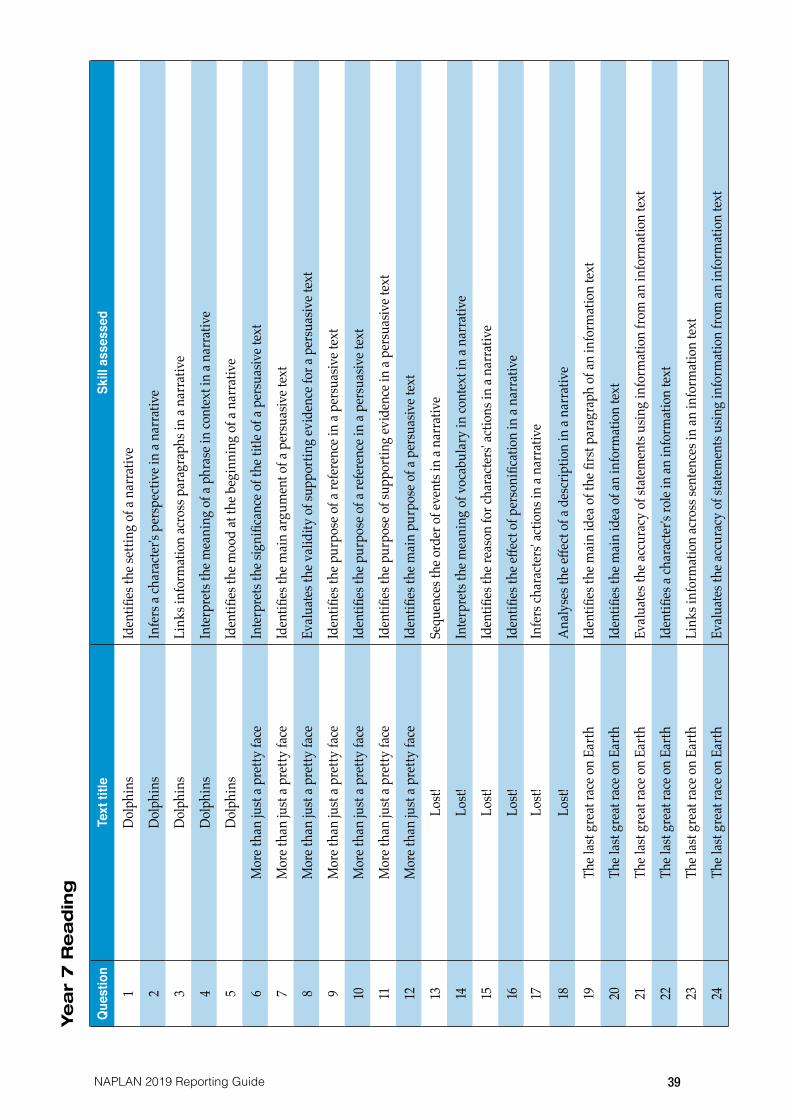
39NAPLAN 2019 Reporting Guide
Ye
ar
7 R
ea
din
g
Ques
tion
Text
title
Skill
ass
esse
d
1Do
lphi
nsId
entifi
es th
e set
ting
of a
narr
ativ
e
2Do
lphi
nsIn
fers
a ch
arac
ter's
per
spec
tive i
n a n
arra
tive
3Do
lphi
nsLi
nks i
nfor
mat
ion
acro
ss p
arag
raph
s in
a nar
rativ
e
4Do
lphi
nsIn
terp
rets
the m
eani
ng o
f a p
hras
e in
cont
ext i
n a n
arra
tive
5Do
lphi
nsId
entifi
es th
e moo
d at
the b
egin
ning
of a
nar
rativ
e
6M
ore t
han
just
a pre
tty fa
ceIn
terp
rets
the s
igni
fican
ce o
f the
title
of a
per
suas
ive t
ext
7M
ore t
han
just
a pre
tty fa
ceId
entifi
es th
e mai
n ar
gum
ent o
f a p
ersu
asiv
e tex
t
8M
ore t
han
just
a pre
tty fa
ceEv
alua
tes t
he v
alid
ity o
f sup
porti
ng ev
iden
ce fo
r a p
ersu
asiv
e tex
t
9M
ore t
han
just
a pre
tty fa
ceId
entifi
es th
e pur
pose
of a
refe
renc
e in
a per
suas
ive t
ext
10M
ore t
han
just
a pre
tty fa
ceId
entifi
es th
e pur
pose
of a
refe
renc
e in
a per
suas
ive t
ext
11M
ore t
han
just
a pre
tty fa
ceId
entifi
es th
e pur
pose
of s
uppo
rting
evid
ence
in a
pers
uasiv
e tex
t
12M
ore t
han
just
a pre
tty fa
ceId
entifi
es th
e mai
n pu
rpos
e of a
per
suas
ive t
ext
13Lo
st!Se
quen
ces t
he o
rder
of e
vent
s in
a nar
rativ
e
14Lo
st!In
terp
rets
the m
eani
ng o
f voc
abul
ary
in co
ntex
t in
a nar
rativ
e
15Lo
st!Id
entifi
es th
e rea
son
for c
hara
cter
s' ac
tions
in a
narr
ativ
e
16Lo
st!Id
entifi
es th
e effe
ct o
f per
soni
ficat
ion
in a
narr
ativ
e17
Lost!
Infe
rs ch
arac
ters
' act
ions
in a
narr
ativ
e
18Lo
st!A
naly
ses t
he eff
ect o
f a d
escr
iptio
n in
a na
rrat
ive
19Th
e las
t gre
at ra
ce o
n Ea
rthId
entifi
es th
e mai
n id
ea o
f the
firs
t par
agra
ph o
f an
info
rmat
ion
text
20Th
e las
t gre
at ra
ce o
n Ea
rthId
entifi
es th
e mai
n id
ea o
f an
info
rmat
ion
text
21Th
e las
t gre
at ra
ce o
n Ea
rthEv
alua
tes t
he ac
cura
cy o
f sta
tem
ents
usin
g in
form
atio
n fro
m an
info
rmat
ion
text
22Th
e las
t gre
at ra
ce o
n Ea
rthId
entifi
es a
char
acte
r's ro
le in
an in
form
atio
n te
xt
23Th
e las
t gre
at ra
ce o
n Ea
rthLi
nks i
nfor
mat
ion
acro
ss se
nten
ces i
n an
info
rmat
ion
text
24Th
e las
t gre
at ra
ce o
n Ea
rthEv
alua
tes t
he ac
cura
cy o
f sta
tem
ents
usin
g in
form
atio
n fro
m an
info
rmat
ion
text
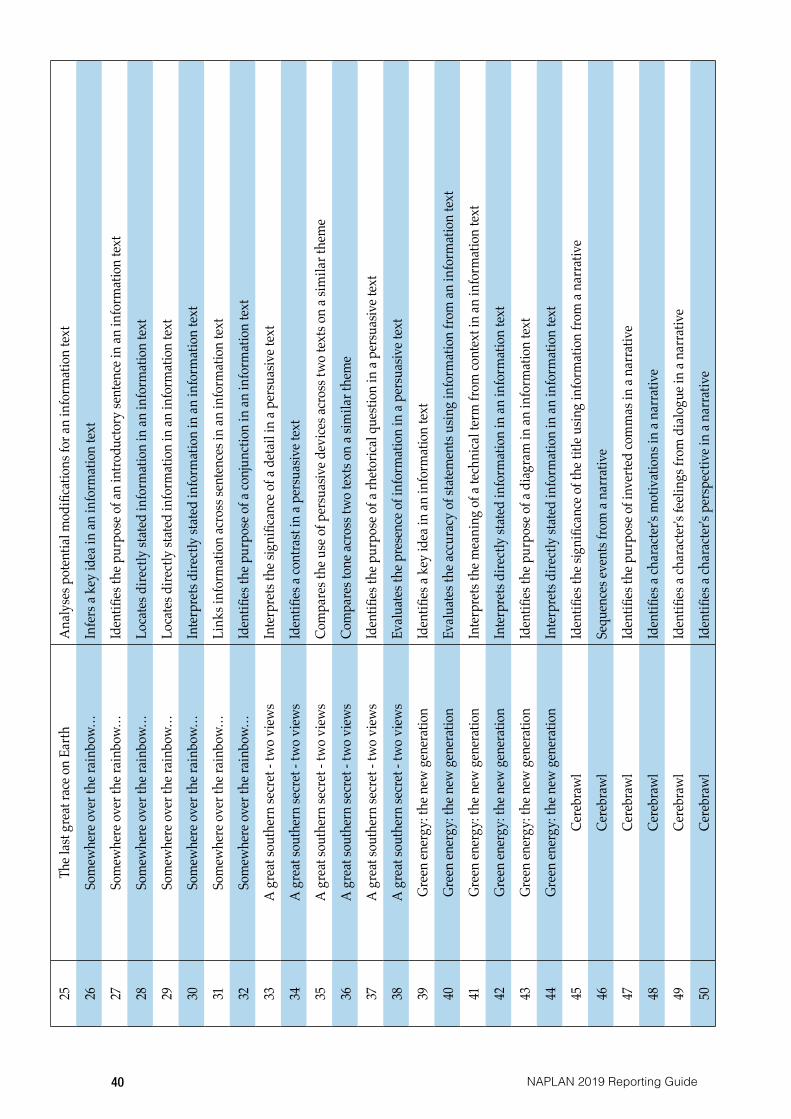
40 NAPLAN 2019 Reporting Guide
25Th
e las
t gre
at ra
ce o
n Ea
rthA
naly
ses p
oten
tial m
odifi
catio
ns fo
r an
info
rmat
ion
text
26So
mew
here
ove
r the
rain
bow…
Infe
rs a
key
idea
in an
info
rmat
ion
text
27So
mew
here
ove
r the
rain
bow…
Iden
tifies
the p
urpo
se o
f an
intro
duct
ory
sent
ence
in an
info
rmat
ion
text
28So
mew
here
ove
r the
rain
bow…
Loca
tes d
irect
ly st
ated
info
rmat
ion
in an
info
rmat
ion
text
29So
mew
here
ove
r the
rain
bow…
Loca
tes d
irect
ly st
ated
info
rmat
ion
in an
info
rmat
ion
text
30So
mew
here
ove
r the
rain
bow…
Inte
rpre
ts di
rect
ly st
ated
info
rmat
ion
in an
info
rmat
ion
text
31So
mew
here
ove
r the
rain
bow…
Link
s inf
orm
atio
n ac
ross
sent
ence
s in
an in
form
atio
n te
xt
32So
mew
here
ove
r the
rain
bow…
Iden
tifies
the p
urpo
se o
f a co
njun
ctio
n in
an in
form
atio
n te
xt
33A
gre
at so
uthe
rn se
cret
- tw
o vi
ews
Inte
rpre
ts th
e sig
nific
ance
of a
det
ail i
n a p
ersu
asiv
e tex
t
34A
gre
at so
uthe
rn se
cret
- tw
o vi
ews
Iden
tifies
a co
ntra
st in
a pe
rsua
sive t
ext
35A
gre
at so
uthe
rn se
cret
- tw
o vi
ews
Com
pare
s the
use
of p
ersu
asiv
e dev
ices a
cros
s tw
o te
xts o
n a s
imila
r the
me
36A
gre
at so
uthe
rn se
cret
- tw
o vi
ews
Com
pare
s ton
e acr
oss t
wo
text
s on
a sim
ilar t
hem
e
37A
gre
at so
uthe
rn se
cret
- tw
o vi
ews
Iden
tifies
the p
urpo
se o
f a rh
etor
ical q
uesti
on in
a pe
rsua
sive t
ext
38A
gre
at so
uthe
rn se
cret
- tw
o vi
ews
Eval
uate
s the
pre
senc
e of i
nfor
mat
ion
in a
pers
uasiv
e tex
t
39Gr
een
ener
gy: t
he n
ew g
ener
atio
n Id
entifi
es a
key
idea
in an
info
rmat
ion
text
40Gr
een
ener
gy: t
he n
ew g
ener
atio
n Ev
alua
tes t
he ac
cura
cy o
f sta
tem
ents
usin
g in
form
atio
n fro
m an
info
rmat
ion
text
41Gr
een
ener
gy: t
he n
ew g
ener
atio
n In
terp
rets
the m
eani
ng o
f a te
chni
cal t
erm
from
cont
ext i
n an
info
rmat
ion
text
42Gr
een
ener
gy: t
he n
ew g
ener
atio
n In
terp
rets
dire
ctly
stat
ed in
form
atio
n in
an in
form
atio
n te
xt
43Gr
een
ener
gy: t
he n
ew g
ener
atio
n Id
entifi
es th
e pur
pose
of a
dia
gram
in an
info
rmat
ion
text
44Gr
een
ener
gy: t
he n
ew g
ener
atio
n In
terp
rets
dire
ctly
stat
ed in
form
atio
n in
an in
form
atio
n te
xt
45Ce
rebr
awl
Iden
tifies
the s
igni
fican
ce o
f the
title
usin
g in
form
atio
n fro
m a
narr
ativ
e
46Ce
rebr
awl
Sequ
ence
s eve
nts f
rom
a na
rrat
ive
47Ce
rebr
awl
Iden
tifies
the p
urpo
se o
f inv
erte
d co
mm
as in
a na
rrat
ive
48Ce
rebr
awl
Iden
tifies
a ch
arac
ter's
mot
ivat
ions
in a
narr
ativ
e
49Ce
rebr
awl
Iden
tifies
a ch
arac
ter's
feel
ings
from
dia
logu
e in
a nar
rativ
e
50Ce
rebr
awl
Iden
tifies
a ch
arac
ter's
per
spec
tive i
n a n
arra
tive
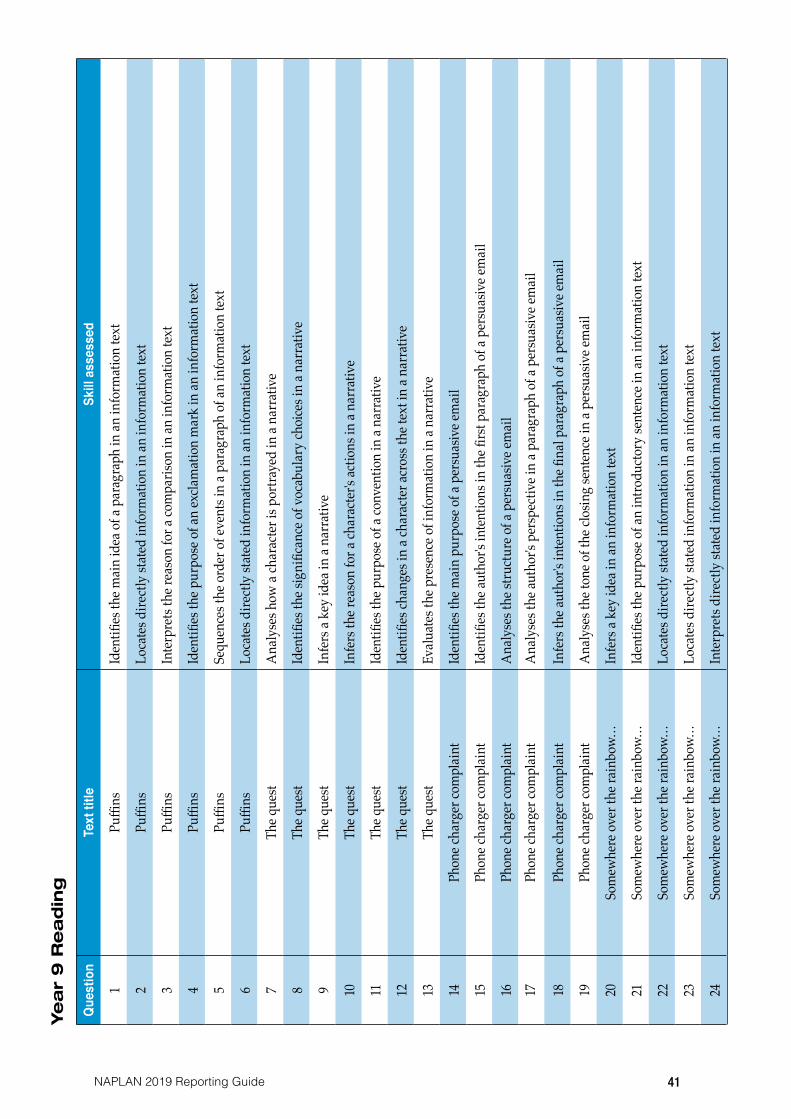
41NAPLAN 2019 Reporting Guide
Ye
ar
9 R
ea
din
g
Ques
tion
Text
title
Skill
ass
esse
d
1Pu
ffins
Iden
tifies
the m
ain
idea
of a
par
agra
ph in
an in
form
atio
n te
xt
2Pu
ffins
Loca
tes d
irect
ly st
ated
info
rmat
ion
in an
info
rmat
ion
text
3Pu
ffins
Inte
rpre
ts th
e rea
son
for a
com
paris
on in
an in
form
atio
n te
xt
4Pu
ffins
Iden
tifies
the p
urpo
se o
f an
excla
mat
ion
mar
k in
an in
form
atio
n te
xt
5Pu
ffins
Sequ
ence
s the
ord
er o
f eve
nts i
n a p
arag
raph
of a
n in
form
atio
n te
xt
6Pu
ffins
Loca
tes d
irect
ly st
ated
info
rmat
ion
in an
info
rmat
ion
text
7Th
e que
stA
naly
ses h
ow a
char
acte
r is p
ortra
yed
in a
narr
ativ
e
8Th
e que
stId
entifi
es th
e sig
nific
ance
of v
ocab
ular
y ch
oice
s in
a nar
rativ
e
9Th
e que
stIn
fers
a ke
y id
ea in
a na
rrat
ive
10Th
e que
stIn
fers
the r
easo
n fo
r a ch
arac
ter's
actio
ns in
a na
rrat
ive
11Th
e que
stId
entifi
es th
e pur
pose
of a
conv
entio
n in
a na
rrat
ive
12Th
e que
stId
entifi
es ch
ange
s in
a cha
ract
er ac
ross
the t
ext i
n a n
arra
tive
13Th
e que
stEv
alua
tes t
he p
rese
nce o
f inf
orm
atio
n in
a na
rrat
ive
14Ph
one c
harg
er co
mpl
aint
Iden
tifies
the m
ain
purp
ose o
f a p
ersu
asiv
e em
ail
15Ph
one c
harg
er co
mpl
aint
Iden
tifies
the a
utho
r's in
tent
ions
in th
e firs
t par
agra
ph o
f a p
ersu
asiv
e em
ail
16Ph
one c
harg
er co
mpl
aint
Ana
lyse
s the
stru
ctur
e of a
per
suas
ive e
mai
l17
Phon
e cha
rger
com
plai
ntA
naly
ses t
he au
thor
's pe
rspe
ctiv
e in
a par
agra
ph o
f a p
ersu
asiv
e em
ail
18Ph
one c
harg
er co
mpl
aint
Infe
rs th
e aut
hor's
inte
ntio
ns in
the fi
nal p
arag
raph
of a
per
suas
ive e
mai
l
19Ph
one c
harg
er co
mpl
aint
Ana
lyse
s the
tone
of t
he cl
osin
g se
nten
ce in
a pe
rsua
sive e
mai
l
20So
mew
here
ove
r the
rain
bow…
Infe
rs a
key
idea
in an
info
rmat
ion
text
21So
mew
here
ove
r the
rain
bow…
Iden
tifies
the p
urpo
se o
f an
intro
duct
ory
sent
ence
in an
info
rmat
ion
text
22So
mew
here
ove
r the
rain
bow…
Loca
tes d
irect
ly st
ated
info
rmat
ion
in an
info
rmat
ion
text
23So
mew
here
ove
r the
rain
bow…
Loca
tes d
irect
ly st
ated
info
rmat
ion
in an
info
rmat
ion
text
24So
mew
here
ove
r the
rain
bow…
Inte
rpre
ts di
rect
ly st
ated
info
rmat
ion
in an
info
rmat
ion
text
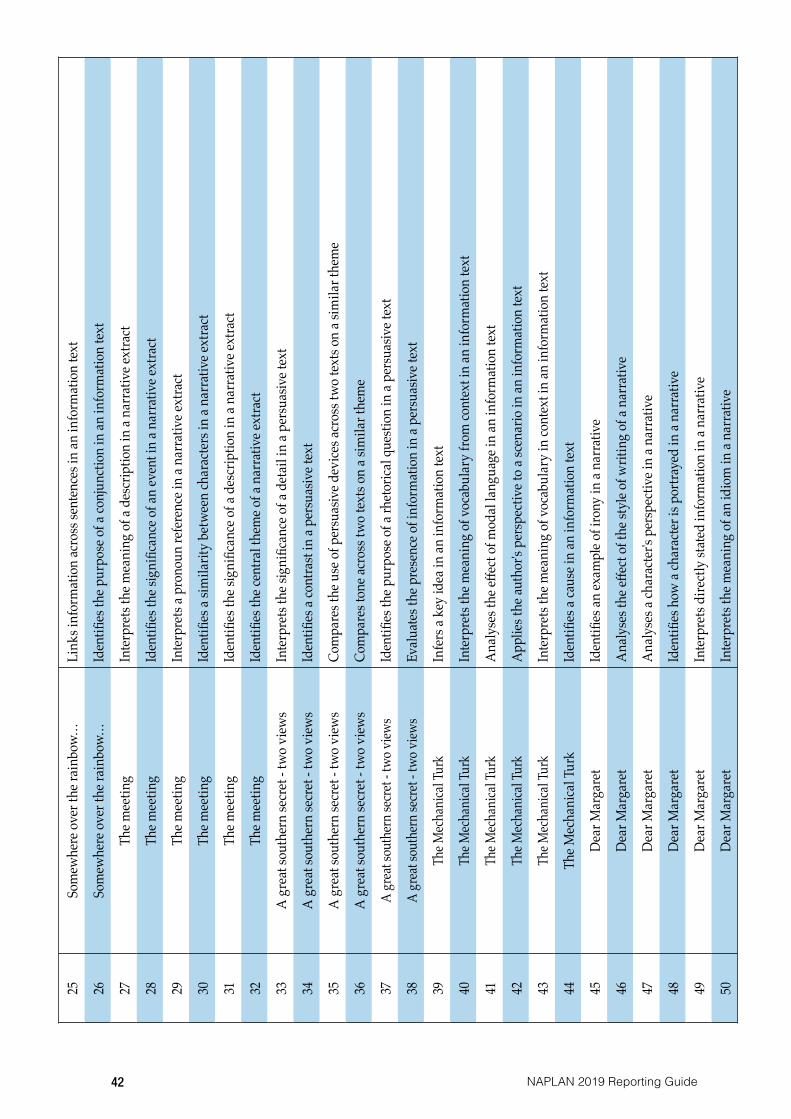
42 NAPLAN 2019 Reporting Guide
25So
mew
here
ove
r the
rain
bow…
Link
s inf
orm
atio
n ac
ross
sent
ence
s in
an in
form
atio
n te
xt
26So
mew
here
ove
r the
rain
bow…
Iden
tifies
the p
urpo
se o
f a co
njun
ctio
n in
an in
form
atio
n te
xt
27Th
e mee
ting
Inte
rpre
ts th
e mea
ning
of a
des
crip
tion
in a
narr
ativ
e ext
ract
28Th
e mee
ting
Iden
tifies
the s
igni
fican
ce o
f an
even
t in
a nar
rativ
e ext
ract
29Th
e mee
ting
Inte
rpre
ts a p
rono
un re
fere
nce i
n a n
arra
tive e
xtra
ct
30Th
e mee
ting
Iden
tifies
a sim
ilarit
y be
twee
n ch
arac
ters
in a
narr
ativ
e ext
ract
31Th
e mee
ting
Iden
tifies
the s
igni
fican
ce o
f a d
escr
iptio
n in
a na
rrat
ive e
xtra
ct
32Th
e mee
ting
Iden
tifies
the c
entra
l the
me o
f a n
arra
tive e
xtra
ct
33A
gre
at so
uthe
rn se
cret
- tw
o vi
ews
Inte
rpre
ts th
e sig
nific
ance
of a
det
ail i
n a p
ersu
asiv
e tex
t
34A
gre
at so
uthe
rn se
cret
- tw
o vi
ews
Iden
tifies
a co
ntra
st in
a pe
rsua
sive t
ext
35A
gre
at so
uthe
rn se
cret
- tw
o vi
ews
Com
pare
s the
use
of p
ersu
asiv
e dev
ices a
cros
s tw
o te
xts o
n a s
imila
r the
me
36A
gre
at so
uthe
rn se
cret
- tw
o vi
ews
Com
pare
s ton
e acr
oss t
wo
text
s on
a sim
ilar t
hem
e
37A
grea
t sou
ther
n se
cret
- two
view
sId
entifi
es th
e pur
pose
of a
rhet
orica
l que
stion
in a
pers
uasiv
e tex
t
38A
grea
t sou
ther
n se
cret
- two
view
sEv
alua
tes t
he p
rese
nce o
f inf
orm
atio
n in
a pe
rsua
sive t
ext
39Th
e Mec
hani
cal T
urk
Infe
rs a
key
idea
in an
info
rmat
ion
text
40Th
e Mec
hani
cal T
urk
Inte
rpre
ts th
e mea
ning
of v
ocab
ular
y fro
m co
ntex
t in
an in
form
atio
n te
xt
41Th
e Mec
hani
cal T
urk
Ana
lyse
s the
effec
t of m
odal
lang
uage
in an
info
rmat
ion
text
42Th
e Mec
hani
cal T
urk
Appl
ies th
e aut
hor's
per
spec
tive t
o a s
cena
rio in
an in
form
atio
n te
xt
43Th
e Mec
hani
cal T
urk
Inte
rpre
ts th
e mea
ning
of v
ocab
ular
y in
cont
ext i
n an
info
rmat
ion
text
44Th
e Mec
hani
cal T
urk
Iden
tifies
a ca
use i
n an
info
rmat
ion
text
45De
ar M
arga
ret
Iden
tifies
an ex
ampl
e of i
rony
in a
narr
ativ
e
46De
ar M
arga
ret
Ana
lyse
s the
effec
t of t
he st
yle o
f writ
ing
of a
narr
ativ
e
47De
ar M
arga
ret
Ana
lyse
s a ch
arac
ter's
per
spec
tive i
n a n
arra
tive
48De
ar M
arga
ret
Iden
tifies
how
a ch
arac
ter i
s por
traye
d in
a na
rrat
ive
49De
ar M
arga
ret
Inte
rpre
ts di
rect
ly st
ated
info
rmat
ion
in a
narr
ativ
e
50De
ar M
arga
ret
Inte
rpre
ts th
e mea
ning
of a
n id
iom
in a
narr
ativ
e
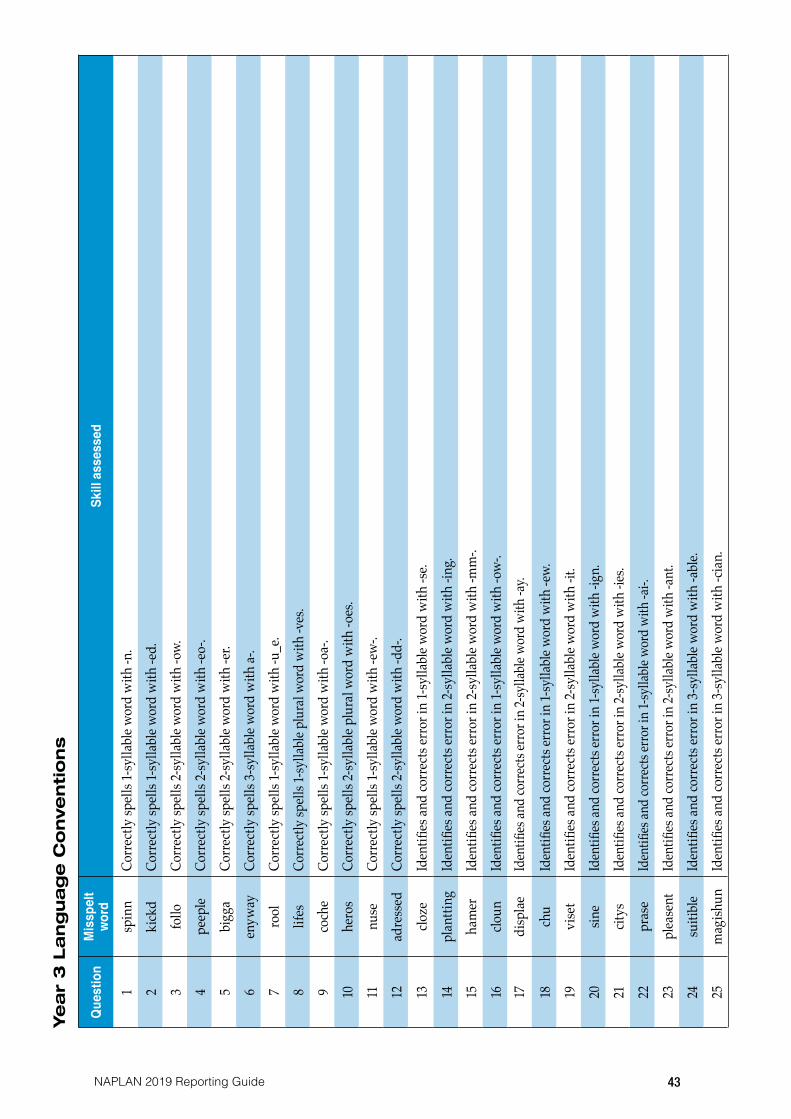
43NAPLAN 2019 Reporting Guide
Ye
ar
3 L
ang
uag
e C
onve
nti
on
s
Ques
tion
Mis
spel
t wo
rdSk
ill a
sses
sed
1sp
inn
Corr
ectly
spel
ls 1-
sylla
ble w
ord
with
-n.
2ki
ckd
Corr
ectly
spel
ls 1-
sylla
ble w
ord
with
-ed.
3fo
lloCo
rrec
tly sp
ells
2-sy
llabl
e wor
d w
ith -o
w.
4pe
eple
Corr
ectly
spel
ls 2-
sylla
ble w
ord
with
-eo-
.
5bi
gga
Corr
ectly
spel
ls 2-
sylla
ble w
ord
with
-er.
6en
yway
Corr
ectly
spel
ls 3-
sylla
ble w
ord
with
a-.
7ro
olCo
rrec
tly sp
ells
1-sy
llabl
e wor
d w
ith -u
_e.
8lif
esCo
rrec
tly sp
ells 1
-sylla
ble p
lura
l wor
d w
ith -v
es.
9co
che
Corr
ectly
spel
ls 1-
sylla
ble w
ord
with
-oa-
.
10he
ros
Corr
ectly
spel
ls 2-
sylla
ble p
lura
l wor
d w
ith -o
es.
11nu
seCo
rrec
tly sp
ells
1-sy
llabl
e wor
d w
ith -e
w-.
12ad
ress
edCo
rrec
tly sp
ells
2-sy
llabl
e wor
d w
ith -d
d-.
13clo
zeId
entifi
es an
d co
rrec
ts er
ror i
n 1-
sylla
ble w
ord
with
-se.
14pl
antti
ngId
entifi
es an
d co
rrec
ts er
ror i
n 2-
sylla
ble w
ord
with
-ing
.
15ha
mer
Iden
tifies
and
corr
ects
erro
r in
2-sy
llabl
e wor
d w
ith -m
m-.
16clo
unId
entifi
es an
d co
rrec
ts er
ror i
n 1-
sylla
ble w
ord
with
-ow
-.17
disp
lae
Iden
tifies
and
corre
cts er
ror i
n 2-
sylla
ble w
ord
with
-ay.
18ch
uId
entifi
es an
d co
rrec
ts er
ror i
n 1-
sylla
ble w
ord
with
-ew.
19vi
set
Iden
tifies
and
corr
ects
erro
r in
2-sy
llabl
e wor
d w
ith -i
t.
20sin
eId
entifi
es an
d co
rrec
ts er
ror i
n 1-
sylla
ble w
ord
with
-ign
.
21cit
ysId
entifi
es an
d co
rrec
ts er
ror i
n 2-
sylla
ble w
ord
with
-ies
.
22pr
ase
Iden
tifies
and
corre
cts er
ror i
n 1-s
yllab
le wo
rd w
ith -a
i-.
23pl
ease
ntId
entifi
es an
d co
rrec
ts er
ror i
n 2-
sylla
ble w
ord
with
-ant
.
24su
itibl
eId
entifi
es an
d co
rrec
ts er
ror i
n 3-
sylla
ble w
ord
with
-abl
e.
25m
agish
unId
entifi
es an
d co
rrec
ts er
ror i
n 3-
sylla
ble w
ord
with
-cia
n.
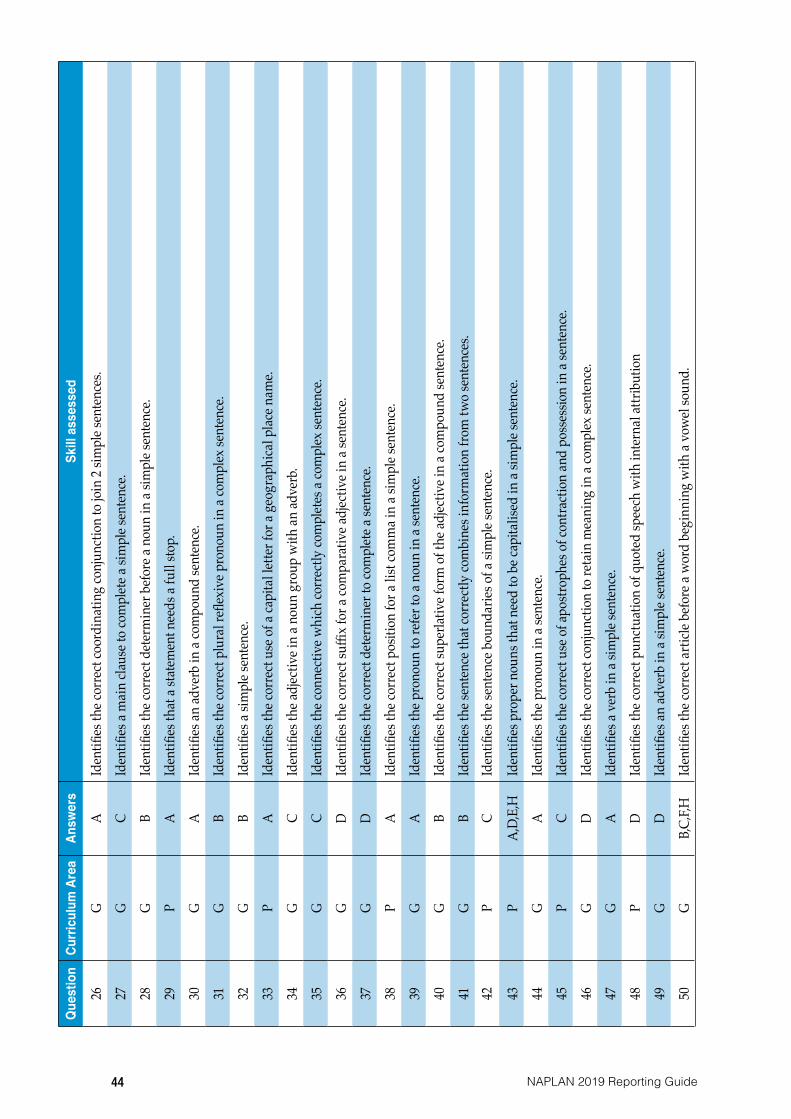
44 NAPLAN 2019 Reporting Guide
Ques
tion
Curri
culu
m A
rea
Answ
ers
Skill
ass
esse
d
26G
AId
entifi
es th
e cor
rect
coor
dina
ting
conj
unct
ion
to jo
in 2
simpl
e sen
tenc
es.
27G
CId
entifi
es a
mai
n cla
use t
o co
mpl
ete a
sim
ple s
ente
nce.
28G
BId
entifi
es th
e cor
rect
det
erm
iner
bef
ore a
nou
n in
a sim
ple s
ente
nce.
29P
AId
entifi
es th
at a
state
men
t nee
ds a
full
stop.
30G
AId
entifi
es an
adve
rb in
a co
mpo
und
sent
ence
.
31G
BId
entifi
es th
e cor
rect
plu
ral r
eflex
ive p
rono
un in
a co
mpl
ex se
nten
ce.
32G
BId
entifi
es a
simpl
e sen
tenc
e.
33P
AId
entifi
es th
e cor
rect
use
of a
capi
tal l
ette
r for
a ge
ogra
phica
l pla
ce n
ame.
34G
CId
entifi
es th
e adj
ectiv
e in
a nou
n gr
oup
with
an ad
verb
.
35G
CId
entifi
es th
e con
nect
ive w
hich
corr
ectly
com
plet
es a
com
plex
sent
ence
.
36G
DId
entifi
es th
e cor
rect
suffi
x for
a co
mpa
rativ
e adj
ectiv
e in
a sen
tenc
e.
37G
DId
entifi
es th
e cor
rect
det
erm
iner
to co
mpl
ete a
sent
ence
.
38P
AId
entifi
es th
e cor
rect
pos
ition
for a
list
com
ma i
n a s
impl
e sen
tenc
e.
39G
AId
entifi
es th
e pro
noun
to re
fer t
o a n
oun
in a
sent
ence
.
40G
BId
entifi
es th
e cor
rect
supe
rlativ
e for
m o
f the
adjec
tive i
n a c
ompo
und
sent
ence
.
41G
BId
entifi
es th
e sen
tenc
e tha
t cor
rect
ly co
mbi
nes i
nfor
mat
ion
from
two
sent
ence
s.42
PC
Iden
tifies
the s
ente
nce b
ound
aries
of a
sim
ple s
ente
nce.
43P
A,D,
E,H
Iden
tifies
pro
per n
ouns
that
nee
d to
be c
apita
lised
in a
simpl
e sen
tenc
e.
44G
AId
entifi
es th
e pro
noun
in a
sent
ence
.
45P
CId
entifi
es th
e cor
rect
use
of a
postr
ophe
s of c
ontra
ctio
n an
d po
sses
sion
in a
sent
ence
.
46G
DId
entifi
es th
e cor
rect
conj
unct
ion
to re
tain
mea
ning
in a
com
plex
sent
ence
.
47G
AId
entifi
es a
verb
in a
simpl
e sen
tenc
e.
48P
DId
entifi
es th
e cor
rect
pun
ctua
tion
of q
uote
d sp
eech
with
inte
rnal
attri
butio
n
49G
DId
entifi
es an
adve
rb in
a sim
ple s
ente
nce.
50G
B,C,
F,HId
entifi
es th
e cor
rect
artic
le be
fore
a w
ord
begi
nnin
g w
ith a
vow
el so
und.
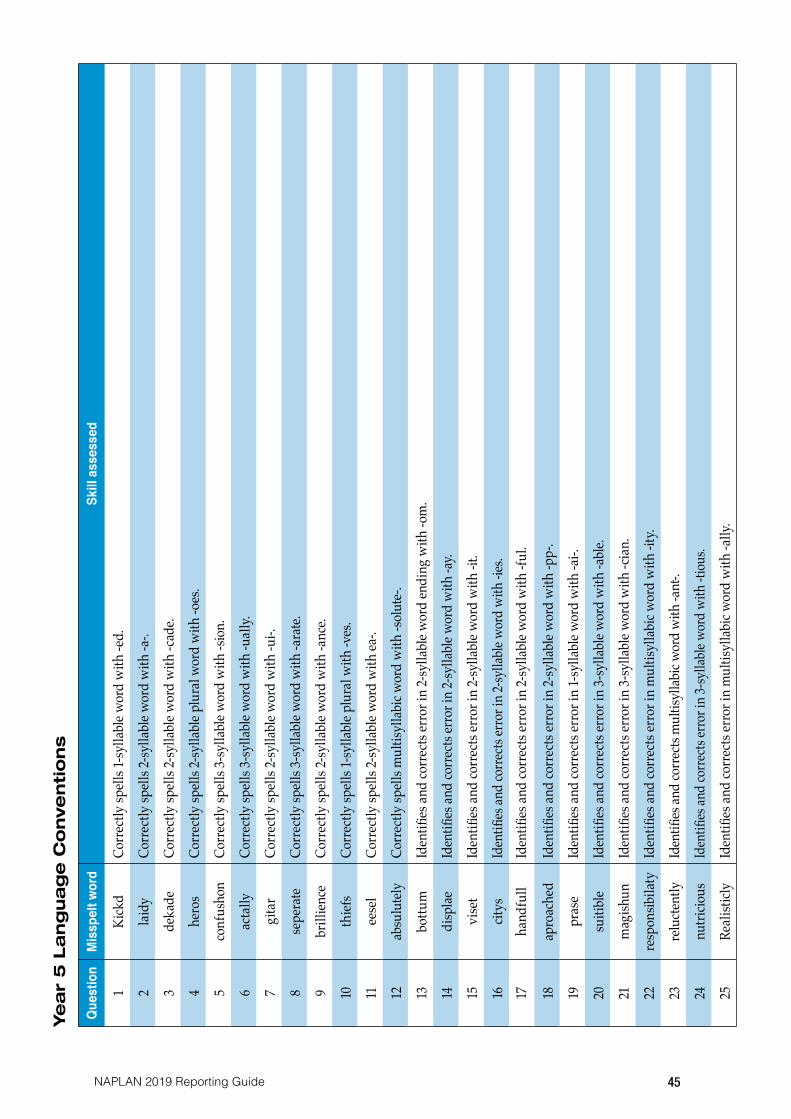
45NAPLAN 2019 Reporting Guide
Ye
ar
5 L
ang
uag
e C
onve
nti
on
s
Ques
tion
Mis
spel
t wor
dSk
ill a
sses
sed
1Ki
ckd
Corr
ectly
spel
ls 1-
sylla
ble w
ord
with
-ed.
2la
idy
Corr
ectly
spel
ls 2-
sylla
ble w
ord
with
-a-.
3de
kade
Corr
ectly
spel
ls 2-
sylla
ble w
ord
with
-cad
e.
4he
ros
Corr
ectly
spel
ls 2-
sylla
ble p
lura
l wor
d w
ith -o
es.
5co
nfus
hon
Corr
ectly
spel
ls 3-
sylla
ble w
ord
with
-sio
n.
6ac
tally
Corr
ectly
spel
ls 3-
sylla
ble w
ord
with
-ual
ly.
7gi
tar
Corr
ectly
spel
ls 2-
sylla
ble w
ord
with
-ui-.
8se
pera
teCo
rrec
tly sp
ells
3-sy
llabl
e wor
d w
ith -a
rate
.
9br
illien
ceCo
rrec
tly sp
ells
2-sy
llabl
e wor
d w
ith -a
nce.
10th
iefs
Corr
ectly
spel
ls 1-
sylla
ble p
lura
l with
-ves
.
11ee
sel
Corr
ectly
spel
ls 2-
sylla
ble w
ord
with
ea-.
12ab
sulu
tely
Corr
ectly
spel
ls m
ultis
ylla
bic w
ord
with
-sol
ute-
.
13bo
ttum
Iden
tifies
and
corr
ects
erro
r in
2-sy
llabl
e wor
d en
ding
with
-om
.
14di
spla
eId
entifi
es an
d co
rrec
ts er
ror i
n 2-
sylla
ble w
ord
with
-ay.
15vi
set
Iden
tifies
and
corr
ects
erro
r in
2-sy
llabl
e wor
d w
ith -i
t.
16cit
ysId
entifi
es an
d co
rrec
ts er
ror i
n 2-
sylla
ble w
ord
with
-ies
.17
hand
full
Iden
tifies
and
corr
ects
erro
r in
2-sy
llabl
e wor
d w
ith -f
ul.
18ap
roac
hed
Iden
tifies
and
corr
ects
erro
r in
2-sy
llabl
e wor
d w
ith -p
p-.
19pr
ase
Iden
tifies
and
corr
ects
erro
r in
1-sy
llabl
e wor
d w
ith -a
i-.
20su
itibl
eId
entifi
es an
d co
rrec
ts er
ror i
n 3-
sylla
ble w
ord
with
-abl
e.
21m
agish
unId
entifi
es an
d co
rrec
ts er
ror i
n 3-
sylla
ble w
ord
with
-cia
n.
22re
spon
sibila
tyId
entifi
es an
d co
rrec
ts er
ror i
n m
ultis
ylla
bic w
ord
with
-ity
.
23re
luct
ently
Iden
tifies
and
corr
ects
mul
tisyl
labic
wor
d w
ith -a
nt-.
24nu
tricio
usId
entifi
es an
d co
rrects
erro
r in
3-sy
llabl
e wor
d w
ith -t
ious
.
25Re
alist
icly
Iden
tifies
and
corr
ects
erro
r in
mul
tisyl
labi
c wor
d w
ith -a
lly.
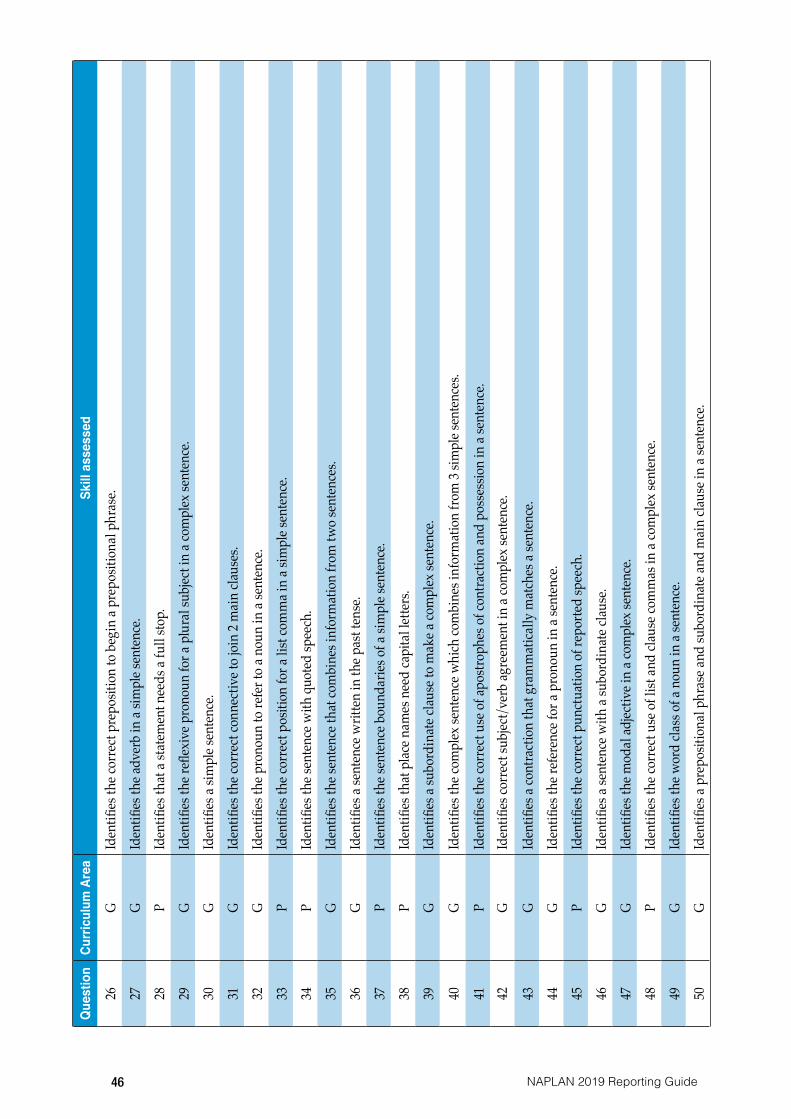
46 NAPLAN 2019 Reporting Guide
Ques
tion
Curri
culu
m A
rea
Skill
ass
esse
d
26G
Iden
tifies
the c
orre
ct p
repo
sitio
n to
beg
in a
prep
ositi
onal
phr
ase.
27G
Iden
tifies
the a
dver
b in
a sim
ple s
ente
nce.
28P
Iden
tifies
that
a sta
tem
ent n
eeds
a fu
ll sto
p.
29G
Iden
tifies
the r
eflex
ive p
rono
un fo
r a p
lura
l sub
ject i
n a c
ompl
ex se
nten
ce.
30G
Iden
tifies
a sim
ple s
ente
nce.
31G
Iden
tifies
the c
orre
ct co
nnec
tive t
o joi
n 2 m
ain
claus
es.
32G
Iden
tifies
the p
rono
un to
refe
r to
a nou
n in
a se
nten
ce.
33P
Iden
tifies
the c
orre
ct p
ositi
on fo
r a li
st co
mm
a in
a sim
ple s
ente
nce.
34P
Iden
tifies
the s
ente
nce w
ith q
uote
d sp
eech
.
35G
Iden
tifies
the s
ente
nce t
hat c
ombi
nes i
nfor
mat
ion
from
two
sent
ence
s.
36G
Iden
tifies
a se
nten
ce w
ritte
n in
the p
ast t
ense
.
37P
Iden
tifies
the s
ente
nce b
ound
aries
of a
sim
ple s
ente
nce.
38P
Iden
tifies
that
pla
ce n
ames
nee
d ca
pita
l let
ters
.
39G
Iden
tifies
a su
bord
inat
e cla
use t
o m
ake a
com
plex
sent
ence
.
40G
Iden
tifies
the c
ompl
ex se
nten
ce w
hich
com
bine
s inf
orm
atio
n fro
m 3
simpl
e sen
tenc
es.
41P
Iden
tifies
the c
orre
ct u
se o
f apo
strop
hes o
f con
tract
ion
and
poss
essio
n in
a se
nten
ce.
42G
Iden
tifies
corr
ect s
ubjec
t/ve
rb ag
reem
ent i
n a c
ompl
ex se
nten
ce.
43G
Iden
tifies
a co
ntra
ctio
n th
at g
ram
mat
ically
mat
ches
a se
nten
ce.
44G
Iden
tifies
the r
efer
ence
for a
pro
noun
in a
sent
ence
.
45P
Iden
tifies
the c
orre
ct p
unct
uatio
n of
repo
rted
spee
ch.
46G
Iden
tifies
a se
nten
ce w
ith a
subo
rdin
ate c
laus
e.
47G
Iden
tifies
the m
odal
adjec
tive i
n a c
ompl
ex se
nten
ce.
48P
Iden
tifies
the c
orre
ct u
se o
f list
and
claus
e com
mas
in a
com
plex
sent
ence
.
49G
Iden
tifies
the w
ord
class
of a
nou
n in
a se
nten
ce.
50G
Iden
tifies
a pr
epos
ition
al p
hras
e and
subo
rdin
ate a
nd m
ain
claus
e in
a sen
tenc
e.
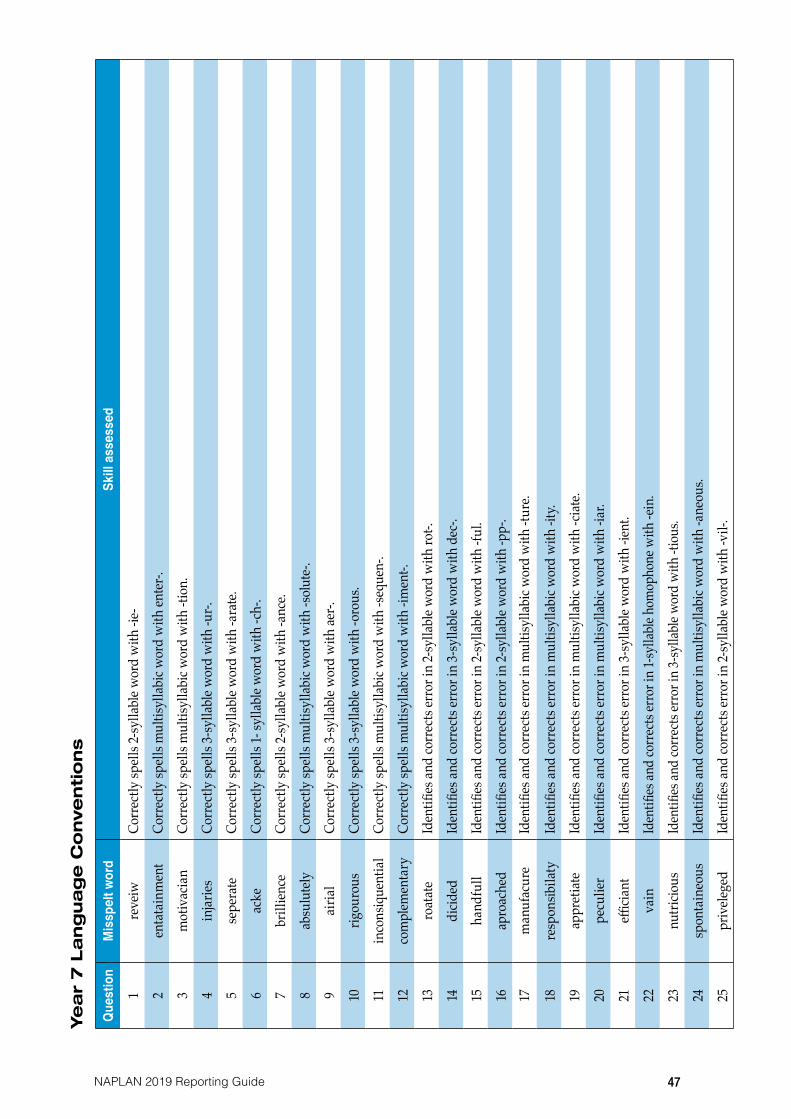
47NAPLAN 2019 Reporting Guide
Ye
ar
7 L
ang
uag
e C
onve
nti
on
s
Ques
tion
Mis
spel
t wor
dSk
ill a
sses
sed
1re
veiw
Corr
ectly
spel
ls 2-
sylla
ble w
ord
with
-ie-
2en
tata
inm
ent
Corr
ectly
spel
ls m
ultis
ylla
bic w
ord
with
ente
r-.
3m
otiv
acia
nCo
rrec
tly sp
ells
mul
tisyl
labi
c wor
d w
ith -t
ion.
4in
jaries
Corr
ectly
spel
ls 3-
sylla
ble w
ord
with
-ur-.
5se
pera
teCo
rrec
tly sp
ells
3-sy
llabl
e wor
d w
ith -a
rate
.
6ac
keCo
rrec
tly sp
ells
1- sy
llabl
e wor
d w
ith -c
h-.
7br
illien
ceCo
rrec
tly sp
ells
2-sy
llabl
e wor
d w
ith -a
nce.
8ab
sulu
tely
Corr
ectly
spel
ls m
ultis
ylla
bic w
ord
with
-sol
ute-
.
9ai
rial
Corr
ectly
spel
ls 3-
sylla
ble w
ord
with
aer-.
10rig
ouro
usCo
rrec
tly sp
ells
3-sy
llabl
e wor
d w
ith -o
rous
.
11in
cons
ique
ntia
lCo
rrec
tly sp
ells
mul
tisyl
labi
c wor
d w
ith -s
eque
n-.
12co
mpl
emen
tary
Corr
ectly
spel
ls m
ultis
ylla
bic w
ord
with
-im
ent-.
13ro
atat
eId
entifi
es an
d co
rrec
ts er
ror i
n 2-
sylla
ble w
ord
with
rot-.
14di
cided
Iden
tifies
and
corr
ects
erro
r in
3-sy
llabl
e wor
d w
ith d
ec-.
15ha
ndfu
llId
entifi
es an
d co
rrec
ts er
ror i
n 2-
sylla
ble w
ord
with
-ful
.
16ap
roac
hed
Iden
tifies
and
corr
ects
erro
r in
2-sy
llabl
e wor
d w
ith -p
p-.
17m
anuf
acur
eId
entifi
es an
d co
rrec
ts er
ror i
n m
ultis
ylla
bic w
ord
with
-tur
e.
18re
spon
sibila
tyId
entifi
es an
d co
rrec
ts er
ror i
n m
ultis
ylla
bic w
ord
with
-ity
.
19ap
pret
iate
Iden
tifies
and
corr
ects
erro
r in
mul
tisyl
labi
c wor
d w
ith -c
iate.
20pe
culie
rId
entifi
es an
d co
rrec
ts er
ror i
n m
ultis
ylla
bic w
ord
with
-iar
.
21effi
ciant
Iden
tifies
and
corr
ects
erro
r in
3-sy
llabl
e wor
d w
ith -i
ent.
22va
inId
entifi
es an
d co
rrec
ts er
ror i
n 1-s
yllab
le ho
mop
hone
with
-ein
.
23nu
tricio
usId
entifi
es an
d co
rrec
ts er
ror i
n 3-
sylla
ble w
ord
with
-tio
us.
24sp
onta
ineo
usId
entifi
es an
d co
rrec
ts er
ror i
n m
ultis
ylla
bic w
ord
with
-ane
ous.
25pr
ivele
ged
Iden
tifies
and
corr
ects
erro
r in
2-sy
llabl
e wor
d w
ith -v
il-.

48 NAPLAN 2019 Reporting Guide
Ques
tion
Curri
culu
m A
rea
Skill
ass
esse
d
26G
Iden
tifies
the c
orre
ct d
eter
min
er to
com
plet
e a si
mpl
e sen
tenc
e.
27G
Iden
tifies
the s
impl
e sen
tenc
e req
uirin
g a q
uesti
on m
ark.
28G
Iden
tifies
the r
eflex
ive p
rono
un fo
r a p
lura
l sub
ject i
n a c
ompl
ex se
nten
ce.
29G
Iden
tifies
the c
orre
ct co
nnec
tive t
o joi
n 2 m
ain
claus
es.
30P
Iden
tifies
the s
ente
nce w
ith q
uote
d sp
eech
.31
GId
entifi
es th
e wor
d w
hich
indi
cate
s an
opin
ion.
32P
Iden
tifies
a se
nten
ce w
ith co
rrec
t use
of b
rack
ets.
33P
Iden
tifies
the c
orre
ct u
se o
f pun
ctua
tion
for q
uote
d sp
eech
.
34G
Iden
tifies
the c
onju
nctio
n th
at jo
ins t
wo
mai
n cla
uses
to m
ake a
com
poun
d se
nten
ce.
35G
Iden
tifies
the m
odal
adve
rb ex
pres
sing
the g
reat
est c
erta
inty
.
36G
Iden
tifies
a co
mpl
ete s
ente
nce.
37P
Iden
tifies
the c
orre
ct p
lace
men
t of a
clau
se co
mm
a in
a sen
tenc
e.
38P
Iden
tifies
the r
easo
n fo
r the
use
of a
n ap
ostro
phe.
39G
Iden
tifies
the s
ente
nce w
ith an
adjec
tival
clau
se.
40G
Iden
tifies
the w
ord
class
of a
n ad
verb
, adj
ectiv
e, no
un an
d ve
rb in
a se
nten
ce.
41G
Iden
tifies
the a
djec
tive i
n a c
ompl
ex se
nten
ce.
42P
Iden
tifies
the c
orre
ct u
se o
f a co
lon
or a
sem
icolo
n in
a se
nten
ce.
43G
Iden
tifies
the a
dver
b of
tim
e in
a com
plex
sent
ence
.
44G
Iden
tifies
4 se
nten
ces a
s sim
ple o
r com
plex
.
45G
Iden
tifies
corr
ect s
ubjec
t/ve
rb ag
reem
ent i
n a s
ente
nce.
46P
Iden
tifies
the c
orre
ct u
se o
f a co
lon
to in
trodu
ce a
list.
47G
Iden
tifies
a no
un g
roup
in a
com
plex
sent
ence
.
48P
Iden
tifies
the c
orre
ct u
se o
f list
and
claus
e com
mas
in a
com
plex
sent
ence
.
49G
Iden
tifies
the a
dver
bial
phr
ase i
n a c
ompl
ex se
nten
ce w
ith an
adve
rbia
l cla
use.
50G
Iden
tifies
a pr
epos
ition
al p
hras
e and
subo
rdin
ate a
nd m
ain
claus
e in
a sen
tenc
e.

49NAPLAN 2019 Reporting Guide
Ye
ar
9 L
ang
uag
e C
onve
nti
on
s
Ques
tion
Mis
spel
t wor
dSk
ill a
sses
sed
1pr
opoz
alCo
rrec
tly sp
ells
3-sy
llabl
e wor
d w
ith -s
al.
2m
otiv
acia
nCo
rrec
tly sp
ells
mul
tisyl
labi
c wor
d w
ith -t
ion.
3ou
tfeild
erCo
rrec
tly sp
ells
3-sy
llabl
e com
poun
d w
ord
with
-ie-
.
4en
thus
easti
cCo
rrec
tly sp
ells
mul
tisyl
labi
c wor
d w
ith -i
a-.
5ho
rror
fied
Corr
ectly
spel
ls 3-
sylla
ble w
ord
with
-ifie
d.
6co
nsen
trate
Corr
ectly
spel
ls 3-
sylla
ble w
ord
with
-cen
t-.
7go
rmet
Corr
ectly
spel
ls 2-
sylla
ble w
ord
with
-our
-.
8in
cons
ique
ntia
lCo
rrec
tly sp
ells
mul
tisyl
labi
c wor
d w
ith -s
eque
n-.
9co
mpl
emen
tary
Corr
ectly
spel
ls m
ultis
ylla
bic w
ord
with
-im
ent-.
10rin
ocer
osCo
rrec
tly sp
ells
mul
tisyl
labi
c wor
d w
ith rh
-.
11su
ttlet
yCo
rrec
tly sp
ells
3-sy
llabl
e wor
d w
ith si
lent -
b-.
12nu
scen
ceCo
rrec
tly sp
ells
2 syl
labl
e wor
d w
ith -s
ance
.
13co
ntin
nued
Iden
tifies
& co
rrec
ts er
ror i
n 3-
sylla
ble w
ord
with
-nn-
.
14re
mar
kibl
eId
entifi
es an
d co
rrec
ts er
ror i
n m
ultis
ylla
bic w
ord
with
-abl
e.
15m
anuf
acur
eId
entifi
es an
d co
rrec
ts er
ror i
n m
ultis
ylla
bic w
ord
with
-tur
e.
16pe
culie
rId
entifi
es an
d co
rrec
ts er
ror i
n m
ultis
ylla
bic w
ord
with
-iar
.17
efficia
ntId
entifi
es an
d co
rrec
ts er
ror i
n 3-
sylla
ble w
ord
with
-ien
t.
18an
ticep
ticId
entifi
es an
d co
rrec
ts er
ror i
n m
ultis
ylla
bic w
ord
with
-sep
t-.
19leg
isliti
veId
entifi
es an
d co
rrec
ts er
ror i
n m
ultis
ylla
bic w
ord
with
-ativ
e.
20di
ssap
prov
alId
entifi
es an
d co
rrec
ts er
ror i
n m
ultis
ylla
bic w
ord
with
dis-
.
21les
ure
Iden
tifies
and
corr
ects
erro
r in
2-sy
llabl
e wor
d w
ith -e
is-.
22un
fortu
neat
lyId
entifi
es an
d co
rrec
ts er
ror i
n m
ultis
ylla
bic w
ord
with
-ate
ly.
23sp
onta
ineo
usId
entifi
es an
d co
rrec
ts er
ror i
n m
ultis
ylla
bic w
ord
with
-ane
ous.
24un
eces
sary
Iden
tifies
and
corr
ects
erro
r in
mul
tisyl
labi
c wor
d w
ith -n
n-.
25pr
ivele
ged
Iden
tifies
and
corr
ects
erro
r in
2-sy
llabl
e wor
d w
ith -v
il-.

50 NAPLAN 2019 Reporting Guide
Ques
tion
Curri
culu
m A
rea
Skill
ass
esse
d
26G
Iden
tifies
the c
orre
ct m
odal
adve
rb to
com
plet
e a se
nten
ce.
27G
Iden
tifies
the c
orre
ct te
nse v
erb
to co
mpl
ete a
sent
ence
.
28G
Iden
tifies
the c
orre
ct co
njun
ctio
n to
link
idea
s in
a com
plex
sent
ence
.
29G
Iden
tifies
the c
orre
ct p
aral
lel co
nstru
ctio
n fo
r a se
nten
ce.
30P
Iden
tifies
the c
orre
ct u
se o
f apo
strop
hes f
or p
osse
ssio
n in
a se
nten
ce.
31P
Iden
tifies
the c
orre
ct u
se o
f pun
ctua
tion
for q
uote
d sp
eech
.
32G
Iden
tifies
the c
orre
ct u
se o
f com
mas
to se
para
te it
ems i
n a l
ist.
33G
Iden
tifies
the c
orre
ct p
lace
men
t of s
ente
nce b
ound
aries
in a
com
plex
sent
ence
.
34P
Iden
tifies
the r
easo
n fo
r the
use
of a
n ap
ostro
phe.
35P
Iden
tifies
the c
orre
ct u
se o
f pun
ctua
tion
for q
uote
d sp
eech
.
36G
Iden
tifies
a co
mpo
und
sent
ence
with
clea
r coh
esio
n.37
GId
entifi
es co
mm
on an
d ab
strac
t nou
ns in
a co
mpl
ex se
nten
ce.
38G
Iden
tifies
pre
fixes
crea
ting
anto
nym
s of g
iven
wor
ds.
39P
Iden
tifies
the c
orre
ct u
se o
f cap
ital l
ette
rs fo
r a g
eogr
aphi
cal p
lace
nam
e.
40G
Iden
tifies
the a
djec
tives
in a
com
plex
sent
ence
.
41G
Iden
tifies
the r
efer
ence
for a
pro
noun
in a
shor
t tex
t.
42G
Iden
tifies
the p
arts
of sp
eech
of t
wo
relat
ed w
ords
.
43P
Iden
tifies
the c
orre
ct u
se o
f apo
strop
hes f
or co
ntra
ctio
n in
a se
nten
ce.
44G
Iden
tifies
corr
ect s
ubjec
t/ve
rb ag
reem
ent i
n a s
ente
nce.
45G
Iden
tifies
a sim
ple s
ente
nce.
46P
Iden
tifies
the c
orre
ct u
se o
f a co
lon
to in
trodu
ce a
list.
47G
Iden
tifies
a no
un g
roup
in a
com
plex
sent
ence
.
48G
Iden
tifies
the a
djec
tive i
n a c
ompl
ex se
nten
ce.
49G
Iden
tifies
the a
dver
bial
phr
ase i
n a c
ompl
ex se
nten
ce w
ith an
adve
rbia
l cla
use.
50P
Iden
tifies
corr
ect u
se o
f com
mas
for e
mbe
dded
clau
ses a
nd p
repo
sitio
nal p
hras
es.
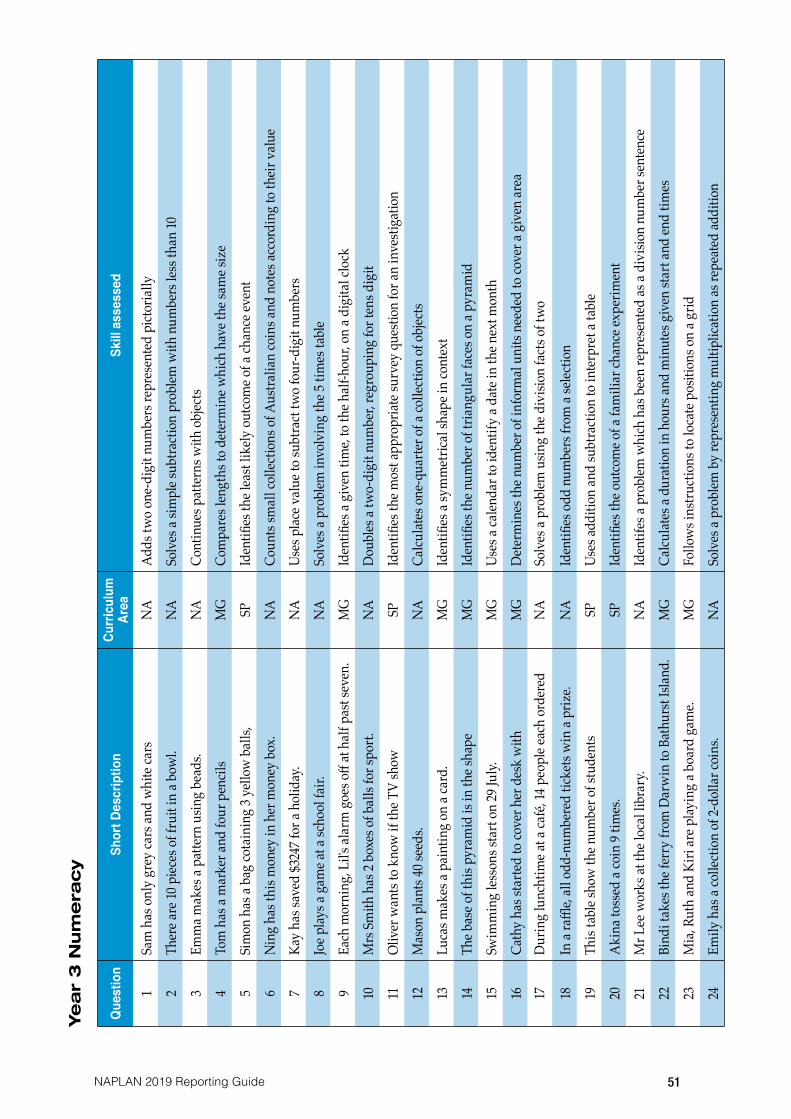
51NAPLAN 2019 Reporting Guide
Ye
ar
3 N
um
era
cy
Ques
tion
Shor
t Des
crip
tion
Curri
culu
m
Area
Skill
ass
esse
d
1Sa
m h
as o
nly
grey
cars
and
whi
te ca
rsN
AAd
ds tw
o on
e-di
git n
umbe
rs re
pres
ente
d pi
ctor
ially
2Th
ere a
re 10
piec
es o
f fru
it in
a bo
wl.
NA
Solv
es a
simpl
e sub
tract
ion
prob
lem w
ith n
umbe
rs le
ss th
an 10
3Em
ma m
akes
a pa
ttern
usin
g be
ads.
NA
Cont
inue
s pat
tern
s with
obj
ects
4To
m h
as a
mar
ker a
nd fo
ur p
encil
sM
GCo
mpa
res l
engt
hs to
det
erm
ine w
hich
hav
e the
sam
e siz
e
5Si
mon
has
a ba
g co
tain
ing
3 yel
low
bal
ls,
SPId
entifi
es th
e lea
st lik
ely o
utco
me o
f a ch
ance
even
t
6N
ing
has t
his m
oney
in h
er m
oney
box
.N
ACo
unts
smal
l col
lectio
ns o
f Aus
tralia
n co
ins a
nd n
otes
acco
rdin
g to
thei
r val
ue
7Ka
y ha
s sav
ed $3
247 f
or a
holid
ay.
NA
Uses
pla
ce v
alue
to su
btra
ct tw
o fo
ur-d
igit
num
bers
8Jo
e play
s a g
ame a
t a sc
hool
fair.
NA
Solv
es a
prob
lem in
volv
ing
the 5
tim
es ta
ble
9Ea
ch m
orni
ng, L
il's al
arm
goe
s off
at h
alf p
ast s
even
.M
GId
entifi
es a
give
n tim
e, to
the h
alf-h
our,
on a
digi
tal c
lock
10M
rs Sm
ith h
as 2
boxe
s of b
alls
for s
port.
NA
Doub
les a
two-
digi
t num
ber,
regr
oupi
ng fo
r ten
s dig
it
11Ol
iver
wan
ts to
kno
w if
the T
V sh
owSP
Iden
tifies
the m
ost a
ppro
priat
e sur
vey
ques
tion
for a
n in
vesti
gatio
n
12M
ason
pla
nts 4
0 see
ds.
NA
Calcu
lates
one
-qua
rter o
f a co
llect
ion
of o
bjec
ts
13Lu
cas m
akes
a pa
intin
g on
a ca
rd.
MG
Iden
tifies
a sy
mm
etric
al sh
ape i
n co
ntex
t
14Th
e bas
e of t
his p
yram
id is
in th
e sha
peM
GId
entifi
es th
e num
ber o
f tria
ngul
ar fa
ces o
n a p
yram
id
15Sw
imm
ing
lesso
ns st
art o
n 29
July.
MG
Uses
a ca
lenda
r to
iden
tify
a dat
e in
the n
ext m
onth
16Ca
thy
has s
tarte
d to
cove
r her
des
k w
ithM
GDe
term
ines
the n
umbe
r of i
nfor
mal
uni
ts ne
eded
to co
ver a
giv
en ar
ea17
Dur
ing
lunc
htim
e at a
café
, 14 p
eopl
e eac
h or
dere
dN
ASo
lves
a pr
oblem
usin
g th
e div
ision
fact
s of t
wo
18In
a ra
ffle,
all o
dd-n
umbe
red
ticke
ts w
in a
priz
e.N
AId
entifi
es o
dd n
umbe
rs fr
om a
selec
tion
19Th
is ta
ble s
how
the n
umbe
r of s
tude
nts
SPUs
es ad
ditio
n an
d su
btra
ctio
n to
inte
rpre
t a ta
ble
20A
kina
toss
ed a
coin
9 tim
es.
SPId
entifi
es th
e out
com
e of a
fam
iliar
chan
ce ex
perim
ent
21M
r Lee
wor
ks at
the l
ocal
libr
ary.
NA
Iden
tifes
a pr
oblem
whi
ch h
as b
een
repr
esen
ted
as a
divi
sion
num
ber s
ente
nce
22Bi
ndi t
akes
the f
erry
from
Dar
win
to B
athu
rst I
sland
.M
GCa
lculat
es a
dura
tion
in h
ours
and
min
utes
giv
en st
art a
nd en
d tim
es
23M
ia, R
uth
and
Kiri
are p
layin
g a b
oard
gam
e.M
GFo
llow
s ins
truct
ions
to lo
cate
pos
ition
s on
a grid
24Em
ily h
as a
colle
ctio
n of
2-do
llar c
oins
.N
ASo
lves
a pr
oblem
by
repr
esen
ting
mul
tiplic
atio
n as
repe
ated
addi
tion
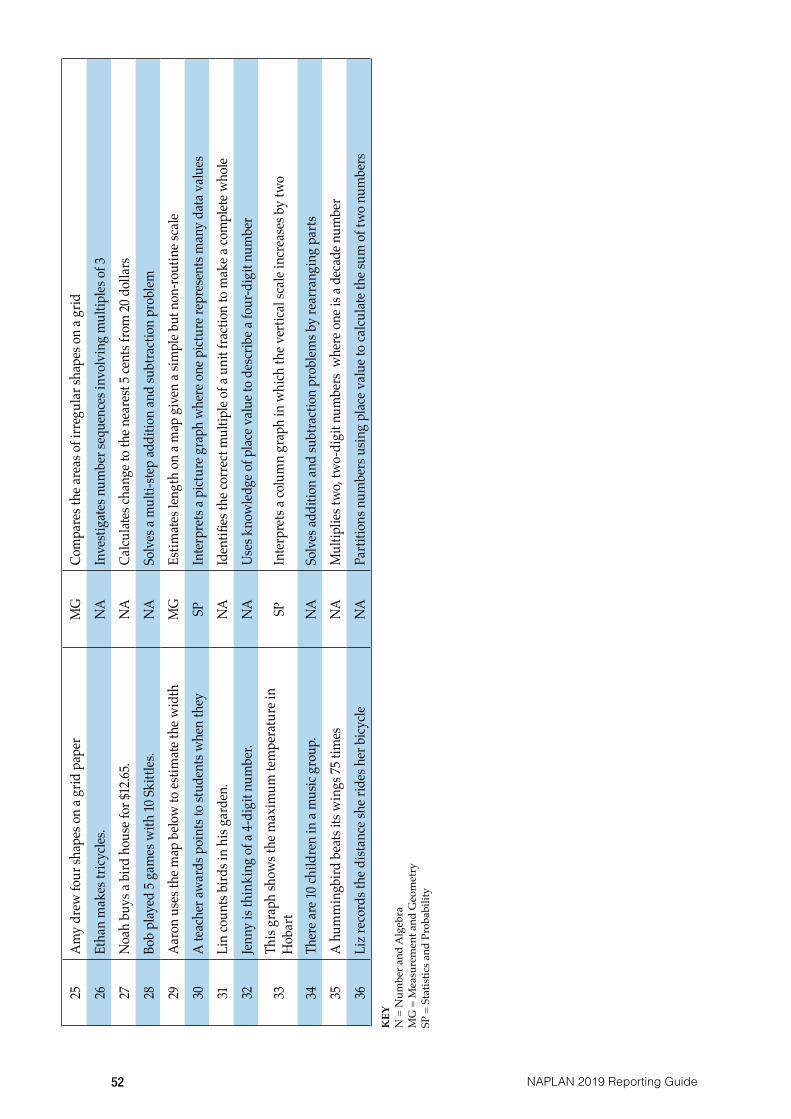
52 NAPLAN 2019 Reporting Guide
25A
my
drew
four
shap
es o
n a g
rid p
aper
MG
Com
pare
s the
area
s of i
rreg
ular
shap
es o
n a g
rid
26Et
han
mak
es tr
icycle
s.N
AIn
vesti
gate
s num
ber s
eque
nces
invo
lvin
g m
ultip
les o
f 3
27N
oah
buys
a bi
rd h
ouse
for $
12.65
.N
ACa
lculat
es ch
ange
to th
e nea
rest
5 cen
ts fro
m 20
dol
lars
28Bo
b pl
ayed
5 ga
mes
with
10 Sk
ittles
.N
ASo
lves
a m
ulti-
step
addi
tion
and
subt
ract
ion
prob
lem
29A
aron
use
s the
map
belo
w to
estim
ate t
he w
idth
MG
Estim
ates
leng
th o
n a m
ap g
iven
a sim
ple b
ut n
on-ro
utin
e sca
le
30A
teac
her a
war
ds p
oint
s to
stud
ents
whe
n th
ey
SPIn
terp
rets
a pict
ure g
raph
whe
re o
ne p
ictur
e rep
rese
nts m
any
data
val
ues
31Li
n co
unts
bird
s in
his g
arde
n.N
AId
entifi
es th
e cor
rect
mul
tiple
of a
unit
fract
ion
to m
ake a
com
plet
e who
le
32Je
nny
is th
inki
ng o
f a 4-
digi
t num
ber.
NA
Uses
kno
wled
ge o
f pla
ce v
alue
to d
escr
ibe a
four
-dig
it nu
mbe
r
33Th
is gr
aph
show
s the
max
imum
tem
pera
ture
in
Hob
art
SPIn
terp
rets
a col
umn
grap
h in
whi
ch th
e ver
tical
scal
e inc
reas
es b
y tw
o
34Th
ere a
re 10
child
ren
in a
mus
ic gr
oup.
NA
Solv
es ad
ditio
n an
d su
btra
ctio
n pr
oblem
s by
rear
rang
ing
parts
35A
hum
min
gbird
bea
ts its
win
gs 75
tim
esN
AM
ultip
lies t
wo,
two-
digi
t num
bers
whe
re o
ne is
a de
cade
num
ber
36Li
z rec
ords
the d
istan
ce sh
e rid
es h
er b
icycle
NA
Parti
tions
num
bers
usin
g pl
ace v
alue
to ca
lculat
e the
sum
of t
wo
num
bers
KEY
N
= N
umbe
r and
Alg
ebra
MG
= M
easu
rem
ent a
nd G
eom
etry
SP =
Sta
tistic
s and
Pro
babi
lity
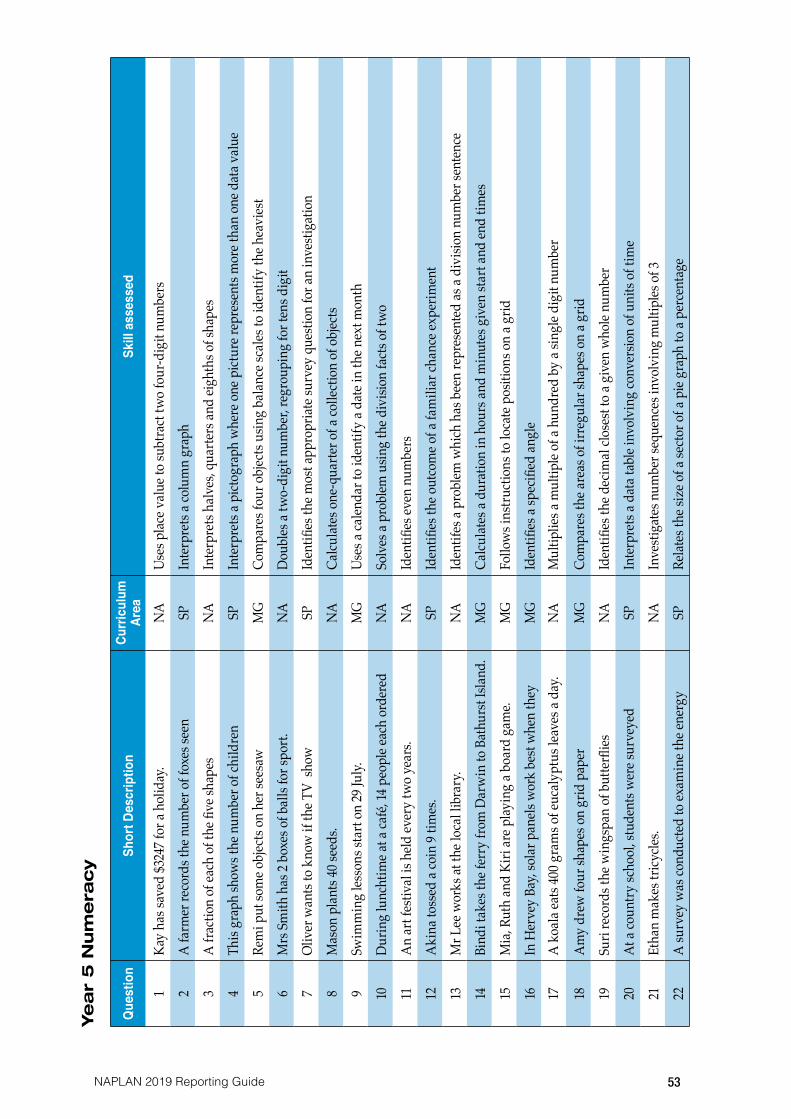
53NAPLAN 2019 Reporting Guide
Ye
ar
5 N
um
era
cy
Ques
tion
Shor
t Des
crip
tion
Curri
culu
m
Area
Skill
ass
esse
d
1Ka
y ha
s sav
ed $3
247 f
or a
holid
ay.
NA
Uses
pla
ce v
alue
to su
btra
ct tw
o fo
ur-d
igit
num
bers
2A
farm
er re
cord
s the
num
ber o
f fox
es se
enSP
Inte
rpre
ts a c
olum
n gr
aph
3A
frac
tion
of ea
ch o
f the
five
shap
esN
AIn
terp
rets
halv
es, q
uarte
rs an
d eig
hths
of s
hape
s
4Th
is gr
aph
show
s the
num
ber o
f chi
ldre
nSP
Inte
rpre
ts a p
ictog
raph
whe
re o
ne p
ictur
e rep
rese
nts m
ore t
han
one d
ata v
alue
5Re
mi p
ut so
me o
bjec
ts on
her
sees
awM
GCo
mpa
res f
our o
bjec
ts us
ing
bala
nce s
cales
to id
entif
y th
e hea
vies
t
6M
rs Sm
ith h
as 2
boxe
s of b
alls
for s
port.
NA
Doub
les a
two-
digi
t num
ber,
regr
oupi
ng fo
r ten
s dig
it
7Ol
iver
wan
ts to
kno
w if
the T
V sh
ow
SPId
entifi
es th
e mos
t app
ropr
iate s
urve
y qu
estio
n fo
r an
inve
stiga
tion
8M
ason
pla
nts 4
0 see
ds.
NA
Calcu
lates
one
-qua
rter o
f a co
llect
ion
of o
bjec
ts
9Sw
imm
ing
lesso
ns st
art o
n 29
July.
MG
Uses
a ca
lenda
r to
iden
tify
a dat
e in
the n
ext m
onth
10D
urin
g lu
ncht
ime a
t a ca
fé, 1
4 peo
ple e
ach
orde
red
NA
Solv
es a
prob
lem u
sing
the d
ivisi
on fa
cts o
f tw
o
11A
n ar
t fes
tival
is h
eld ev
ery
two
year
s.N
AId
entifi
es ev
en n
umbe
rs
12A
kina
toss
ed a
coin
9 tim
es.
SPId
entifi
es th
e out
com
e of a
fam
iliar
chan
ce ex
perim
ent
13M
r Lee
wor
ks at
the l
ocal
libr
ary.
NA
Iden
tifes
a pr
oblem
whi
ch h
as b
een
repr
esen
ted
as a
divi
sion
num
ber s
ente
nce
14Bi
ndi t
akes
the f
erry
from
Dar
win
to B
athu
rst I
sland
.M
GCa
lculat
es a
dura
tion
in h
ours
and
min
utes
giv
en st
art a
nd en
d tim
es
15M
ia, R
uth
and
Kiri
are p
layin
g a b
oard
gam
e.M
GFo
llow
s ins
truct
ions
to lo
cate
pos
ition
s on
a grid
16In
Her
vey
Bay,
sola
r pan
els w
ork
best
whe
n th
ey
MG
Iden
tifies
a sp
ecifi
ed an
gle
17A
koa
la ea
ts 40
0 gra
ms o
f euc
alyp
tus l
eave
s a d
ay.
NA
Mul
tiplie
s a m
ultip
le of
a hu
ndre
d by
a sin
gle d
igit
num
ber
18A
my
drew
four
shap
es o
n gr
id p
aper
M
GCo
mpa
res t
he ar
eas o
f irr
egul
ar sh
apes
on
a grid
19Su
ri re
cord
s the
win
gspa
n of
but
terfl
iesN
AId
entifi
es th
e dec
imal
clos
est t
o a g
iven
who
le nu
mbe
r
20At
a co
untry
scho
ol, s
tude
nts w
ere s
urve
yed
SPIn
terp
rets
a dat
a tab
le in
volv
ing
conv
ersio
n of
uni
ts of
tim
e
21Et
han
mak
es tr
icycle
s.N
AIn
vesti
gate
s num
ber s
eque
nces
invo
lvin
g m
ultip
les o
f 3
22A
surv
ey w
as co
nduc
ted
to ex
amin
e the
ener
gy
SPRe
lates
the s
ize o
f a se
ctor
of a
pie
grap
h to
a pe
rcen
tage
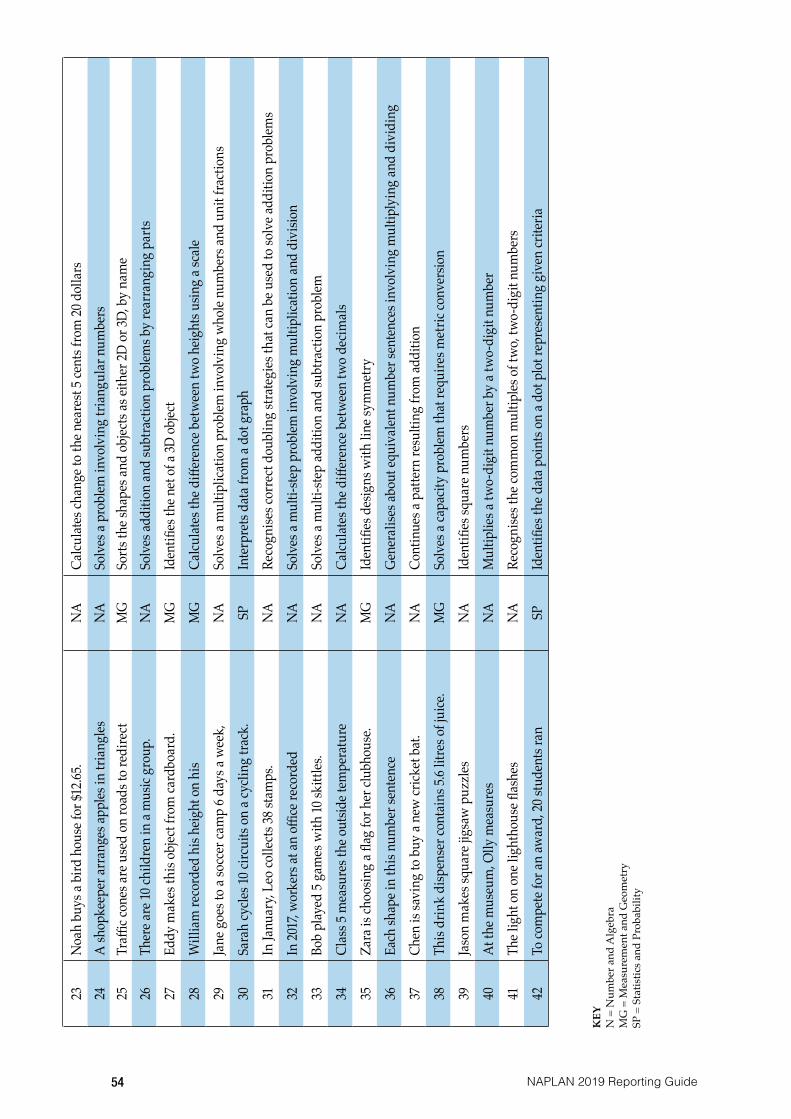
54 NAPLAN 2019 Reporting Guide
23N
oah
buys
a bi
rd h
ouse
for $
12.65
.N
ACa
lculat
es ch
ange
to th
e nea
rest
5 cen
ts fro
m 20
dol
lars
24A
shop
keep
er ar
rang
es ap
ples
in tr
iang
lesN
ASo
lves
a pr
oblem
invo
lvin
g tri
angu
lar n
umbe
rs25
Traffi
c con
es ar
e use
d on
road
s to
redi
rect
M
GSo
rts th
e sha
pes a
nd o
bjec
ts as
eith
er 2D
or 3
D, b
y na
me
26Th
ere a
re 10
child
ren
in a
mus
ic gr
oup.
NA
Solv
es ad
ditio
n an
d su
btra
ctio
n pr
oblem
s by
rear
rang
ing
parts
27Ed
dy m
akes
this
objec
t fro
m ca
rdbo
ard.
MG
Iden
tifies
the n
et of
a 3D
obj
ect
28W
illia
m re
cord
ed h
is he
ight
on
his
MG
Calcu
lates
the d
iffer
ence
bet
wee
n tw
o he
ight
s usin
g a s
cale
29Ja
ne g
oes t
o a s
occe
r cam
p 6 d
ays a
wee
k,
NA
Solv
es a
mul
tiplic
atio
n pr
oblem
invo
lvin
g w
hole
num
bers
and
unit
fract
ions
30Sa
rah
cycle
s 10 c
ircui
ts on
a cy
cling
trac
k.SP
Inte
rpre
ts da
ta fr
om a
dot g
raph
31In
Janu
ary,
Leo
colle
cts 3
8 sta
mps
.N
ARe
cogn
ises c
orre
ct d
oubl
ing
strat
egies
that
can
be u
sed
to so
lve a
dditi
on p
robl
ems
32In
2017
, wor
kers
at an
offi
ce re
cord
edN
ASo
lves
a m
ulti-
step
prob
lem in
volv
ing
mul
tiplic
atio
n an
d di
visio
n
33Bo
b pl
ayed
5 ga
mes
with
10 sk
ittles
.N
ASo
lves
a m
ulti-
step
addi
tion
and
subt
ract
ion
prob
lem
34Cl
ass 5
mea
sure
s the
out
side t
empe
ratu
reN
ACa
lculat
es th
e diff
eren
ce b
etw
een
two
decim
als
35Za
ra is
choo
sing
a flag
for h
er cl
ubho
use.
MG
Iden
tifies
des
igns
with
line
sym
met
ry
36Ea
ch sh
ape i
n th
is nu
mbe
r sen
tenc
e N
AGe
nera
lises
abou
t equ
ival
ent n
umbe
r sen
tenc
es in
volv
ing
mul
tiply
ing
and
divi
ding
37Ch
en is
savi
ng to
buy
a ne
w cr
icket
bat
.N
ACo
ntin
ues a
pat
tern
resu
lting
from
addi
tion
38Th
is dr
ink
disp
ense
r con
tain
s 5.6
litre
s of j
uice
.M
GSo
lves
a ca
pacit
y pr
oblem
that
requ
ires m
etric
conv
ersio
n
39Ja
son
mak
es sq
uare
jigsa
w p
uzzl
esN
AId
entifi
es sq
uare
num
bers
40At
the m
useu
m, O
lly m
easu
res
NA
Mul
tiplie
s a tw
o-di
git n
umbe
r by
a tw
o-di
git n
umbe
r
41Th
e lig
ht o
n on
e lig
htho
use fl
ashe
sN
ARe
cogn
ises t
he co
mm
on m
ultip
les o
f tw
o, tw
o-di
git n
umbe
rs
42To
com
pete
for a
n aw
ard,
20 st
uden
ts ra
nSP
Iden
tifies
the d
ata p
oint
s on
a dot
plo
t rep
rese
ntin
g gi
ven
crite
ria
KEY
N
= N
umbe
r and
Alg
ebra
MG
= M
easu
rem
ent a
nd G
eom
etry
SP =
Sta
tistic
s and
Pro
babi
lity

55NAPLAN 2019 Reporting Guide
Ye
ar
7 N
um
era
cy (
No
n-C
alc
ula
tor)
Ques
tion
Shor
t Des
crip
tion
Curri
culu
m
Area
Skill
ass
esse
d
1A
nne d
ownl
oads
a fil
m.
NA
Calcu
lates
a fra
ctio
n of
a qu
antit
y
2Em
ily h
as 60
iden
tical
tiles
.N
AD
ivid
es a
two-
digi
t num
ber b
y a o
ne-d
igit
num
ber w
here
ther
e is a
rem
aind
er
3Pa
ul is
buy
ing
head
phon
es.
NA
Com
pare
s pric
es in
volv
ing
diffe
rent
per
cent
age d
iscou
nts
4In
2017
, wor
kers
at an
offi
ce re
cord
edN
ASo
lves
a m
ulti-
step
prob
lem in
volv
ing
mul
tiplic
atio
n an
d di
visio
n
5Cl
ass 5
mea
sure
s the
out
side t
empe
ratu
reN
ACa
lculat
es th
e diff
eren
ce b
etw
een
two
decim
als
6Th
e Mur
ray
Rive
r is 2
508 k
ilom
etre
s lon
g.N
ACa
lculat
es th
e diff
eren
ce b
etw
een
two
four
-dig
it nu
mbe
rs
7A
sola
r pan
el sy
stem
on
a hou
se p
rodu
ces
NA
Mul
tiplie
s a d
ecim
al b
y a w
hole
num
ber
8Ch
en is
savi
ng to
buy
a ne
w cr
icket
bat
.N
ACo
ntin
ues a
pat
tern
resu
lting
from
addi
tion
Ye
ar
7 N
um
era
cy (
Ca
lcu
lato
r)
Ques
tion
Shor
t Des
crip
tion
Curri
culu
m
Area
Skill
ass
esse
d
1Re
ece w
orks
in a
anim
al sa
nctu
ary.
MG
Dete
rmin
es a
mas
s usin
g a k
itche
n sc
ales
2H
amish
reco
rded
the n
umbe
r of s
teps
SPIn
terp
rets
info
rmat
ion
in a
pict
ure g
raph
that
use
s man
y-to
-one
repr
esen
tatio
n
3H
enry
colle
cts b
ottle
s to
recy
cle.
NA
Solv
es a
prob
lem in
volv
ing
coun
ting
in m
ultip
les o
f 10
4A
n ar
t fes
tival
is h
eld ev
ery
two
year
s.N
AId
entifi
es ev
en n
umbe
rs
5Ru
by h
as a
smal
l jui
ce b
ox.
MG
Calcu
lates
a to
tal v
olum
e and
conv
erts
from
mill
ilitre
s to
litre
s
6Ra
y fin
ds p
art o
f a tr
easu
re m
ap.
MG
Iden
tifies
a lo
catio
n on
a m
ap u
sing
grid
refe
renc
es
7Th
is ta
ble s
how
s the
frac
tions
of t
he A
ustra
lian
NA
Iden
tifies
the l
owes
t uni
t fra
ctio
n fro
m a
set o
f uni
t fra
ctio
ns
8Su
ri re
cord
s the
win
gspa
n of
but
terfl
iesN
AId
entifi
es th
e dec
imal
clos
est t
o a g
iven
who
le nu
mbe
r
9Ka
ne u
ses t
his n
et to
mak
e a d
ice.
SPDe
scrib
es th
e pro
babi
lity
of an
even
t usin
g a f
ract
ion
10In
Dev
onpo
rt, th
ere a
re 30
604 p
eopl
e.N
AUs
es es
timat
ion
to ap
prox
imat
e the
solu
tion
to a
simpl
e wor
d-pr
oblem
11W
ill ro
lls h
is to
y ca
r dow
n a r
amp.
MG
Uses
a pr
otra
ctor
ove
rlaid
on
an im
age t
o m
easu
re an
acut
e ang
le
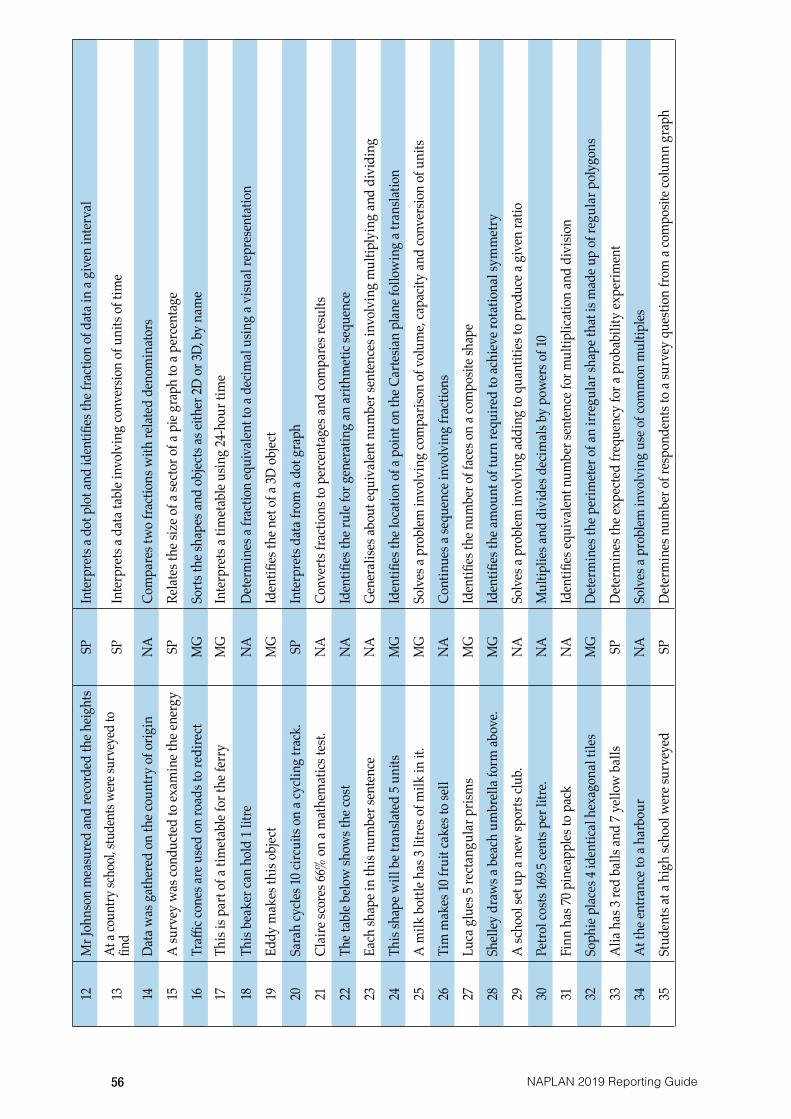
56 NAPLAN 2019 Reporting Guide
12M
r Joh
nson
mea
sure
d an
d re
cord
ed th
e heig
hts
SPIn
terp
rets
a dot
plo
t and
iden
tifies
the f
ract
ion
of d
ata i
n a g
iven
inte
rval
13At
a co
untry
scho
ol, st
uden
ts we
re su
rvey
ed to
fin
d SP
Inte
rpre
ts a d
ata t
able
invo
lvin
g co
nver
sion
of u
nits
of ti
me
14Da
ta w
as g
athe
red
on th
e cou
ntry
of o
rigin
NA
Com
pare
s tw
o fra
ctio
ns w
ith re
lated
den
omin
ator
s
15A
surv
ey w
as co
nduc
ted
to ex
amin
e the
ener
gy
SPRe
lates
the s
ize o
f a se
ctor
of a
pie
grap
h to
a pe
rcen
tage
16Tr
affic c
ones
are u
sed
on ro
ads t
o re
dire
ctM
GSo
rts th
e sha
pes a
nd o
bjec
ts as
eith
er 2D
or 3
D, b
y na
me
17Th
is is
part
of a
timet
able
for t
he fe
rry
MG
Inte
rpre
ts a t
imet
able
usin
g 24
-hou
r tim
e
18Th
is be
aker
can
hold
1 lit
reN
ADe
term
ines
a fra
ctio
n eq
uiva
lent t
o a d
ecim
al u
sing
a visu
al re
pres
enta
tion
19Ed
dy m
akes
this
objec
t M
GId
entifi
es th
e net
of a
3D o
bjec
t
20Sa
rah
cycle
s 10 c
ircui
ts on
a cy
cling
trac
k.SP
Inte
rpre
ts da
ta fr
om a
dot g
raph
21Cl
aire
scor
es 66
% o
n a m
athe
mat
ics te
st.N
ACo
nver
ts fra
ctio
ns to
per
cent
ages
and
com
pare
s res
ults
22Th
e tab
le be
low
show
s the
cost
NA
Iden
tifies
the r
ule f
or g
ener
atin
g an
arith
met
ic se
quen
ce
23Ea
ch sh
ape i
n th
is nu
mbe
r sen
tenc
eN
AGe
nera
lises
abou
t equ
ival
ent n
umbe
r sen
tenc
es in
volv
ing
mul
tiply
ing
and
divi
ding
24Th
is sh
ape w
ill b
e tra
nslat
ed 5
units
M
GId
entifi
es th
e loc
atio
n of
a po
int o
n th
e Car
tesia
n pl
ane f
ollo
win
g a t
rans
latio
n
25A
milk
bot
tle h
as 3
litre
s of m
ilk in
it.
MG
Solv
es a
prob
lem in
volv
ing
com
paris
on o
f vol
ume,
capa
city
and
conv
ersio
n of
uni
ts
26Ti
m m
akes
10 fr
uit c
akes
to se
llN
ACo
ntin
ues a
sequ
ence
invo
lvin
g fra
ctio
ns
27Lu
ca g
lues
5 re
ctan
gula
r pris
ms
MG
Iden
tifies
the n
umbe
r of f
aces
on
a com
posit
e sha
pe
28Sh
elley
dra
ws a
bea
ch u
mbr
ella
form
abov
e.M
GId
entifi
es th
e am
ount
of t
urn
requ
ired
to ac
hiev
e rot
atio
nal s
ymm
etry
29A
scho
ol se
t up
a new
spor
ts clu
b.N
ASo
lves
a pr
oblem
invo
lvin
g ad
ding
to q
uant
ities
to p
rodu
ce a
give
n ra
tio
30Pe
trol c
osts
169.5
cent
s per
litre
.N
AM
ultip
lies a
nd d
ivid
es d
ecim
als b
y po
wer
s of 1
0
31Fi
nn h
as 70
pin
eapp
les to
pac
kN
AId
entifi
es eq
uiva
lent n
umbe
r sen
tenc
e for
mul
tiplic
atio
n an
d di
visio
n
32So
phie
plac
es 4
iden
tical
hex
agon
al ti
lesM
GDe
term
ines
the p
erim
eter
of a
n irr
egul
ar sh
ape t
hat i
s mad
e up
of re
gula
r pol
ygon
s
33A
lia h
as 3
red
balls
and
7 yel
low
bal
ls SP
Dete
rmin
es th
e exp
ecte
d fre
quen
cy fo
r a p
roba
bilit
y ex
perim
ent
34At
the e
ntra
nce t
o a h
arbo
urN
ASo
lves
a pr
oblem
invo
lvin
g us
e of c
omm
on m
ultip
les
35St
uden
ts at
a hi
gh sc
hool
wer
e sur
veye
d SP
Dete
rmin
es n
umbe
r of r
espo
nden
ts to
a su
rvey
que
stion
from
a co
mpo
site c
olum
n gr
aph
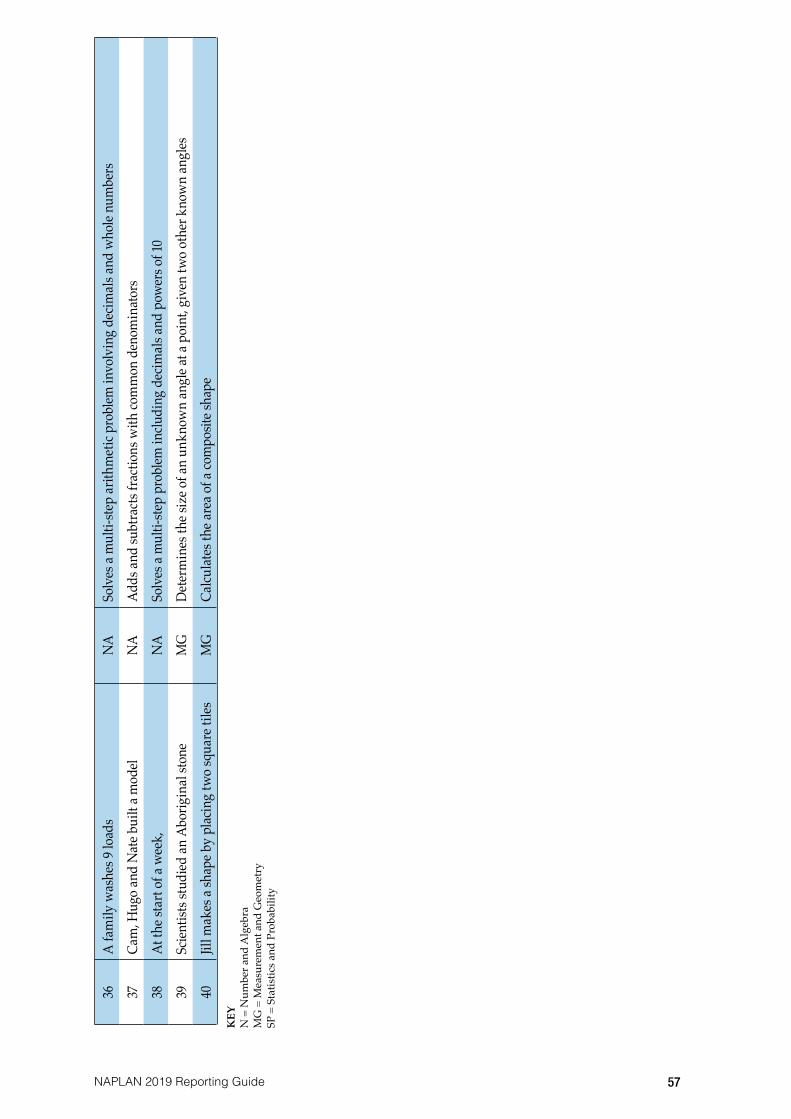
57NAPLAN 2019 Reporting Guide
36A
fam
ily w
ashe
s 9 lo
ads
NA
Solv
es a
mul
ti-ste
p ar
ithm
etic
prob
lem in
volv
ing
decim
als a
nd w
hole
num
bers
37Ca
m, H
ugo
and
Nat
e bui
lt a m
odel
NA
Adds
and
subt
ract
s fra
ctio
ns w
ith co
mm
on d
enom
inat
ors
38At
the s
tart
of a
wee
k,
NA
Solv
es a
mul
ti-ste
p pr
oblem
inclu
ding
dec
imal
s and
pow
ers o
f 10
39Sc
ientis
ts st
udied
an A
borig
inal
ston
eM
GDe
term
ines
the s
ize o
f an
unkn
own
angl
e at a
poi
nt, g
iven
two
othe
r kno
wn
angl
es
40Jil
l mak
es a
shap
e by
plac
ing
two
squa
re ti
lesM
GCa
lculat
es th
e are
a of a
com
posit
e sha
peK
EY
N =
Num
ber a
nd A
lgeb
raM
G =
Mea
sure
men
t and
Geo
met
rySP
= S
tatis
tics a
nd P
roba
bilit
y
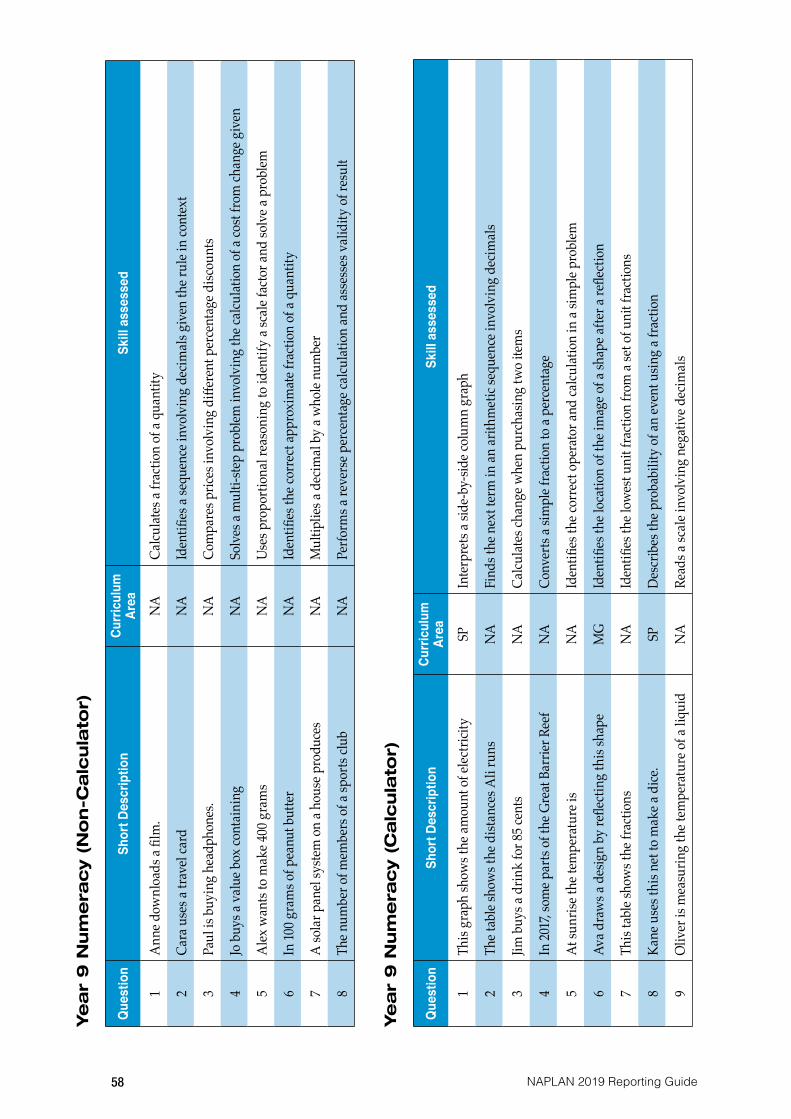
58 NAPLAN 2019 Reporting Guide
Ye
ar
9 N
um
era
cy (
No
n-C
alc
ula
tor)
Ques
tion
Shor
t Des
crip
tion
Curri
culu
m
Area
Skill
ass
esse
d
1A
nne d
ownl
oads
a fil
m.
NA
Calcu
lates
a fra
ctio
n of
a qu
antit
y
2Ca
ra u
ses a
trav
el ca
rdN
AId
entifi
es a
sequ
ence
invo
lvin
g de
cimal
s giv
en th
e rul
e in
cont
ext
3Pa
ul is
buy
ing
head
phon
es.
NA
Com
pare
s pric
es in
volv
ing
diffe
rent
per
cent
age d
iscou
nts
4Jo
buy
s a v
alue
box
cont
aini
ng
NA
Solv
es a
mul
ti-ste
p pr
oblem
invo
lvin
g th
e cal
culat
ion
of a
cost
from
chan
ge g
iven
5A
lex w
ants
to m
ake 4
00 g
ram
sN
AUs
es p
ropo
rtion
al re
ason
ing
to id
entif
y a s
cale
fact
or an
d so
lve a
pro
blem
6In
100 g
ram
s of p
eanu
t but
ter
NA
Iden
tifies
the c
orre
ct ap
prox
imat
e fra
ctio
n of
a qu
antit
y
7A
sola
r pan
el sy
stem
on
a hou
se p
rodu
ces
NA
Mul
tiplie
s a d
ecim
al b
y a w
hole
num
ber
8Th
e num
ber o
f mem
bers
of a
spor
ts clu
bN
APe
rform
s a re
vers
e per
cent
age c
alcu
latio
n an
d as
sess
es v
alid
ity o
f res
ult
Ye
ar
9 N
um
era
cy (
Ca
lcu
lato
r)
Ques
tion
Shor
t Des
crip
tion
Curri
culu
m
Area
Skill
ass
esse
d
1Th
is gr
aph
show
s the
amou
nt o
f elec
tricit
y SP
Inte
rpre
ts a s
ide-
by-si
de co
lum
n gr
aph
2Th
e tab
le sh
ows t
he d
istan
ces A
li ru
nsN
AFi
nds t
he n
ext t
erm
in an
arith
met
ic se
quen
ce in
volv
ing
decim
als
3Jim
buy
s a d
rink
for 8
5 cen
tsN
ACa
lculat
es ch
ange
whe
n pu
rcha
sing
two
item
s
4In
2017
, som
e par
ts of
the G
reat
Bar
rier R
eef
NA
Conv
erts
a sim
ple f
ract
ion
to a
perc
enta
ge
5At
sunr
ise th
e tem
pera
ture
is
NA
Iden
tifies
the c
orre
ct o
pera
tor a
nd ca
lculat
ion
in a
simpl
e pro
blem
6Av
a dra
ws a
des
ign
by re
flect
ing
this
shap
eM
GId
entifi
es th
e loc
atio
n of
the i
mag
e of a
shap
e afte
r a re
flect
ion
7Th
is ta
ble s
how
s the
frac
tions
NA
Iden
tifies
the l
owes
t uni
t fra
ctio
n fro
m a
set o
f uni
t fra
ctio
ns
8Ka
ne u
ses t
his n
et to
mak
e a d
ice.
SPDe
scrib
es th
e pro
babi
lity
of an
even
t usin
g a f
ract
ion
9Ol
iver
is m
easu
ring
the t
empe
ratu
re o
f a li
quid
NA
Read
s a sc
ale i
nvol
ving
neg
ativ
e dec
imal
s

59NAPLAN 2019 Reporting Guide
10In
Dev
onpo
rt, th
ere a
re 30
604 p
eoop
le.N
AUs
es es
timat
ion
to ap
prox
imat
e the
solu
tion
to a
simpl
e wor
d-pr
oblem
11Th
is is
part
of a
timet
able
for t
he fe
rry
MG
Inte
rpre
ts a t
imet
able
usin
g 24
-hou
r tim
e
12Th
e tab
le be
low
show
s the
cost
NA
Iden
tifies
the r
ule f
or g
ener
atin
g an
arith
met
ic se
quen
ce
13Ja
mil
has a
pho
to w
hich
is
MG
Calcu
lates
a di
men
sion
whe
n a s
hape
is en
larg
ed
14Do
ugla
s sta
rts w
alki
ng d
ue ea
st.M
GDe
term
ines
a co
mpa
ss d
irect
ion
give
n w
alki
ng in
struc
tions
15A
city
pla
nner
is m
odify
ing
the r
ound
abou
t M
GId
entifi
es th
e cor
resp
ondi
ng an
gle c
ondi
tion
requ
ired
for p
aral
lel li
nes
16Th
is gr
aph
show
s the
num
ber o
f peo
ple i
n Au
stral
ia,
SPIn
terp
rets
a lin
e gra
ph d
isplay
ing
seco
ndar
y da
ta
17Ti
m m
akes
10 fr
uit c
akes
to se
llN
ACo
ntin
ues a
sequ
ence
invo
lvin
g fra
ctio
ns
18A
scho
ol se
t up
a new
spor
ts clu
b.N
ASo
lves
a pr
oblem
invo
lvin
g ad
ding
to q
uant
ities
to p
rodu
ce a
give
n ra
tio
19Fi
ona p
lans
to co
mpl
ete t
he h
ikin
g tra
ilM
GCo
nver
ts be
twee
n m
etre
s and
kilo
met
res t
o de
term
ine a
dist
ance
20Th
is ste
m-a
nd-le
af p
lot s
how
s the
num
ber
SPRe
triev
es an
d in
terp
rets
data
from
a ste
m-a
nd-le
af p
lot
21Ti
m b
ough
t 11 c
ards
.SP
Calcu
lates
the a
vera
ge co
st of
11 it
ems
22A
bra
nd o
f spo
rts sh
oes h
as th
e fol
low
ing
SPCa
lculat
es th
e siz
e of a
sam
ple s
pace
23A
rect
angu
lar g
arde
n be
d is
6 met
res
MG
Calcu
lates
the v
olum
e of a
rect
angu
lar p
rism
in co
ntex
t, in
volv
ing
unit
conv
ersio
n
24A
50-c
ent c
oin
is co
mpo
sed
of co
pper
NA
Shar
es a
decim
al q
uant
ity in
a sim
ple r
atio
25Lu
cy h
as a
rect
angl
e and
a sq
uare
.M
GDe
term
ines
the d
imen
sions
of a
par
allel
ogra
m m
ade u
p of
a sq
uare
and
iden
tical
tria
ngles
26Pe
trol c
osts
169.5
cent
s per
litre
.N
AM
ultip
lies a
nd d
ivid
es d
ecim
als b
y po
wer
s of 1
0
27A
lice e
ats a
sand
wich
and
a bag
of c
hips
at lu
nch.
NA
Conv
erts
fract
ions
to p
erce
ntag
es to
solv
e a p
robl
em
28A
whe
el ha
s a d
iam
eter
of 3
0 cm
.M
GSo
lves
a pr
oblem
invo
lvin
g ca
lculat
ing
the c
ircum
fere
nce o
f a ci
rcle
in co
ntex
t
29A
piz
za re
staur
ant h
as a
deliv
ery
serv
ice.
NA
Inte
rpre
ts a f
orm
ula e
xpre
ssed
alge
brai
cally
30A
truc
k dr
iver
in W
este
rn A
ustra
lia p
lans
MG
Dete
rmin
es an
arriv
al ti
me g
iven
a sta
rt tim
e and
dur
atio
n
31Ea
rthqu
akes
are m
easu
red
usin
g N
ACo
mpa
res t
he si
ze o
f tw
o nu
mbe
rs g
iven
in in
dex n
otat
ion

60 NAPLAN 2019 Reporting Guide
32W
hen
view
ed fr
om th
e sid
e, M
GCa
lculat
es a
lengt
h us
ing
prop
ertie
s of t
riang
les
33At
the e
ntra
nce t
o a h
arbo
urN
ASo
lves
a pr
oblem
invo
lvin
g us
e of c
omm
on m
ultip
les
34A
fam
ily w
ashe
s 9 lo
ads
NA
Solv
es a
mul
ti-ste
p ar
ithm
etic
prob
lem in
volv
ing
decim
als a
nd w
hole
num
bers
35Fo
r a sc
ience
pro
ject,
Tim
mea
sure
sN
AId
entifi
es a
num
ber t
hat r
ound
s to
a giv
en n
umbe
r to
one d
ecim
al p
lace
36Sa
rah
starts
the fi
rst l
ap o
f a 10
-lap
go-k
art
SPId
entifi
es th
e gra
ph th
at m
atch
es w
orde
d de
scrip
tions
of t
he d
ata
37Se
lect t
he p
air o
f sim
ilar t
riang
les.
MG
Uses
angl
e pro
perti
es to
iden
tify
two
simila
r tria
ngles
38Su
ki m
akes
a re
gula
r hex
agon
MG
Dete
rmin
es th
e are
a of a
shap
e whe
n th
e sid
e len
gths
are d
oubl
ed
39At
the s
tart
of a
wee
k, K
ate h
adN
ASo
lves
a m
ulti-
step
prob
lem in
cludi
ng d
ecim
als a
nd p
ower
s of 1
0
40A
larg
e can
cont
ains
450 g
ram
s of s
oup
NA
Calcu
lates
the p
rice d
iffer
ence
, per
100 g
ram
s, in
a ‘b
est b
uy’ p
robl
em
KEY
N
= N
umbe
r and
Alg
ebra
MG
= M
easu
rem
ent a
nd G
eom
etry
SP =
Sta
tistic
s and
Pro
babi
lity
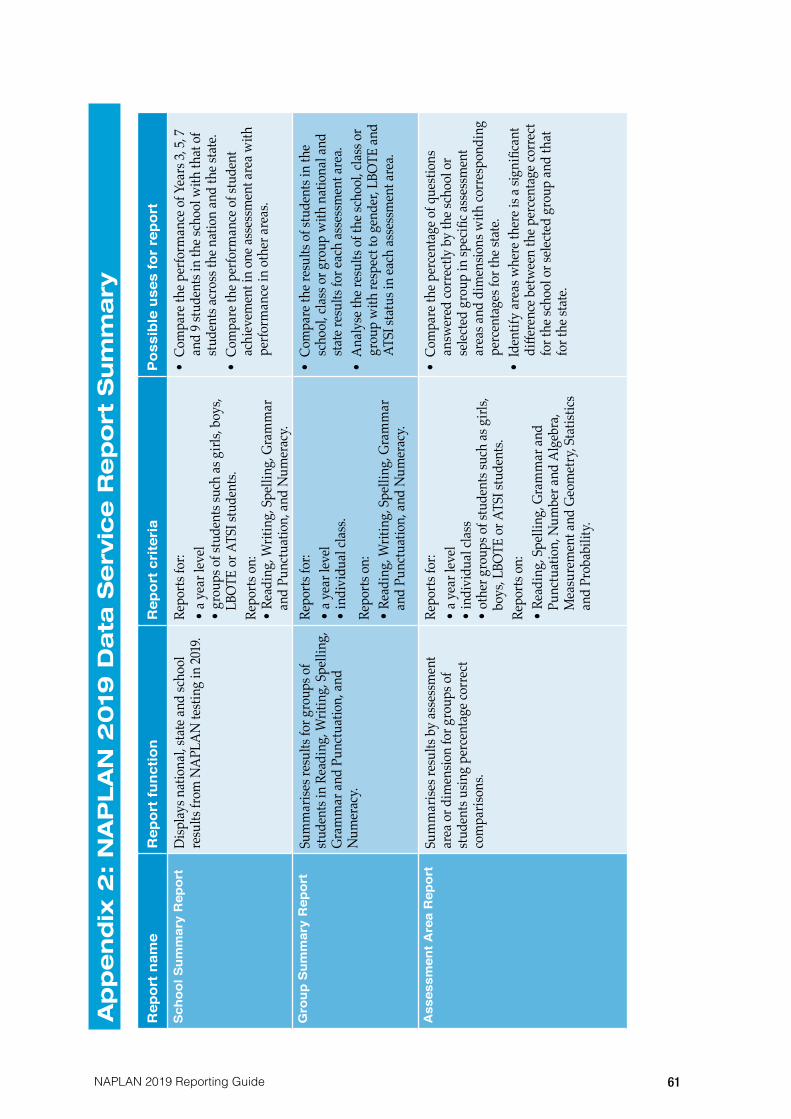
61NAPLAN 2019 Reporting Guide
Ap
pe
nd
ix 2
: N
AP
LA
N 2
019
Da
ta S
erv
ice
Re
po
rt S
um
ma
ry
Rep
ort n
ame
Rep
ort f
unct
ion
Rep
ort c
rite
ria
Pos
sibl
e us
es fo
r re
port
Sch
ool S
umm
ary
Rep
ort
Disp
lays n
atio
nal,
state
and
scho
ol
resu
lts fr
om N
APL
AN
testi
ng in
2019
.Re
ports
for:
• a y
ear l
evel
• gr
oups
of s
tude
nts s
uch
as g
irls,
boys
, LB
OTE
or A
TSI s
tude
nts.
Repo
rts o
n:•
Read
ing,
Writ
ing,
Spel
ling,
Gra
mm
ar
and
Punc
tuat
ion,
and
Num
erac
y.
• C
ompa
re th
e per
form
ance
of Y
ears
3, 5,
7 an
d 9 s
tude
nts i
n th
e sch
ool w
ith th
at o
f st
uden
ts ac
ross
the n
atio
n an
d th
e sta
te.
• C
ompa
re th
e per
form
ance
of s
tude
nt
achi
evem
ent i
n on
e ass
essm
ent a
rea w
ith
perfo
rman
ce in
oth
er ar
eas.
Gro
up S
umm
ary
Rep
ort
Sum
mar
ises r
esul
ts fo
r gro
ups o
f st
uden
ts in
Rea
ding
, Writ
ing,
Spel
ling,
Gr
amm
ar an
d Pu
nctu
atio
n, an
d
Num
erac
y.
Repo
rts fo
r:•
a yea
r lev
el•
indi
vidu
al cl
ass.
Repo
rts o
n:•
Read
ing,
Writ
ing,
Spel
ling,
Gra
mm
ar
and
Punc
tuat
ion,
and
Num
erac
y.
• C
ompa
re th
e res
ults
of st
uden
ts in
the
scho
ol, c
lass
or g
roup
with
nat
iona
l and
sta
te re
sults
for e
ach
asse
ssm
ent a
rea.
• A
naly
se th
e res
ults
of th
e sch
ool,
class
or
grou
p w
ith re
spec
t to
gend
er, L
BOTE
and
ATSI
stat
us in
each
asse
ssm
ent a
rea.
Ass
essm
ent A
rea
Rep
ort
Sum
mar
ises r
esul
ts by
asse
ssm
ent
area
or d
imen
sion
for g
roup
s of
stud
ents
usin
g pe
rcen
tage
corr
ect
com
paris
ons.
Repo
rts fo
r:•
a yea
r lev
el•
indi
vidu
al cl
ass
• ot
her g
roup
s of s
tude
nts s
uch
as g
irls,
boys
, LBO
TE o
r ATS
I stu
dent
s.Re
ports
on:
• Re
adin
g, Sp
ellin
g, G
ram
mar
and
Punc
tuat
ion,
Num
ber a
nd A
lgeb
ra,
Mea
sure
men
t and
Geo
met
ry, S
tatis
tics
and
Prob
abili
ty.
• C
ompa
re th
e per
cent
age o
f que
stion
s an
swer
ed co
rrec
tly b
y th
e sch
ool o
r se
lecte
d gr
oup
in sp
ecifi
c ass
essm
ent
area
s and
dim
ensio
ns w
ith co
rres
pond
ing
perc
enta
ges f
or th
e sta
te.
• Id
entif
y ar
eas w
here
ther
e is a
sign
ifica
nt
diffe
renc
e bet
wee
n th
e per
cent
age c
orre
ct
for t
he sc
hool
or s
elect
ed g
roup
and
that
fo
r the
stat
e.

NAPLAN 2019 Reporting Guide 62
Rep
ort n
ame
Rep
ort f
unct
ion
Rep
ort c
rite
ria
Pos
sibl
e us
es fo
r re
port
Wri
ting
Cri
teri
a R
epor
tSu
mm
arise
s gro
up p
erfo
rman
ces o
n th
e Writ
ing
test.
Bar
gra
phs s
how
th
e Writ
ing
scor
e dist
ribut
ion
for
the g
roup
for e
ach
of th
e ten
crite
ria
agai
nst w
hich
the W
ritin
g te
st w
as
asse
ssed
.
Repo
rts fo
r:•
a yea
r lev
el•
indi
vidu
al cl
ass
• ot
her g
roup
s of s
tude
nts s
uch
as g
irls,
b
oys,
LBO
TE o
r ATS
I stu
dent
s.
Repo
rts o
n:•
Audi
ence
, Tex
t Stru
ctur
e, Id
eas,
C
hara
cter
& S
ettin
g, V
ocab
ular
y,
Coh
esio
n, P
arag
raph
ing,
Sen
tenc
e S
truct
ure,
Punc
tuat
ion
and
Spel
ling.
• Co
mpa
re th
e dist
ribut
ion
of sc
hool
scor
es
with
the d
istrib
utio
n of
nat
iona
l and
stat
e-
wid
e sco
res f
or ea
ch o
f the
ten
asse
ssed
w
ritin
g cr
iteria
. •
Prov
ide d
ata f
or an
alys
ing
stud
ent w
ritin
g b
y cr
iterio
n, an
d id
entif
y ar
eas o
f rela
tive
stre
ngth
or w
eakn
ess.
Item
Ana
lysi
s R
epor
tPr
ovid
es d
istra
ctor
anal
ysis,
inclu
ding
pe
rcen
tage
corr
ect a
nd d
escr
iptio
ns o
f sk
ill as
sess
ed fo
r eac
h ite
m.
The r
epor
t can
now
be a
cces
sed
both
in
tabu
lar a
nd g
raph
ical f
orm
ats.
Repo
rts fo
r:•
a yea
r lev
el•
indi
vidu
al cl
ass
• ot
her g
roup
s of s
tude
nts s
uch
as g
irls,
b
oys,
LBO
TE o
r ATS
I stu
dent
s.
Repo
rts o
n:•
Read
ing,
Spel
ling,
Gra
mm
ar an
d
Pun
ctua
tion,
and
Num
erac
y. Ca
n be
ord
ered
by:
• Ite
m n
umbe
r•
% co
rrec
t Nat
iona
l•
% co
rrec
t Sta
te•
% co
rrec
t Gro
up•
Skill
.
• Fo
r eac
h te
st ite
m, c
ompa
re th
e per
cent
age
of s
tude
nts i
n th
e sele
cted
scho
ol
gro
up w
ho an
swer
ed co
rrec
tly w
ith
the
corr
espo
ndin
g na
tiona
l and
stat
e p
erce
ntag
es.
• Co
mpa
re th
e dist
ribut
ion
of re
spon
ses
fro
m st
uden
ts in
the s
elect
ed sc
hool
g
roup
to ea
ch it
em ac
ross
all a
ltern
ativ
es in
m
ultip
le ch
oice
item
s to
the c
orre
spon
ding
d
istrib
utio
ns fo
r the
nat
ion
and
the s
tate
. •
Prov
ide d
ata f
or an
alys
ing
parti
cula
r a
reas
of r
elativ
e stre
ngth
or w
eakn
ess f
or
ind
ivid
ual s
tude
nts o
r gro
ups o
f stu
dent
s b
y di
men
sion
or b
y sk
ill as
sess
ed.

63NAPLAN 2019 Reporting Guide
Rep
ort n
ame
Rep
ort f
unct
ion
Rep
ort c
rite
ria
Pos
sibl
e us
es fo
r re
port
Stu
dent
Res
pons
e R
epor
tId
entifi
es co
rrec
t and
inco
rrec
t re
spon
ses t
o in
divi
dual
item
s for
each
st
uden
t in
a gro
up b
y di
men
sion.
Su
mm
arise
s gro
up p
erfo
rman
ces o
n in
divi
dual
item
s.
Repo
rts fo
r:•
an in
divi
dual
stud
ent
• a y
ear l
evel
• in
divi
dual
clas
ses
• ot
her g
roup
s of s
tude
nts s
uch
as g
irls,
boys
, LBO
TE o
r ATS
I stu
dent
s.
Repo
rts o
n:•
Read
ing,
Spel
ling,
Gra
mm
ar an
d Pu
nctu
atio
n, an
d N
umer
acy.
• Id
entif
y ite
ms a
nsw
ered
corr
ectly
and
inco
rrec
tly b
y in
divi
dual
stud
ents.
• Id
entif
y pa
ttern
s of i
ncor
rect
resp
onse
s for
in
divi
dual
stud
ents
or g
roup
s of s
tude
nts
to h
ighl
ight
curr
iculu
m ar
eas w
hich
may
ne
ed at
tent
ion.
• A
naly
se st
uden
t res
pons
es to
help
di
agno
se u
nder
stand
ing
of p
artic
ular
co
ncep
ts.•
Pro
vide
evid
ence
bas
ed in
form
atio
n to
he
lp te
ache
rs in
form
par
ents
abou
t the
ir ch
ild’s
gras
p of
par
ticul
ar co
ncep
ts or
cu
rricu
lum
area
s.S
tude
nt A
chie
vem
ent
Leve
l Rep
ort
Sum
mar
ises a
chiev
emen
t lev
els f
or
indi
vidu
al st
uden
ts by
out
com
es an
d re
flect
s inf
orm
atio
n on
the p
aren
t re
ports
.
This
can
be in
:•
grap
hica
l for
mat
(box
plo
ts)•
tabu
lar f
orm
at (l
ists n
umer
ic va
lues
).
Repo
rts fo
r:•
an in
divi
dual
stud
ent
• a y
ear l
evel
• in
divi
dual
clas
ses
• ot
her g
roup
s of s
tude
nts s
uch
as g
irls,
boys
, LBO
TE o
r ATS
I stu
dent
s.
Repo
rts o
n:•
Read
ing,
Writ
ing,
Spel
ling,
Gra
mm
ar
and
Punc
tuat
ion,
and
Num
erac
y.
• C
ompa
re th
e ach
ievem
ent o
f ind
ivid
ual
stud
ents
acro
ss al
l ass
essm
ent a
reas
.•
Iden
tify
whe
re in
divi
dual
stud
ents’
resu
lts
fit w
ith re
spec
t to
the d
istrib
utio
n of
re
sults
acro
ss th
e nat
ion.
• P
rovi
de a
subs
titut
e Stu
dent
Rep
ort f
or
pare
nts i
f req
uire
d. T
he re
port
mus
t be
run
on th
e nat
iona
l sca
le fo
r “A
ll”
stud
ents
for t
his t
o re
flect
the a
ctua
l St
uden
t Rep
ort.
Five
Yea
r Tr
end
Rep
ort
Disp
lays n
atio
nal,
state
and
scho
ol
resu
lts fo
r NA
PLA
N te
sts o
ver t
ime
(201
5 - 20
19).
Repo
rts fo
r:•
a yea
r lev
el•
grou
ps o
f stu
dent
s suc
h as
girl
s, bo
ys,
LBO
TE o
r ATS
I stu
dent
s.
Repo
rts o
n:
• Re
adin
g, W
ritin
g, Sp
ellin
g, G
ram
mar
an
d Pu
nctu
atio
n, an
d N
umer
acy.
• C
ompa
re th
e dist
ribut
ion
of n
atio
nal,
state
an
d sc
hool
NA
PLA
N re
sults
ove
r tim
e•
Com
pare
nat
iona
l, sta
te an
d sc
hool
scal
ed
scor
e mea
ns o
ver t
ime.
• Id
entif
y tre
nds i
n na
tiona
l, sta
te an
d sc
hool
NA
PLA
N re
sults
ove
r tim
e.
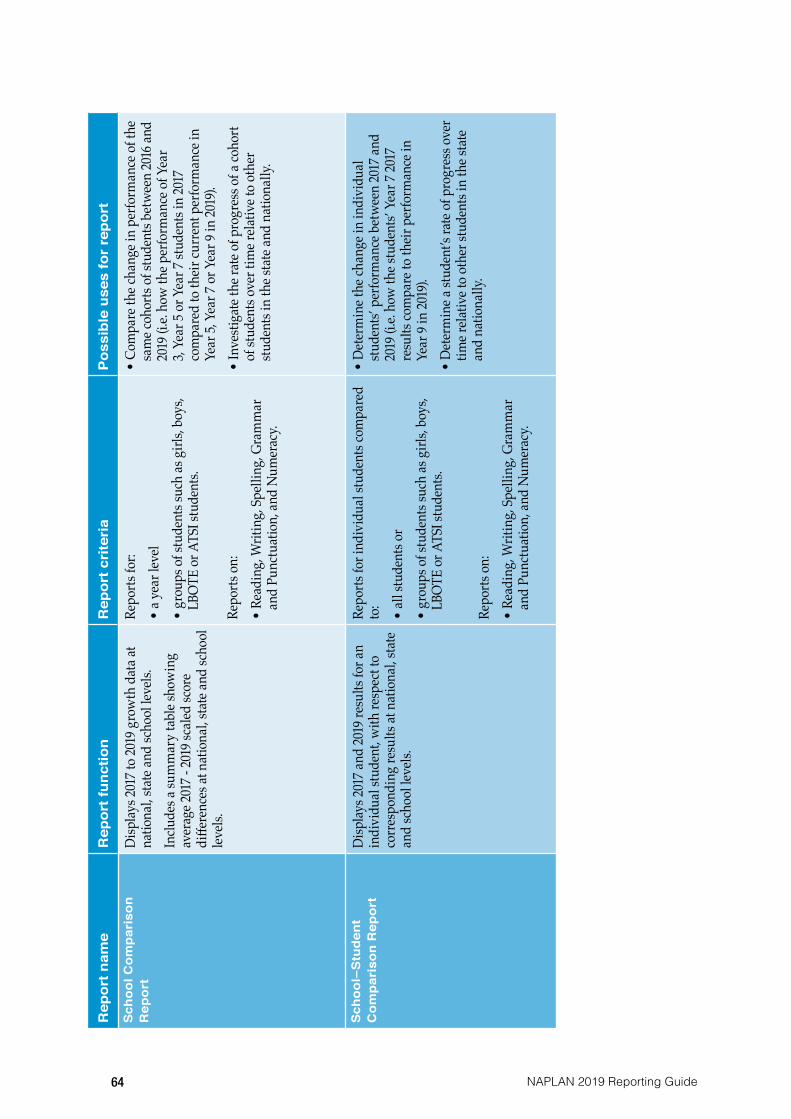
NAPLAN 2019 Reporting Guide 64
Rep
ort n
ame
Rep
ort f
unct
ion
Rep
ort c
rite
ria
Pos
sibl
e us
es fo
r re
port
Sch
ool C
ompa
riso
n R
epor
tD
isplay
s 201
7 to
2019
gro
wth
dat
a at
natio
nal,
state
and
scho
ol le
vels.
Inclu
des a
sum
mar
y ta
ble s
how
ing
aver
age 2
017 -
2019
scal
ed sc
ore
diffe
renc
es at
nat
iona
l, sta
te an
d sc
hool
lev
els.
Repo
rts fo
r:•
a yea
r lev
el•
grou
ps o
f stu
dent
s suc
h as
girl
s, bo
ys,
L
BOTE
or A
TSI s
tude
nts.
Repo
rts o
n:•
Read
ing,
Writ
ing,
Spel
ling,
Gra
mm
ar
and
Pun
ctua
tion,
and
Num
erac
y.
• Co
mpa
re th
e cha
nge i
n pe
rform
ance
of t
he
sam
e coh
orts
of st
uden
ts be
twee
n 20
16 an
d
201
9 (i.e
. how
the p
erfo
rman
ce o
f Yea
r
3, Y
ear 5
or Y
ear 7
stud
ents
in 20
17
com
pare
d to
thei
r cur
rent
per
form
ance
in
Yea
r 5, Y
ear 7
or Y
ear 9
in 20
19).
• In
vesti
gate
the r
ate o
f pro
gres
s of a
coho
rt
of s
tude
nts o
ver t
ime r
elativ
e to
othe
r s
tude
nts i
n th
e sta
te an
d na
tiona
lly.
Sch
ool–
Stu
dent
C
ompa
riso
n R
epor
tD
isplay
s 201
7 and
2019
resu
lts fo
r an
indi
vidu
al st
uden
t, w
ith re
spec
t to
corr
espo
ndin
g re
sults
at n
atio
nal,
state
an
d sc
hool
leve
ls.
Repo
rts fo
r ind
ivid
ual s
tude
nts c
ompa
red
to:
• al
l stu
dent
s or
• gr
oups
of s
tude
nts s
uch
as g
irls,
boys
,
LBO
TE o
r ATS
I stu
dent
s.
Repo
rts o
n:•
Read
ing,
Writ
ing,
Spel
ling,
Gra
mm
ar
and
Pun
ctua
tion,
and
Num
erac
y.
• De
term
ine t
he ch
ange
in in
divi
dual
s
tude
nts’
perfo
rman
ce b
etw
een
2017
and
2
019 (
i.e. h
ow th
e stu
dent
s’ Ye
ar 7
2017
r
esul
ts co
mpa
re to
thei
r per
form
ance
in
Yea
r 9 in
2019
).•
Dete
rmin
e a st
uden
t’s ra
te o
f pro
gres
s ove
r t
ime r
elativ
e to
othe
r stu
dent
s in
the s
tate
a
nd n
atio
nally
.

65NAPLAN 2019 Reporting Guide
Rep
ort n
ame
Rep
ort f
unct
ion
Rep
ort c
rite
ria
Pos
sibl
e us
es fo
r re
port
Rel
ativ
e G
row
th R
epor
tD
isplay
s 201
7 to
2019
com
para
tive
grow
th (H
igh,
Med
ium
or L
ow) f
or
each
stud
ent w
ith re
spec
t to
‘sim
ilar
stud
ents’
(tho
se w
ith th
e sam
e 201
7 sc
ore).
Th
e rep
ort i
s ava
ilabl
e in:
• ta
bula
r for
mat
(list
s ind
ivid
ual
stu
dent
s)•
grap
hica
l for
mat
(pro
vide
s sum
mar
y i
nfor
mat
ion
abou
t the
per
cent
age o
f s
tude
nts i
n ea
ch g
row
th ca
tego
ry).
Repo
rts fo
r:•
all s
tude
nts
• in
divi
dual
clas
ses
• st
uden
ts fro
m a
selec
ted
grow
th
cat
egor
y.
Repo
rts o
n:•
Read
ing,
Writ
ing,
Spel
ling,
Gra
mm
ar
and
Pun
ctua
tion,
and
Num
erac
y.
Can
be o
rder
ed b
y:•
2017
stud
ent s
core
• 20
19 st
uden
t sco
re
• st
uden
t nam
e.
• C
ompa
re st
uden
t gro
wth
bet
wee
n N
APL
AN
testi
ng p
erio
ds w
ith th
at o
f sim
ilar s
tude
nts.
• Id
entif
y if
ther
e are
par
ticul
ar st
uden
t ab
ility
gro
ups w
here
hig
h re
lativ
e gro
wth
ha
s bee
n ac
hiev
ed co
mpa
red
to si
mila
r st
uden
ts.•
Iden
tify
if th
ere a
re p
artic
ular
stud
ents
or st
uden
t abi
lity
grou
ps w
here
onl
y lo
w re
lativ
e gro
wth
has
bee
n ac
hiev
ed
com
pare
d to
sim
ilar s
tude
nts.
Tran
sitio
nal R
elat
ive
Gro
wth
Rep
ort
Show
s 201
7 to
2019
relat
ive g
row
th
cate
gorie
s (H
igh,
Med
ium
or L
ow) f
or
the s
choo
l coh
ort o
f Yea
r 5 st
uden
ts at
the s
choo
l in
2017
who
hav
e tra
nsiti
oned
to Y
ear 7
at a
diffe
rent
sc
hool
.Th
e rep
ort i
s ava
ilabl
e in
• gr
aphi
cal f
orm
at o
nly
The r
epor
t is a
cces
sed
from
the 2
017
Year
5 m
enu.
Repo
rts fo
r•
Year
5 gr
oup
level
only
Repo
rts o
n:
• Re
adin
g, W
ritin
g, Sp
ellin
g, G
ram
mar
a
nd P
unct
uatio
n, an
d N
umer
acy.
• R
eview
and
asse
ss th
e sch
ool’s
Yea
r 5 an
d 6 T
each
ing
and
Lear
ning
pro
gram
s with
re
spec
t the
relat
ive g
row
th ac
hiev
ed in
cu
rren
t NA
PLA
N re
sults
by
the g
roup
of
stud
ents
who
hav
e rec
ently
tran
sitio
ned
to
Year
7 at
a di
ffere
nt sc
hool
.

NAPLAN 2019 Reporting Guide 66
Glossary
Data presentation
Scaled scores and the National Assessment Program scale
Nationally, student outcomes are provided as a scaled score. These scores range from 0 to 1000, and form the numeric continuum from which the ten national reporting bands are derived (see pages 2-3).
Where appropriate, the NAPLAN Data Service displays summary statistics and individual student outcomes as scaled scores, and the distribution of results as box-and-whisker graphs plotted against the reporting bands.
• Year 3 - results will be reported in Band 1 to Band 6• Year 5 - results will be reported in Band 3 to Band 8• Year 7 - results will be reported in Band 4 to Band 9• Year 9 - results will be reported in Band 5 to Band 10.
Box-and-whisker (box plot) format
Some NAPLAN reports use a box-and-whisker format to represent the range of student achievement in the specified criterion.
The shaded box represents the middle 50 per cent of the student scores for the particular group. The middle score (median) for the group is shown by the black bar.
The box plus line segments (whiskers) show the range of scores achieved by the middle 80 per cent of the group.
‘Percentile’ refers to ranking a group on a 0 to 100 (percentage) scale. Students in the 90th percentile will have a performance which is equal to or better than 90 per cent of the particular group to which the data refers.
Median
The median or mid-score (50th percentile) is the value where half the scores are above it and half below it (e.g. the median of 8, 9, 11, 14, 15, 16, 18 is 14).
Mean
The mean (or average) is the total of scores for all members of the group divided by the number of members in that group (e.g. the mean of 8, 9, 11, 14, 15, 16, 18 is 13).
Standard deviation
Standard deviation (SD) is a measure of the spread of scores around the mean. A larger SD indicates a wider spread of scores. The range of + or – one SD either side of the mean contains about 68 per cent of scores, and + or – two SDs either side of the mean contains about 95 per cent of scores.

67NAPLAN 2019 Reporting Guide
Standard error (se) of the mean
Assessment results data is always subject to a degree of uncertainty, due to the fact that, for a variety of reasons, some students will do a little better or a little worse than they perhaps could have or should have on a single assessment. In very large groups, these fluctuations tend to average out, but in smaller groups they can be significant. The standard error (se) of the mean provides a measure of this uncertainty, and can be used to generate a confidence interval for the mean. A 95% confidence interval for the school mean is given by mean ± 2 x se(mean).