NAIMCR Estudio de Emplazamiento y Plan Maestro -...
61
NAIMCR Estudio de Emplazamiento y Plan Maestro Executive Summary May 16th 2017 COCESNA
Transcript of NAIMCR Estudio de Emplazamiento y Plan Maestro -...

NAIMCR Estudio de Emplazamiento y Plan Maestro
Executive Summary
May 16th 2017
COCESNA


NAIMCR RE 02 Mott MacDonald
Mott MacDonald Mott MacDonald House 8-10 Sydenham Road Croydon CR0 2EE United Kingdom T +44 (0)20 8774 2000 F +44 (0)20 8681 5706 mottmac.com
COCESNA NAIMCR Estudio de
Emplazamiento y Plan Maestro
Executive Summary
May 16th 2017
Mott MacDonald Limited. Registered in England and Wales no. 1243967. Registered office: Mott MacDonald House, 8-10 Sydenham Road, Croydon CR0 2EE, United Kingdom
COCESNA


Mott MacDonald | NAIMCR Estudio de Emplazamiento y Plan Maestro Executive Summary
NAIMCR | RE | 02 | May 16th 2017
Issue and Revision Record
Revision Date Originator Checker Approver Description
01 25/04/2017
HR LG HR Informe Preliminar
02 16/05/2017
HR LG HR Informe Final
Document reference: NAIMCR | RE | 02
Information class: Standard
This document is issued for the party which commissioned it and for specific purposes connected with the above-
captioned project only. It should not be relied upon by any other party or used for any other purpose.
We accept no responsibility for the consequences of this document being relied upon by any other party, or being
used for any other purpose, or containing any error or omission which is due to an error or omission in data supplied
to us by other parties.
This document contains confidential information and proprietary intellectual property. It should not be shown to other
parties without consent from us and from the party which commissioned it.
This report has been pr epared sol el y for use by the party which commissi oned it (the ‘Client’) i n connecti on with the capti oned proj ect. It should not be used for any other purpose. N o person other than the Client or any party who has expressl y agreed ter ms of r eliance with us (the ‘Reci pient(s)’) may rel y on the content, i nformati on or any vi ews expressed i n the repor t. We accept no duty of care, responsi bility or liability to any other r eci pient of thi s document. This r eport is confi denti al and contains pr opri etar y intell ectual property.
No representati on, warranty or under taki ng, expr ess or i mplied, is made and no responsi bility or liability is accepted by us to any party other than the Cli ent or any Reci pient(s), as to the accuracy or completeness of the i nformati on contai ned i n this r eport. For the avoidance of doubt this r eport does not in any way purport to i nclude any legal , insur ance or fi nanci al advice or opi nion.
We disclai m all and any liability whether arising i n tort or contrac t or other wise which it might otherwise have to any party other than the Cli ent or the Reci pient(s), in r espect of this report , or any infor mation attri buted to i t.
We accept no r esponsibility for any error or omission i n the r eport which is due to an error or omission i n data, infor mation or statements supplied to us by other par ties incl udi ng the client (‘D ata’). We have not i ndependentl y verified such D ata and ha ve assumed it to be accurate, complete, reli abl e and current as of the date of such infor mation.
Forecasts presented i n this document were pr epared usi ng Data and the report is dependent or based on D ata. Inevitabl y, some of the assumptions used to develop the for ecasts will not be realised and unantici pated events and circumstances may occur. C onsequentl y M ott MacDonal d does not guarantee or warr ant the concl usi ons contained i n the repor t as there are li kel y to be differ ences between the for ecas ts and the ac tual results and those di ffer ences may be material. Whil e we consi der that the infor mation and opini ons gi ven i n this r eport are sound all parti es must rel y on their own skill and j udgement when making use of it .
Under no circumstances may this report or any extr act or summar y ther eof be used in connection wi th any public or pri vate securities offering i ncluding any rel ated memorandum or prospectus for any securities offering or stock exchange listing or announcement.

Mott MacDonald | NAIMCR Estudio de Emplazamiento y Plan Maestro Executive Summary
NAIMCR | RE | 02 | May 16th 2017
Contents
1 Glossary of Terms. 7
2 Introduction 8
3 Activity 1. Inventory of Current Conditions and Initial Meetings 12
4 Activity 2. Traffic Forecast 14
5 Activity 3. Preliminary Engineering Studies and Environmental Assesment 18
5.1 Land Use 18
5.2 Environmental and Socio economic study 21
5.2.1 Hydraulics study 21
5.2.2 Environmental studies 22
5.2.3 Social and economic impact 24
5.3 Landside access 29
5.3.1 Roads: 29
5.3.2 Rail: 36
6 Activity 4. Facility Requirements 38
6.1 Runways: 39
6.2 Commercial Aircraft Aprons: 40
6.3 Passenger Terminal: 40
6.4 Cargo Terminal: 42
6.5 Ancillary facilities: 42
7 Activity 5. Airport Development Optioneering 43
8 Activity 6. Development Plan 48
9 Activity 7. Preliminary Business Plan 54
9.1 CAPEX 54
9.2 Implementation Strategy 55
9.3 Financial Model and Business Plan 55
9.4 Feasibility 58
10 Conclusions 59

Mott MacDonald | NAIMCR Estudio de Emplazamiento y Plan Maestro Executive Summary
7
1 Glossary of Terms.
ACRP-Airport Cooperative Research Program
ACI-Airports Council International
ADRM-Airport Development Reference Manual (IATA)
AHP-Aeronave Hora Punta (Peak Hour Aircraft)
AIJS-Aeropuerto Internacional Juan Santamaría
CAT I- Category I
DGAC-Dirección General de Aviación Civil
FAA-Federal Aviation Administration
GAM-Gran Región Metropolitana (Great Metropolitan Region)
IFA-Índice de Fragilidad Ambiental (Environmental Fragility Index)
MARS –Multiple Apron Ramp System
MIDT- Market Information Data Tapes (Traffic Database)
MPPA – Millions of Passengers Per Annum
NAIMCR- New International Metropolitan Airport for Costa
NFPA-National Fire Protection Agency (USA)
MD-Maximum Development
OACI-International Civil Aviation Organization
OP-Public Works
APP-Public Private Partnership
PIB-Gross Internal Product
RPK – Revenue Passenger Kilometre (Traffic measure)
SEI-Crash Fire and Rescue Service
TRB-Transport Research Board
ZE-Implementation Site

Mott MacDonald | NAIMCR Estudio de Emplazamiento y Plan Maestro Executive Summary
8
2 Introduction
The Contract No. 03-2015 PG-COCESNA, hereinafter the "Agreement", was signed on the 16th
of May 2016, between COCESNA, and Mott MacDonald Limited. Mott MacDonald has been
supported by a team of recognized consulting companies in the sector. These companies include
the Costa Rican firms Gensler Architects and FSA and the Spanish consultant EnRoute
The contract signature and project kick-off was formalized on May 18, 2016 (OFICIO PE 060-
2016). According to the Contract and the schedule presented by Mott MacDonald, the maximum
duration of the contract provided for in the contract is twelve (12) months. These are counted from
the signing of the order of commencement of the consulting contract, up to the delivery of the final
report, no later than May 17, 2017.
The purpose of the Contract is to prepare a Feasibility Study and Master Plan for the Nuevo
Aeropuerto Internacional Metropolitano de Costa Rica (NAIMCR), to be built in the canton of
Orotina, Provincia of Alajuela. This region was designated by several previous studies as the
most suitable area for the construction of the new airport of Cost Rica, which will replace the
current Juan Santamaría International Airport (AIJS).
The new airport can be defined based on 6 different elements that shape the demand and impact
on the development of the airport for the future. These six elements are key to take advantage of
the potential development of the airport that must serve as a tool for the country's development.
Figure 2.1: Key aspects to define the new Aeropuerto Metropolitano
Source: Mott MacDonald
Considering these aspects, the vision and objectives of this project have been clearly defined as
below:

Mott MacDonald | NAIMCR Estudio de Emplazamiento y Plan Maestro Executive Summary
9
Figure 2: Vision and Objectives of the new Aeropuerto Metropolitano
With regard to the master plan it is possible to say that:
The Master Plan should be conceived as a flexible, coherent and comprehensive guide, designed
to implement the mission of providing the necessary aeronautical infrastructure and realizing the
vision of the country. The Master Plan should be read and understood as a living document, a
reference for administrative management, being more a general approach of direction, guideline
and maneuver than an inflexible plan. It contains options and phases, presenting realistic
construction and investment programs that are conceptually and practically feasible, which are
open to the consideration of alternatives that will be decided at the last design stage according to
the most appropriate technology at that moment.
The Master Plan has to be prepared with ample flexibility to respond in an agile and direct way to
the requirements of the country's growth, depending on the behavior of demand, regional
competition and technological advances in the field of aviation.
In this sense, the behavior of the demand of passengers and cargo will be the factor determining
the programming, execution and speed of the investment stages that are proposed. The
implementation of this Master Plan is governed more by the behavior of the market, transportation
technology and competition, than by specific scheduled dates.
The project, which is fully aligned with the country's future vision and growth strategies, will serve
as the basis for the investment decisions to be adopted by the Government of Costa Rica for the
new international airport of the country. It is expected to unite the political wills to declare the
public interest for this project in the selected area and to initiate the subsequent processes that
mainly involve the acquisition of land, its preparation by executing the earthworks, and the
facilitation of access and services to the site.
The new airport of Costa Rica should become a key factor for the country’s growth and the
implementation of the vision for a green and sustainable future for Costa Rica. It should also
improve the international connectivity of the airport and help to consolidate the metropolitan area
of San Jose with the rest of the country.
To convert the airport into the flag that shows the general objective of national development for
Costa Rica.
To promote Costa Rica as a sustainable air transport development center for Central America.
Airport to attract new foreign investment aspiring the role of logistics center for Central America.
Physical and urban development of the airport integrated into the territory and its environment.
Favoring the creation of local employment and promoting the appropriate training for the different
employment profiles.
Construction of the airport following criteria of sustainability and seeking to integrate the suitable
technologies for its efficient operation.

Mott MacDonald | NAIMCR Estudio de Emplazamiento y Plan Maestro Executive Summary
10
It is to be noted that, after meteorological and aeronautical studies, the consulting team confirms
the previous studies and develops the predicted location of the airport in the canton of Orotina as
the most convenient and feasible option.
Figure 2.2: Project localization
Source: Mott MacDonald
Figure 2.3: View of the site
Source: Mott MacDonald

Mott MacDonald | NAIMCR Estudio de Emplazamiento y Plan Maestro Executive Summary
11
The Project has been structured in the following activities according to the Scope of Services:
● Activity 1. Inventory of current conditions and initial meetings
● Activity 2. Estimation of air demand.
● Activity 3. Preliminary Engineering Study and Environmental Assessment
● Activity 4. Analysis of requirements
● Activity 5. Conceptual Development Alternatives
● Activity 6. Airport Development Plan
● Activity 7. Preliminary Business Plan
The final report can be divided into three thematic sections. The first one deals with t existing
conditions as well as the market conditions and its future projections, taking into account the
geographical and environmental aspects that might affect the development of the project.
This stage of the project was developed primarily during 2016 and comprises activities 1 to 3.
The second stage is the master planning phase itself. It starts with the analysis of the
requirements (as a function of the expected demand), and ends with the conceptual development
of the alternatives and the different options to satisfy the demand.
Once the most favorable and convenient alternative is selected, the final phase consists of the
planning the development in stages generating the corresponding plans that serve as a graphic
expression of the infrastructure that results from the operational requirements.
Finally, the last stage, condensed in activity number 7, includes the economic expression of
development. That is the fundamental basis of the feasibility of the project and the guide for the
political and budgetary actions of the Government of Costa Rica in pursuit of the desired
development.
The activities have been developed following a strict mechanics of workshops. These took place
at least once a month, involving the consulting team and a technical commission composed of
members of civil aviation who participated throughout the process under the guide of the Sr.
Delegate of Costa Rica before COCESNA, Dr. Carlos Segnini and the Sr. Vice-president of
COCESNA, Dn. Eduardo Montero. We thank both for their contribution during the debates as well
as for the constructive criticism exercised in the framework of their functions.
Below is the executive summary activity by activity.

Mott MacDonald | NAIMCR Estudio de Emplazamiento y Plan Maestro Executive Summary
12
3 Activity 1. Inventory of Current Conditions
and Initial Meetings
This technical report has been the first of a series of reports which are integrated in the final report
of the "Survey of the Site and Master Plan" of the new airport.
It is important to note that, with the exception of geotechnical and topographic data obtained
through measurements and studies carried out by the consultant itself, an important volume of
information has been obtained from other sources (in general, organisations belonging to the
Costa Rican Government). The consultant has accepted the accuracy and correctness of the data
obtained from these sources.
The collection of initial data has been organised as per the following topics:
● Topographic data of the implantation site;
● Soil study and geological characterisation;
● Meteorological and wind data;
● Structure and management of the airspace;
● Data on properties and land uses within the development area;
● Data on support infrastructure for connection with the NAIMCR area;
● Applicable legislation and regulations as well as boundary requirements;
● Socio-economic and demographic data for the region.
First, the consultant team focused on topographic studies. These were carried out with the
required precision to be able to correctly evaluate the best alternatives for the implementation of
the different components of the airport infrastructure. Special attention has been given to
meteorological conditions, surrounding obstacles and earthworks using a digital terrain model for
construction, based on the topographic data collected. This part of the report provides information
on the methodology, the equipment, and the results. The information is presented using one meter
contour levels to allow for a better appreciation of the site’s topography.
The characteristics of the terrain were then evaluated by means of various types of geotechnical
studies such as geo-seismic, penetration, extraction of samples by percussion and rotation, as
well as determination of permeability. These studies, along with the geological characterisation
included in the report, are used to make recommendations on buildings’ foundations based on
the soil bearing capacity, to make appreciations regarding earthworks, in particular by determining
the methods and equipment that will be necessary to perform earthworks, to study the runoff of
the site and ultimately to inform the development strategy of the infrastructure and the resulting
costs.
The recommendations have been added as an additional appendix. To summarise, we can say
that the soil and geology of the area have uniform characteristics and the initial views are that it
should not present any particular difficulty in order to develop airport facilities in this area. In
addition, earthworks should not interact with rock formations that require the use of explosives
during the earthworks.
Meteorological and wind data has been the main concern of the consultants since the inception
meeting and therefore efforts have been made to obtain all the data available in relation to the
site. It has been recognised that a stage has been reached where all the available data by direct
measurement has been collected, and it has been agreed to elaborate a wind rose which is

Mott MacDonald | NAIMCR Estudio de Emplazamiento y Plan Maestro Executive Summary
13
assumed to be best estimate of frequencies and wind intensities based on the available
information.
Basic available meteorological information is included in this report, although it is not ruled out
that the installation of new meteorological stations, as happened during the execution of the
contract, or interpolations from mathematical models, can shed new light on the subject and lead
to modifications to the work carried out based on this data. During the contract, it has been verified
that there has been no evidence of a meteorological event or data, however small, that would
lead to question the validity of the information mentioned above and all the data to date tends to
justify the decisions in the report.
The structure and management of the airspace is important for the determination of approach and
landing operations for the NAIMCR. For this reason, the data collected and recorded in this
section of the report will serve as a basis for the airport operation planners and will be used to
determine the capacity of the airport. It is not ruled out that based on what has been relayed and
in agreement with the DGAC, modifications to the organisation of the airspace must be proposed
later. These modifications have also been discussed in different sections in the report.
Cadastral and land use data within the proposed airport area inform of the impact on communities
and the ecosystem, the cost of expropriations, the modification to urban zoning and in general,
on the interaction of the proposed airport with its urban and social environment. For this reason,
a section of this report has been dedicated to the topic, recording these elements at the date of
the study and based on data provided by official bodies.
Similarly, the inventory and evaluation of surface access infrastructure is of importance, with an
emphasis on road access which concentrates most of the available means of communication
between the future airport and San José. Due to this, this report assesses not only the current
situation and the capacity of the existing roads but also describes plans for the development of
sufficient road infrastructure.
The report also evaluates in parallel surface access needs using buses, the current state of the
rail network and the potential for it to become a suitable mode of transport to access the airport
Finally, it is important to mention in the initial inventory an evaluation and listing of the socio-
economic conditions and the regulations applicable to the population. This inventory serves as a
baseline for evaluating the impacts of the development in the later stage of this work.

Mott MacDonald | NAIMCR Estudio de Emplazamiento y Plan Maestro Executive Summary
14
4 Activity 2. Traffic Forecast
This chapter describes the methodology used for the aviation traffic forecast at NAIMCR. The
basis of the forecast are the macroeconomic conditions that impact on the air traffic. This is the
basis to estimate the air traffic demand for the NAIMCR.
The traffic forecast considers the current traffic situation in Costa Rica. Global air transport has
been growing over 4% a year in this millennium, and the Latin American market has grown even
above average to gain market share of 7% to 8%. Central America, and in particularly Latin
America, has also seen significant growth, as evidenced by the recent data from the period 2007
to 2014, where the RPK has increased by over 4.5% with the different world regions. The industry
maintains expectations of significant growth for the next 20-30 years, which defines an excellent
framework for Costa Rica to take a greater weight in this traffic.
Costa Rica's traffic in mid-2016 shows an annual passenger traffic of 5.3 million passengers. This
traffic is channeled through the four international airports, although only Juan Santamaría and
Daniel Oduber airports are relevant for commercial traffic. Limón and Tobías Bolaños airports are
more framed in aerotaxi service or of regular line of short haul.
The recent historical growth has been important, especially since 2015, where there has been a
significant jump that is consolidated in 2016, with growth rates above 15% in both Liberia and
Juan Santamaría airports. Juan Santamaría airport represents 83% of the international traffic of
Costa Rica, being the most important door of international traffic. This growth is closely linked to
tourism and the recent increase in European and American companies that dispute to offer direct
services. On the other hand, the volume of aircraft has decreased, partly due to the increase of
traffic of large aircraft and the decrease of the activity of general aviation.
In the large GAM metropolitan region, Juan Santamaria has also seen significant growth in recent
years, especially since 2015. Clearly Tobías Bolaños airport is an important general aviation base
and the debate on the future of these two airports must be resolved. That strategic and operating
aspects of maintaining four airports open are to be analyzed. For the consideration of traffic
forecast, the GAM is considered as a single destination for international traffic, and the internal
metropolitan demand for general aviation air taxi has not been quantified in the projection but may
have commercial interest for the future.
Juan Santamaria’s traffic has a large North American share that has remained between 52% -
55% and with 5 routes between the first 10 routes at the airport (Houston, Miami Fort Lauderdale,
Atlanta, and New York). The second most important share would be the Central American market,
which includes connections to Panama (the most important route of the airport), San Salvador,
and Mexico. The other route among the top ten in June 2016 is Madrid, and it is noteworthy that
demand and interest continues to grow during the period of this study. It is also important to
mention that during this year, the political-macroeconomic environment has witnessed great
volatility due to events such as the departure of Britain from the European community, and the
election of a president with non-traditional proposals in the United States. The impact of these
events on air traffic, positive or negative, will only be correctly appreciated in two or three coming
years.
It is therefore important to emphasize that it is common practice for traffic studies to be updated
at least every 5 years (i.e. the next update would be in 2021), also there should be another update
in 2026 when the NAIMCR is due to open.

Mott MacDonald | NAIMCR Estudio de Emplazamiento y Plan Maestro Executive Summary
15
The top airlines at AISJ are the Avianca Group and Copa, followed by american companies for
long haul. AISJ presents a great variety of companies, including national as well as low cost being
this good indicator of its attractiveness. The domestic market is shared between Sansa (62% of
operations) and Nature Air.
The seasonality of the demand is accentuated, with the peak season occurring around the end of
the year and the month of July. The lowest traffic months are September and October. The
difference between the minimum and the maximum is not very large compared to others Tourist
destinations, since the minimum is 40% of the maximum month.
Around the 7% of the traffic is transfer. The MIDT database analysis, clearly shows that there are
two hubs in the Central American market, the main one is Panama (with more than 9 million
passengers connecting in 2015 Over a total of 13.4 million) and the second one is El Salvador,
with a peak transfer of 56% in the high season. Part of the AISJ transfer can be explained by the
type of route passengers seem to follow, visiting several Central American countries entering one
airport and leaving the other.
This analysis carried out during the study defines a clear opportunity for the NAIMCR: A)
Development of tourism aligned with the airport; B) Positive environment for the establishment of
bilateral agreements; C) Low-cost development linked to economic growth in Central America;
and D) Central America and the Caribbean zone attractiveness has increased and posed a
renewed global interest, due partly to security issues in other destinations.
On the other hand, the following threats have been identified: A) Panama Tocumen Airport
competition and, to a lesser extent, El Salvador, B) Lack of a Costa Rica-based airline, C)
competition from other tourist destinations, and D) Economic situation in Central America and the
risk that the Region does not consolidate this moment of growth in commercial traffic.
In this context, a traffic forecast has been developed up to 2047 for the NAIMCR according to the
requirements of the Contract. The forecast has been based on an econometric formulation, as
this is a forecast for a new airport that expects to open in the medium term (opening in 2026) and
it was needed to assess the market trends in the medium and long term.
The current traffic and short-term development strategies have provided the starting point for the
projection. The NAIMCR benefits from the recent increase in traffic experienced by AISJ. The
countries that make the greatest contribution to air traffic in Costa have been correlated with
macroeconomic indicators to reflect the impact on the traffic growth trends in Costa Rica. These
indicators in general are correlated with the Gross Domestic Product (GDP) of a given country.
The forecast model considers that the airport can open with a traffic of 7.8 million passengers and
arrive in 20 years to the figure of 15.2 million passengers for the Base Case. The optimistic
scenario considers a more optimistic GDP growth and a low-cost market development in the short
term. The pessimistic case considers that GDP growth is 10% lower and that it also decreases
the elasticity of demand. These values give a range of between 6.8 (pessimist case) to 9.7 million
passengers (optimistic case) for the year of opening. The range for 2047 would be between 12.5
to 20.1 million passengers for the such scenarios.

Mott MacDonald | NAIMCR Estudio de Emplazamiento y Plan Maestro Executive Summary
16
Figure 4.1 Annual Passenger Traffic Forecast (left) and Annual ATMs (right).
Source: Mott MacDonald.
The figures above include international and domestic traffic. The international traffic is expected
to continue to maintain the American share as the main one, with a slight reduction on its quote.
Europe and Latin America are expected to maintain their percentage share. The market that is
expected to increase significantly its quote would be the Central American one. The remaining
markets (Where Asia is included) are expected to grow significantly, but would maintain a
minimum weight on the total, around 2% of the share.
The peak hour has also been estimated considering the analysis of the data from 2015. This peak
hour is used to estimate the demand and needs of capacity of the infrastructure. This is the base
for the estimation of requirements for the Master Plan.
As starting point and based on the formulas developed to correlate the annual demand with the
peak hour to reach an opening value of 3000 peak hour passengers, 1750 outgoing passengers
and 1600 arrival passengers. The ATMs peak hour would be 38 aircraft-hour, 21 departures and
17 arrivals.
Figure 4.2 Passenger peak hour forecast (left) and Peak hour ATM (right).
Source: Mott MacDonald.
Mott MacDonald | NAIMCR Estudio de Emplazamiento y Plan Maestro Executive Summary
17
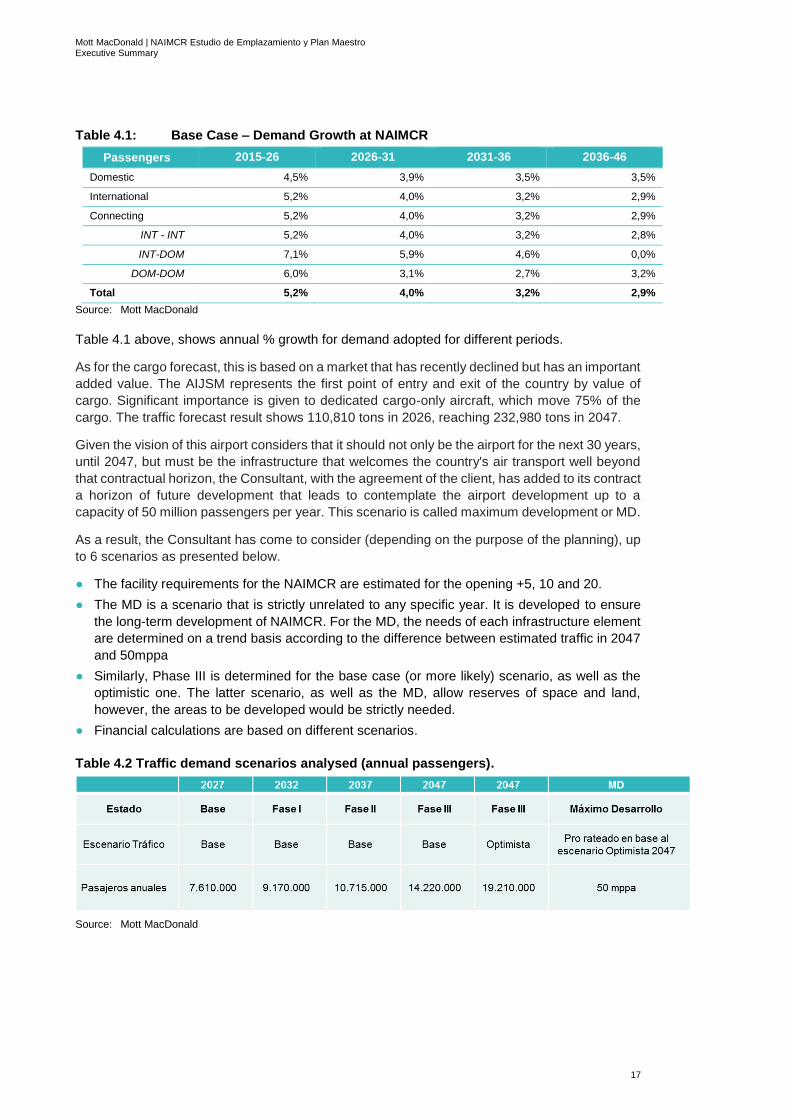
Table 4.1: Base Case – Demand Growth at NAIMCR
Passengers 2015-26 2026-31 2031-36 2036-46
Domestic 4,5% 3,9% 3,5% 3,5%
International 5,2% 4,0% 3,2% 2,9%
Connecting 5,2% 4,0% 3,2% 2,9%
INT - INT 5,2% 4,0% 3,2% 2,8%
INT-DOM 7,1% 5,9% 4,6% 0,0%
DOM-DOM 6,0% 3,1% 2,7% 3,2%
Total 5,2% 4,0% 3,2% 2,9%
Source: Mott MacDonald
Table 4.1 above, shows annual % growth for demand adopted for different periods.
As for the cargo forecast, this is based on a market that has recently declined but has an important
added value. The AIJSM represents the first point of entry and exit of the country by value of
cargo. Significant importance is given to dedicated cargo-only aircraft, which move 75% of the
cargo. The traffic forecast result shows 110,810 tons in 2026, reaching 232,980 tons in 2047.
Given the vision of this airport considers that it should not only be the airport for the next 30 years,
until 2047, but must be the infrastructure that welcomes the country's air transport well beyond
that contractual horizon, the Consultant, with the agreement of the client, has added to its contract
a horizon of future development that leads to contemplate the airport development up to a
capacity of 50 million passengers per year. This scenario is called maximum development or MD.
As a result, the Consultant has come to consider (depending on the purpose of the planning), up
to 6 scenarios as presented below.
● The facility requirements for the NAIMCR are estimated for the opening +5, 10 and 20.
● The MD is a scenario that is strictly unrelated to any specific year. It is developed to ensure
the long-term development of NAIMCR. For the MD, the needs of each infrastructure element
are determined on a trend basis according to the difference between estimated traffic in 2047
and 50mppa
● Similarly, Phase III is determined for the base case (or more likely) scenario, as well as the
optimistic one. The latter scenario, as well as the MD, allow reserves of space and land,
however, the areas to be developed would be strictly needed.
● Financial calculations are based on different scenarios.
Table 4.2 Traffic demand scenarios analysed (annual passengers).
Source: Mott MacDonald

Mott MacDonald | NAIMCR Estudio de Emplazamiento y Plan Maestro Executive Summary
18
5 Activity 3. Preliminary Engineering
Studies and Environmental Assesment
Activity 3 summarizes the basic information required for the development of activities related to
the NAIMCR site. The report complements and is integrated with the reports of activities 1 and 2.
This report includes the conclusions and recommendations of the studies that should be
considered at future design stages.
The areas that have been investigated can be divided into two major areas:
● Those that involve the environment in which the work is going to be developed. The
"Conclusions and Recommendations" are presented in detail in the technical report. These
are the listed below:
– Conclusions and Recommendations on geotechnics and seismicity
– Conclusions and Recommendations on hydrological study
– Conclusions and Recommendations on site wide requirements
– Conclusions and Recommendations on environment
– Conclusions and Recommendations on landside access
– Conclusions and Recommendations on socio-economic issues
● A second group is related to the needs of the operation of the airport and are referred to:
– Waste Management
– Water resources
– Public Service/ Utilities Requirements
This last set of requirements has evolved as the sizes on the subsequent activities of the airport
facilities and other parameters have been refined and developed. These complete the final set of
facility requirements for the master plan.
The factors that may affect these preliminary requirements are related to the incorporation of the
sustainability criteria as well as the development and more accurate definition of the typology of
the facilities while the planning and design stages progress. Ultimately, the technical / economic
criteria are an important input to define the solution based on the balance between initial
investment costs and operating expenses (this is developed in Activity number 7).
Finally, the report is completed with the appendices that contain the detailed information of the
different preliminary engineering studies. These will allow the different experts to have the detail
information that led to the conclusions and recommendations indicated by the Consultant.
5.1 Land Use
Two areas have been defined in terms of land use. The primary zone containing the perimeter of
the airport itself, and a secondary zone that is of interest for the zoning and urban/industrial
development associated with airport activity:

Mott MacDonald | NAIMCR Estudio de Emplazamiento y Plan Maestro Executive Summary
19
Figure 5.1 Land Area affected.
Source: Cocosa. (2016)
The area within the airport boundary has been allocated to different airport related facilities and
infrastructure.
A land use map has been developed for each alternative. The setting out of the zoning was carried
out based on the fixed runways threshold coordinates.
These coordinates were fixed based on the obstacle limitation surfaces and airspace analysis.

Mott MacDonald | NAIMCR Estudio de Emplazamiento y Plan Maestro Executive Summary
20
Figure 5.2 Land use plan for one of the NAIMCR alternatives
Source: Mott MacDonald

Mott MacDonald | NAIMCR Estudio de Emplazamiento y Plan Maestro Executive Summary
21
5.2 Environmental and Socio economic study
5.2.1 Hydraulics study
On the environmental issue, the focus was on the streams and water courses and the alteration
of the land surfaces that such a vast area entails (large paved surfaces increases the water flow
drained from rainwater). The emphasis was also placed on the need for regulation of flows that
will prevent flood water and the reuse of water to reduce consumption and increase the
sustainability of the project. The main aspects are:
● Machuca river catchment area with deep channels and steep slopes.
● Streams on the site which are low flow, intermittent, channels with lack of definition.
● Guayabal, which is the most polluted.
● Grande, which covers 41% of the area of airport development.
● Ceiba, which is an affluent to Río Machuca
● Need for post project flow regulation
Figure 5.3 Surface water streams
Source: Mott Macdonald based on Barranca cartography 1:50000, IGN.
The underground water was taken also into consideration. The availability of water supply for the
airport based on the deepest layers has been analysed and deemed feasible.
The use of fuel traps and oil separators is an input to the mitigation of environmental risks in the
study. The main conclusions are related to the study of three levels:
Zona primaria
de proyecto
Q. Grande / Cabuya
Río Machuca
Q. Guayabal
Afluentes río Machuca
Q. Pozón

Mott MacDonald | NAIMCR Estudio de Emplazamiento y Plan Maestro Executive Summary
22
● Top layers- less than 10 m. Insignificant flow aquifers. Soils types: colluvium, pyroclastic
meteoroids or healthy.
● Intermediate layers: between 20 - 35 meters. Irregular aquifers, production volume very
limited. Low current hydrogeological vulnerability – to be considered when considering
excavations.
● Deep layers: depths of 80-100 meters. Volcanic fissured aquifer and volcanic with potential
to be a producer aquifer.
A network of piezometers could be introduced to control the quality of underground waters, both
during the execution of the works and the future exploitation of the airport.
Figure 5.4 Underground water resources
Source: MML
5.2.2 Environmental studies
The biological aspects and sensitive areas affected by development have been assessed,
concluding that 3% of the surface is characterized as riparian forest. This contains the largest
quantities of variety of flora and fauna in the site.
It is worth mentioning that one third of this area (next to the river Machuca) would only be affected
after 2047 once the northern runway is expected to be developed at its maximum length. In this
case, it is expected that species un this sector will be transplanted to other areas to preserve
them if they are perceived to be in danger of extinction.
The main findings are summarized below:
● The area of study (ZE) is in an area of tropical rainforest (24-30 ° C and 2000-4000 mm
rainfall/year) located 2 Km Southeast of the transition to tropical dry forest with a distribution
of species from both zones.
● The ZE and surrounding areas are in general, crop areas of pasture for livestock, crops,
settlements and cattle ranching activity areas. The index of environmental fragility (IFA) is
ranked as low and very low due to human intervention and involvement by human activities
causing the fragmentation of the landscape.
● Main ecosystems identified: grassland, riparian forest, secondary forest (regeneration) forest.

Mott MacDonald | NAIMCR Estudio de Emplazamiento y Plan Maestro Executive Summary
23
● The largest number of species of flora and fauna were present in the forest and riparian forest.
Five environmentally sensitive areas where defined in the study, covering a total of 66 Ha over the grand total of 1950 HA (3.3%).
The 5 sensitive areas are:
● Regeneration of forest with high presence of cocobolos (19.8 ha)
● Riparian forest (18.1 ha).
● Riparian forest (4.2 ha)
● Riparian forest, (9.2 ha)
● Riparian forest and possible source of water (15 ha)
Figure 5.5 Environmental sensitive areas
Source. MML.
Flora:
● 168 species were identified
● The greatest diversity is found on the sector River Machuca forest
Fauna:
Wet and dry tropical forest species were identified

Mott MacDonald | NAIMCR Estudio de Emplazamiento y Plan Maestro Executive Summary
24
● 98 species of birds were identified
● 9 species of amphibians were identified
● 8 species of reptiles were identified
● 16 species of mammals (bats 10) were identified
Wetlands:
● In the ZE and its area of influence: streams, yurros and Machuca river (main collector)
● The following environmental sensible areas have not been identified: wetlands of type lagoon,
swamps or other lenticas waters
● The following were observed in a very limited way: fishes (Poecilidae) and prawns
(Macrobrachium sp.)
● The protected area “Manglar of Tivives” is not affected by the activity to develop and operate
the airport.
5.2.3 Social and economic impact
The social impact on the surrounding has been addressed from the point of view of the positive
impacts generated by creation of new jobs and the increase of the gross regional product.
These were deducted through methods that compared the jobs that would be generated at the
airport, the indirect jobs, and the induced jobs. These were benchmarked against the air transport
statistics in Latin America. The estimated total number for 2047 (adding the three categories),
would be almost 80,000 jobs. It has been estimated that this would generate a GDP in the order
of 1,500 million dollars a year.
Table 5.1 Social and economic impact
Source: Mott Mac Donald

Mott MacDonald | NAIMCR Estudio de Emplazamiento y Plan Maestro Executive Summary
25
The impacts that must be mitigated from the social point of view, are summarized as:
● Acquisition of land and involuntary resettlement.
● Modification of the land use and landscape pattern.
● Variation of the demographic pattern and disruption of the social fabric.
● Loss of quality of life by social related issues and environmental impacts (noise in Coyolar /
Orotina).
Figure 5.6 Noise Impact for maximum development at 50 mppa
Source: Mott Mac Donald
The view is that none of these impacts has the magnitude for diminishing the positive socio-
economic impact of the NAIMCR. However, adequate and prompt action is needed from the
Government to apply adequate urban zoning and land owner compensation measures suitable.
(According to findings of a workshop held in the municipality of Orotina day 31-01-2017).
It is also required to mitigate the impacts on water resources and biological zones, such as
discussed during the project. This would not be in principle significant or to the extent of making
the project non-feasible but mitigation measures should be put in place.
1) Surface water
● Direct impact to channels of public domain (diversion / disappearance of channels).
● Potential impact (disappearance) to flows for main streams.
● Alteration of instantaneous flows due to non-permeable surfaces.
● Potential contamination - surface water:
– Discharges of treated effluents.
– Spills - fuels, chemicals.
– Induced development.
2) Underground water streams
● Loss of coverage material - increased vulnerability of lower aquifers - loss of hung levels.

Mott MacDonald | NAIMCR Estudio de Emplazamiento y Plan Maestro Executive Summary
26
● Involvement of existing concessions.
● Loss of (poor) recharge areas.
● Potential contamination - groundwater:
– Spills of hydrocarbons and others.
– Tanks of fuel, chemical warehouses, workshops.
● Increased pressure on resources - involvement of existing concessions - possible exploitation.
3) Biological area
● Habitat loss:
– Grasslands.
– Forest.
– Streams.
● Loss of rare or endangered individuals / veda (No significant presence detected)
● Variation of species distribution patterns.
● Reduction of connectivity (low – the integrity of Machuca river basin is respected).
● Tivives: relative closeness without direct effect. (No particular measure required)
Regulatory plan and urban development
The first point that has been considered during the workshop held in Orotina with the local
technical staff in charge of planning, refers to the aeronautical obstacle limitation surfaces. These
surfaces are to limit the building heights. Another footprint to consider is the noise level.
For the latter, the zoning where an equivalent noise to 55 dB (following international standards)
was shown. It was indicated that construction of schools and health care centres should be
avoided in those areas. It was also indicated residents would have to be relocated or offered
compensation through the implementation of acoustic insulation for their homes.
It is highlighted that the effects of noise produced by the north runway, which initially would not
consider complete extended length, are negligible until the year 2047.
Figure 5.7 Aircraft noise footprints for initial development
Source: Mott MacDonald

Mott MacDonald | NAIMCR Estudio de Emplazamiento y Plan Maestro Executive Summary
27
To illustrate the impact to the surroundings and the land-use planning, the Consultant showed a
set of examples based on exiting airports with a traffic of about 50 million of passengers (Munich
and Singapore). The different developments inside and outside the airport grounds and the main
services that tend to settle in the vicinity of airport have been illustrated. This showed the type of
services that the Consultant would consider inside of what is called the "Airport City", with the
land used that the municipality should consider in its urban planning. Some of these factors are:
● Urban density
● Coverage
● Height
● Zoning
● Sustainability
Obstacle Limitation Surfaces
Another impact that has been considered is the obstacle limitation surfaces. These imaginary surfaces are defined to limit the height of the constructions in the surroundings of the airport. These OLSs are defined to protect the safety of the aircraft operations.
The OLSs are defined based on the runways location. The first check is carried out attending to ground penetrations to determine the feasibility of the runway orientation.
The only two feasible orientation for the NAIMCR are shown in the figure below.
Figure 5.8 The only two runway Orientations for the NAIMCR.
Source: Mott MacDonald

Mott MacDonald | NAIMCR Estudio de Emplazamiento y Plan Maestro Executive Summary
28
Operationally, the 12/30 configuration, as is justified in the report, would be the preferred from the point of view of safety and efficiency of operations.
For the analysis of the runway orientation, the Consultant has considered factors such as:
● Wind
● Topography and earthworks
● Availability of land
● Orography and obstacles
● Flight procedures
● Environmental factors and noise impact
● Access and other developments around the airport
After considering all the above, the12/30 orientation is selected as the preferred to take forward.
Based on the runway set out and the aeronautical guidelines, the areas to be safeguarded are defined by the Obstacle Limitation Surfaces considering the following:
● The Airport imposes restrictions on the heights of buildings, constructions and installations on
the surrounding of the airport.
● The obstacle limitation surfaces area defined by international regulations ICAO and applicable
to Costa Rica by local standards.
● New constructions that protrude the obstacle limitation surfaces are not allowed except for
special cases.
Figure 5.9 Obstacle Limitation Surfaces
Source: Mott MacDonald

Mott MacDonald | NAIMCR Estudio de Emplazamiento y Plan Maestro Executive Summary
29
Figure 5.10 Obstacle Limitation Surfaces in Orotina
Source: Mott MacDonald
5.3 Landside access
5.3.1 Roads:
A total of 13 sections have been analysed; these were subdivided into subsections:
– Toward the Western Pacific: Liberia.
– Toward the Central Pacific: Puntarenas and Jacó.
– Towards the North zone: San Ramon.
– Toward the centre of the country: San José, Alajuela, Cartago and Heredia.
– Towards the Atlantic: Guapiles.
For each of them, the following was analysed:
– Length.
– Approximate travel time.
– Approximate speed.
– Road capacity.
– Alignment.
– Pavement.

Mott MacDonald | NAIMCR Estudio de Emplazamiento y Plan Maestro Executive Summary
30
– Condition of the road signs.
– Traffic volumes.
– Intersections to consider and reference pictures.
– Films and videos for reference.
Current and planned investments in roads were also considered and are expected to be executed and completed as a precondition for the airport to be able to operate. In the implementation plan, a review of advances in road development by the MOPT (or the concessionaire) is expected simultaneously with the airport PPP tender releases in order to incorporate firm commitments from the State:
● Expansion of the national route 27 (Ruta 27)
Figure 5.11 National Route 27
Source: Cit. Convias
● Other routes in maintenance and improvements:
○ National routes, 131, 137, 622, 755, 713 and 756.
And also, very important to provide access redundancy is the:
● Construction Road West interconnection corridor:
○ National route 1 to San Ramon.
○ National route 27 to Pozón Orotina

Mott MacDonald | NAIMCR Estudio de Emplazamiento y Plan Maestro Executive Summary
31
Figure 5.12 West Interconnection
Source: Cit. Convias
For the expansion of the main access, route 27, a reference information was determined to obtain quantitative parameters to obtain generation rates of travel on different modes of transport as follows:
Generation of trips by passengers
First the characterization of the peak hours and type of demand was defined:
● Peak hour 9:00-10:00 am and 3:00-4:00 pm.
● Percentage of vehicles during the peak: 8%
● Modes of transport
– Bus: 24%
– Rented cars: 20
– Private cars and taxis: 56%
○ Vehicular occupation ratio: 1.7
○ Parking usage percentage: 40%
This passenger related demand is classified according to the origin or destination:

Mott MacDonald | NAIMCR Estudio de Emplazamiento y Plan Maestro Executive Summary
32
Figure 5.13 Passenger destination in Costa RIca: Domestic (left), International (right)
Source: Mott MacDonald
Figure 5.14 Trip generation by passenger type: Domestic (left), International (right)
Source: Mott Macdonald
Trip generation by employees
Reference information has been used to obtain qualitative parameters to estimate trips for different modes of transport.
Employees: based on 8 employees for every 10 000 annual passengers, according to the report for Latin America: 2014 ACI Airports' Economics Report and time distribution of shifts in the current AIJSM.

Mott MacDonald | NAIMCR Estudio de Emplazamiento y Plan Maestro Executive Summary
33
Figure 5.15 Trip generation and Hourly distribution by employees during different shifts based on aeronautical operations.
Source: Mott MacDonald
Vehicle ownership trend in Costa Rica: It is used to understand limitations to the growth of employees arriving in their own vehicle and estimate the trips generated by the employees.
Figure 5.16 Trip generation by staff (empleados).
Source: Mott MacDonald
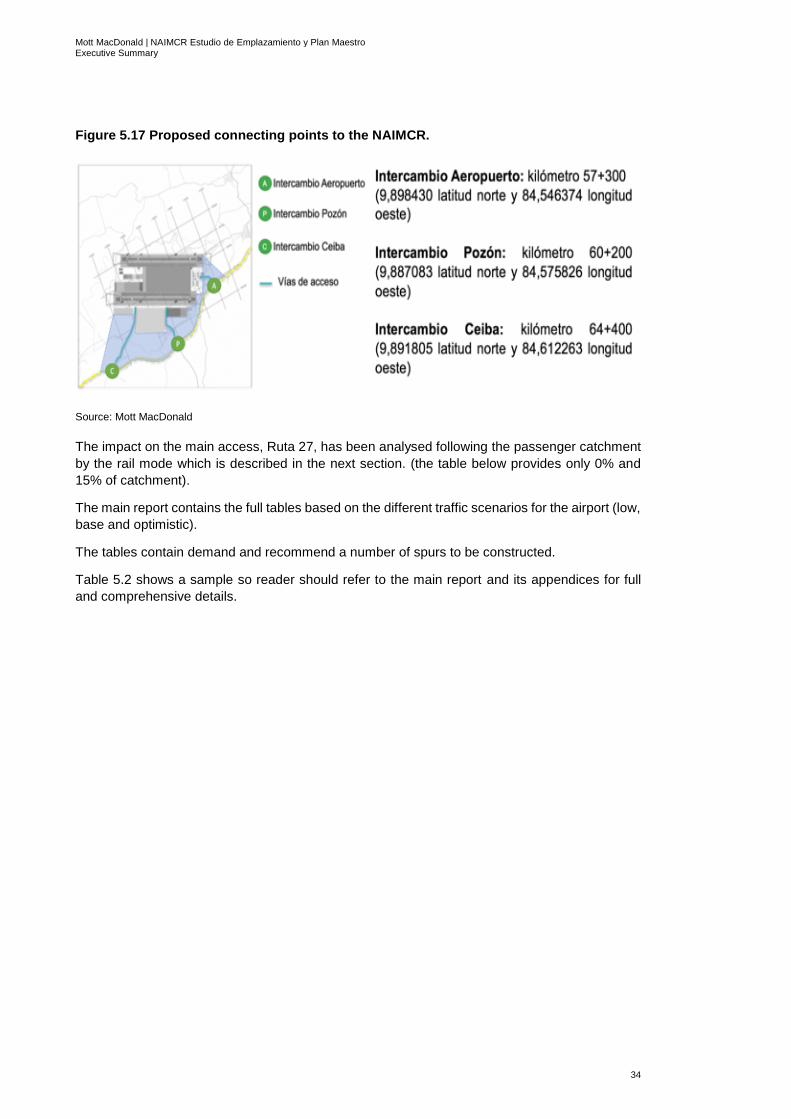
Proposed connecting points
Three access have been identified in order to separate the industrial and passenger demand.
Mott MacDonald | NAIMCR Estudio de Emplazamiento y Plan Maestro Executive Summary
34
Figure 5.17 Proposed connecting points to the NAIMCR.
Source: Mott MacDonald
The impact on the main access, Ruta 27, has been analysed following the passenger catchment
by the rail mode which is described in the next section. (the table below provides only 0% and
15% of catchment).
The main report contains the full tables based on the different traffic scenarios for the airport (low,
base and optimistic).
The tables contain demand and recommend a number of spurs to be constructed.
Table 5.2 shows a sample so reader should refer to the main report and its appendices for full
and comprehensive details.

Mott MacDonald | NAIMCR Estudio de Emplazamiento y Plan Maestro Executive Summary
35
Table 5.2 Number of vehicles accessing the NAIMCR (0%, 15% and 20% using the train)
Source: Mott MacDonald
Peak hour
passenger
numbers
Employee
Peak Hour
Volume
O/D
Volume at
Peak hour
Total
Volume
Spurs
required in
each
direction in
RN 27
Spurs to be
constructed
each
direction in
RN 27
Peak hour
passenger
numbers
Employee
Peak Hour
Volume
O/D
Volume at
Peak hour
Total
Volume
Spurs
required in
each
direction in
RN 27
Spurs to
be
constructe
d each
direction
in RN 27
Peak hour
passenger
numbers
Employee
Peak Hour
Volume
O/D
Volume at
Peak hour
Total
Volume
Spurs
required in
each
direction
in RN 27
Spurs to
be
constructe
d each
direction
in RN 27
2015 1036 1469 530 1162 2198 1 0 1259 450 993 2029 1 0 1185 424 935 1970 1 0
2016 1085 1604 627 1304 2389 1 0 1374 533 1114 2199 1 0 1293 502 1048 2133 1 0
2017 1137 1682 693 1392 2529 1 0 1441 589 1189 2326 1 0 1356 554 1119 2256 1 0
2018 1191 1761 760 1481 2673 1 0 1508 646 1265 2457 1 0 1419 608 1191 2382 1 0
2019 1248 1839 828 1571 2820 1 0 1575 704 1342 2590 1 0 1482 662 1263 2511 1 0
2020 1308 1878 895 1640 2948 1 0 1608 760 1400 2708 1 0 1514 716 1318 2626 1 0
2021 1370 1956 962 1730 3100 1 0 1676 818 1477 2847 1 0 1577 770 1390 2761 1 0
2022 1436 2034 1029 1819 3255 1 0 1743 874 1553 2989 1 0 1640 823 1462 2898 1 0
2023 1505 2113 1095 1908 3412 1 0 1810 931 1629 3134 1 0 1703 876 1533 3038 1 0
2024 1577 2191 1161 1997 3573 2 1 1877 987 1705 3281 1 0 1766 929 1605 3181 1 0
2025 1652 2269 1228 2086 3738 2 1 1944 1044 1781 3433 1 0 1829 982 1676 3328 1 0
2026 1714 2347 1295 2175 3890 2 1 2011 1101 1857 3572 2 1 1892 1036 1748 3462 1 0
2027 1779 2465 1363 2286 4065 2 1 2111 1158 1952 3731 2 1 1987 1090 1837 3616 2 1
2028 1846 2543 1430 2376 4222 2 1 2178 1215 2028 3875 2 1 2050 1144 1909 3755 2 1
2029 1916 2621 1499 2467 4383 2 1 2245 1274 2106 4022 2 1 2113 1199 1982 3898 2 1
2030 1989 2739 1569 2579 4568 2 1 2346 1333 2202 4190 2 1 2208 1255 2072 4061 2 1
2031 2064 2817 1628 2663 4726 2 1 2413 1383 2273 4337 2 1 2271 1302 2139 4203 2 1
2032 2142 2895 1687 2746 4888 2 1 2480 1434 2345 4486 2 1 2334 1349 2207 4348 2 1
2033 2223 2973 1746 2830 5053 2 1 2547 1484 2416 4639 2 1 2397 1397 2274 4497 2 1
2034 2307 3052 1806 2915 5222 2 1 2614 1535 2489 4795 2 1 2460 1445 2342 4649 2 1
2035 2394 3130 1867 3000 5394 2 1 2681 1587 2561 4955 2 1 2523 1494 2410 4804 2 1
2036 2461 3247 1929 3107 5567 2 1 2781 1639 2652 5113 2 1 2618 1543 2496 4957 2 1
2037 2529 3326 1991 3192 5721 2 1 2848 1692 2725 5254 2 1 2681 1593 2565 5094 2 1
2038 2599 3404 2054 3279 5879 2 1 2915 1746 2799 5399 2 1 2744 1643 2635 5234 2 1
2039 2672 3521 2118 3388 6059 2 1 3016 1800 2892 5563 2 1 2838 1695 2722 5393 2 1
2040 2746 3599 2183 3476 6221 2 1 3083 1856 2967 5713 2 1 2902 1746 2792 5538 2 1
2041 2822 3678 2249 3564 6386 2 1 3150 1911 3042 5864 2 1 2965 1799 2863 5685 2 1
2042 2901 3795 2314 3673 6574 2 1 3250 1967 3135 6036 2 1 3059 1851 2951 5852 2 1
2043 2981 3912 2381 3784 6765 2 1 3351 2024 3230 6211 2 1 3154 1905 3040 6021 2 1
2044 3064 3991 2448 3873 6937 2 1 3418 2081 3306 6370 2 1 3217 1958 3112 6176 2 1
2045 3149 4108 2517 3985 7134 3 2 3519 2139 3401 6551 2 1 3312 2013 3201 6351 2 1
2046 3205 4186 2586 4075 7281 3 2 3586 2198 3479 6684 2 1 3375 2068 3274 6479 2 1
2047 3262 4304 2655 4188 7450 3 2 3686 2257 3574 6837 2 1 3469 2124 3364 6627 2 1
Section 31+500 - 53+500
Year
Peak Hour
Current
Volume
Without Train Capture 15% of traffic Capture 20% of traffic
Posible Impact on Highway 27

Mott MacDonald | NAIMCR Estudio de Emplazamiento y Plan Maestro Executive Summary
36
5.3.2 Rail:
Investment plans for the railway mode
It is planned to improve and recover the railway mode. The team has considered this will be carried out in three stages.
● Stage I: Enabling the network from the national stadium to Paraíso de Cartago.
● Stage II: Enabling the network from the Atlántico station to Alajuela.
● Stage III: Enabling the network from the national stadium to Alajuela.
It is proposed to add branch to Orotina to the stage III with capacity for passengers and cargo. The branch should join the airport infrastructure at the proposed exchanger 'A' (for passengers) and then continue towards the Pacific and reaching Puerto Caldera.
Demand
The selection of the railway mode by the passengers using the airport will depend on many factors, amongst which the following are highlighted:
● Frequencies and destinations available
● Time of travel compared to road mode
● Travel costs
Given the level of definition of railway investments, the consulting team has compared the use of the rail mode with other modes of transport (public and private) in other airports and countries as shown in the figure:
Table 5.3 Transport modes at different airports
Source: Mott MacDonald
Car Taxi Rail/Metro Bus
Hong Kong (2005) 7% 13% 24% 47% 9% 40.7 63.2
Shanghai Pudong (2008) 6% 45% 28.2 51.7
Tokyo Narita (2008) 36% 23% 33.5 35.6
Amsterdam (2014) 40% 9% 12% 55 55
Brussels (2009) 51% 19% 17% 11% 2% 17 21.9
Copenhagen (2009) 24% 17% 55% 3% 1% 19.7 25.6
Dusseldorf (2009) 58% 20% 19% 1% 2% 17.8 21.9
Frankfurt (2012) 37% 19% 36% 6% 2% 57.5 59.6
Geneva (2008) 21% 7% 11.5 15.2
Leipzig (2006) 72% 10% 13% 5% 2.34 2.33
Madrid (2009) 30% 30% 32% 6% 2% 48.2 41.8
Munich (2014) 44% 12% 31% 13% 39.7 39.7
Oslo (2009) 31% 5% 44% 19% 1% 19.1 24.3
Paris Charles de Gaulle (2009) 28% 27% 32% 11% 2% 57.9 63.8
Paris Orly (2009) 35% 29% 19% 16% 1% 25.2 28.9
Singapore Changi 23% 48% 16% 11% 2% 54 54
Stockholm (2009) 34% 19% 28% 19% 16.1 22.4
Vienna (2008) 19.7 22.5
Zurich (2008) 42% 5% 22.1 25.5
41%
39%
53%
72%
41%59%
Passengers (million) in
year of modal splitPassengers 2014 (million)OtherAirport (year of modal split)
49%
Private Public

Mott MacDonald | NAIMCR Estudio de Emplazamiento y Plan Maestro Executive Summary
37
The transport mode study allowed to generate hypotheses for access to the airport. This has been
measured in number of vehicles depending on the train mode share as shown in the figure:
Figure 5.18 Number of vehicles at NAIMCR
Source: Mott MacDonald
In the case under analysis the profitability of rail access, the difference between 0% of catchment
and the estimated catchment percentage according to the efficiency of the mode of rail transport
(i.e. 15% of catchment), immediately produces the number of passengers and employees who
uses the "train" mode.
At a master planning stage, it has been considered that a certain number of passengers will use
the train to get to the airport. For this reason, a modal-interchange station and associated access
have been included in the plan.

Mott MacDonald | NAIMCR Estudio de Emplazamiento y Plan Maestro Executive Summary
38
6 Activity 4. Facility Requirements
This activity presents the facility requirements developed based on the demand output from the
air traffic defined in Activity 2. The analysis of each element is mainly based on the peak hour
demand, annual passengers, or annual movements. The capacity demand analysis has been
carried out for each phase considered in the Master Plan.
To carry out the sizing of the facilities at a master planning level, a set of documents and
guidelines such as the following have been used: ICAO annexes and manuals, advisory circulars
and pertinent orders of the United States Federal Aviation Administration (FAA), documents and
other important sources of the Airports Cooperative Research Program (TRR), IATA's Airports
Development Reference Manual (ADRM), the National Fire Protection Association (NFPA), and
the Council International Airport (ACI), among others.
According to Costa Rican government intentions, NAIMCR is expected to enter into operation by
the year 2027. Thus, the year 2027 is the Initial State of the NAIMCR.
The NAIMCR planning horizons according to the request for proposal are the following:
● Short term or 5 years after opening day;
● Medium term or10 years after opening day;
● Long term or 20 years after opening day.
A scenario of Maximum Development has been also considered. This is not necessarily linked to
a time scale (20XX) but is one that ensures that development is not exhausted at 20 years, but
may continue to develop in time probably to a horizon of more than 50/60 years that allow a
reasonable amortization of infrastructure.
Based on this, Activity 4 of the master plan study develops the requirements for the following:
● Requirements for the geographical characterization of the site
● Aircraft manoeuvring area
● Aircraft aprons
● Passenger terminal
● Cargo terminal
● Landside Access and parking
● Air Navigation Requirements
● Aircraft rescue and firefighting services (ARFF)
● Support Facilities
● Ancillary Facilities
For each of them, a demand expressed in the unit most suitable for planning purposes has been
estimated numerically, so that the infrastructure needs can be determined based on this at a
master planning level for the purposes of the study. The infrastructure needs are then pictured in
a land use plan.
In summary, this activity contains the Demand that will generate the forecasted traffic at the airport
as well as the requirements in order to be able to attend to the provision of sufficient capacity.
The infrastructure needs are further developed in later activities.

Mott MacDonald | NAIMCR Estudio de Emplazamiento y Plan Maestro Executive Summary
39
The result of this chapter is a needs or requirement schedule that lists, in a numerical form, the
capacity required during the different stages. Some examples are:
6.1 Runways:
For the runways the following requirements are set:
Table 6.1 Summary of runway configuration requirements
Basic Configuration Capacity Life span
Single runway (Rwy 1) category F
Rapid exit taxiway for Code C for both conFiguretions
Independent parallel taxiway
Second parallel taxiway (optional)
Independent inner taxiway, dual when over 8 stands
43-45 peak
hour
movements
2032 base
case (43
peak hour
movements)
or 2037 base
case (45
peak hour
movements),
pending on
airspace
Parallel runway for Code A y B aircraft, compatible with future
development (Rwy 2)
Full parallel taxiway, compatible with future development
Up to 48 peak
hour
movements for
rwy 1 and 43
for rwy 2
Provides
capacity for
the 3 phases
(base case)
Rwy 2 extended to full length (parallel runways F+E or F+F) with
RET for C, B y E in all conFiguretions, By-pass at each runway end,
cross field taxiway links between runways, independent operations,
CAT I operations all conFiguretions.
80-90
(85 movements
peak hour)
Provides
capacity for
Maximum
Development

Mott MacDonald | NAIMCR Estudio de Emplazamiento y Plan Maestro Executive Summary
40
6.2 Commercial Aircraft Aprons:
Table 6.2 Commercial stand requirements.
Source: Mott MacDonald
MARS –Multiple Apron Ramp System foreseen will provide stands for Code E aircraft
outside the peak hour.
6.3 Passenger Terminal:
With regards to the area requirements for the passenger and cargo terminals, these requirements have been processed in compliance with the ADRM 10 Manual published by IATA, and a summary of the area requirements according to the different traffic horizons in tables 6.3 y 6.4:

Mott MacDonald | NAIMCR Estudio de Emplazamiento y Plan Maestro Executive Summary
41
Table 6.3 Passenger Terminal Requirements
Source: Mott MacDonald

Mott MacDonald | NAIMCR Estudio de Emplazamiento y Plan Maestro Executive Summary
42
Figure 6.1 Artistic impression of terminal building access of the NAIMCR
Source: Gensler
6.4 Cargo Terminal:
Table 6.4 Cargo terminal requirements
Year 2027 2032 2037 2047 2047 MD
Phase Opening Fase I base case
Fase II base case
Fase III base case
Fase III high case
Maximum Development
Cargo (tn) 115.240 138.540 165.210 232.980 249.160 647.816
Cargo storage (m2)
11.525 13.855 16.520 23.300 24.915 64.779
Cargo CTMR (m2)
2.305 2.770 3.305 4.660 4.985 12.961
Total (m2) 13.830 16.625 19.825 27.960 29.900 77.740
Source: Mott MacDonald
6.5 Ancillary facilities:
In the same way, the rest of the infrastructure required has been sized and the results entered in
the main body of the report.
These include details of Air Space and Navigational aids, procedures, TWR, Crash Fire and
Rescue Service, Aircraft Maintenance, General Aviation, Police, Fuel, Water Treatment and
Potable Water, electricity and roads, parking, and other facilities.
To see further details please refer to the main report.

Mott MacDonald | NAIMCR Estudio de Emplazamiento y Plan Maestro Executive Summary
43
7 Activity 5. Airport Development
Optioneering
A set of airport development options has been developed based on the demand requirements
analyzed on the previous activity (activity 4). Different options were developed for a list airport
components. These have been brought together in 3 main alternatives that have been analyzed,
ranked based on a set of parameters and discussed with the Client. As outcome of these, a
preferred development solution has been selected. This is the one developed in more detail in
Activity 6 and Activity 7.
This development is based on 4 fundamental premises:
Figure 7.1 Development objectives
Source: Mott MacDonald
Given that the runways setting out is considered fixed as a result of the airspace analysis (moving
the thresholds would entail limitations to aircraft operations), the component that has a bigger
impact on the optioneering exercise is the passenger terminal typology.
The terminal typology shapes the configuration of the aircraft apron, the cargo terminal and
ultimately, the locations of the auxiliary facilities. Therefore, the optioneering process starts with
the definition of different passenger terminal arrangements.
The optioneering process has been developed following an iterative process of continuous
improvement amongst the team. The proposed alternatives have been analyzed by each

Mott MacDonald | NAIMCR Estudio de Emplazamiento y Plan Maestro Executive Summary
44
specialist, starting with the passenger terminal, passing through to the airfield experts and the
support/ancillary specialists and back to the architects and landside planner again. Several
rounds were completed until the three options were finally defined.
These resulting alternatives are studied firstly for the maximum development (MD), thus
safeguarding sufficient spaces for future development without constraints. At the same time, the
opening layout and phased development has been taken into account using the master planning
common practice.
Once the alternatives are defined, the layouts are then evaluated against the qualitative and
quantitative criteria. The criteria and ranking of the options is discussed with the Client. A
preferred alternative is selected. This is the alternative to be further developed in the Master Plan.
Figure 7.2 Passenger terminal options and typologies
Source: Mott MacDonald
The results obtained by the selection process are contrasted with the environmental and
operational limitations evaluating the impacts and their mitigations. The scoring and raking have
been discussed and agreed during a workshop with the Client. The Consultant concluded with a
preferred alternative which is the passenger terminal in modified "H" conFiguretion (Bottom row /
center row in the figure).
For the selected passenger terminal alternative, a set of options for the elements of lower
hierarchy items was carried out to produce the maximum airport development layout. This
ensures that over the time the elements do not interfere with each other. The Activity 5 report
analyzes in more detail the different aspects that led to the proposed alternative.
It should be emphasized that given the long development period (50 to 80 years), it has been
considered that some facilities would be re located in the long term to accommodate the
passenger expansion with satellite buildings. The short-term location is analyzed based on
operational efficiency and capex considerations.
With the option selected in Activity 5 and the demand requirements analyzed in Activity 4, the
Consultant proceeded to complete the master plan development for the NAIMCR in Activity 6
according to Contract.

Mott MacDonald | NAIMCR Estudio de Emplazamiento y Plan Maestro Executive Summary
45
Figure 7.3 Preferred option (Maximum Development).
Source: Mott MacDonald

Mott MacDonald | NAIMCR Estudio de Emplazamiento y Plan Maestro Executive Summary
46
Figure 7.4 Evaluation matrix – Passenger Terminal
. Source: Mott MacDonald

Mott MacDonald | NAIMCR Estudio de Emplazamiento y Plan Maestro Executive Summary
47
Figure 7.5 Evaluation Matrix – Cargo Terminal
Source: Mott MacDonald
Figure 7.6 Artistic impression of the airport at its maximum development
Fuente: Gensler

Mott MacDonald | NAIMCR Estudio de Emplazamiento y Plan Maestro Executive Summary
48
8 Activity 6. Development Plan
This starting point of this activity is the facility requirements developed during Activity 4 and the selected preferred development alternative according to Activity 5. Based on this, the Consultant has refined the selected maximum development alternative and produced the NAIMCR development plan. The objective of the task is to present the master plan phasing of the airport.
The phasing analysis starts with the proposed maximum development of the terminal, the airfield, and support facilities. The layouts for the Opening +5 years, +10 years and +20 years are then produced based on the capacity demand analysis for each horizon.
In this regard, it is important to reiterate the view that this airport is not only an airport for the next 30 years (until 2047), but that must be the infrastructure that welcome air transportation in the country far beyond the contractual horizon. Therefore, the Consultant has added to the contract the planning of future development horizon. This led to contemplate the development up to a capacity of 50 million passengers per year. With this, the master plan reflects a balanced planning that will allow the survival of the infrastructure beyond 2047 (and perhaps up to the threshold of the new century).
The Development Plan contemplates the passenger terminal, manoeuvring area, supply areas, Airport City, landside access, areas designated for other aeronautical services and air cargo facilities. For the passenger and cargo terminals, flow charts are presented to show the operation feasibility.
In addition to this, a noise impact and emissions assessment have been carried out for each development phase. This will inform later stages of the project helping to make a decision over environmental and social safeguarding.
The development of the airport for the planned horizons is shown in the following images:

Mott MacDonald | NAIMCR Estudio de Emplazamiento y Plan Maestro Executive Summary
49
Figure 8.1 Airport layout at Opening + 5 years
Source: Mott MacDonald

Mott MacDonald | NAIMCR Estudio de Emplazamiento y Plan Maestro Executive Summary
50
Figure 8.2 Airport layout at Opening + 10 years
Source: Mott MacDonald

Mott MacDonald | NAIMCR Estudio de Emplazamiento y Plan Maestro Executive Summary
51
Figure 8.3 Airport layout at Opening + 20 years
Source: Mott MacDonald

Mott MacDonald | NAIMCR Estudio de Emplazamiento y Plan Maestro Executive Summary
52
Figure 8.4 Airport layout at Maximum Development 50 mppa.
Source: Mott MacDonald

Mott MacDonald | NAIMCR Estudio de Emplazamiento y Plan Maestro Executive Summary
53
It has been highlighted that, the landside access and utilities outside the airport boundary are a must for the development of the airport. These have to be developed in parallel to the NAICMR for it to be efficient and profitable.
The technical report closes out with a review of the land use. The appendices of the report contain the airside simulation results carried out with the software SIMMOD and the airport development drawings, terminal concepts, noise and emissions impact drawings and affected public services.
An initial set of 3D visualizations have been produced. These show the magnitude of the works and the primary area of involvement (land that is recommended to be acquired and integrated within the boundary of the airport), and a secondary area for related activities whose property would continue in the hands of the private owner, but whose land uses should be regulated as industrial or mainly to activities related to the use of the airport.
Figure 8.5 Land use map for 2047.
Source: Mott MacDonald

Mott MacDonald | NAIMCR Estudio de Emplazamiento y Plan Maestro Executive Summary
54
9 Activity 7. Preliminary Business Plan
Activity number 7 develops the Preliminary Business Plan based on the master plannning
activities developed in steps 1 to 6.
These results can be summarised in the following table:
Table 9.1 Passenger terminal area, annual traffic and design year, passenger terminal opening year.
Design Year Opening Year
Phase Terminal m2
Traffic mppa
Pesimistic case
Base case
Optimistic case
Pesimistic case
Base case
Optimistic case
I 128,958 9.80 2,037 2,032 2,026 2032 2027 2021
II 146,107 11.40 2,043 2,037 2,030 2,038 2,032 2025
IIIa 186,984 15.20 2,058 2,047 2,040 2,053 2,042 2,035
IIIb 224,628 20.10 N/A 2,060 2,049 N/A 2,055 2,044
Source: Mott MacDonald
These figures guide the development in stages and they are used with the appropriate breakdown
of works (see main body of report) to investigate the cost of the development.
9.1 CAPEX
The initial calculations including the earthworks costs resulted in an estimated investment of
US$2,322,421,261 for the initial phase, and a total investment of US$3,584,452,000 for all
phases.
In following iterations, these costs were optimized mainly in terms of the unit costs of the
earthworks. This was based on experience from similar projects in terms of the required volume
and the construction methodology and costing. It was concluded that the cost of the infrastructure
described in the master plan for each phase can be summarized according to the table below:
Table 9.2 Investment optimised by phase
Preliminary activities
Phase 1 Phase 2 Phase 3 Total
Land acquisition
41,312,581 0 0 0 41,312,581
Groundworks 0 533,771,229 172,485,761 141,669,309 847,926,299
Terminal 0 596,773,800 88,944,030 142,298,730 828,016,560
Airside infrastructure
0 509,533,788 110,177,060 133,235,242 752,946,089
Airside buildings
0 52,060,277 26,680,500 42,078,960 120,819,737
Utilities 0 86,327,526 11,540,315 24,573,389 122,441,230
Landside 0 130,820,601 15,367,319 91,715,318 237,903,238
Off-airport commercial area
0 23,421,857 0 0 23,421,857
Total 41,312,581 1,932,709,077 425,194,985 575,570,948 2,974,787,591
Source: Mott MacDonald

Mott MacDonald | NAIMCR Estudio de Emplazamiento y Plan Maestro Executive Summary
55
Land acquisition costs are indicative and according to entries in the land registrar, but its value
when acquired by the State will need to be determined following the administrative procedures
because of the potential economic activities that could be affected and would need to be
compensated, this could in fact increase the value.
These costs were calculated to 2017 rates, so in order to use them in the financial model they
need to be carried forward using an estimated rate of inflation so all costs in the model are
considered at a base date of 2022 that is when the consultant has estimated that financial close
will occur.
9.2 Implementation Strategy
In order to materialize the proposed infrastructure there are several implementation alternatives:
● Execution by Public Works (PW) – Public Sector Financing
● Hybrid execution – Public Private Partnership (PPP):
– Earthworks (PW) / Construction (PPP)
– Earthworks + Airside infrastructure (PW) / Terminal (PPP)
● Total execution as PPP –Private Financing
The Government of Costa Rica has requested that this study is based on the total private
financing alternative.
9.3 Financial Model and Business Plan
The fact that the client wants to investigate 100% private financing leads to construct a business
model that considers private equity and 70% finance of the investments.
It should be noted that the resulting circa 17% reduction in required investment in is not enough
to make the project viable, and several financial aspects were considered to base our
recommendation of an increase in aeronautical tariffs above the current level. Additionally, the
recommendation includes and applicable pre-financing tariff during the construction phase that is
set to last five years in the preliminary business plan. Our recommendation also includes allowing
the Duty Free to be managed by an international operator at the new airport.
In order to service the debt, it was necessary to sculpt the capex to be able to have a 5-year
period from the commencement of operations. The proposed sculpting involves the consolidation
of Phases I and II at the beginning of the PPP period.
This requirement leads to the consolidation of phases 1 and 2 into the opening of the APP.
In figure 9.1 it can be observed that opposed to the initial statement in table 9.1, now the opening
phase of the terminal building involves the construction of 146,107 sqm instead of 128,958 sqm,
so that instead of expanding the terminal after 5 years, the required expansion falls 10 years after
opening and thus provides a longer period of debt servicing before requiring a re-financing for the
new expansion.

Mott MacDonald | NAIMCR Estudio de Emplazamiento y Plan Maestro Executive Summary
56
Figure 9.1 Investment Programme necessary to achieve 100% PPP finance
Source: Mott MacDonald
Accepting the previous considerations that are conditions imposed by the capital markets, we have configured the financial model.
The following table summarises the indicative term sheet discussed with several credit entities:
Table 9.3 Indicative term sheet
Amount 70% of initial uses - Capped at $2 billion
Term Up to 20 years with a tail of 5 years minimum
Rate Libor + 6% with 1/4 to 1/3 of Swap (Fixed Rate)
Fees Standard structuring/ arrangement fees between 1.50% and 1.75%, plus commitment fees and prepayment penalties
Debt service reserve account (DSRA) 6 months
DSCR 1.30 to 1.25
Grace period Up to 5 years (principal and interest)
Source: Mott MacDonald
The results of the financial model show acceptable returns for equity investors that can be
summarised in the following table:
Table 9.4 Financial model returns
Traffic case Base
Pre-financing tariff US$10,00 from 2022 to 2026
Departure fee US$40,00 from 2027 (Commencement of operations)
Initial investment US$2.2 billion
Earthworks included Yes
Duty Free Managed by IMAS
Initial debt – Amount US$1.8 billion (70%)
Initial equity US$770 million (30%)

Mott MacDonald | NAIMCR Estudio de Emplazamiento y Plan Maestro Executive Summary
57
Initial debt – Term 20 years
Minimun DSCR 1,20x
Maximum Net debt to EBITDA 8,5x
Refinancing US$1.6 billion (5x EBITDA)
Equity IRR 12.3%
Source: Mott MacDonald
Waterfalls and flows are shown for equity and debt.
Figure 9.2 Investor’s flows diagram
Source: Mott MacDonald
Figure 9.3 Debt’s flows diagram
Source: Mott MacDonald

Mott MacDonald | NAIMCR Estudio de Emplazamiento y Plan Maestro Executive Summary
58
The following sensitivities were analysed:
Table 9.5 Sensitivities analysed
Parameters Values TIR / DSCR
Pre-financing tariff $10.00 12.3% / 1,20x [Base Case]
$9.00 12,15% / 1,19x
$8.00 12,0% / 1,17x
Departure fee $40.00 12,3% / 1,20x [Base Case]
$39.00 11,9% / 1,16x
$41.00 12,6% / 1,21x
Duty Free IMAS 12,3% / 1,20x [Base Case]
Competitive 13,8% / 1,28x
Source: Mott MacDonald
9.4 Feasibility
This case is considered the most likely scenario, and confirms the financial viability of
the project. This viability is confirmed both in case of being executed as a Public Works
or also under these conditions as financed 100% by private investment
The visualization of the tendencies exhibited by the model with regards to the scenarios tested
will allow, in the future, that according to the traffic and market evolution, conclude on the
different policies and timing that might be convenient or necessary to maintain the viability of the
project.
The model that serves as base for these conclusions is provided with this report.
Mott MacDonald | NAIMCR Estudio de Emplazamiento y Plan Maestro Executive Summary
59
10 Conclusions
As conclusion of all studies, the feasibility study of the Nuevo Aeropuerto Internacional
Metropolitano of Costa Rica (NAIMCR) returns a positive answer. It has been demonstrated that
the construction of the NAICMR in the region of Orotina, province of Alajuela, can be developed
with Public and Private Participation in accordance to the master plan developed and under
observance of the financial parameters presented in the present report.
The NAIMCR site had already been proposed as the most suitable and preferred in different
previous studies carried out by other Consultants. The NAIMCR is aimed to replace the current
international Juan Santamaria Airport (AIJS). This study confirms the suitability of the selected
location and its construction. The NAIMCR could be developed to provide services to more than
50 million passengers a year at the proposed location.
It is also concluded that the Consultant has not observed any excessive difficulties from the point
of view of the environment impact, transport connectivity, or utilities that could impede the
realization of this project.
It need to be stressed that the expansion of road access as discussed in Activity 3 must be
completed before the new airport starts operations.
It is not seen as a disadvantage that the NAIMCR is planned to start operation at the end of the
Juan Santamaria international airport Concession agreement expiration.
It rather seems a logical consequence of a process that should not be launched later in the year
2018 considering the need to run a series of preparatory actions. Ultimately, these actions would
entail the award through a public-private partnership of a B.O.T. procurement (Build, Operate and
Transfer to State) to an investor. The qualification of the investor would have to present
satisfactory credentials so that the State of Costa Rica entrusted him the realization of this
Proyecto País which requires an investment of two billion dollars in its first phase.
In this case, to make the project feasible, it is a precondition, that the State of Costa Rica adopts
the policies required with regards to the type of operations or closure of the other two existing
airports, to ensure the investors that the traffic of commercial passengers will materialize at the
NAIMCR.
As indicated before, a public private partnership (PPP or P3) would be needed this Project to
materialize. The duration of the concession would exceed the initially planned, with a start date
in 2022, construction span of five years and concession ending in 2060 (a period of operation of
33 years), i.e. a total of 38-year term.
As a function of all the studies, it is concluded that the airport is feasible from the
constructive, operational point of view, and it is bankable through a public-private
partnership involving 100% of financing from sources other than State budgets.
Below, is the proposed implementation programme.

Mott MacDonald | NAIMCR Estudio de Emplazamiento y Plan Maestro 60 Executive Summary
NAIMCR | RE | 02 | May 16th 2017
Figure 10.1 Implementation Schedule
Source: Mott MacDonald
Código Tarea S1 S2 S1 S2 S1 S2 S1 S2 S1 S2 S1 S2 S1 S2 S1 S2 S1 S2 S1 S2
0.1 Airport
Structuring of PPP (P3) - Tender and Legal docs
Bidding APP
Bid evaluation
Contract agreement and financial closure
Earthworks
Detail Design
Construction
ORAT
1 Land acquisiton
Define Land Use - Legal declaration of Interest
Land use - airport surrounding
Strategy land acquisition - negotiation
Land acquisiton - payment and posecion
2 Environmental-Social
Impact Analysis
EIA - based on declaration of interest
Environmental licensing
EIA approval
4 Airspace
Actualization of Meteorological Data
Analysis and recommendations
Draft Operational procedures planning
Final operational procedures implementation
5 Connectivity
Road access links review period 2017-19
Planning and design of road links
Construction (in 2 phases)
Rail links review period 2017-22
Planning and design of rail links
Construction (optional)
6 Utilities connection
Analysis and recommendations
3rd party execution
Communications
Electtricity
Water
2023 2024 2025 2026 20272018 2019 2020 2021 2022
Licensing applications (Jun 18)
Licensing (Nov-18)
Financial closure (Nov-21)
Award (Mar-20)
RfP (May-19)
Contract award (Jul-20)
Bid submittal (Dec -19)
Opening
Land use modification (Mar-18)
Land use to industrial (Jun-18)
Definition of responsibilities and mechanisms (Apr-17)
Mobilization and earthworks (Feb-22)
Kick off Detail Design (Jan-23)
Start construction (Jan-24)Traffic forecast review (Jun-22)
Legal procedures (Nov-18)

Mott MacDonald | NAIMCR Estudio de Emplazamiento y Plan Maestro 1 Executive Summary
NAIMCR | RE | 02 | May 16th 2017
mottmac.com