N° 49 - May 2019 Economic GPS - PwC
18
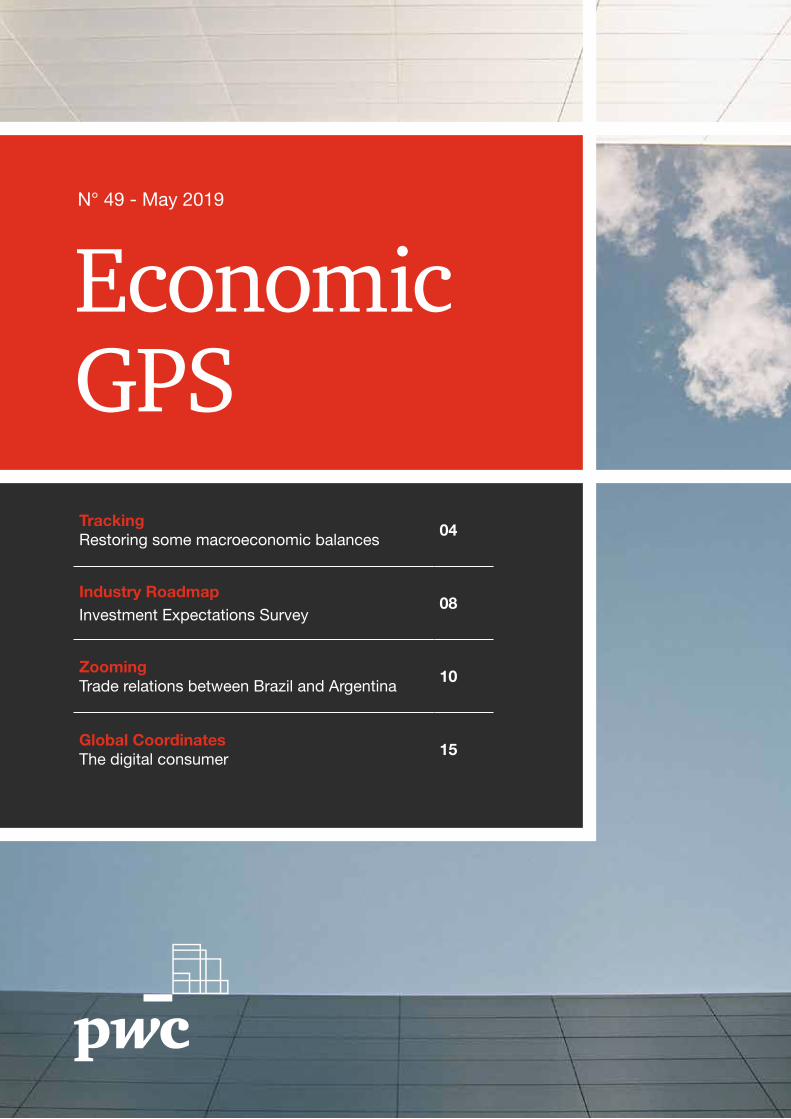
N° 49 - May 2019 Economic GPS Tracking Restoring some macroeconomic balances 04 Industry Roadmap Investment Expectations Survey 08 Zooming Trade relations between Brazil and Argentina 10 Global Coordinates The digital consumer 15
Transcript of N° 49 - May 2019 Economic GPS - PwC
N° 49 - May 2019
Economic GPSTrackingRestoring some macroeconomic balances
04
Industry RoadmapInvestment Expectations Survey
08
ZoomingTrade relations between Brazil and Argentina
10
Global CoordinatesThe digital consumer
15

Undoubtedly, Argentina is at a complex juncture. However, if for a moment we can detach ourselves from the present
picture and watch the full movie, we could see not only the path traveled, but also the road ahead.
Having started off with major macroeconomic imbalances by the end of 2015, today we are in the context of an economy that has corrected to a great extent the distortion in certain key relative prices, such as energy and public utilities tariffs, and has followed a path for fiscal accounts to reach an equilibrium situation; on the side of external accounts, foreign exchange controls were lifted and also a strong adjustment of the current account deficit took place during last year.
Now, the question is whether these changes are enough. And the answer is no. All these corrections were indeed necessary, but not sufficient.
In the first place, inflation is still a challenge, as it was not possible to tame it over more than 10 years. The monetary policy implemented by the Argentine Central Bank should be aimed at pulling down inflation. Nevertheless, there are two constraints. Nominal interest rates must be necessarily high to remain positive in real terms and operate on inflation, but high rates sustain indirect creation of money through the Central Bank’s remunerated liabilities. In turn, given the peculiar bimonetarism of our economy, devaluations produce an immediate effect on inflation by the principle of pass through; however, not enabling currency depreciation and generating a foreign exchange lag to curb inflation would operate in the medium term on foreign restrictions and on the reserves supporting the liabilities of the Central Bank, usually leading to abrupt corrections in the exchange rate. Although convergence is possible, without a more comprehensive stabilization plan simultaneously addressing the multiple causes of inflation the process could be very lengthy.
Second, it will be necessary to maintain fiscal balance, a required condition for developing the process of monetary stabilization. Even though it is probable that primary balance can be reached in the course of this fiscal year, the dynamics of income and expenses calls for strengthening commitment to this goal. On the one hand, high interest due to public debt creates the need to focus on obtaining primary surplus to meet these commitments and uphold the condition of intertemporal solvency of the public sector. On the other hand, social expenditure -which accounts for approximately one third of total spending- follows a logic of index adjustment based on past inflation, while income is adjusted according to economic performance and to inflation expectations. To bridge the gap, the sooner inflation drops, the greater economic growth should be; otherwise, some other mechanisms must be found to narrow it.
In this regard, once more it can be clearly seen that structural reforms are needed (regulation of the labor market, at the tax and social security fronts, among others) that can harmonize social demands, which translate into public expenditure, with a tax burden that enables a sustainable way of improving economic productivity. Without this, we cannot aspire to a competitiveness level compliant with ongoing improvement of the life standard of population; rather, it could only be sustained on the basis of a constantly devalued exchange rate.
Within this framework, certain sectorial initiatives looking in the right direction of productivity enhancement are welcome. The agreements entered into for the development of the Vaca Muerta field and the Law on the Promotion of Knowledge Economy, recently enforced, are clear examples. Initiatives like these should be government policies. They will not only allow the recovery of self-sufficiency in the supply of energy and the creation of skilled labor employment opportunities, but also, in the medium term, they will be a genuine source of foreign currency, whose short supply has resulted in a sluggish economy since mid-last century.
José María SeguraChief Economist PwC Argentina
Seeing the movie, not just a frame
TrackingRestoring some macroeconomic balances
In an environment like the Argentine context, which has recently showed significant changes in macroeconomic variables, time and focus are often given to urgent matters rather than to important ones. However, if we overlook the short term and take a further retrospective view, it is clear that in the past years we have gone through structural changes that are relevant to the future of Argentine economy.
ZoomingTrade relations between Brazil and Argentina
Although trade relations between Brazil and Argentina have always been intricate and changing, they have had some ups and downs in recent years, after flourishing periods. We have reviewed the most salient characteristics of this trade relation to understand the relevance of our country to the neighboring country’s trade, using data from a Brazil’s perspective as a starting point.
Sum
mar
y
Industry RoadmapInvestment Expectations Survey
From the Economy Services area, we have begun to inquire as of March about the investment expectations of the Argentine businessmen. Through a quarterly survey, we seek to gauge a variable as important as investment.
Global CoordinatesThe digital consumer
More than one decade has elapsed since the Great Recession signaled the beginning of what is usually termed the “new normal”, a sort of recalibration of what is possible in terms of global economic growth. At the same time, an interesting effect was produced: consumers around the world put up an unexpected resistance, driven by the technological advances that brought about a Golden Age of consumption by offering a global 24-hour marketplace for goods and services, available to anyone with a mobile phone.
Restoring some macroeconomic balances 04
Investment Expectations Survey 08
Trade relations between Brazil and Argentina 10
The digital consumer 15
Monitors 16
Table de indicators 17
Our services. Contacts 18
04
10
8
15

4
In an environment like the Argentine context, which has recently showed significant changes in macroeconomic variables, time and focus are often given to urgent matters rather than to important ones. However, if we overlook the short term and take a further retrospective view, it is clear that in the past years we have gone through structural changes that are relevant to the future of Argentine economy.
Present-day Argentina is in a recessive context with high inflation and a shrinking labor market, and about to face an electoral process that forebodes more uncertainty and volatility. Yet, should we detach ourselves from this juncture for a moment, we could see that in recent years there has been a series of successive changes in certain basic macroeconomic balances, which could empower the new government chosen in the coming election to build a growth agenda with a medium-term perspective.
For the private sector to take the plunge and invest, certain basic conditions of economic stability should exist. Two of the indicators to pay attention to are the macroeconomic variables of primary fiscal deficit and current account. In recent history, the years from 2006 to 2009 recorded twin surpluses, as both the public sector and the foreign trade sector presented a positive balance. This period was coincident with high international prices of commodities, Argentina's main exportable assets; this fact generated tax revenue via export duties (which at that moment represented little more than 10% of total revenue) and high income from exports.
In the subsequent years, these positive results were reversed. As shown in Graphic 1, where fiscal balance
TrackingRestoring some macroeconomic balances
GRAPHIC 1
Primary fiscal deficit and current account as a percentage of GDP
Source: Prepared by the authors based on INDEC and Ministry of Economy*The 2019 value for primary fiscal balance is the government’s goal, and that for the current account arises from IMF, WEO projections, April 2019.
and current account are shown as a percentage of GDP, from 2010 onwards the path of fiscal surplus and current account surplus started transforming into deficit. With the passing of years (2010-2016), primary surplus turned into deficit, mostly affected by the items of social security expenses (which went up from 5.6% of GDP on average between 2006 and 2009 to 7.8% in the next seven years) and subsidies (their
share in GDP grew from an average 1.6% in the period from 2006 to 2009 to 3.3% on average between 2010 and 2016), while the decline of exports with respect to imports in a context of reduction in the terms of trade and appreciation of the real exchange rate had an impact on the balance of the fiscal account.
2006
20072008
2009
201020112012
2013
2014
2015
2016
2017
2018
2019
-5%
-4%
-3%
-2%
-1%
0%
1%
2%
3%
4%
-6% -5% -4% -3% -2% -1% 0% 1% 2% 3% 4%
Cur
rent
acc
ount
/GD
P %
Primary deficit/GDP %
5
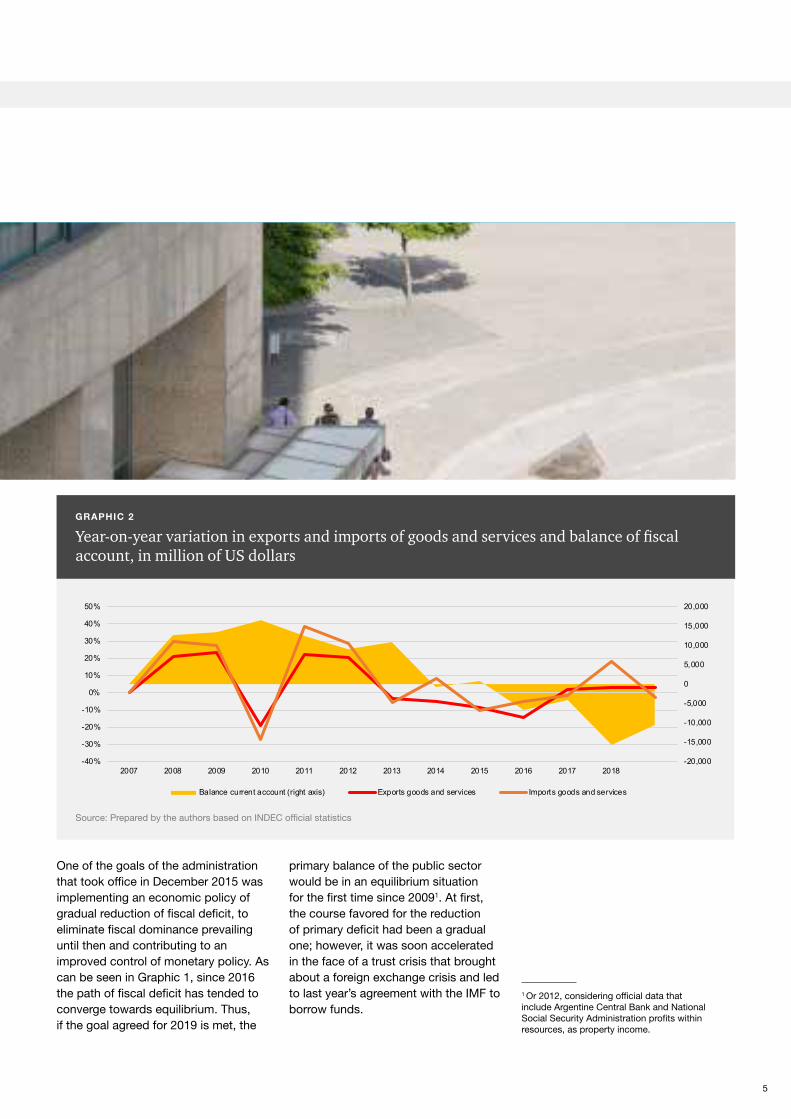
GRAPHIC 2
Year-on-year variation in exports and imports of goods and services and balance of fiscal account, in million of US dollars
Source: Prepared by the authors based on INDEC official statistics
1 Or 2012, considering official data that include Argentine Central Bank and National Social Security Administration profits within resources, as property income.
One of the goals of the administration that took office in December 2015 was implementing an economic policy of gradual reduction of fiscal deficit, to eliminate fiscal dominance prevailing until then and contributing to an improved control of monetary policy. As can be seen in Graphic 1, since 2016 the path of fiscal deficit has tended to converge towards equilibrium. Thus, if the goal agreed for 2019 is met, the
primary balance of the public sector would be in an equilibrium situation for the first time since 20091. At first, the course favored for the reduction of primary deficit had been a gradual one; however, it was soon accelerated in the face of a trust crisis that brought about a foreign exchange crisis and led to last year’s agreement with the IMF to borrow funds.
-20,000
-15,000
-10,000
-5,000
0
5,000
10,000
15,000
20,000
-40%
-30%
-20%
-10%
0%
10%
20%
30%
40%
50%
2007 2008 2009 2010 2011 2012 2013 2014 2015 2016 2017 2018
Balance current account (right axis) Exports goods and services Imports goods and services

6
The items modified in the last three years to achieve this reduction in deficit are on the side of expenses, mainly subsidies, where after years of tariff lag the Government set in motion a restoration of tariff prices. Taking the cases of energy and transport as reference, Graphics 3 and 4 depict, in the first case, how the increasing cost of energy was decoupled from the price paid by the consumer (compensated through subsidies) and, in the second case, how the bus fare in Buenos Aires metropolitan area was falling behind inflation.
GRAPHIC 3
Monthly price of energy, $
GRAPHIC 4
Urban passenger transport average fare (Buenos Aires metropolitan area) and inflation. Base index 2000=1
Source: Prepared by the authors based on CAMMESA
Source: Prepared by the authors based on the General Directorate of Statistics and Census (Ministry of Treasury of the City of Buenos Aires).
As to the foreign imbalance, its reduction over last year and presumably also in the current year was due in part to an improvement in competitiveness thanks to the price of exports after devaluation, and mostly to the drop in demand for imports as a result of the retracted economic activity. In the medium term, Argentina must fix its limited exporting capacity to avoid relapsing into episodes of external sector crisis, which prove too costly in terms of economic activity. For this purpose, it has to be able not only to develop new markets, but also to
enhance productivity in tradable goods sectors. In this regard, infrastructure works have already started, which were necessary to later materialize investments in the tradable sector. For example, works are being developed in the Neuquén area in connection with the sector of non-conventional resources related to the Vaca Muerta field, which in addition to being a future source of investments will make it possible to increase exports and generate activity in this sector and this region.
0
500
1,000
1,500
2,000
2,500
3,000
3,500
ene-
11m
ar-1
1m
ay-1
1ju
l-11
sep-
11no
v-11
ene-
12m
ar-1
2m
ay-1
2ju
l-12
sep-
12no
v-12
ene-
13m
ar-1
3m
ay-1
3ju
l-13
sep-
13no
v-13
ene-
14m
ar-1
4m
ay-1
4ju
l-14
sep-
14no
v-14
ene-
15m
ar-1
5m
ay-1
5ju
l-15
sep-
15no
v-15
ene-
16m
ar-1
6m
ay-1
6ju
l-16
sep-
16no
v-16
ene-
17m
ar-1
7m
ay-1
7ju
l-17
sep-
17no
v-17
ene-
18m
ar-1
8m
ay-1
8ju
l-18
sep-
18no
v-18
ene-
19m
ar-1
9
Monomic Price+ Transportation
Seasonally weighted Monomic Price (Energy + Power) + Other Income / Paid bythe user
0
5
10
15
20
25
30
35
40
2000 2001 2002 2003 2004 2005 2006 2007 2008 2009 2010 2011 2012 2013 2014 2015 2016 2017 2018 2019
Bus tariff CPI

7
In conclusion, Argentina is at a juncture of high volatility, aside from the fact that macrofinancial variables were apparently stabilized in the last few weeks. Nevertheless, when looking ahead, we should not lose sight of the fact that certain imbalances were remediated in recent years, a necessary -though not sufficient- condition for the country to start off in the path of long-term growth. The adjustment of relative prices through tariffs and the reduction of fiscal and foreign trade deficit, together with the development of certain relevant infrastructure works that tend to cut on supply costs, constitute a proper starting point for the new government that will be sworn in next December to apply the corrections that the current administration has not yet made. Planning forward, it will be crucial to implement a deep tax reform, now truncated due to the prevailing situation, as well as in labor and capital markets, coupled with seeking solutions for a social security system that has become a hard to finance burden on public expenditure.
If we walk past Graphic 1, after taking a walk through unsightly quarters, the neighborhood of surpluses is closer at every step.
GRAPHIC 5
Multilateral real exchange rate, base 1999=1
Source: Prepared by the authors based on Argentine Central Bank
0.8
1
1.2
1.4
1.6
1.8
2
2.2
2.4

8
From the Economy Services area, we have begun to inquire as of March about the investment expectations of the Argentine businessmen. Through a quarterly survey, we seek to gauge a variable as important as investment.
The survey will be carried out on a quarterly basis and will allow the creation of an index that identifies the investment trend. In this first issue, we provide a brief review of the results obtained, which will be nourished as we have new considerations.
According to the Investment Expectation Survey conducted, 50% of respondents believe that the profitability of their company in the first quarter of 2019, measured as profit on sales, is lower than that obtained in the same period of 2018. It should be pointed out that last year, during the first quarter, the economy grew 4.1%, prior to the confidence crisis that led to the devaluation of the peso in subsequent months and that resulted in the decline of the economic activity.
When asked regarding the investment
Investment Expectations Survey
Industry Roadmap
GRAPHIC 1
How do you expect the profitability of your company (measured as profit on sales) to be for the first quarter of the current year compared with the same period of the previous year?
planned for the next twelve months as against the previous year, the answers obtained were more scattered, in thirds. Expectations are divided almost equally in high, low and same; 33% of respondents estimate to invest amounts between US$ 1 and US$ 5 million. The difference in investment expectations changes when evaluating these responses by areas: it is in the cases of energy, oil and gas, agriculture, technology and
insurance where the greatest number of responses is grouped under "high". While those in retail/consumption, communication, entertainment and media, gather the largest number of responses in "low".
When consulted about the financing of the expected investment, 60% agree that they will use their own capital while 30% will do so through bank financing.In addition, it is worthwhile evaluating
GRAPHIC 2
How do you plan to finance investment in 2019?
33%High
16%
50%
5%5%
60%
30%
Same
Low
Bank Financing Own capital Stock Market Others, specify

99
GRAPHIC 4
Purposes of the investment. Importance of the objectives described below in investment motivation.
GRAPHIC 3
Among the following factors, which ones have favored or limited your investment decision for 2019? Please point out the impact of each of them.
the factors that favor or limit the investment decision.
Among the limiting factors, three stand out: changes in total demand, financial situation of the market and factors related to the context, such as economic policy, tax regulations, among others.
The first of the limitations is consistent with the drop in consumption that has been evident since last year's third quarter and that, in agreement with statistics of the first months of the year (supermarket sales, shopping malls, wholesale intermediaries and retail sales) continues decreasing.
On the opposite side, among the factors that have favored the investment decision, technical factors are highlighted, such as those related to the training of staff, access to new technologies, among others. It is also notable that in the case of companies belonging to the agribusiness and retail/consumption sector, the evolution of exports became a motivating factor of investment.
Also, among the factors that drive investment are the improvements in the performance of the productive team, as well as the replacement of equipment.
Investment is one of the most volatile elements of demand and, at the same time, represents one of the most dynamic variables of the economic cycle. The close control of investment decisions of the private sector in Argentina allows us to better understand the possible prospects.
37%33%
43%
27% 27% 29%30%
47%50%
7%
37%32%33%
20%
7%
67%
37% 39%
1. Ampliación decapacidad
2. Reposición deequipos antiguos
por nuevos
3. Mejoras en elrendimiento del
equipo productivo
4. Desarrollo de lapropiedad
intangible yPatentes
5. Lanzamiento deproductos nuevos
4. Otros fines(mejoras
comerciales yadministrativas,contaminación,seguridad, etc.)
Muy importante Importante Sin importancia
7%
7%
10%
10%
3%
20%
13%
27%
43%
50%
13.4%
40%
7%
77%
23%
60%
20%
33%
17%
6.6%
3%
7%
7%
17%60%
17%13%
Very favorableFavorableLimitedWith no impactDon’t know/No reply
Changes in total demand
Changes in export
Company’s financial situation
Market’s financial situation
Technical factors (labor preparation, access to new technologies and labor’s force attitude toward it, administrative permits subordinated to technical conditions, etc.)
Others (economic policy, tax regulations, manufacturing on demand, competition, etc.)
1. Capacity expansion
2. Replacement of old equipment by new equipment
3. Productive performance
enhancements
4. Development of intangible property
and Patents
5. Launch of new products
6. Other purposes (commercial and
administrative improvements,
pollution, security, etc.)
Very important Important No important

10
Although trade relations between Brazil and Argentina have always been intricate and changing, they have had some ups and downs in recent years, after flourishing periods. We have reviewed the most salient characteristics of this trade relation to understand the relevance of our country to the neighboring country’s trade, using data from a Brazil’s perspective as a starting point.
During the last 15 years, trade for goods between Argentina and Brazil has seen ups and downs due to the economic recessions in both countries. In 2014, Brazil’s economy was hit by recession, partly brought about by a political crisis related to corruption, and partly due to a flagging model in which government measures aiming to boost consumption, such us the rise in the minimum wage, tax exemptions and subsidies for the purchase of goods, were no longer fueling economic activity. Since 2011, Argentina has not seen a solid growth either, with a boom and bust cycle, characterized by strong devaluations of its currency (2014, 2016, 2018).
Against this backdrop, the upward trend in trade during the first years of the period under analysis was overshadowed by the recurrent crises. Therefore, it is interesting to evaluate the changes in Brazil’s trade and its bilateral trade transactions with Argentina, to understand the relative relevance of our country in it.
ZoomingTrade relations between Brazil and Argentina
Brazil’s imports from Argentina represented 9.7% of Brazil’s total imports in 2003. After that, a constant slowdown in imports has been observed since 2009, when they declined to 8.8% until reaching 6.1% in 2018. However, Brazil’s exports to Argentina were characterized by
fluctuations. They stood at 6.2% of total exports in 2003, went up to 9.2% in 2010 to decline to 6.3% again in 2014. In 2017, they rose to 8.1% and then dropped to 6.2% in 2018. As mentioned above, exports from Brazil to Argentina have been more volatile than imports from Argentina.
GRAPHIC 1
Evolution of Brazil's imports from Argentina, the rest of the world (RW) and its share of total imports (in millions of USD and %)
GRAPHIC 2
Evolution of Brazil's exports to Argentina, RW, and its share of total exports (in millions of USD and %)
Source: Prepared by the authors based upon data obtained from Brazil’s Ministry of Industry, Foreign Trade and Services (MDIC).
Source: Prepared by the authors based upon data obtained from the MDIC.
0%
2%
4%
6%
8%
10%
12%
-
50,000
100,000
150,000
200,000
250,000
300,000
2001 2002 2003 2004 2005 2006 2007 2008 2009 2010 2011 2012 2013 2014 2015 2016 2017 2018
Imports from RW ARG exports ARG share/Total
Brazilian economy crisis
0%1%2%3%4%5%6%7%8%9%10%
-
50,000
100,000
150,000
200,000
250,000
300,000
2003 2004 2005 2006 2007 2008 2009 2010 2011 2012 2013 2014 2015 2016 2017 2018
Exports to RW Exports to ARG ARG share/Total
Brazilian economy crisis

11
The development of the bilateral trade relation from a Brazil’s perspective took place within a context of growth of its foreign trade in terms of volumes until 2011, when it hit its peak in the period. Since then, there has been a reduction in volume, even though it began to emerge in 2017. As shown in graphic 1, imports of Argentine products into Brazil (Argentine exports) grew at a substantial pace until 2011, mainly due to Brazil’s imports of products linked to the automotive sector. In fact, these imports continued growing until the country slid into recession in 2014, and recovered only in 2018, as imports soared 17.1% compared with the previous year. It cannot be ignored, however, that although imports from Argentina were climbing, their share in Brazil’s total imports declined dramatically.
Graphic 2 shows the evolution of Brazil’s exports to Argentina. An upward trend can be observed until 2011, when Early Sworn Statements for Imports (DJAI) began to be applied and Argentina’s economy fell into an economic downturn with subsequent stagnation. In December 2015, the Integral System for Monitoring Imports (SIMI) superseded the DJAI. Since then, the downward path of exports to Argentina changed, though with certain fluctuations in its development.
It must be highlighted that Brazil’s exports to Argentina as well as imports
GRAPHIC 3
Evolution of Brazil’s exports to Argentina (in millions of USD) and the bilateral exchange rate (TCRB) (December 99=1 index)
Source: Prepared by the authors based upon data obtained from the MDIC, INDEC official statistics and the Brazilian Institute of Geography and Statistics (IBGE).
in recent years have been mainly composed of products relating to the automotive sector, showing a solid intra-industry trade within that sector and interdependence between both countries. In this sense, while Brazil’s exports of vehicles and spare parts to Argentina represented 22% of its total exports to our country, they hit a ceiling of 49% in 2017, with an average of 45% between 2014 and 2018.
Among the determinants affecting Brazil’s exports to Argentina relating to the automotive sector, the TCRB1 does not seem to be an important variable.
In this regard, it is possible that there are other integration forces responding to regulatory measures, such as the Economic Complementation Agreement, as well as economic forces resulting from the elimination of tariffs within the MERCOSUR framework. However, there is a negative, although low, influence of the TCRB in Brazil’s exports of products non-related to the automotive sector. As the TCRB rises, Brazil’s exports of products from industries other than the automotive industry shrink slightly. As mentioned above, there seem to be other forces driving bilateral trade, regardless of the real exchange rate between both countries.
1 TCRB: the bilateral exchange rate was calculated using Argentina’s and Brazil’s exchange rates quoted against the US dollar and considering the inflation measured by the National Congress, in the case of Argentina, and the Consumer Price Index published by the IBGE. If the indicator goes up, it determines a real devaluation of the peso against the Brazilian real (higher Argentine competitiveness), while a drop in the index indicates a real appreciation of the Argentine currency.
-
0.20
0.40
0.60
0.80
1.00
1.20
1.40
1.60
0
2,000
4,000
6,000
8,000
10,000
12,000
14,000
16,000
2003 2004 2005 2006 2007 2008 2009 2010 2011 2012 2013 2014 2015 2016 2017 2018
Total non-automotive exports
Exports of automobiles, tractors,others, spare parts and accessoriesTCRB (right axis)

12
The three Mercosur Common Nomenclatures (NCM)2 with a larger share of Brazil's exports to Argentina represented 41% of the total exports to Argentina in 2003, reaching 60% in 2013 and edged up to 63% in 2017 after some fluctuations. During the period from 2014 to 2018, the average was 58%. If we analyze the five, ten or twenty more exported NCM, we will obtain similar conclusions about oscillation. The three most important sectors of goods exported by Brazil to Argentina are automobiles, spare parts and accessories; nuclear reactors, boilers, machines, mechanical devices and appliances and their components; and plastic and related manufacture, respectively.
The concentration of Brazilian imports of Argentine products has shown an unstable behavior. In this regard, the three main Mercosur tariff items currently imported from Argentina accounted for 41% of total imports of goods in 2003, dropping to their minimum value of 38% in 2004, and reaching a maximum of 64% in 2018. The average for the period 2013-18 was 59%.
The first implication is that bilateral trade between these two countries has decreased and, from a Brazilian viewpoint, has lost relative weight compared to other countries, both in terms of its imports of Argentine products and of Brazilian exports to Argentina. A large portion of this bilateral trade is driven by the growth in imports and exports of automotive products between the countries.
The growth of the Brazilian economy in recent years favored an increase in its export sales. According to information from the Ministry of Development, Industry and Foreign Trade, during the period 2003-2018, total imports of goods grew at an
GRAPHIC 4
Evolution of Brazil's imports of Argentine products (in millions of US dollars) and the bilateral exchange rate (index Dec 99=1)
GRAPHIC 5
Brazil’s imports, in millions of dollars and year-on-year variation (%)
Source: Prepared by the authors based upon statistics from MDIC, INDEC and IBGE.
Source: Prepared by the authors based upon statistics from MDIC
2 Mercosur Common Nomenclature (NCM) is a description and coding system to classify goods for customs duties, adopted by the four member States of MERCOSUR.3 Industrial products are those that have been subjected to significant transformation, and can be subdivided into semi-manufactured and
manufactured goods. Semi-manufactured goods have not reached their final form and need to be subjected to an additional production process to become manufactured goods.4 Commodities are goods that are sold in a similar state to that in which they are found in nature, i.e. with a small degree of processing.
average annual 6% rate, driven mainly by industrial products3, while the rest comprised commodities4. Despite a
drop in quantities imported during the recession, in 2018 these were similar in terms of volumes to imports in 2009.
-
0.20
0.40
0.60
0.80
1.00
1.20
1.40
1.60
0
2,000
4,000
6,000
8,000
10,000
12,000
2003 2004 2005 2006 2007 2008 2009 2010 2011 2012 2013 2014 2015 2016 2017 2018
Total non-automotive imports
Imports of automobiles, t ractors, others, spare parts andaccessoriesTCRB (right axis)
-30%
-20%
-10%
0%
10%
20%
30%
40%
50%
-
50,000
100,000
150,000
200,000
250,000
300,000
2003 2004 2005 2006 2007 2008 2009 2010 2011 2012 2013 2014 2015 2016 2017 2018
Brazil’s total imports year-on-year variation of Brazilian imports (total)
13
The second largest group of Argentine products imported by Brazil comprises cereals. This heading grew 61% in terms of volumes in recent years. Commodities such as wheat, barley, corn and rice were the main drivers of these imports of Argentine products by the neighboring country between 2003 and 2018, leaving manufactures of plastic goods in third place, and crude oil in fourth.
Additionally, certain product categories showed sharp increases in the volumes imported by Brazil from Argentina, without necessarily having a significant share in overall imports during the years analyzed. These products include, for example, live plants and floriculture products (in particular, roots); art objects or antique collections, such as paintings, drawings and sculptures; air gun pellets; copper and aluminum manufactures, and products of animal origin.
An analysis of the role of Argentine exports in Brazilian imports shows a decline in the share of the latter in recent years. Argentina lags behind China and the United States as the main country of origin of Brazilian purchases, and is followed closely by Germany, in fourth place, which accounted for 5.8% of Brazilian imports in 2018. In the past, Argentina´s share in total Brazilian imports was normally above 8%, however, since 2010 its relative weight has decreased to close to 6% in the last 5 years (6.1% in 2018, to be exact).
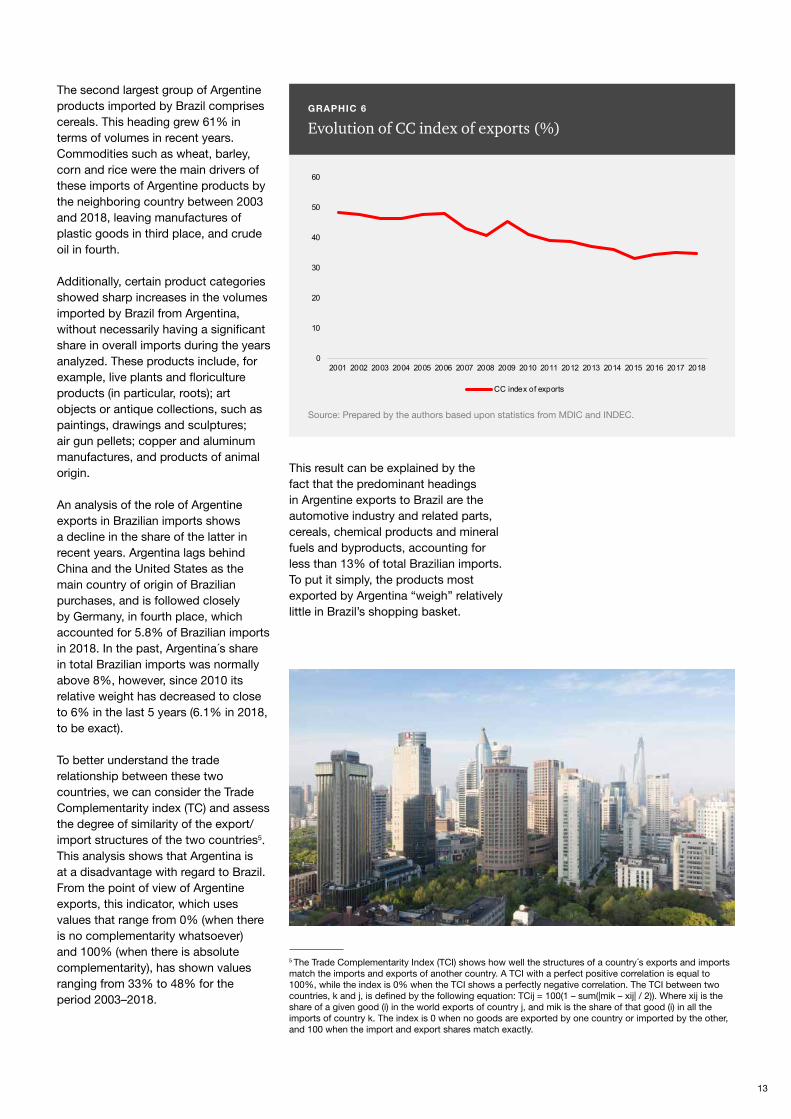
To better understand the trade relationship between these two countries, we can consider the Trade Complementarity index (TC) and assess the degree of similarity of the export/import structures of the two countries5. This analysis shows that Argentina is at a disadvantage with regard to Brazil. From the point of view of Argentine exports, this indicator, which uses values that range from 0% (when there is no complementarity whatsoever) and 100% (when there is absolute complementarity), has shown values ranging from 33% to 48% for the period 2003–2018.
5 The Trade Complementarity Index (TCI) shows how well the structures of a country´s exports and imports match the imports and exports of another country. A TCI with a perfect positive correlation is equal to 100%, while the index is 0% when the TCI shows a perfectly negative correlation. The TCI between two countries, k and j, is defined by the following equation: TCij = 100(1 – sum(|mik – xij| / 2)). Where xij is the share of a given good (i) in the world exports of country j, and mik is the share of that good (i) in all the imports of country k. The index is 0 when no goods are exported by one country or imported by the other, and 100 when the import and export shares match exactly.
GRAPHIC 6
Evolution of CC index of exports (%)
Source: Prepared by the authors based upon statistics from MDIC and INDEC.
This result can be explained by the fact that the predominant headings in Argentine exports to Brazil are the automotive industry and related parts, cereals, chemical products and mineral fuels and byproducts, accounting for less than 13% of total Brazilian imports. To put it simply, the products most exported by Argentina “weigh” relatively little in Brazil’s shopping basket.
0
10
20
30
40
50
60
2001 2002 2003 2004 2005 2006 2007 2008 2009 2010 2011 2012 2013 2014 2015 2016 2017 2018
CC index of exports
14
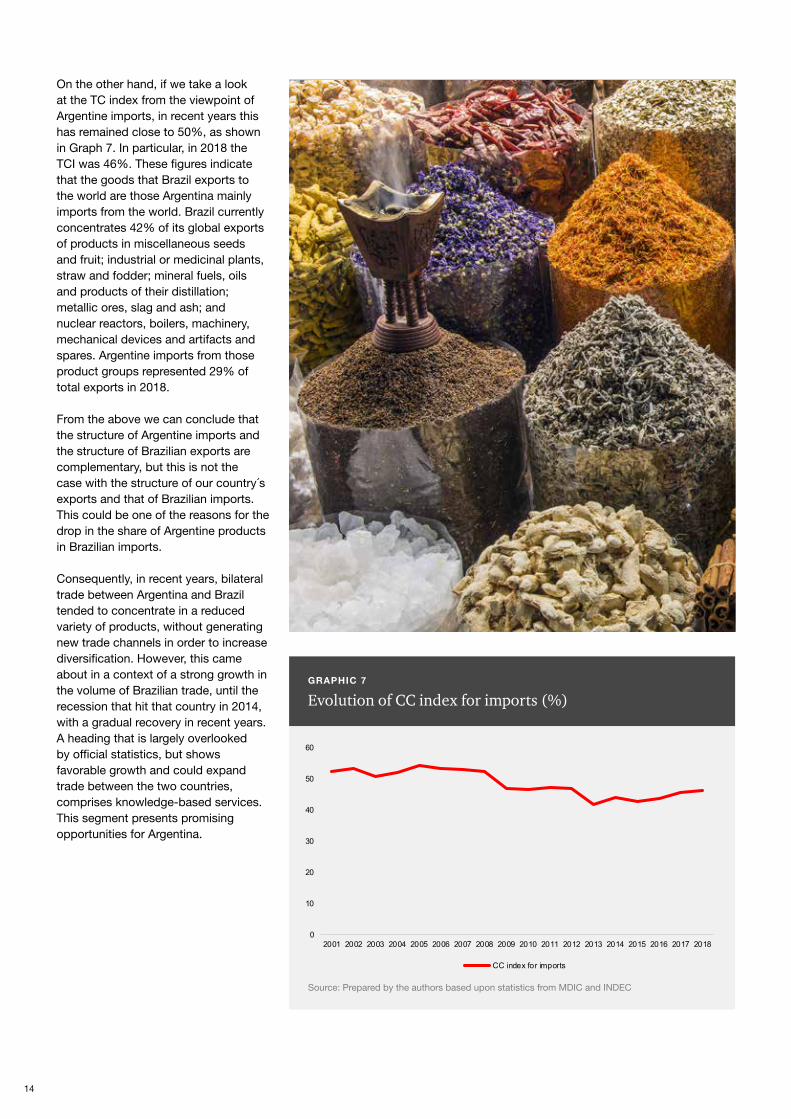
On the other hand, if we take a look at the TC index from the viewpoint of Argentine imports, in recent years this has remained close to 50%, as shown in Graph 7. In particular, in 2018 the TCI was 46%. These figures indicate that the goods that Brazil exports to the world are those Argentina mainly imports from the world. Brazil currently concentrates 42% of its global exports of products in miscellaneous seeds and fruit; industrial or medicinal plants, straw and fodder; mineral fuels, oils and products of their distillation; metallic ores, slag and ash; and nuclear reactors, boilers, machinery, mechanical devices and artifacts and spares. Argentine imports from those product groups represented 29% of total exports in 2018.
From the above we can conclude that the structure of Argentine imports and the structure of Brazilian exports are complementary, but this is not the case with the structure of our country´s exports and that of Brazilian imports. This could be one of the reasons for the drop in the share of Argentine products in Brazilian imports.
Consequently, in recent years, bilateral trade between Argentina and Brazil tended to concentrate in a reduced variety of products, without generating new trade channels in order to increase diversification. However, this came about in a context of a strong growth in the volume of Brazilian trade, until the recession that hit that country in 2014, with a gradual recovery in recent years. A heading that is largely overlooked by official statistics, but shows favorable growth and could expand trade between the two countries, comprises knowledge-based services. This segment presents promising opportunities for Argentina.
GRAPHIC 7
Evolution of CC index for imports (%)
Source: Prepared by the authors based upon statistics from MDIC and INDEC
0
10
20
30
40
50
60
2001 2002 2003 2004 2005 2006 2007 2008 2009 2010 2011 2012 2013 2014 2015 2016 2017 2018
CC index for imports

More than one decade has elapsed since the Great Recession signaled the beginning of what is usually termed the “new normal”, a sort of recalibration of what is possible in terms of global economic growth. At the same time, an interesting effect was produced: consumers around the world put up an unexpected resistance, driven by the technological advances that brought about a Golden Age of consumption by offering a global 24-hour marketplace for goods and services, available to anyone with a mobile phone.
PwC’s tenth Global Consumer Insights Survey , which gathers the sentiments of more than 21,000 online consumers in 27 countries, found that one out of three persons buy something online daily or weekly, which means an increase of five percentage points year-over-year. Conversely, the percentage of consumers who have never shopped online fell by 3%. In this regard, in the first quarter of 2019, Argentina recorded growth in online retail sales vis-à-vis the collapse in offline sales, a behavior that would imply that the consumers are changing their buying habits.
The survey findings also confirm that smartphones have become consumers’ technology of choice for online shopping: 24% of respondents use this device to shop online, while 23% use a PC and 16% a tablet. Noticeably,
this is the first time in the last decade that smartphones displace other digital devices in the preference of users for online purchases.
As internet users become increasingly familiar with digital technology, online payment of services is more and more frequent. In 2018, more than half of the survey respondents paid invoices and transferred money through the internet. In addition, 39% of younger consumers go to online sources first for news about current affairs, compared with 25% overall.
Meanwhile, mobile payment services are gaining widespread acceptance, especially in emerging regions that have leapfrogged landline-based telephone systems and gone straight to mobile and smartphones. The number of people making payments in stores through mobile applications is growing fast. A clear example is the case of Vietnam, where the survey showed that the percentage of consumers using such services in-store increased by 24 percentage points in a single year, to reach 61%. In the Middle East, the percentage grew by 20 percentage points, to 45%. Globally, 34% of consumers paid for purchases using mobile devices, up from 24% a year earlier.
In Argentina, most respondents to the survey conducted by the Retail and Mass Consumption area of PwC Argentina think that a combined
business model, where physical and online stores coexist, will be the main innovative factor in the next five years. Further, the general public identifies as a priority the development of mobile channels for both sales generation and customer service, and the organization’s visibility. Further, investment in products and services’ innovation is expected to become a priority in the medium term.
Andrés Suarez, leader of the Retail and Mass Consumption industry in PwC Argentina, assures that as for the future development of this sector, it is extremely important to foster actions that may allow us to identify new trends and possible changes in consumer behavior. Moreover, he warns that industry leaders must be prepared to take effective actions once the present circumstances have changed. Investing in tools that allow us to anticipate these changes and consumers’ future needs is an indispensable move to preserve business value.
The digital consumer
Global Coordinates
15


Activity and Prices 2016 2017 2018 Jan-19 Feb-19 Mar-19 Apr-19
Real GDP, var % y/y -1.8% 2.7% -2.5% - - nd -
CPI Federal Capital, var % y/y 41.0% 26.1% 45.5% 48.6% 49.7% 52.5% 53.4%
CPI San Luis, var % y/y 31.4% 24.3% 50.0% 53.2% 55.2% 58.0% 59.4%
Industrial Production, var % y/y nd 2.5% -5.0% -10.9% -8.5% -13.4% nd
International Reserves (end period, USD mn) 39,308 55,055 65,806 66,811 68,015 66,187 71,663
Import Cover (month of reserves) 8.44 9.87 12.07 15.85 16.99 16.74 17.17
Implicit exchange rate (M0 / Reserves) 20.81 18.34 21.41 20.25 20.63 20.42 19.58
$/USD, end period 15.85 18.77 37.81 37.04 39.00 43.35 44.01
External Sector 2016 2017 2018 Jan-19 Feb-19 Mar-19 Apr-19
Exports, USD mn 57,879 58,622 61,620 4,586 4,464 5,136 5,305
Imports, USD mn 55,911 66,930 65,443 4,214 4,004 3,953 4,174
Comercial Balance, USD mn 1,969 -8,308 -3,823 372 460 1,183 1,131
Currency liquidation by grain exporters, USD mn 23,910 21,399 20,202 1,756 1,290 1,143 1,915
Labor* 2016 2017 2018 Jan-19 Feb-19 Mar-19 Apr-19
Unemployment, country (%) 7.6 7.2 9.1 - - nd -
Unemployment, Greater Buenos Aires (%) 8.5 8.4 10.5 - - nd -
Activity rate(%) 45.3 46.4 46.5 - - nd -
Fiscal 2016 2017 2018 Jan-19 Feb-19 Mar-19 Apr-19
Income, $mn 2,070,154 2,578,609 3,382,644 363,927 330,891 327,870 357,362
VAT, $mn 583,217 765,336 1,104,580 114,742 103,782 108,397 117,200
Income tax, $mn 432,907 555,023 742,052 71,300 69,441 60,690 72,783
Social Security System, $mn 536,180 704,177 878,379 109,101 85,784 85,692 91,289
Export Tax, $mn 71,509 66,121 114,160 15,573 17,592 18,166 23,820
Primary expenses, $mn 1,790,789 2,194,291 2,729,251 247,266 234,451 257,269 260,669
Primary result, $mn -343,526 -404,142 -338,987 16,658 6,726 -13,037 499
Primary result, $mn 185,253 308,048 513,872 91,700 14,877 57,628 78,173
Fiscal results, $mn -474,786 -629,050 -727,927 -60,038 -4,906 -49,838 -66,073
Financial - interest rates*** 2016 2017 2018 Jan-19 Feb-19 Mar-19 Apr-19
Badlar - Privates (%) 20.04 23.18 48.57 45.90 37.91 41.27 48.50
Term deposits $ (30-59d Private banks) (%) 19.51 21.80 46.22 44.14 36.83 39.83 46.17
Mortgages (%) 19.70 18.61 47.70 47.01 41.63 45.27 43.96
Pledge (%) 20.82 17.42 24.88 26.15 25.57 22.60 22.96
Credit Cards (%) 44.45 42.21 61.11 62.04 61.73 62.27 63.25
Commodities**** 2016 2017 2018 Jan-19 Feb-19 Mar-19 Apr-19
Soy (USD/Tn) 362.6 358.9 342.3 333.8 334.5 329.2 324.2
Corn (USD/Tn) 141.1 141.4 145.0 149.1 147.2 144.3 140.8
Wheat (USD/Tn) 160.3 160.2 182.1 189.9 183.5 166.6 165.5
Oil (USD/Barrel) 43.3 50.9 64.9 51.6 55.0 58.2 63.9
* Quarterly figure. The year corresponds to Q4** includes intrasector public interest*** data 2012/13/14 corresponds to the daily weighted average of December**** One moth Future contracts, period averagep: provisional
Source: INDEC, Secretary of Finance, Ministy of Economy, BCRA, AFIP, Unión por Todos, CIARA, CBOT, NYMEX

This publication has been prepared for general guidance on matters of interest only, and does not constitute professional advice. You should not act upon theinformation contained in this publication without obtaining specific professional advice. No representation or warranty (express or implied) is given as to theaccuracy or completeness of the information contained in this publication, and, to the extent permitted by law, Price Waterhouse & Co. Asesores de EmpresasS.R.L., its members, employees and agents do not accept or assume any liability, responsibility or duty of care for any consequences of you or anyone elseacting, or refraining to act, in reliance on the information contained in this publication or for any decision based on it.
© 2019 In Argentina, the member firms of the global network of PricewaterhouseCoopers International Limited are Price Waterhouse & Co. S.R.L, PriceWaterhouse & Co. Asesores de Empresas S.R.L. and PwC Legal S.R.L, each of which, either separately or jointly, are identified as PwC Argentina.S.R.L, Price Waterhouse & Co. Asesores de Empresas S.R.L. y PwC Legal S.R.L, que en forma separada o conjunta son identificadas como PwC Argentina.
José María Segura | [email protected] | +54 11 4850 6718
Leandro Romano | [email protected] | +54 11 4850 6713
Paula Lima | [email protected] | +54 11 4850 6028
Our services
Contacts
Macroeconomic analysis Sectorial/Quantitative Litigation Regulatory
Monthly/quarterly report
Conferences
Projections and data
Follow up and projection by sector
Quantification of demand
Applied econometrics
Revenue forecast
Surveys
Support of experts’ reports relating to economic matters
Dumping
Antitrust
Tax benefits
Benefit/price structure
Quantification of impacts