N. · 12 The Bank has followed the same signific
50
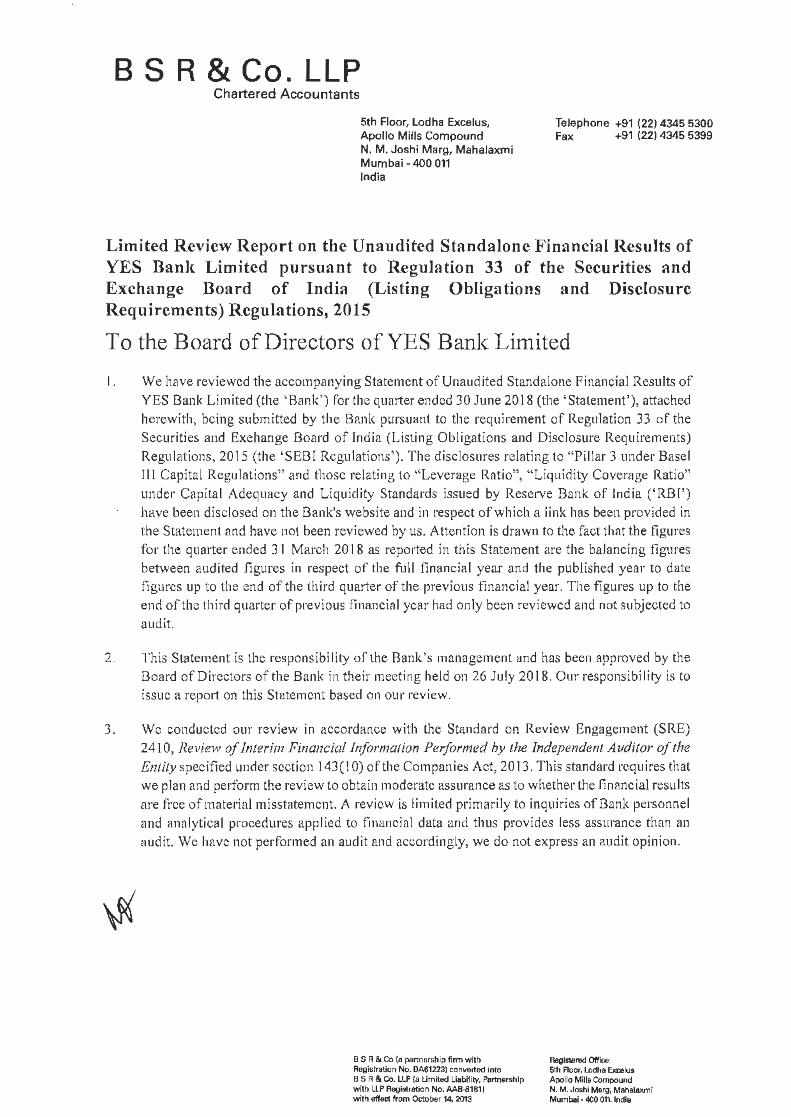
8 S R & Co. LLP Chartered Accountants 5th Floor, l odha Excelus, Apollo Mills Compound N. M. Joshi Marg, Mahalaxmi Mumbai- 400 011 India Telephone +91 (22) 4345 5300 Fax +91 (22 ) 4345 5399 Limited Review Report on the Unaudited Standalone Financial Results of YES Ban]{ Limited pursuant to Regulation 33 of the Securities and Ex change Board of India (Listing Obligations and Disclosure Requirements) Regulations, 2015 To the Board of Directors of YES Bank Limited I. We have reviewed the accompanying Statement of Unaudited Standalone Financia l Results of YES Bank Limited (the 'Bank') for the quarter ended 30 June 2018 (the 'Statement'), attached herewith, being submit ted by the Bank pursuant to the requirement of Regulation 33 of the Securities and Exchange Board of Indi a (Listing Obligations and Disclosure Requirements) Regulat ions , 2015 (the 'SEBI Regulations'). The disclosures relating lo " Pil lar 3 und er Basel Ill Capi tal Regulations" and those relating to ' 4 Leverage Ratio", " Liquidity Coverage Rat io" under Capital Adequacy and Liquidity Standards issued by Reserve Bank of India ('RBT ') have been disclosed on the Bank's website and in respect ofwhich a link has been provided in the Statement and have not been reviewed by us . Attention is drawn to the fact t ha t the figu res for the quarter ended 31 March 2018 as reported in this Statement are the balancing figmes between aud ited figures in respect of the full fin ancial year and the published year to date figures up to the end of the third quarter of the previous financi al year. The figures up to the end of the third quarter of previous financial year had on ly been reviewed and not subjected to audit. 2. This Statement is the responsibility of the Bank's management and has been approved by the Board of Directors of the Bank in their meeting held on 26 July 2018. Our responsibility is to issue a repo rt on this Statement based on our re view. 3. We conducted our review in accordance with the Standard on Review Engage ment (SR E) 2410, Review of Interim Financial Information Performed hy the Independent Audit or of the Entity specified under section 143(1 0) of the Companies Act, 2013. This standard requires that we p Jan and pe1form the review to obtain moderate assurance as to whether t he financial resul ts are free of material mi sstatement. A review is limited primarily to inquiries ofBank personnel and analyti cal procedures applied to financial data and thus provides less assurance than an audit. We have not performed an audit and accordingly, we do not express an audit opinion. B S R & Co (a partnership firm with Regisffation No. BA61223) converted into B S R & Co. LLP Ia Umited Liability, Partnership with LlP Registration No. AAB-81811 with effect from October 14. 2013 Registered Office: Slh Roor, Lodha Excelu$ Apollo Mills Compound N. M. Joshi Morg, Mahalaxmi Mumbai • 400 01\. India
Transcript of N. · 12 The Bank has followed the same signific
8 S R & Co. LLP Chartered Accountants
5th Floor, l odha Excelus, Apollo Mills Compound N. M. Joshi M arg, Mahalaxmi Mumbai- 400 011 India
Telephone +91 (22) 4345 5300 Fax +91 (22) 4345 5399
Limited Review Report on the Unaudited Standalone Financial Results of YES Ban]{ Limited pursuant to Regulation 33 of the Securities and Exchange Board of India (Listing Obligations and Disclosure Requirements) Regulations, 2015
To the Board of Directors of YES Bank Limited
I. We have reviewed the accompanying Statement of Unaudited Standalone Financia l Results of YES Bank Limited (the 'Bank') for the quarter ended 30 June 2018 (the 'Statement'), attached herewith, being submitted by the Bank pursuant to the requirement of Regulation 33 of the Securities and Exchange Board of India (Listing Obligations and Disclosure Requirements) Regulations, 2015 (the 'SEBI Regulations'). The disclosures relating lo "Pil lar 3 under Basel Ill Capital Regulations" and those relating to '4Leverage Ratio", " Liquidity Coverage Ratio" under Capital Adequacy and Liquidity Standards issued by Reserve Bank of India ('RBT') have been disclosed on the Bank's website and in respect ofwhich a link has been provided in the Statement and have not been reviewed by us. Attention is drawn to the fact that the figures for the quarter ended 31 March 2018 as reported in this Statement are the balancing figmes between aud ited figures in respect of the full financial year and the published year to date figures up to the end of the third quarter of the previous financial year. The figures up to the
end of the third quarter of previous financial year had only been reviewed and not subjected to audit.
2. This Statement is the responsibility of the Bank's management and has been approved by the Board of Directors of the Bank in their meeting held on 26 July 2018. Our responsibility is to issue a report on this Statement based on our review.
3. We conducted our review in accordance with the Standard on Review Engagement (SRE) 2410, Review of Interim Financial Information Performed hy the Independent Auditor of the Entity specified under section 143(1 0) of the Companies Act, 2013. This standard requires that
we p Jan and pe1form the review to obtain moderate assurance as to whether the financial results are free of material misstatement. A review is limited primarily to inquiries ofBank personnel and analytical procedures applied to financial data and thus provides less assurance than an audit. We have not performed an audit and accordingly, we do not express an audit opinion.
B S R & Co (a partnership firm with Regisffation No. BA61223) converted into B S R & Co. LLP Ia Umited Liability, Partnership with LlP Registration No. AAB-81811 with effect from October 14. 2013
Registered Office: Slh Roor, Lodha Excelu$ Apollo Mills Compound N. M. Joshi Morg, Mahalaxmi Mumbai • 400 01\. India
B S R & Co. LLP
Limited Review Report on the Unaudited Standalone Financial Results of YES Bank Limited pursuant to Regulation 33 of the Securities and Exchange Board of India (Listing Obligations and Disclosure Requirements) Regulations, 2015 (Continued)
4. Based on our review conducted as mentioned above, nothing has come to our attention that causes us to believe that the accompanying Statement prepared in accordance with applicable accounting standards specified under Section 133 of the Companies Act 2013, read with Rule 7 of the Companies (Accounts) Rules, 20 14 and other recognized accounting practices and policies, has not disclosed the information required to be disclosed in terms of Regulation 33 of the SEBI Regulations, including the manner in which it is to be disclosed, or that it contains any material misstatement or that it has not been prepared in accordance with the relevant prudential norms issued by the RBI in respect of income recognition, asset classification, provisioning and other related matters.
Mumbai 26 July 201 8
ForBS R &Co. LLP Chartered Accountants
Firm's Registration No: 101 248W/W-100022
M~K v··· anoJ umar IJat Partner
Membersh ip No: 046882
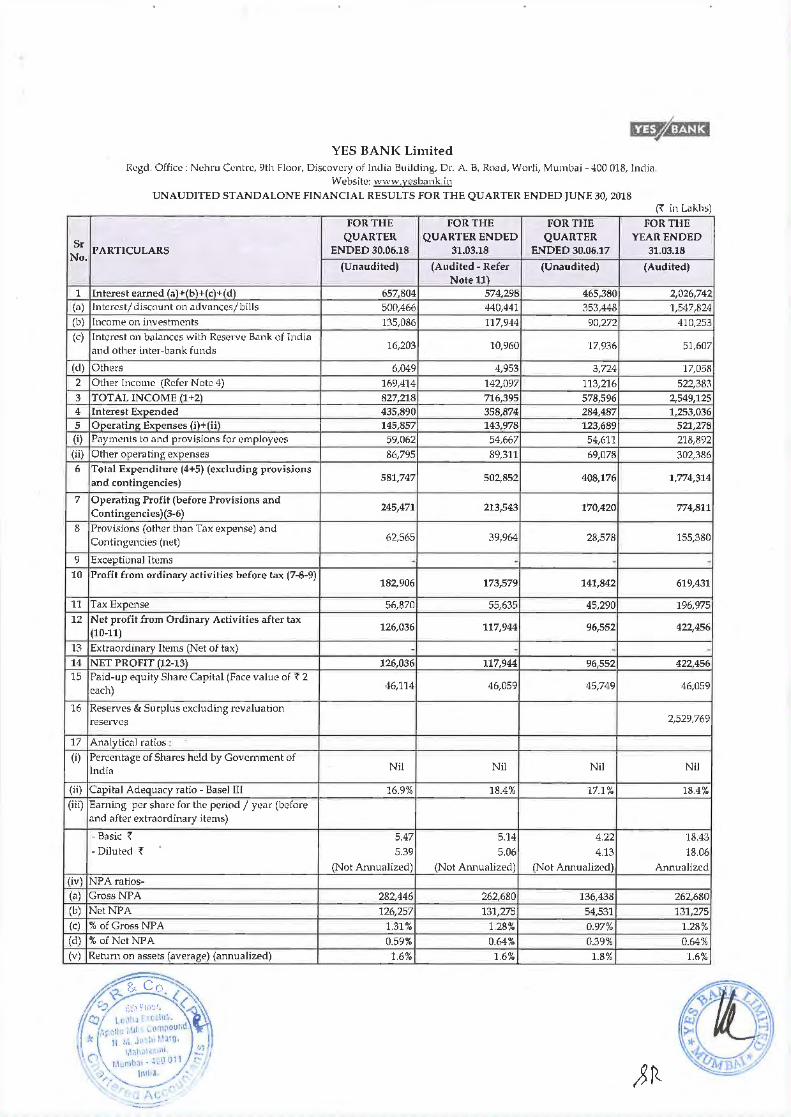
YES BANI< Limited R~gd. Office: N~hru C~ntrc, 9th Floor, Discovery of h1dia Buildi11g, Dr. A B. Ro<Jd, Wtwli, Mumbai -400 018, lndiil.
W~bsite: www.wsb11nk.in
UNAUDITED STAND ALONE FINANCIAL RESULTS FOR THE QUARTER ENDED JUNF. 30, 2018 ('{ in Lilkhs)
FOR THE FOR THE FOR THE FOR THE
Sr QUARTER QUARTER ENDED QUARTER YEAR ENDED
No. PARTICULARS ENDED 30.06.18 31.03.18 ENDED 30.06.17 31.03.18
(Unaudited) (Audited- Refer (Unaudited) (Audited) Notell)
1 Interest earned (.;)+(b)+(c)+(d) 657,804 574,298 465,380 2,026,742 (a) Interest/discount on advances/bills 500,466 440.441 353,448 1,547,824 (b) Income on investments 135,086 117,944 90,272 410,253 (c) Interest on b<1lanccs with Reserve B<1nk of India
and other inter-bank funds 16,203 10,960 "17,936 51,607
(d) Others 6,049 4,953 3,724 "17,0.511
2 Other Income (Refer Note 4) 169,4"14 142,097 113,216 522,383 3 TOTAL INCOME (1+2) 827,218 716,395 578,596 2,549,125 4 Interest Expended 435,890 358,874 284,487 1,253,036 5 Operating Expenses (i)+(ii) 145,857 143,978 123,689 521,278 (i) Payments to a11d provisions for employees 59,062 54,667 54,611 218,892 (ii) Other operating expenses 86,795 89,311 69,()7!! 302,3116 6 Total Expenditure (4+5) (excluding provisions
and contingencies) 581,747 502,852 408,176 1,774,314
7 Operating Profit (before Provisions and Contingencies)(3-6)
245,471 213,543 170,420 774,811
8 Provisions (othe!r than Tax expense) anu Contingtmcies (net) 62,565 39,964 28,578 155,380
9 Exceptional Items - - - -10 Profit from ordinary activities before tax (7-8-9)
182,906 173,579 141,842 619,431
11 Tax Expense 56,870 55,635 45,290 196,975 12 Net profit from Ordinary Activities after tax
(10-11) 126,036 117,944 96,552 422,456
13 Extraordinary Items (Net of tax) - - - -14 NET PROFIT (12-13) 126,036 117,944 96,552 422.456 15 Paid-up equity Shar~ Capital (Face value of~ 2
each) 46,114 46,059 45,749 46,059
16 Reserves & Surplus excluding revaluation reseavcs 2,529,769
17 AnalyticAl ratios :
(i) Percentage of Shares held by Government of Nil Nil Nil Nil India
(ii) Capital Adequacy ratio- Basel III 16.9% 18.4% 17.1% 18.4% (iii) Earning per share for the period 1 year (before
and after extraordinary items)
-Basic ~ 5.47 5.14 4.22 18.43 -Diluted ~ 5.39 5.06 4.13 18.06
(Not Annualized) (Not Annualized) (Not Ammalized) Annualized (iv) NPAratios-(a) GrossNPA 282,446 262,680 "136,438 262..6110 (b) NetNPA 126,257 131,275 54,531 131,275 (c) %of Gross NPA 1.31% 1.28% 0.97% 1.28% (d) % ofNetNPA 0.59% 0.64% 0.39% 0.64% (v) Return on assets (average) (annualized) 1.6% 1.6% 1.8% "1.6%
Notes:
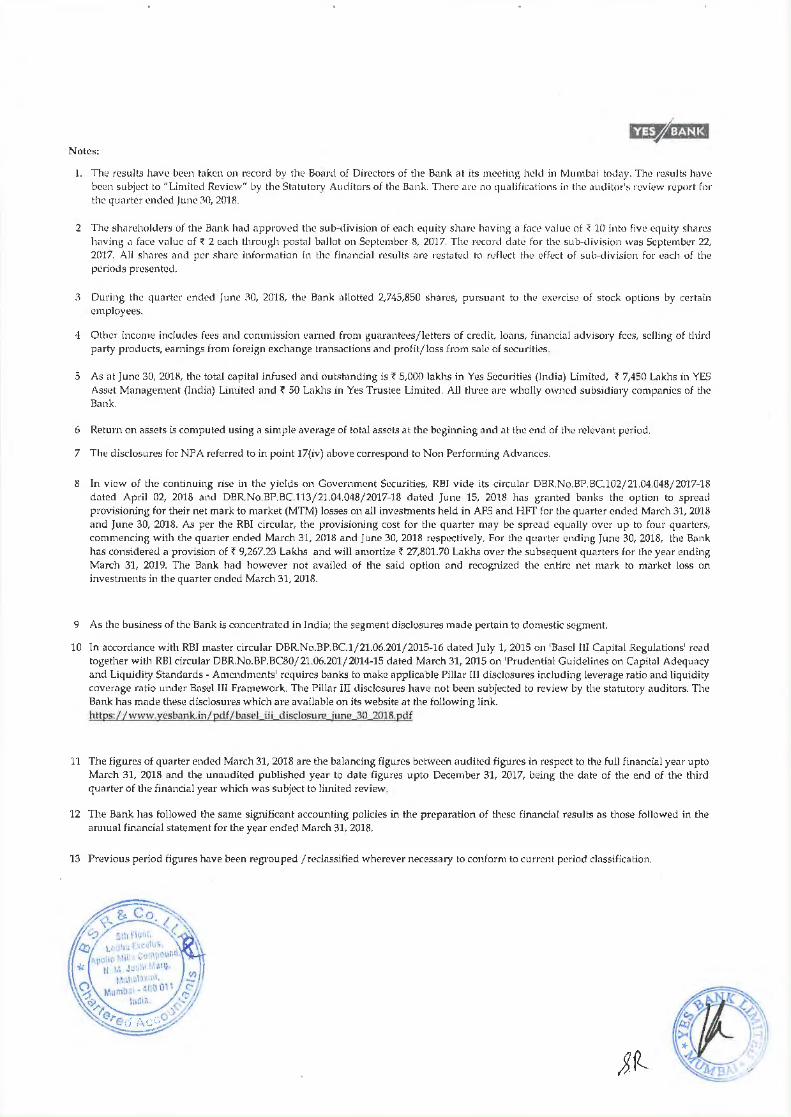
I. The results have bct'n t11ken on record by tlw Board of Directors of the Bank at its meeting held in Mumb<li today. The m.~ults htwe been subject to "Limited Review" by the Statutory Auditors of the Bank. There are no qualifications in the ,1uditor'~ rcvi11w ruport fnr the quarter ended June :\0, 201!1.
2 The :;h,lrcholdl'rs of the Bank had approved the sub-division of each C<JUity share h;,ving a fact' value of < 10 into fiw equity shares having,, face vnlue of~ 2 each through postal ballot on September 8, 2()']7. The record date for the sub-tlivisitm Wil:; September 22, 20'17. All shares and per share illformation in the financial results ilrc rest<Jtcd to rdlcct the effect of sub-division for o.?nch of the periods preselllcd.
3 During the quarter ended June 30, 2018, the Bank allotted 2,745,850 shan.?S, pursu<Jnt to the cxl.'rcise of stock options by certain employees.
4 Other incomE:! includes fees ;md commission earned from guarantco.?s/lctters of credit. loans, fimmcial advisory fcc.~. selling of third party products, earnings from foreign exchange transactions and profit/loss from sale of securities.
5 As at June 30, 2011\, the total capital infused and out.~t<1nding is< 5,000 lakhs in Yes Securities (lndiil) Limited, ~ 7,450 Lakhs in YES Asset Managenwnt (India) Limited and < 50 Lakhs in Yes Trustee Limited. All three are wholly owned subsidiary companies of the Bank.
6 Return on assets is computed using a simple average of total assets at the beginning and at the end of th"' relevant period.
7 Th~ disdosur~s for NPA referred to in point 17(iv) above correspond to Non Performing Advances.
8 In view of the continuing rise in the yields on Government Securities, RBI vide its circular DBR.No.BP.BC.102/21.04.048/2017-18 dated April 02, 2018 ;u1tl DBR.No.BP.BC.lH/21.04.048/2017-18 dntetl June 15, 2018 hns granted banks the option to spread p1·ovisioning for their net mark to m;~rkt!t (MTM) losses on all inwstments held in AFS and HFT for the quarter ended March 31, 2018 and June 30, 2018. As per the RBI circular, the provisioning cost for the quarter may be spread equally over up to four quarter.~. commencing with the quarter ended March 31, 2018 and june 30, 2018 resp~>ctively. For tlw quarter cntling June 30, 2018, the B;~nk has considen~d a provision of~ 9,267.23 Lakhs and will amortize~ 27,801.70 Lakhs over the subsequent quarters for the year ending March 31, 20J9. The Bank had however not nvailed of the said option <:~nd recognized the entire net mark to market loss on investments in the quarter ended March 31, 2018.
9 As the business of the Bank is conccnh·t:~tcd in India; the segment disclosures made pert<~ in to donwstic segml:!nt.
10 In accordance with RBI master circular DBR.No.BP.BC.1/21.06.201/2015-16 dated July 1, 2015 on 'Basel Ill Capital Regulations' reJd together with RBI circular DBR.No.BP.BCS0/21.06.201/2014-15 dated March 31, 2015 on 'Prudential Guidelines on Capital Adequacy and Liquidity Standards- Amendments' requires b<mks to make applicable Pill<~r III disdosures including leverage ratio and liquidity coverage ratio under BMel III Framework. The Pill<~r liJ disclosures hav~e not be~n subj~cted to r~view by the statutory auditors. The Bank has mnde these disclosures which are available on its website at the following link. https://www.yeslnmk.in/pdJ/basl!l iii disclosure june 30 2018.pdf
11 The figures of quarter ended March 31, 2018 are the balancing figures benveen audited figures in respect to the full fin<~ncial year upto March 31, 2018 and the unaudited published year to date figures upto December 31, 2017, b~eing the dnte of the end of the third quarter of the financial year which was subject to limited review.
12 The Bank has followed the same signific<~nt accounting policies in the preparation of these financi<ll results as those followed in the annual financial statement for the year ended March 31, 2018.
13 Pr~vious period figures have been regrouped /reclnssified wherever necessaay to conform to current period classification.
Sr No
PARTICULARS
1 Segment revenue (il) Tre<1smy (b) Co•·pon1te Banking (c) Retail Banking (d) Other Bnnking Opemtions (e) Unalloe<ltcd
TOTAL Add I (Less); Inter Segment Revenue
Income from Operations 2 Segmental Results
(a) Treasury (b) Corporat<? B<lllking (c) Retail Banking (d) Other Banking Opcr<ltions (e) Unallocated
Profit before Tax
3 Segment Assets (a) Treasury (b) Corporate? Banking (c) Retail Banking (d) Othe?r Banking Operations (e) Unallocated
Total 4 Segment Liabilities
(a) Treasury (b) Corporate Banking (c) Retail Banking (d) Other Banking Op~rations (e) Unallocated
Capital and Reserves Total
SEGMENT
Treasury
Corporate Banking
Retail Banking
Other Banking Operations
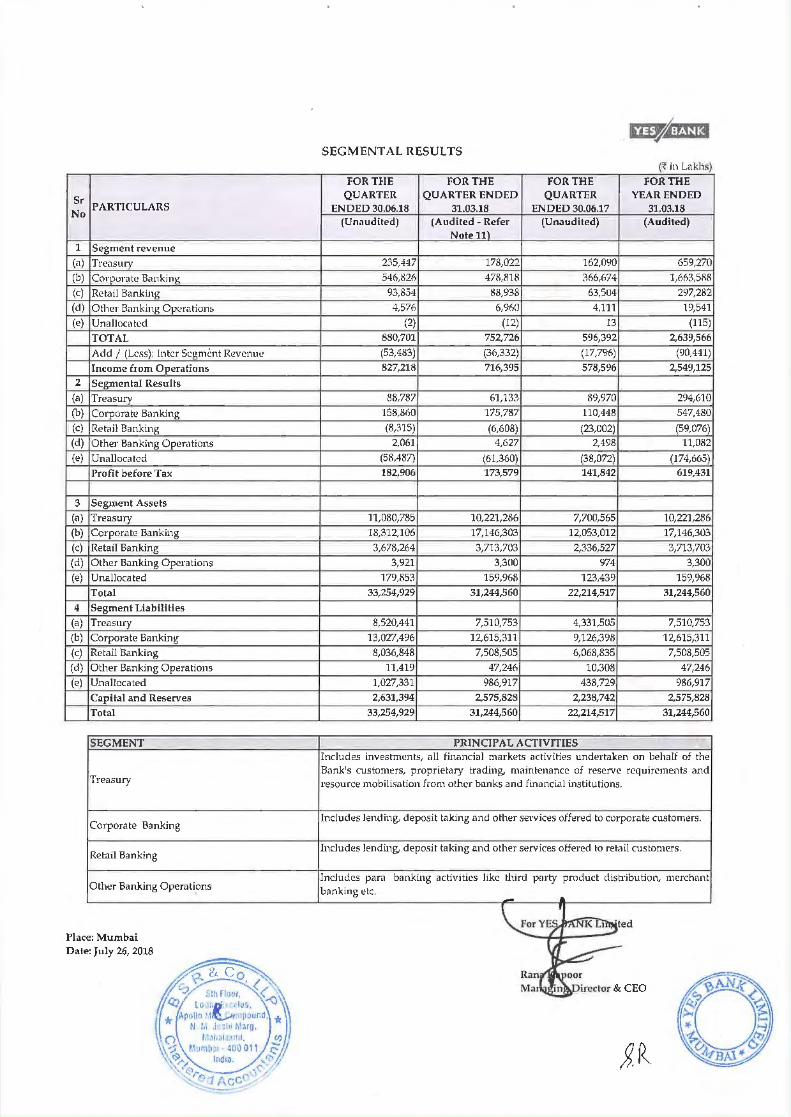
Place: Mumbai Date: July 26, 2018
SEGMENTAL RESULTS ~ in Lakhs)
FOR THE FOR THE FOR THE FOR THE QUARTER QUARTER ENDED QUARTER YEAR ENDED
ENDED 30.06.18 31.03.18 ENDED 30.06.17 31.03.18 (Unaudited) (Audited -Refer (Unaudited) (Audited)
Note 11)
235,447 178,022 162,090 659,270 546,826 471\,/118 366,674 1,663,51\/l 93,854 !18,938 63,504 297,282 4,576 6,960 4,111 19,541
(2) (12) 13 (115) 880,701 752,726 596,392 2,639,566 (53,483) (36,332) (17,796) (90,441) 827,21/l 716,395 578,596 2,549,125
88,787 61,133 89,970 294,610 ·t5s,86o 175,787 110,448 547,480 (8,315) (6,608) (23,002) (59,076)
2,061 4,627 2,498 11,01\2 (58,487) (61,360) (38,072) (174,665) 182,906 173,579 141,842 619,431
11,080,785 10,221,286 7,700,565 10,221,286 18,312,106 17,146,303 12,053,012 17,146,303 3,678,264 3,713,703 2,336,527 3,713,703
3,921 3,300 974 3,300 179,853 159,968 123.439 159,968
33,254,929 31,244,560 22,214,517 31,244,560
8,520,441 7,510,753 4,331,505 7,510,753 13,027,496 12,615,311 9,126,398 12,615,311 8,036,848 7,508,505 6,068,835 7,508,505
11,419 47,246 10,308 47,246 1,027,331 986,917 438,729 986,917 2,631,394 2,575,828 2,238,742 2,575,828
33,254,929 31,244,560 22,214,517 31,244,560
PRINCIPAL ACTIVITIES Includes investments, nil financial markets activities undertaken on behalf of the Bank's customers, proprietary trading, maintenance of reserve requirements and l'esource mobilisation from other banks and fimlncial institutions.
Includes lending, deposit t<~king ~md other se .. vices off~red to corporate customers.
Includes lending, deposit taking and other services offered to retail customers.
Includes para banking activities like third party product dish·ibution, merchant b<mking o.!lc.

Page 1 of 9
Press Release – July 26, 2018
YES BANK announces Financial Results for the Quarter ended June 30, 2018
1. KEY HIGHLIGHTS for Q1FY19
✓ Sustained Earnings Delivery with improving efficiency:
• Net Profit at ` 1,260.4 Crores, grew 30.5% y-o-y on the back of healthy growth in NII & Other Income
• Cost to Income ratio improved to 37.3% from 42.1% in Q1FY18
• RoEs improved to 19.4% from 17.4% in Q1FY18
✓ Robust Advances growth with increasing granularity:
• Advances grew by 53.4% y-o-y across domestic Corporate, IBU, MSME and Retail businesses
• IBU Assets crossed US$ 3 Bn growing by 219% y-o-y
• Retail Banking Advances grew 105.2% y-o-y to 14.0% of Total Advances, contributing 47% of
incremental growth during the quarter
✓ Healthy Asset Quality delivery: Steady decline in Total Stressed Assets Book
• GNPA at 1.31% and NNPA declined to 0.59% from 0.64% sequentially. Credit costs at 15 bps
• PCR improved to 55.3% from 50.0% sequentially
• Total Stressed book (NNPA + Net Security Receipts + Std. Restructured Exposure) declined steadily to 1.52%
from 1.73% sequentially
• Demonstrated resolution track record capability by achieving significant recoveries in NPA and Security
Receipts book
✓ Ratings Upgraded to AAA by CARE from AA+ for Infrastructure Bonds and Tier II Bonds (Basel III)
Commenting on the results and financial performance, Mr. Rana Kapoor, Managing Director & CEO, YES
BANK said, “YES BANK has again delivered sustained performance across balance sheet growth,
profitability and asset quality. Further, the growth has been well segmented across Corporate, IBU, SME and
particularly Retail Business which grew 105% y-o-y taking Retail Banking proportion in total advances to
14.0%. The exponential growth momentum in Retail demonstrates the leverage created across people,
branches and technology over the past few years and is further expected to increase granularity in Bank’s
asset and liabilities over the quarters to come. The Bank has also received approval from SEBI to commence
its ‘Mutual Fund Business’ which will complement and further augment Bank’s Retail Liabilities and Wealth
Management product offerings.
The other key highlight of the quarter was Bank’s continued resilience in Asset Quality and resolution
capabilities as demonstrated through recoveries in NPA and Security Receipts book resulting in decline in
total Stressed Assets to 1.52% aggregate.
YES Bank’s sustained performance and inherent franchise strength has also been corroborated by Bank’s
recent rating upgrade to AAA by CARE which will provide further impetus to Bank’s superior performance,
overall Cost of Funds reduction and enable it to capture market share at an increasing pace.”

Page 2 of 9
2. PROFIT & LOSS: Sustained Earnings Delivery with improving efficiency
• Net Profit grew by 30.5% y-oy to ` 1,260.4 Crores
• Net Interest Income grew by 22.7% y-o-y to ` 2,219.1 Crores and Non-Interest Income grew by 49.6%
y-o-y to ` 1,694.1 Crores with NIMs at 3.3%
• Provisions stood at ` 625.7 Crores of which:
▪ ` 379.9 Crores is NPA provisioning which includes ` 149.0 Crores towards increase in Provision
Coverage to 55.3%
▪ ` 92.7 Crores is towards MTM losses on Bonds. MTM losses of ` 278.0 Crores will be amortized
during FY19 under the RBI dispensation
• Operating Profit posted robust growth of 44.0% y-o-y to ` 2,454.7 Crores
• Consistent return ratios with RoA stable at 1.6%. RoE increased to 19.4% from 17.4% in Q1FY18
• Book Value at ` 114.1 per share as on June 30, 2018 3. BALANCE SHEET: Robust Advances growth with increasing granularity
• Total Assets grew by 49.7% y-o-y to ` 3,32,549.3 Crores. IBU Assets grew by 219% y-o-y to US$ 3.2 Bn
• Deposits grew by 42.0% y-o-y to ` 2,13,394.5 Crores
• CASA ratio at 35.1%, on the back of 35.7% y-o-y growth. SA (` 46,597.5 Crores) and CA (` 28,332.5
Crores) deposits posted strong growth of 26.9% and 53.1% y-o-y respectively. CASA + Retail FDs as a
% of Total Deposits stands at a healthy 56.7%
• Advances grew by 53.4% y-o-y to ̀ 2,14,720.1 Crores on the back of robust growth across Corporate, IBU,
MSME and Retail businesses. Retail Banking Advances grew by 105.2% y-o-y to 14.0% of Advances (up
from 10.5% as on June 30, 2017). Segmental mix below:
Business Segment As on Jun
30, 2018
As on Jun 30, 2017
Growth (y-o-y)
As on Mar 31, 2018
Growth (q-o-q)
A) Corporate Banking 67.6% 68.1% 52.2% 67.9% 5.0%
of which IBU Advances 8.8% 4.3% 214.5% 7.1% 31.6%
B) Retail & Business Banking 32.4% 31.9% 56.0% 32.1% 6.5%
of which:
i) Medium Enterprises 8.7% 9.9% 35.6% 9.7% (5.0%)
ii) Small and Micro Enterprises 9.7% 11.5% 28.7% 10.2% (0.4%)
iii) Retail Banking 14.0% 10.5% 105.2% 12.2% 21.3%
Total 100.0% 100.0% 53.4% 100.0% 5.5%
• Total Capital Adequacy at 17.3% with Total Capital Funds at ` 46,983.7 Crores. Tier I Ratio and CET I
ratio healthy at 12.8% and 9.5% respectively (including profits & adjusted for prorated dividend & IFR)
• Risk Weighted Assets stood at ` 2,71,351.3 Crores. RWA to Total Assets improved to 81.6% (from 83.4%
as on June 30, 2017) given incremental lending to higher rated Corporates
Page 3 of 9
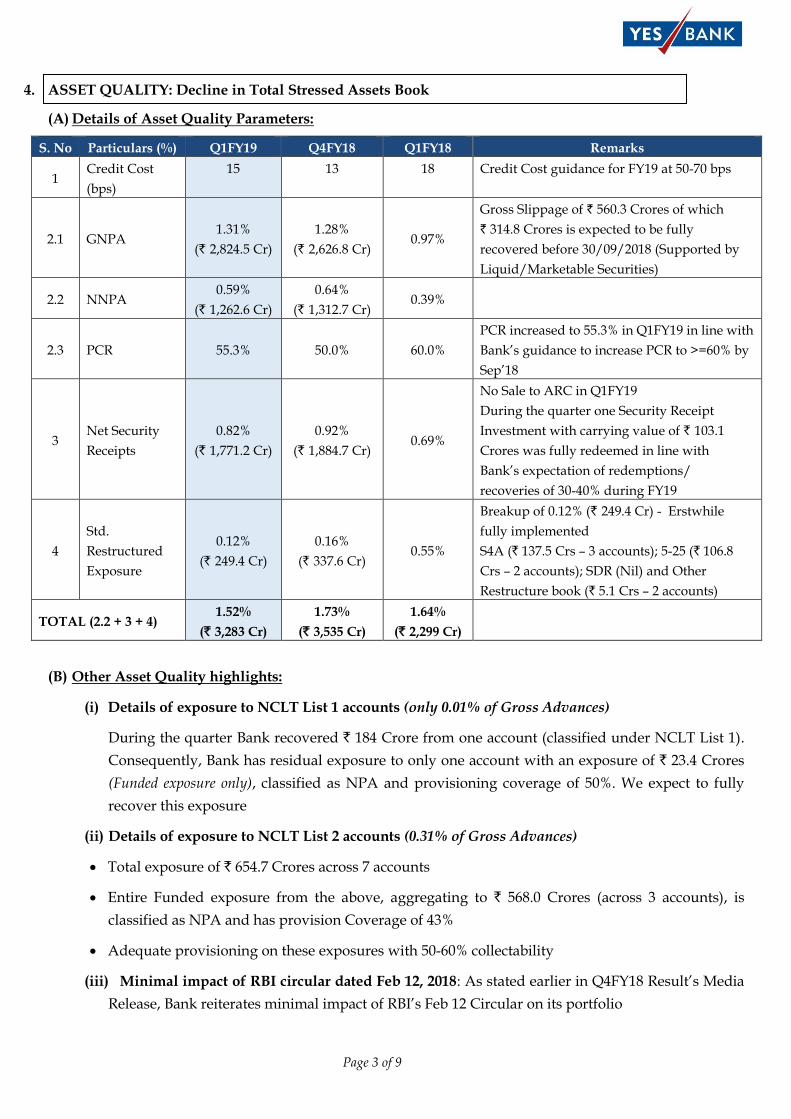
4. ASSET QUALITY: Decline in Total Stressed Assets Book
(A) Details of Asset Quality Parameters:
S. No Particulars (%) Q1FY19 Q4FY18 Q1FY18 Remarks
1 Credit Cost
(bps)
15 13 18 Credit Cost guidance for FY19 at 50-70 bps
2.1 GNPA 1.31%
(` 2,824.5 Cr)
1.28%
(` 2,626.8 Cr) 0.97%
Gross Slippage of ` 560.3 Crores of which
` 314.8 Crores is expected to be fully
recovered before 30/09/2018 (Supported by
Liquid/Marketable Securities)
2.2 NNPA 0.59%
(` 1,262.6 Cr)
0.64%
(` 1,312.7 Cr) 0.39%
2.3 PCR 55.3% 50.0% 60.0%
PCR increased to 55.3% in Q1FY19 in line with
Bank’s guidance to increase PCR to >=60% by
Sep’18
3 Net Security
Receipts
0.82%
(` 1,771.2 Cr)
0.92%
(` 1,884.7 Cr) 0.69%
No Sale to ARC in Q1FY19
During the quarter one Security Receipt
Investment with carrying value of ` 103.1
Crores was fully redeemed in line with
Bank’s expectation of redemptions/
recoveries of 30-40% during FY19
4
Std.
Restructured
Exposure
0.12%
(` 249.4 Cr)
0.16%
(` 337.6 Cr) 0.55%
Breakup of 0.12% (` 249.4 Cr) - Erstwhile
fully implemented
S4A (` 137.5 Crs – 3 accounts); 5-25 (` 106.8
Crs – 2 accounts); SDR (Nil) and Other
Restructure book (` 5.1 Crs – 2 accounts)
TOTAL (2.2 + 3 + 4) 1.52%
(` 3,283 Cr)
1.73%
(` 3,535 Cr)
1.64%
(` 2,299 Cr)
(B) Other Asset Quality highlights:
(i) Details of exposure to NCLT List 1 accounts (only 0.01% of Gross Advances)
During the quarter Bank recovered ` 184 Crore from one account (classified under NCLT List 1).
Consequently, Bank has residual exposure to only one account with an exposure of ` 23.4 Crores
(Funded exposure only), classified as NPA and provisioning coverage of 50%. We expect to fully
recover this exposure
(ii) Details of exposure to NCLT List 2 accounts (0.31% of Gross Advances)
• Total exposure of ` 654.7 Crores across 7 accounts
• Entire Funded exposure from the above, aggregating to ` 568.0 Crores (across 3 accounts), is
classified as NPA and has provision Coverage of 43%
• Adequate provisioning on these exposures with 50-60% collectability
(iii) Minimal impact of RBI circular dated Feb 12, 2018: As stated earlier in Q4FY18 Result’s Media
Release, Bank reiterates minimal impact of RBI’s Feb 12 Circular on its portfolio
Page 4 of 9
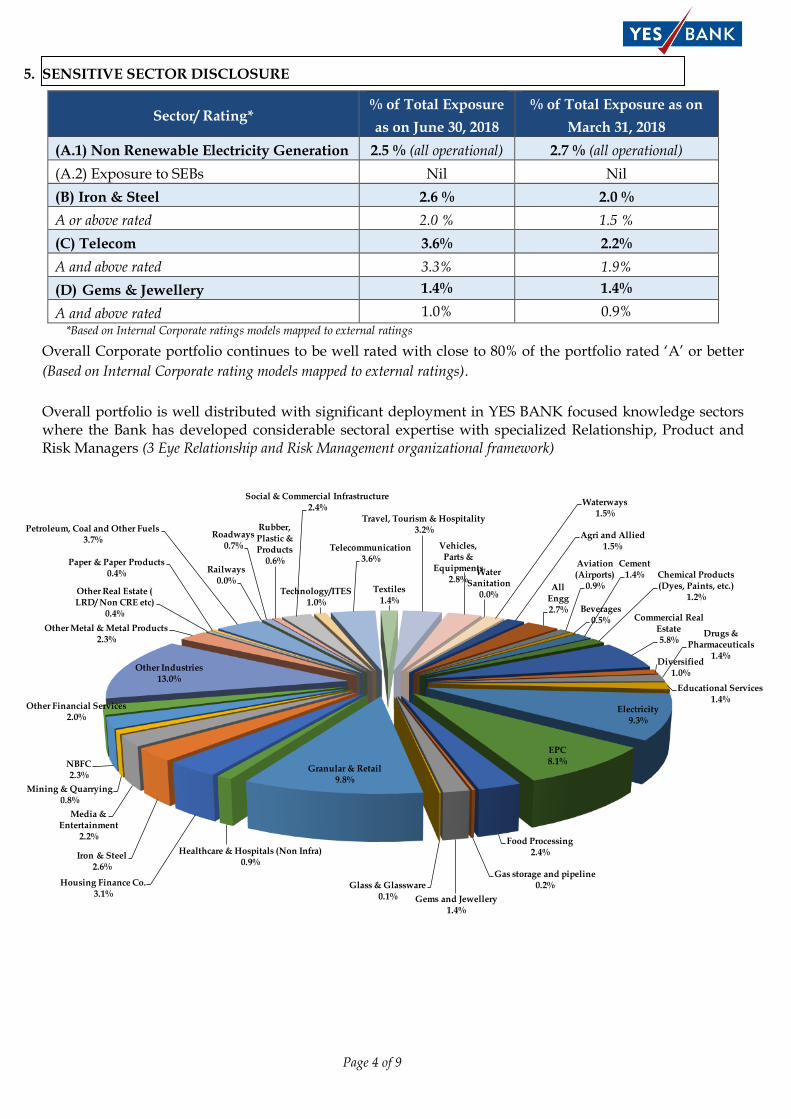
5. SENSITIVE SECTOR DISCLOSURE
Sector/ Rating* % of Total Exposure
as on June 30, 2018
% of Total Exposure as on
March 31, 2018
(A.1) Non Renewable Electricity Generation 2.5 % (all operational) 2.7 % (all operational)
(A.2) Exposure to SEBs Nil Nil
(B) Iron & Steel 2.6 % 2.0 %
A or above rated 2.0 % 1.5 %
(C) Telecom 3.6% 2.2%
A and above rated 3.3% 1.9%
(D) Gems & Jewellery 1.4% 1.4%
A and above rated 1.0% 0.9% *Based on Internal Corporate ratings models mapped to external ratings
Overall Corporate portfolio continues to be well rated with close to 80% of the portfolio rated ‘A’ or better
(Based on Internal Corporate rating models mapped to external ratings).
Overall portfolio is well distributed with significant deployment in YES BANK focused knowledge sectors where the Bank has developed considerable sectoral expertise with specialized Relationship, Product and Risk Managers (3 Eye Relationship and Risk Management organizational framework)
Agri and Allied1.5%
All Engg2.7%
Aviation (Airports)
0.9%
Beverages0.5%
Cement1.4% Chemical Products
(Dyes, Paints, etc.)1.2%
Commercial Real Estate5.8%
Diversified1.0%
Drugs & Pharmaceuticals
1.4%
Educational Services1.4%
Electricity9.3%
EPC8.1%
Food Processing2.4%
Gas storage and pipeline0.2%
Gems and Jewellery1.4%
Glass & Glassware0.1%
Granular & Retail9.8%
Healthcare & Hospitals (Non Infra)0.9%
Housing Finance Co.3.1%
Iron & Steel2.6%
Media & Entertainment
2.2%
Mining & Quarrying0.8%
NBFC2.3%
Other Financial Services2.0%
Other Industries13.0%
Other Metal & Metal Products2.3%
Other Real Estate ( LRD/ Non CRE etc)
0.4%
Paper & Paper Products0.4%
Petroleum, Coal and Other Fuels3.7%
Railways0.0%
Roadways0.7%
Rubber, Plastic & Products
0.6%
Social & Commercial Infrastructure2.4%
Technology/ITES1.0%
Telecommunication3.6%
Textiles1.4%
Travel, Tourism & Hospitality3.2%
Vehicles, Parts &
Equipments2.8%
Water Sanitation
0.0%
Waterways1.5%
Page 5 of 9
6. DIGITAL BANKING: Digital dominance continues
• Leadership position within the new age payments:
▪ Winner for Instant Payment products (UPI, IMPS, USSD & BHIM) in National Payments
Excellence Awards 2017 announced by NPCI in May 2018
o UPI: Market share of 50% in UPI Merchant Payments volumes. Processed more than 14 Crores
transactions amounting to ~ ̀ 29,000 Crores in Q1FY19. Total registrations have crossed 5 Crores,
Merchant partner base of 1.5 Lakhs
o IMPS: Top Remitter Bank within peer group based on transaction vol. as per NPCI, 105% growth
y-o-y
o AePS: One of the Leading acquirer bank of AEPS. Processed ~2 Crore successful transactions in
3 months. ~1.45 Lakh Business Correspondent agents enabled for delivering service
• Continued focus on Innovation:
▪ AIIMS Rishikesh Go Live: AIIMS became India’s first completely Cashless Campus by the way of
YES Bank powered AIIMS Cashless Payments Cards, UPI led payments and POS led payments
▪ Launched BHIM Aadhaar pay as an acceptance medium for Rajasthan Government’s E-Mitra outlets
for facilitating Government to Citizen (G2C) services
• Enhancing customer engagement through Superior Product Delivery:
▪ YES Mobile registrations have increased by 113% y-o-y with a mirroring increase in transaction value
& volumes by 186% and 247% y-o-y respectively
▪ Robust growth in Debit Card transactions:
o 7.5 Million Debit Card transactions in Q1FY19 y-o-y growth of 40%. Total Debit Card spends
grew 45% y-o-y to ` 1,095 Crores during Q1FY19. Further, Spend per Debit Card has increased by
29% y-o-y to ` 1,903 per quarter
o Spends on YES Bank RuPay cards have increased 222%
o E-Com transactions growth of 52% y-o-y
▪ YES ROBOT – Personal Banking Assistant, India’s first artificial intelligence enabled banking bot
- Continues to gain popularity with customers as it engaged in over ~10 lakh interactions in Q1FY19
• Digital India Initiatives:
▪ Asmita Project for Women & Child Welfare Department’s subsidy disbursement went live on March
08, 2018 by the Honorable Chief Minister of Maharashtra; 25,000+ SHG members and 7 lakh girls are
expected to benefit from the app
▪ Integrated Child Development Scheme (ICDS) Maharashtra – Mobile application developed for
capturing daily attendance of Anganwadi workers and their monthly payment processing; resulting
in drastic reduction of the entire billing cycle from 2-3 months to ~ 1 week

Page 6 of 9
7. EXPANSION & KNOWLEDGE INITIATIVES
• Employee strength as on June 30, 2018 stood at 19,597, an increase of 1,359 employees in the quarter
• As on June 30, 2018, branch network stood at 1,105 branches and ATM Network stood at 1,741 which
includes 561 Bunch Note Acceptors/Cash Recyclers
• YES Bank was Upgraded to ‘AAA’ with Stable Outlook by Care Ratings:
▪ Upgraded to highest Care AAA Rating from Care AA+ for Infrastructure Bonds and Tier II Bonds
(Basel III) with Stable Outlook.
▪ Upgraded to Care AA+ Rating from Care AA for Perpetual and Additional Tier I Bonds (Basel
III); Stable Outlook which is the highest across all bank
CARE ratings cited Bank’s adequate Capitalization levels, experienced Senior Management, healthy
Profitability consistently over the last decade, comfortable Asset Quality relative to other banks,
improvement in Funding Profile and comfortable Liquidity position as triggers for Rating Upgrade
• Ranked #1,013 in the Forbes Global 2000 - World’s Largest Public Companies list for 2018 and ranked
#155 in the Global 2000: Growth Champions list for 2018.
• YES BANK received regulatory approvals from SEBI:
1. To commence its Mutual Fund business and
2. For acting as Custodian of Securities
These approvals will complement YES BANK’s retail liabilities and wealth management, and Capital
Market offerings
• Sustained Leadership position in Clean Energy space by launching:
▪ First-ever Green Deposit product - ‘Green Future: Deposit’ on World Environment Day for
lending towards Sustainable Development Goals (SDGs) aligned sectors
▪ Cleantech Accelerator: YES SCALE (focused on Smart City Tech, CleanTech, AgriTech,
Lifesciences Tech & EduTech), as part of YES BANK’s multi-sector accelerator program. The
accelerator Accelerator will focus on scaling up startups working on energy efficiency, waste
management and water management – paving the way for a cleaner future

Page 7 of 9
3. AWARDS & RECOGNITIONS YES BANK was recognized and bestowed awards at multiple platforms for its Digital & Innovation practices:
• Winner for outstanding performance in Instant Payment Products (UPI + IMPS + BHIM + USSD),
at the National Payments Excellence Awards (NPCI) 2017 hosted by National Payments
Corporation of India (NPCI)
• Recognized with three Gold Awards at the India Content Leadership Award- 2018 for compelling
marketing & corporate communications initiatives for its flagship Fintech start-up Business
Innovation Programme, YES FINTECH and for successfully running CFO Insights, a magazine read
widely by Chief Financial Officers (CFOs)
• Recognized with the ‘Best Implementation of Digital Payments’ award at the 4th edition of
prestigious BW Businessworld Digital India Summit & Awards 2018
• Adjudged as the ‘Best Bank in India’ for Payments, Blockchain Initiative, API Initiative, Financial
Supply chain Management Deal, Trade Finance Deal, Automation Application and Trade Finance at
The Asian Banker Transaction Banking Awards 2018
Accolades for Small & Medium Enterprises Financing:
• Adjudged as the ‘Best Bank in India for Small and Medium-Sized Enterprises (SMEs)’ at the
Asiamoney Best Bank Awards 2018
• Recognized as the ‘Best Banking Solutions provider for SMEs’ at Engineering Export Promotion
Council (EEPC India) 48th Northern Region Awards for Export Excellence, Dehradun
Multiple recognitions for CSR practices:
• Adjudged as winner in ‘Excellent CSR for Women Empowerment’ category of Social Footprints
Awards 2018 for YES BANK’s innovative blended finance facility, aimed at promoting environmentally
sustainable livelihood among women salt farmers in Gujarat
• Announced as the winner in ‘Safe Drinking Water’ category of Social Footprints Awards 2018 for
successful implementation of Water ATMs and Water Health Centers under Water and Livelihood
project in India
• Received ‘CSR Excellence Award’ for its first-of-its-kind MSME CSR project ‘Say YES to Sustainable
MSMEs in India’ at the Apex India Awards
Mr. Rana Kapoor, MD & CEO, YES BANK was felicitated:
• In the ‘Business Category’ for his immense contribution to society, promotion of culture and social
initiatives at ‘NBT Utsav 2018’ organized by Navbharat Times
• As the ‘CSR Icon of the Year’ for his immense contribution to sustainable development in India for YES
BANK’s socio-environmental initiatives at the Apex India Awards
• As the ‘Sustainability Leader of the Year’ at the Karlsruhe Sustainable Finance Awards 2018, Germany
• As ‘Professional Entrepreneur of the Year’ by Entrepreneur Magazine at the 8th Annual Entrepreneur
India 2018 Convention in New Delhi.
Page 8 of 9
YES Bank’s analyst conference call, scheduled on July 26, 2018 at 5:30 pm, can be heard at following link, post 10 pm:
https://www.yesbank.in/about-us/investors-relation/financial-information/financialresults
ABOUT YES BANK
YES BANK, India’s fourth largest private sector Bank, is the outcome of the professional & entrepreneurial commitment of its
Founder Rana Kapoor and his top management team, to establish a high quality, customer centric, service driven, private Indian
Bank catering to the Future Businesses of India. YES BANK has adopted international best practices, the highest standards of service
quality and operational excellence, and offers comprehensive banking and financial solutions to all its valued customers.
Krunal Mehta YES BANK Ph.: + 91 22 3347 9758, Cell : +91 +919867163634
Email:[email protected]
Jyothi Goswami Adfactors PR Ph.: +91 97024 88388 Email: [email protected]

Page 9 of 9
Annexure
Financial Highlights from Q1FY19 Results:
P & L Highlights
(` in Crores) Q1FY19 Q1FY18 Growth %
(y-o-y) Q4FY18
Growth %
(q-o-q)
Net Interest Income 2,219.1 1,808.9 22.7% 2,154.2 3.0%
Non Interest Income 1,694.1 1,132.2 49.6% 1,421.0 19.2%
Total Net Income 3,913.3 2,941.1 33.1% 3,575.2 9.5%
Operating Profit 2,454.7 1,704.2 44.0% 2,135.4 15.0%
Provision 625.7 285.8 118.9% 399.6 56.6%
Profit after Tax 1,260.4 965.5 30.5% 1,179.4 6.9%
Basic EPS (`) 5.5 4.2+ 29.5% 5.1 6.4%
Key P & L Ratios Q1FY19 Q1FY18
Q4FY18
Return on Assets# 1.6% 1.8% 1.6%
Return on Equity# 19.4% 17.4% 18.8%
NIM 3.3% 3.7% 3.4%
Cost to Income Ratio 37.3% 42.1% 40.3%
Non Interest Income to Total Income
43.3% 38.5% 39.7%
Balance Sheet Highlights
(` in Crore ) 30-Jun-18 30-Jun-17 Growth %
(y-o-y) 31-Mar-18
Growth % (q-o-q)
Advances 214,720.1 139,971.8 53.4% 203,533.9 5.5%
Deposits 213,394.5 150,240.9 42.0% 200,738.1 6.3%
CASA 74,930.0 55,215.1 35.7% 73,176.2 2.4%
Shareholders’ funds 26,313.9 22,387.4 17.5% 25,758.3 2.2%
Total Capital Funds 46,983.7** 32,541.3 44.4% 46,975.7 0.0%
Total Balance Sheet 332,549.3 222,145.2 49.7% 312,445.6 6.4%
Key Balance Sheet Ratios
Capital Adequacy 17.3%** 17.6%**
18.4%
CET I Ratio 9.5%** 11.9%** 9.7%
Tier I Ratio 12.8%** 13.8%** 13.2%
Book Value (`) 114.1 97.9 111.8
Gross NPA 1.31% (` 2,824.5 Crs) 0.97% 1.28%
Net NPA 0.59% (` 1,262.6 Crs) 0.39% 0.64%
Provision Coverage Ratio 55.3% 60.0% 50.0%
Credit Costs (in bps) 15 18 13
Restructured Exposure%* 0.12%(` 249.4 Crs) 0.55% 0.16%
Security Receipts (Net)% 0.82%(` 1,771.2 Crs) 0.69% 0.92%
CASA Ratio 35.1% 36.8% 36.5%
Daily Average LCR 101.0% 88.3% 102.1%
# Annualized * Includes erstwhile Standard S4A, 5-25 and SDR exposures
** including profits & adjusted for prorated dividends & IFR + Adjusted basis 5:1 Share Split
INVESTOR PRESENTATION
Q1FY19 Update
QUARTERLY HIGHLIGHTS
2
3
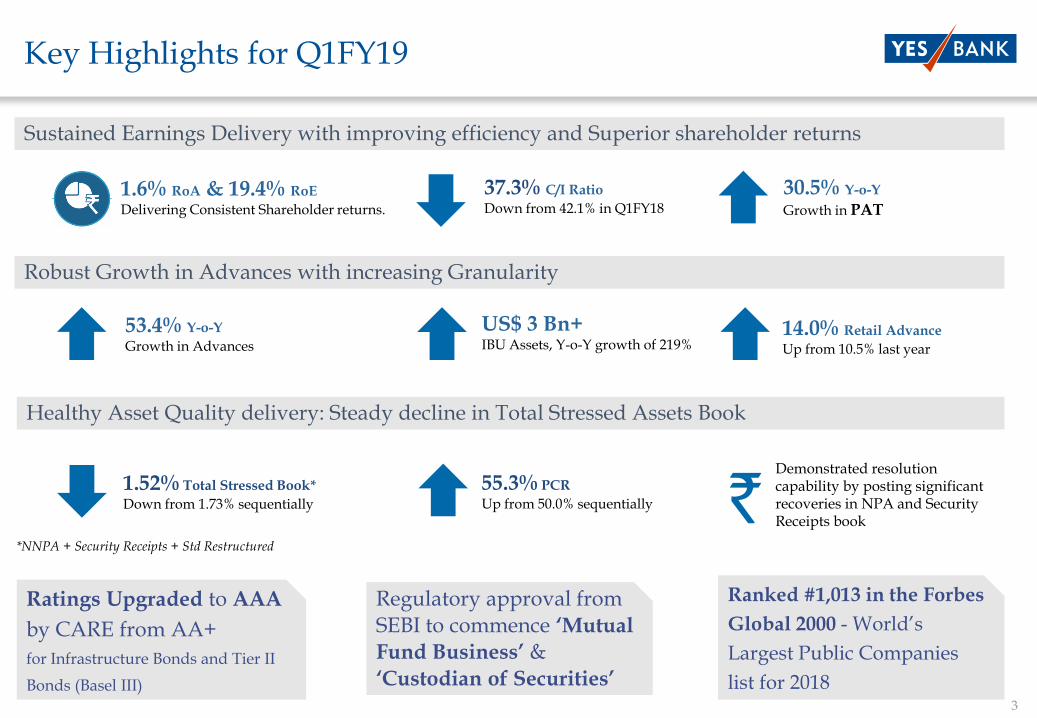
Key Highlights for Q1FY19
Healthy Asset Quality delivery: Steady decline in Total Stressed Assets Book
Robust Growth in Advances with increasing Granularity
Sustained Earnings Delivery with improving efficiency and Superior shareholder returns
37.3% C/I Ratio
Down from 42.1% in Q1FY181.6% RoA & 19.4% RoE
Delivering Consistent Shareholder returns.
30.5% Y-o-Y
Growth in PAT
14.0% Retail Advance
Up from 10.5% last year
US$ 3 Bn+IBU Assets, Y-o-Y growth of 219%
53.4% Y-o-Y
Growth in Advances
1.52% Total Stressed Book*
Down from 1.73% sequentially
Demonstrated resolution capability by posting significant recoveries in NPA and Security Receipts book
55.3% PCR
Up from 50.0% sequentially
*NNPA + Security Receipts + Std Restructured
`
Ratings Upgraded to AAA
by CARE from AA+
for Infrastructure Bonds and Tier II
Bonds (Basel III)
Regulatory approval from SEBI to commence ‘Mutual
Fund Business’ & ‘Custodian of Securities’
Ranked #1,013 in the Forbes
Global 2000 - World’s
Largest Public Companies
list for 2018
4
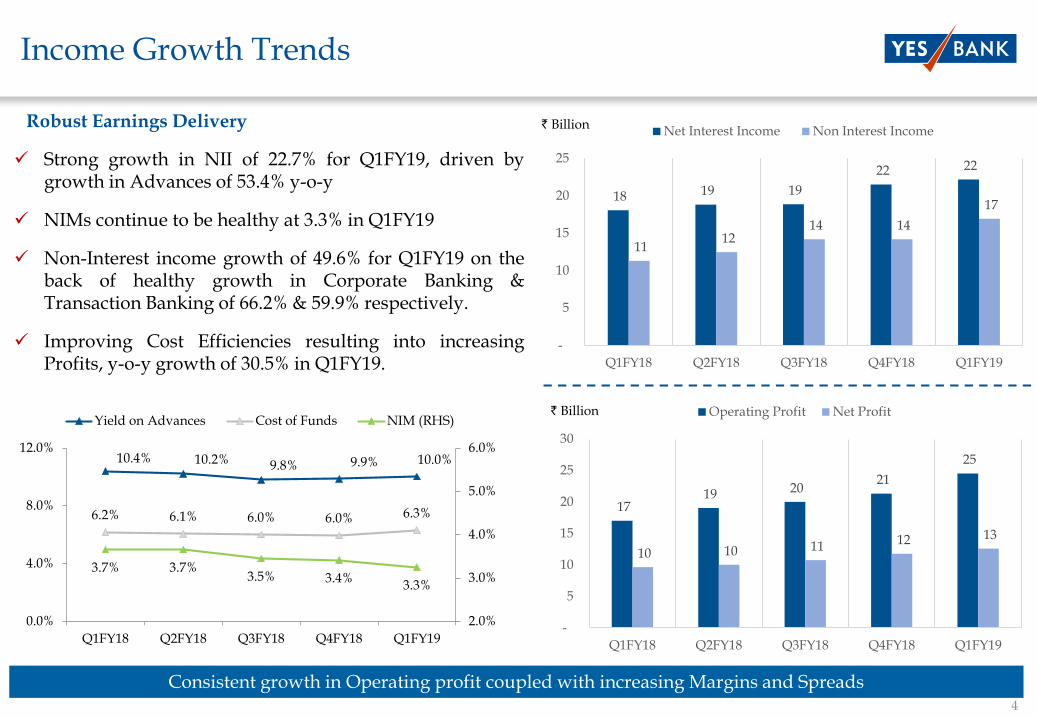
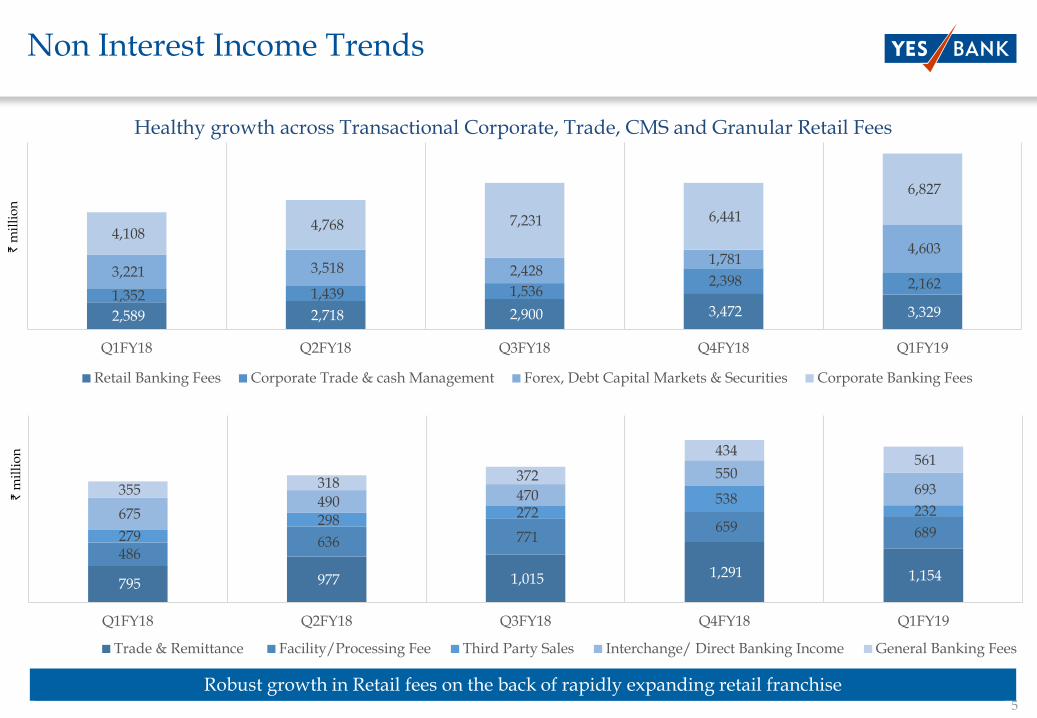
Income Growth Trends
Robust Earnings Delivery
✓ Strong growth in NII of 22.7% for Q1FY19, driven bygrowth in Advances of 53.4% y-o-y
✓ NIMs continue to be healthy at 3.3% in Q1FY19
✓ Non-Interest income growth of 49.6% for Q1FY19 on theback of healthy growth in Corporate Banking &Transaction Banking of 66.2% & 59.9% respectively.
✓ Improving Cost Efficiencies resulting into increasingProfits, y-o-y growth of 30.5% in Q1FY19.
Consistent growth in Operating profit coupled with increasing Margins and Spreads
` Billion
` Billion
10.4% 10.2% 9.8% 9.9% 10.0%
6.2% 6.1% 6.0% 6.0% 6.3%
3.7% 3.7%3.5% 3.4%
3.3%
2.0%
3.0%
4.0%
5.0%
6.0%
0.0%
4.0%
8.0%
12.0%
Q1FY18 Q2FY18 Q3FY18 Q4FY18 Q1FY19
Yield on Advances Cost of Funds NIM (RHS)
18 19 19
22 22
11 12
14 14
17
-
5
10
15
20
25
Q1FY18 Q2FY18 Q3FY18 Q4FY18 Q1FY19
Net Interest Income Non Interest Income
17 19 20
21
25
10 10 11 12 13
-
5
10
15
20
25
30
Q1FY18 Q2FY18 Q3FY18 Q4FY18 Q1FY19
Operating Profit Net Profit
5
795 977 1,015 1,291 1,154
486 636 771
659 689 279 298
272 538
232 675 490 470
550 693 355 318 372
434 561
Q1FY18 Q2FY18 Q3FY18 Q4FY18 Q1FY19
Trade & Remittance Facility/Processing Fee Third Party Sales Interchange/ Direct Banking Income General Banking Fees
Non Interest Income Trends`
mil
lio
n
Robust growth in Retail fees on the back of rapidly expanding retail franchise
Healthy growth across Transactional Corporate, Trade, CMS and Granular Retail Fees
2,589 2,718 2,900 3,472 3,329 1,352 1,439 1,536
2,398 2,162 3,221 3,518 2,428
1,781 4,603
4,108 4,768 7,231 6,441
6,827
Q1FY18 Q2FY18 Q3FY18 Q4FY18 Q1FY19
Retail Banking Fees Corporate Trade & cash Management Forex, Debt Capital Markets & Securities Corporate Banking Fees
`m
illi
on

6
8931,261
60
190
300
395
147
301
Jun'17 Jun'18
Corporate IBU MSME Retail Retail Asset Breakup
Key Balance Sheet Growth Trends
✓ Corporate growth well segmented across 8 Relationship groups and lending to Higher Rated corporates.
▪ IBU Advances grew 215% y-o-y to USD 2.8 Bn as on Jun’18
✓ Healthy growth in MSME driven by focused segmentation and Knowledge Banking approach
✓ Retail Disbursements increased by over 80% to ` 69.1 Bn in Q1FY19 v/s Q1FY18
: HL, LAP, Affordable Housing
: Construction Equipment, Healthcare Finance: Personal Loan, Gold Loan, Loan Against Shares, Business Loan: Auto Loan, Commercial Vehicle, Inventory Funding
MLG: Mortgage Loan GroupBELG: Business Equipment Loan GroupCLG: Consumer Loan GroupVLG: Vehicle Loan Group
Well Segmented Growth
67.6%
8.7%
9.7%14.0%
As % of Total AdvancesAs on 30th June, 2018
Corporate Banking
Medium Enterprises
Small and MicroEnterprises
Retail Banking
Robust growth attributed to Strong Performance across Segments
13%
17%
49%
21%
Incremental Growth MixGrowth
32%
215%
41%
105%
` Billion
30%
11%
16%
40%
4% MLG
BELG
CLG
VLG
SHG and JLG

7
Well-diversified Liability Franchise
Bank to overachieve CASA target of 40%, by 2020
` billion ` billion
Improving Operating Leverage further contributing to robust growth in granular deposits
` Million
✓ Increase in CASA driven by
▪ Increase in Operating leverage
▪ Expansive physical & Digital Reach
▪ Strong Corporate Relationships
▪ Competent Management
YoY growth: CA 53%; SA 27% YoY growth: Retail TDs 22%
185 197 226 288 283
367 390 427
444 466
36.8% 37.2% 38.0% 36.5% 35.1%
0.0%
10.0%
20.0%
30.0%
40.0%
0
200
400
600
800
Q1FY18 Q2FY18 Q3FY18 Q4FY18 Q1FY19
CA SA CASA (%)
376 387 394 417460
25.0% 24.5%22.9% 20.7%
21.5%
0.0%
10.0%
20.0%
30.0%
0
100
200
300
400
500
Q1FY18 Q2FY18 Q3FY18 Q4FY18 Q1FY19
Retail TD Retail TD (% of Dep)
334 364
519
665 678
Mar'15 Mar'16 Mar'17 Mar'18 Jun'18
CASA/Branch
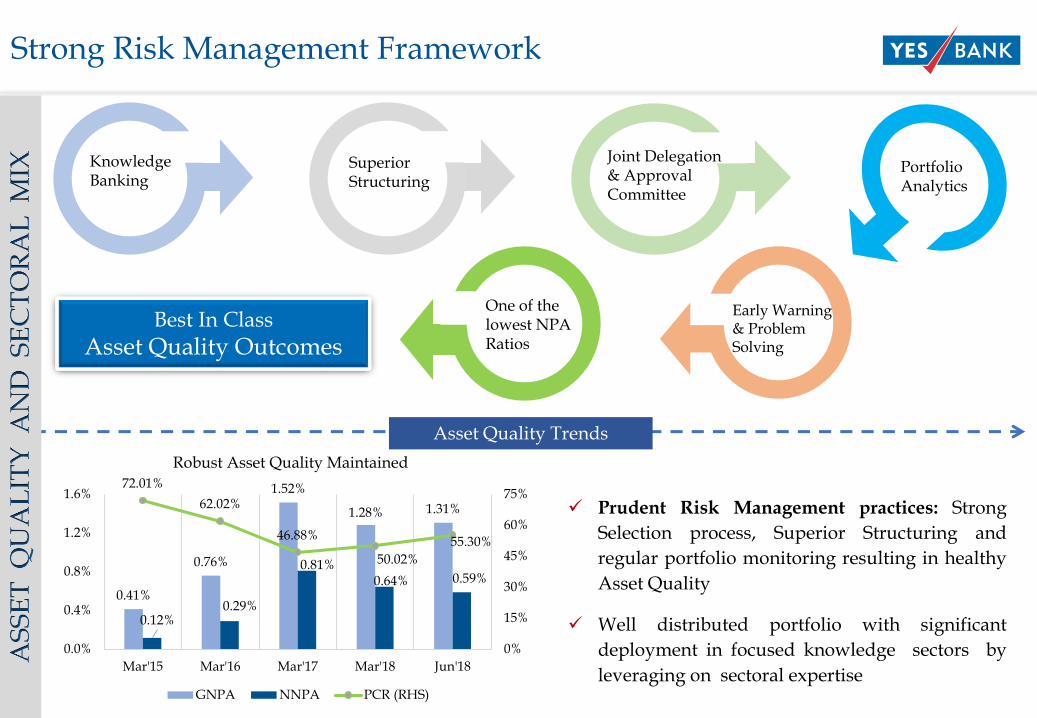
Strong Risk Management Framework
Knowledge Banking
One of the lowest NPA Ratios
Superior Structuring
Best In Class
Asset Quality Outcomes
Early Warning & Problem Solving
Joint Delegation & Approval Committee
Portfolio Analytics
Asset Quality Trends
✓ Prudent Risk Management practices: Strong
Selection process, Superior Structuring and
regular portfolio monitoring resulting in healthy
Asset Quality
✓ Well distributed portfolio with significant
deployment in focused knowledge sectors by
leveraging on sectoral expertise
0.41%
0.76%
1.52%
1.28% 1.31%
0.12%0.29%
0.81%0.64% 0.59%
72.01%
62.02%
46.88%
50.02%
55.30%
0%
15%
30%
45%
60%
75%
0.0%
0.4%
0.8%
1.2%
1.6%
Mar'15 Mar'16 Mar'17 Mar'18 Jun'18
Robust Asset Quality Maintained
GNPA NNPA PCR (RHS)

9
Agri and Allied1%
All Engg3% Aviation (Airports)
1%
Beverages0% Cement
1%
Chemical Products (Dyes, Paints, etc.)
1%
Commercial Real Estate6%
Diversified1%
Drugs & Pharmaceuticals
1%
Educational Services
1%
Electricity9%
EPC8%
Food Processing2%
Gas storage and pipeline0%
Gems and Jewellery1%
Glass & Glassware0%
Granular & Retail10%
Healthcare & Hospitals (Non Infra)1%
Housing Finance Co.
3%Iron & Steel3%
Media & Entertainment2%
Mining & Quarrying
1%
NBFC2%
Other Financial Services
2%
Other Industries14%
Other Metal & Metal Products2%
Other Real Estate ( LRD/ Non CRE etc)
0%
Paper & Paper Products
0%
Petroleum, Coal and Other Fuels4%
Railways0%
Roadways1%
Rubber, Plastic & Products
1%
Social & Commercial
Infrastructure2%
Technology/ITES1%
Telecommunication4%
Textiles1%
Travel, Tourism & Hospitality3%
Vehicles, Parts &
Equipments3%
Water Sanitation0%
Waterways2%
Well diversified portfolio with significant deployment in YES Bank focused knowledge sectors
As on 30th Jun, 2018
Sectoral Exposure Mix

10
Stable Risk Profile
Non-Renewable Electricity Generation: 2.5% (All Operational )
NIL Exposures to SEBs
Electricity
Sensitive Sector Disclosure
Overall Corporate portfolio continues to be well rated with almost 80% portfolio rated ‘A’ or better (Based on Internal Corporate rating models mapped to external ratings) and well distributed across growth sectors.
Rating Profile
1.7% 2.2% 2.3%21.8% 18.5% 18.7%
41.6% 42.9% 43.2%
14.0% 13.3% 13.5%
20.8% 23.2% 22.2%
30-Jun-17 31-Mar-18 30-Jun-18
BB and Below BBB A AA AAA
Iron & Steel
2.6%
2.0%
Total A & Above
Telecom
3.6%3.3%
Total A & Above
1.5%
1.0%
Total A & Above
Gems & Jewelry
11
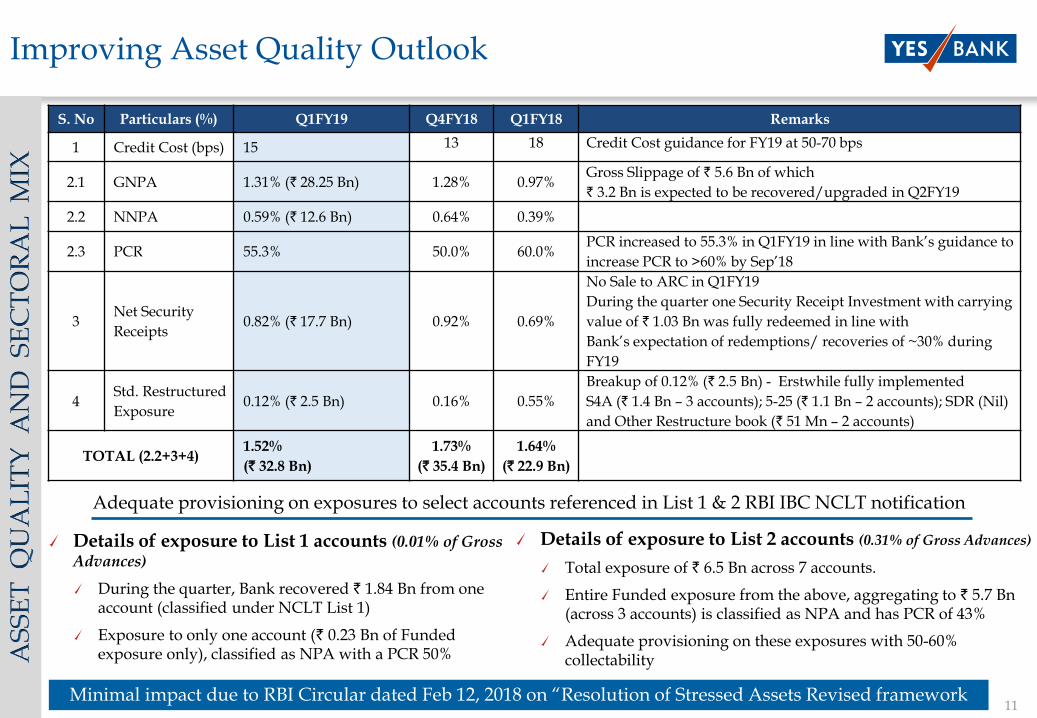
Details of exposure to List 1 accounts (0.01% of Gross Advances)
During the quarter, Bank recovered ` 1.84 Bn from one account (classified under NCLT List 1)
Exposure to only one account (` 0.23 Bn of Funded exposure only), classified as NPA with a PCR 50%
Improving Asset Quality Outlook
S. No Particulars (%) Q1FY19 Q4FY18 Q1FY18 Remarks
1 Credit Cost (bps) 15 13 18 Credit Cost guidance for FY19 at 50-70 bps
2.1 GNPA 1.31% (` 28.25 Bn) 1.28% 0.97%Gross Slippage of ` 5.6 Bn of which
` 3.2 Bn is expected to be recovered/upgraded in Q2FY19
2.2 NNPA 0.59% (` 12.6 Bn) 0.64% 0.39%
2.3 PCR 55.3% 50.0% 60.0%PCR increased to 55.3% in Q1FY19 in line with Bank’s guidance to
increase PCR to >60% by Sep’18
3Net Security
Receipts0.82% (` 17.7 Bn) 0.92% 0.69%
No Sale to ARC in Q1FY19
During the quarter one Security Receipt Investment with carrying
value of ` 1.03 Bn was fully redeemed in line with
Bank’s expectation of redemptions/ recoveries of ~30% during
FY19
4Std. Restructured
Exposure0.12% (` 2.5 Bn) 0.16% 0.55%
Breakup of 0.12% (` 2.5 Bn) - Erstwhile fully implemented
S4A (` 1.4 Bn – 3 accounts); 5-25 (` 1.1 Bn – 2 accounts); SDR (Nil)
and Other Restructure book (` 51 Mn – 2 accounts)
TOTAL (2.2+3+4)1.52%
(` 32.8 Bn)
1.73%
(` 35.4 Bn)
1.64%
(` 22.9 Bn)
Details of exposure to List 2 accounts (0.31% of Gross Advances)
Total exposure of ` 6.5 Bn across 7 accounts.
Entire Funded exposure from the above, aggregating to ` 5.7 Bn(across 3 accounts) is classified as NPA and has PCR of 43%
Adequate provisioning on these exposures with 50-60% collectability
Adequate provisioning on exposures to select accounts referenced in List 1 & 2 RBI IBC NCLT notification
Minimal impact due to RBI Circular dated Feb 12, 2018 on “Resolution of Stressed Assets Revised framework

12
0
100
200
300
-
1,000
2,000
3,000
RWA (LHS) Tier I Capital (RHS)
10.9% 10.9% 10.9% 10.7% 10.3% 10.1% 12.2% 13.3% 13.8% 13.2% 14.7% 13.2% 12.8%
` Billion
✓ Total Capital Funds at ` 469.8 Bn, up 44% Y-o-Y.
▪ Total CRAR at 17.3%*
▪ Tier I ratio of 12.8%*
▪ CET I ratio at 9.5%*
✓ Best in Class Return Ratios with RoA > 1.5%and RoE > 17% consistently over the last 10 years
✓ Demonstrated ability to raise capital across cycles; reflecting
excellent market appetite for YES Bank capital qualifying bonds
▪ Raised ` 7,000 Cr in last one year through private placement ofBasel III Tier II Bonds in two tranches
▪ Raised ` 5,415 Cr in last one year through issue of Basel IIIcomplaint AT I.
▪ Raised USD 600 Mn for 5 Year Tenor under its maiden USD 1 BnMTN Program (largest debut International bond issuance by an Indian
Bank)
Healthy Capital Position
supported by growth through Internal Accretion
Well capitalized position to enable capturing Market Share
* Including profits, adjusted for prorated dividend & IFR
` Billion
QIP – US$ 750Mn.
B AT1– INR 30 Bn.
B AT1– INR 54 Bn.
Tier I Ratio

13
Branch Network Expansion – Evolving Landscapes
Coverage across all 53 Metros, 29 States and 7 Union Territories.
13 Metro/Urban and 3 dedicated RIBB regions
Hub and Spoke model for faster maturity and greater efficiency of branch network
Substantial focus on North & West Regions (DMIC/Make in India/GIB corridor) with evolving network in South & East
150 1105 1250
March 2020June 2018March 2010
A Clearly Articulated 2 Pronged Strategy: Metro + Urban & Semi-Urban +Rural to achieve 1250 Branches by FY20
Physical Vs. Digital
Digital Channels to Complement NOT Cannibalize Branches
Branch Target reduced to 1,250 Branches by 2020
▪ HUB Spoke Model
▪ Automation of Backend
▪ Data Backed Mid Office and
▪ Digitalization of Front End will bring in efficiencies
YES BANK will however Resize and Redefine Branches
▪ Smaller Formats, Lesser Manpower
Metro & Urban Strategy Semi- Urban +Rural Strategy
Emerged as the most significantly present Bank in Top 30 Deposit Centers
Maximize Branches in Top 200 Deposit Centers
SME, Digital & Specialized branches designed for catching catchments
NCR and MMR to continue as Key Growth Centers
MSME, B2B2C, Focus Segments, Liabilities driven Fee Income & Cross Sell
Key Agri Mandis/Food Parks/GOIs RURBAN Clusters
Make in India/MSME clusters and Ports/SEZs/EPZs
DMIC Influence/SMART Cities/Key NRI belts/YES Vijay
Assets led RURBAN Strategy to focus on Farmer households, Rural SMEs and Women Groups

YES BANK PROFILE
14

15
Large Bank Growth Phase (FY15-20): Strong Growth with increasing Granularity
✓ 4th Largest# Private Sector Bank with Total Assets in excess of ` 3 Trillion
✓ One of the Fastest Growing Large Bank in India; ▪ CAGR (FY15-18): Advances: 39%; Deposits: 30%
✓ Core Retail Advances grew by 122% CAGR (FY15-18); constitutes 14.0% of Total Advances (as on June’18)
✓ CASA growing at 51% CAGR (FY15-18); constitutes 35.1% of Total Deposits (as on Jun’18).
✓ Well segmented growth including lending to Higher Rated Customers resulting in consistently Improving Rating Profile.
✓ Deposits Market Share increased by 70% in 3 years to 1.7%;
▪ Capturing Incremental Market Share at 6.9% (FY18)
✓ Advances Market Share more than doubled in 3 years to 2.3%
▪ Capturing Incremental Market Share at 9.2% (FY18)
1.0%1.2% 1.3%
1.7%Market Share Deposits
1.1% 1.3% 1.7% 2.3%
FY15 FY16 FY17 FY18
Market Share Advances
YES Bank Advances CAGR (FY15-18) of 39% V/s Industry CAGR of 8% resulting in Increasing Market Share
755 912 982
1,117 1,323
1,429
2,035 2,007
Advances Deposits
FY15 FY16 FY17 FY18
` Billion
16
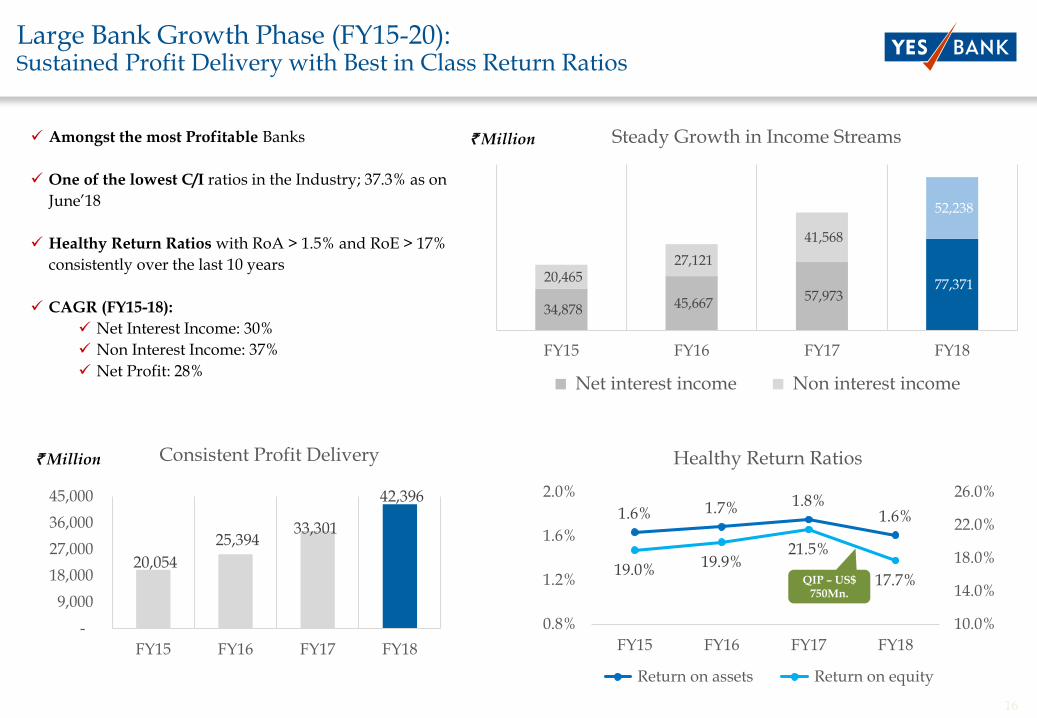
34,878 45,667 57,973
77,371 20,465
27,121
41,568
52,238
FY15 FY16 FY17 FY18
Steady Growth in Income Streams
Net interest income Non interest income
Large Bank Growth Phase (FY15-20): Sustained Profit Delivery with Best in Class Return Ratios
20,054
25,394 33,301
42,396
-
9,000
18,000
27,000
36,000
45,000
FY15 FY16 FY17 FY18
Consistent Profit Delivery
1.6% 1.7% 1.8%1.6%
19.0% 19.9%21.5%
17.7%
10.0%
14.0%
18.0%
22.0%
26.0%
0.8%
1.2%
1.6%
2.0%
FY15 FY16 FY17 FY18
Healthy Return Ratios
Return on assets Return on equity
` Million
` Million
✓ Amongst the most Profitable Banks
✓ One of the lowest C/I ratios in the Industry; 37.3% as on
June’18
✓ Healthy Return Ratios with RoA > 1.5% and RoE > 17%
consistently over the last 10 years
✓ CAGR (FY15-18):
✓ Net Interest Income: 30%
✓ Non Interest Income: 37%
✓ Net Profit: 28%
QIP – US$ 750Mn.
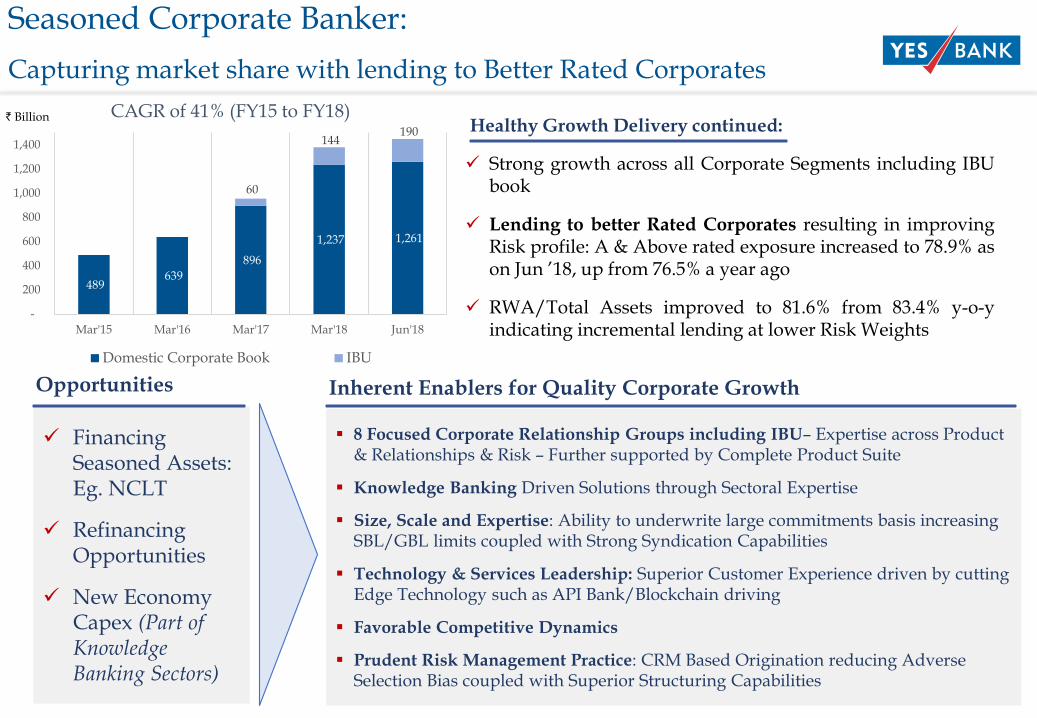
Inherent Enablers for Quality Corporate Growth
Healthy Growth Delivery continued:
✓ Strong growth across all Corporate Segments including IBUbook
✓ Lending to better Rated Corporates resulting in improvingRisk profile: A & Above rated exposure increased to 78.9% ason Jun ’18, up from 76.5% a year ago
✓ RWA/Total Assets improved to 81.6% from 83.4% y-o-yindicating incremental lending at lower Risk Weights
Seasoned Corporate Banker:
Capturing market share with lending to Better Rated Corporates
CAGR of 41% (FY15 to FY18)
✓ Financing Seasoned Assets: Eg. NCLT
✓ Refinancing Opportunities
✓ New Economy Capex (Part of Knowledge Banking Sectors)
▪ 8 Focused Corporate Relationship Groups including IBU– Expertise across Product & Relationships & Risk – Further supported by Complete Product Suite
▪ Knowledge Banking Driven Solutions through Sectoral Expertise
▪ Size, Scale and Expertise: Ability to underwrite large commitments basis increasing SBL/GBL limits coupled with Strong Syndication Capabilities
▪ Technology & Services Leadership: Superior Customer Experience driven by cutting Edge Technology such as API Bank/Blockchain driving
▪ Favorable Competitive Dynamics
▪ Prudent Risk Management Practice: CRM Based Origination reducing Adverse Selection Bias coupled with Superior Structuring Capabilities
Opportunities
489 639
896
1,237 1,261
60
144 190
-
200
400
600
800
1,000
1,200
1,400
Mar'15 Mar'16 Mar'17 Mar'18 Jun'18
Domestic Corporate Book IBU
` Billion

MSME Financing:
Banking MSME since Inception
MSME CAGR of 27% (FY15-18)Healthy Growth in MSME Advances with best in class Portfolio:
✓ 3 focused Relationship Groups:
▪ MEB (` 1,000- 5,000 Mn): CRM based acquisition through 250+ Sector Specialists Relationship Managers. Avg. Ticket Size - ` 116 Mn
▪ SEB (` 150-1,000 Mn): Sourcing through penetrating Supply chain of Anchor Corporate Relationships. Avg. Ticket Size - ` 27 Mn
▪ MIB (` 0-150 Mn): Small Ticket granular lending leveraging on branch distribution network. Avg. Ticket Size - ` 6 Mn
✓ Healthy Portfolio Quality:
▪ Mix of Manufactures, Traders and Vendors/Dealers of Marquee Anchor Corporates
▪ Cash Flow based lending with focus on obtaining preferential property of Promoter as collateral
▪ Stringent Valuation Methodology for Collaterals, including Valuation Report by dual Independent Agencies and an Internal Audit team to maintain range bound LTV
Opportunity:
✓ Acceleration in ‘New To Credit’ Customers into Formal Credit Sector due GST and Demonetization
✓ Policy Support for MSMEs such as Tax Incentive
▪ Continued focus on Sole Banking Relationships (SEB & MIB) and Primary Banking Relationships (MEB)
▪ Deepening entrenchment in MSME Ecosystem: Focus on Cross Sell of Trade/CMS/Forex & Investment Banking products to create hooks
▪ Technology & Services Differentiators: Initiatives such as GST Invoice Financing (First Bank to Launch), API Banking etc to drive acquisition. Industry First SME App for customer self-servicing
▪ Using Analytics basis GST filling/ Cash Flows for automated continuous Portfolio Monitoring
Road going Forward
106 109 139
197 187
92 128
163
209 208
-
150
300
450
Mar'15 Mar'16 Mar'17 Mar'18 Jun'18
Medium Enterprise Small and Micro Enterprise
` Billion

Retail Assets:
Rolling Momentum to drive growth
Strong Growth Momentum in Retail Assets:
▪ Retail Assets doubled to 14.0% of Total Advances
▪ Contributed 47% qoq incremental growth in Q1FY19
▪ Diversified book across all 13 Products
▪ Focus on building quality Customer Franchise through
offering of entire gamut of product & services
▪ Lowest delinquencies
CAGR of 54% (FY15-18)
Key Enablers for Strong Momentum in Retail Assets
✓ Limited Players offering entire gamut of Products across Assets, Liabilities & Wealth Ecosystem
✓ Evolving consumer landscape through quality service on the back of Digitization, & Technology
▪ Established credible Long term alternate for full scale Banking Offerings in Retail Assets in Indian Banking Industry
▪ Experienced Leadership: Having witnessed multiple Retail cycles
▪ Relationship Based Sourcing: Strong Industry Associations and Tie up with Manufacturers and Dealers as preferred Financiers
▪ Leveraging Expansive Reach through 1,100+ branches further augmented by Digital channels
▪ Harnessing Technology to improve efficiency & enhance experience: 1st Bank to launch Bots for faster acquisition and 24X7 superior experience
▪ Quality Sourcing through Stringent Risk Controls. Further, Continuous monitoring though analytics
Opportunities
69106 125
248301
9.1%
10.8%
9.4%
12.2%
14.0%
6.0%
8.0%
10.0%
12.0%
14.0%
0
100
200
300
Mar'15 Mar'16 Mar'17 Mar'18 Jun'18
Retail Advances Retail Advances (as % of Total Adv)
` Billion

Consumer Retail
CommercialRetail
✓ Healthy Traction in CV & CE book given visible improvement in Infrastructure Sector:
✓ Focus primarily on large fleet operators
✓ Tie Ups with Manufacturers (Auto) & Builders (Affordable Housing) & Associations Eg: Partnering with FADA to train 15K Auto Retailers
✓ Focus on Internal Customers & Corporate Salaried
✓ ~33% of the RBA book is secured loans (Auto & Affordable Housing Loans)
✓ PL contributes 12% of the RBA book, where focus is on internal customers only
✓ Lending with strong risk mitigation controls
✓ Scorecard Based underwriting
Building Relationships & Credibility as
- Long Term Consistent Player
Portfolio Mix
✓ B2B2C Strategy – Alliances with Key Manufacturers to drive sales across the entire Value Chain
✓ Consistent seamless execution capabilities: establishing YES Bank as Key Player in Commercial Assets Business
Acquisition Strategy Underwriting
✓ Cash Flow based Credit Underwriting
✓ Business analytics for Early Warning Signals and bounce trends
Leveraging Alliances, Relationships & Technology for Enhanced Customer Acquisition
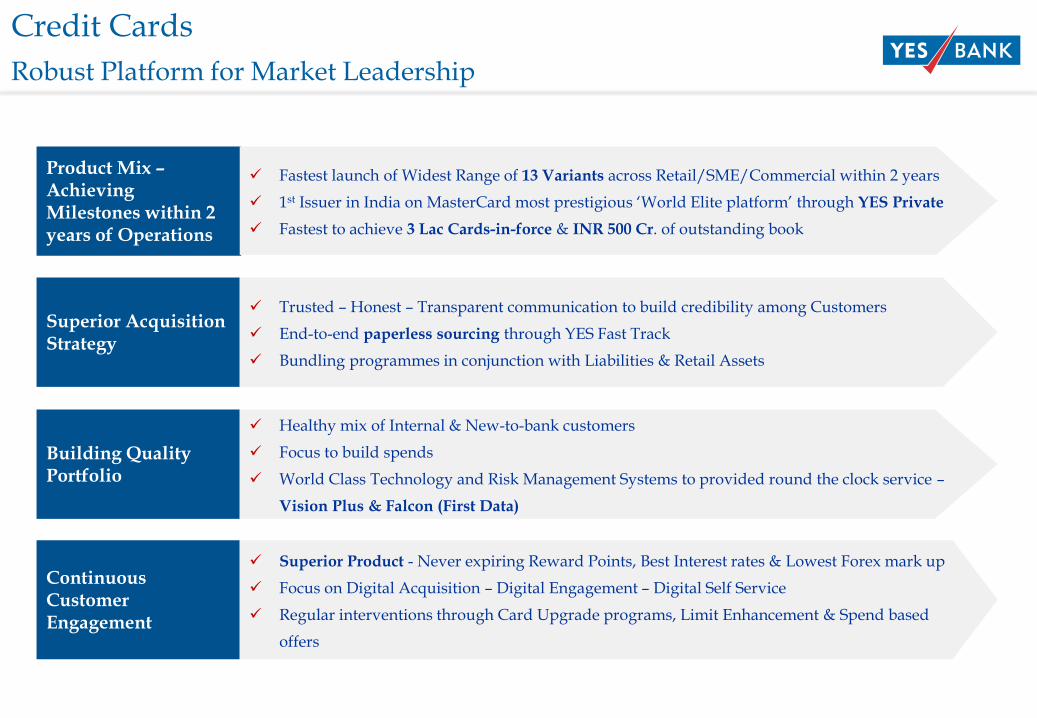
Credit Cards
Robust Platform for Market Leadership
Product Mix –Achieving Milestones within 2 years of Operations
✓ Fastest launch of Widest Range of 13 Variants across Retail/SME/Commercial within 2 years
✓ 1st Issuer in India on MasterCard most prestigious ‘World Elite platform’ through YES Private
✓ Fastest to achieve 3 Lac Cards-in-force & INR 500 Cr. of outstanding book
Superior Acquisition Strategy
✓ Trusted – Honest – Transparent communication to build credibility among Customers
✓ End-to-end paperless sourcing through YES Fast Track
✓ Bundling programmes in conjunction with Liabilities & Retail Assets
Continuous Customer Engagement
✓ Superior Product - Never expiring Reward Points, Best Interest rates & Lowest Forex mark up
✓ Focus on Digital Acquisition – Digital Engagement – Digital Self Service
✓ Regular interventions through Card Upgrade programs, Limit Enhancement & Spend based
offers
Building Quality Portfolio
✓ Healthy mix of Internal & New-to-bank customers
✓ Focus to build spends
✓ World Class Technology and Risk Management Systems to provided round the clock service –
Vision Plus & Falcon (First Data)
22
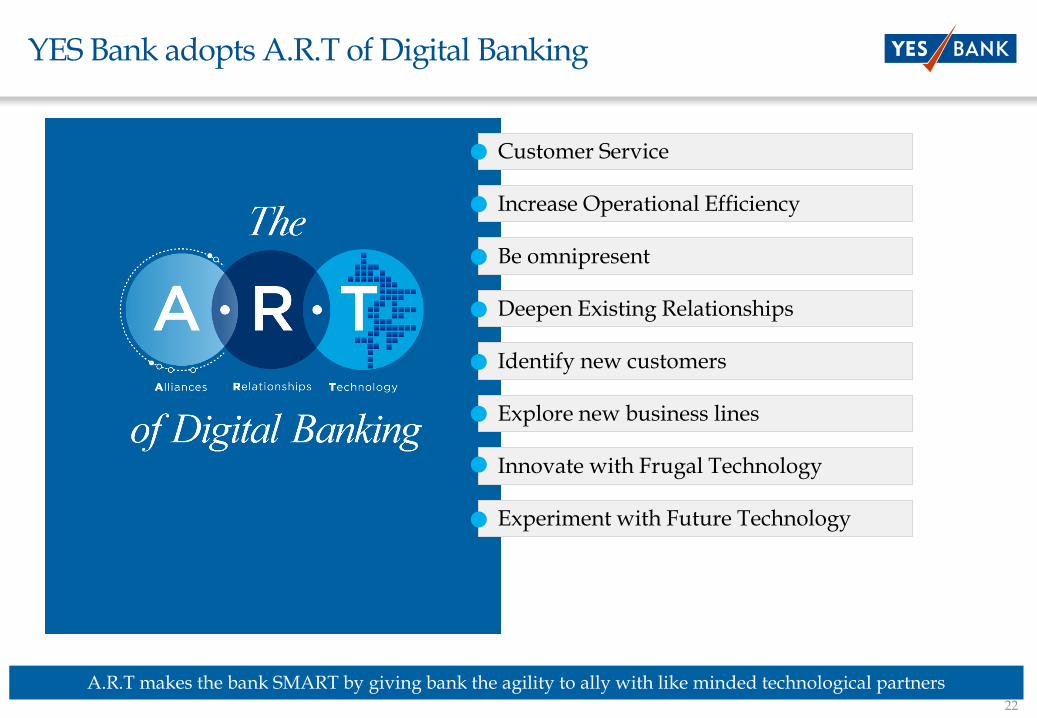
YES Bank adopts A.R.T of Digital Banking
Explore new business lines
Innovate with Frugal Technology
Be omnipresent
Identify new customers
Customer Service
Deepen Existing Relationships
Increase Operational Efficiency
Experiment with Future Technology
A.R.T makes the bank SMART by giving bank the agility to ally with like minded technological partners
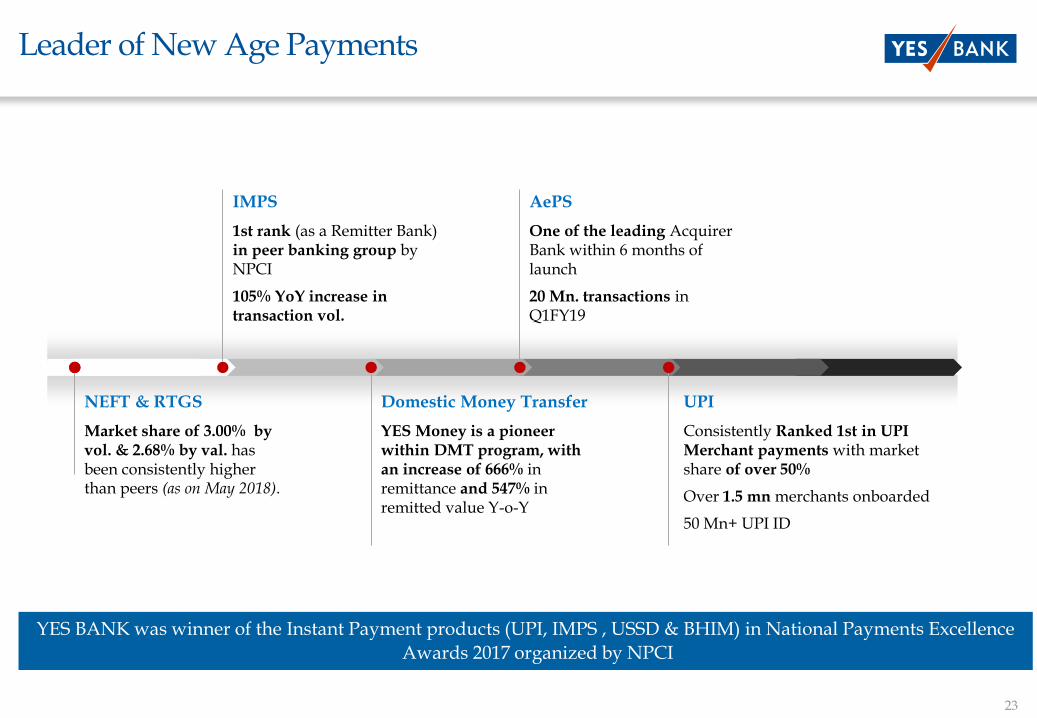
23
Leader of New Age Payments
UPI
Consistently Ranked 1st in UPI Merchant payments with market share of over 50%
Over 1.5 mn merchants onboarded
50 Mn+ UPI ID
Domestic Money Transfer
YES Money is a pioneer within DMT program, with an increase of 666% in remittance and 547% in remitted value Y-o-Y
NEFT & RTGS
Market share of 3.00% by vol. & 2.68% by val. has been consistently higher than peers (as on May 2018).
IMPS
1st rank (as a Remitter Bank)in peer banking group by NPCI
105% YoY increase in transaction vol.
AePS
One of the leading Acquirer Bank within 6 months of launch
20 Mn. transactions in Q1FY19
YES BANK was winner of the Instant Payment products (UPI, IMPS , USSD & BHIM) in National Payments Excellence
Awards 2017 organized by NPCI

24
Industry First Solution for Customers
API Banking
▪ 1st Indian bank to offer API Banking suite for CMS and Trade service
▪ Over 560 corporateson the API Banking platform
▪ API Banking platform was a winner across 4award categories including ‘Best Blockchain Initiative Application or Platform’ at the Asian Banker Transaction Banking Awards 2018
AWARDS (FIIA) 2018
YES MSME Mobile
▪ India’s first app offering 360* view of customer’s relationships-Accounts, Deposits, Payments and Borrowings in one place
▪ Industry-first features like Group Payment, Dedicated Salary Management module and Loan related documents submission
▪ 3000+ Registered users
▪ Over 12,000 app downloads
YES GST
▪ Industry first initiative launched basis customer feedback from 9500+ MSMEs
▪ MSMEs can now avail OD (over draft) up to Rs. 1 crore based on GST returns
▪ MSME needs to submit GST returns and residential or commercial property papers
▪ 100+ MSMEs benefitted with a disbursement value of ~Rs.35 crs.
Smart Trade
▪ 1st Bank to offer direct payments for imports online
▪ 600+ Corporates on the trade on net platform.
▪ Transaction volume on platform has increased by ~2x YoY
▪ Adjudged ‘Best Trade Finance Bank in India’ at the Asian Banker Transaction Banking Awards 2018
25
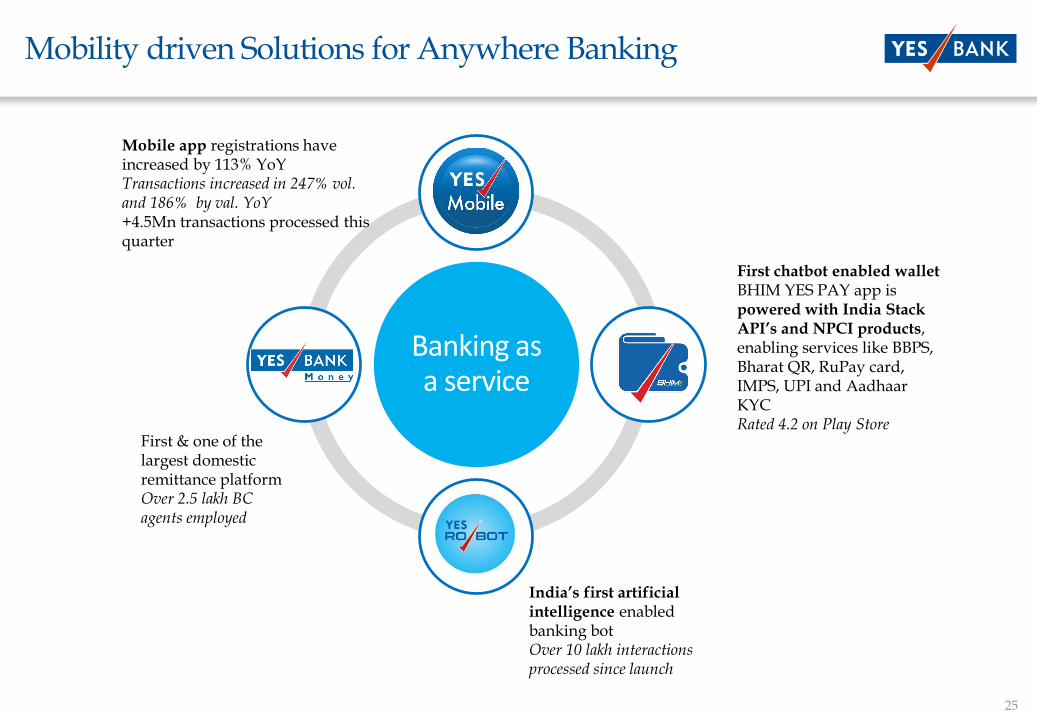
Mobility driven Solutions for Anywhere Banking
Banking as a service
YES Mobile
YES Money
SimSePay
BHIM Yes Pay
Mobile app registrations have increased by 113% YoYTransactions increased in 247% vol. and 186% by val. YoY+4.5Mn transactions processed this quarter
First & one of the largest domestic remittance platformOver 2.5 lakh BC agents employed
First chatbot enabled walletBHIM YES PAY app ispowered with India Stack API’s and NPCI products, enabling services like BBPS, Bharat QR, RuPay card, IMPS, UPI and Aadhaar KYCRated 4.2 on Play Store
India’s first artificial intelligence enabled banking botOver 10 lakh interactions processed since launch
26
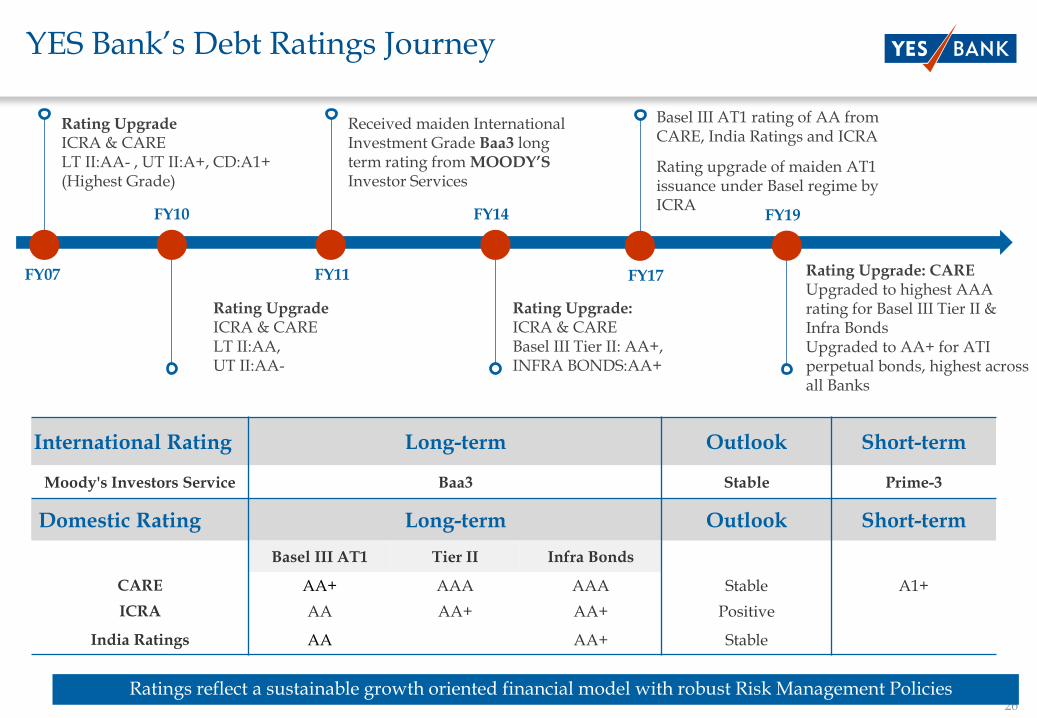
YES Bank’s Debt Ratings Journey
International Rating Long-term Outlook Short-term
Moody's Investors Service Baa3 Stable Prime-3
Domestic Rating Long-term Outlook Short-term
Basel III AT1 Tier II Infra Bonds
CARE AA+ AAA AAA Stable A1+
ICRA AA AA+ AA+ Positive
India Ratings AA AA+ Stable
Rating Upgrade ICRA & CARELT II:AA- , UT II:A+, CD:A1+ (Highest Grade)
Rating Upgrade ICRA & CARELT II:AA, UT II:AA-
Received maiden International Investment Grade Baa3 long term rating from MOODY’S Investor Services
Rating Upgrade: ICRA & CAREBasel III Tier II: AA+, INFRA BONDS:AA+
FY07 FY11
FY10 FY14
Basel III AT1 rating of AA from CARE, India Ratings and ICRA
Rating upgrade of maiden AT1 issuance under Basel regime by ICRA
FY17 Rating Upgrade: CAREUpgraded to highest AAA rating for Basel III Tier II & Infra BondsUpgraded to AA+ for ATI perpetual bonds, highest across all Banks
FY19
Ratings reflect a sustainable growth oriented financial model with robust Risk Management Policies
27
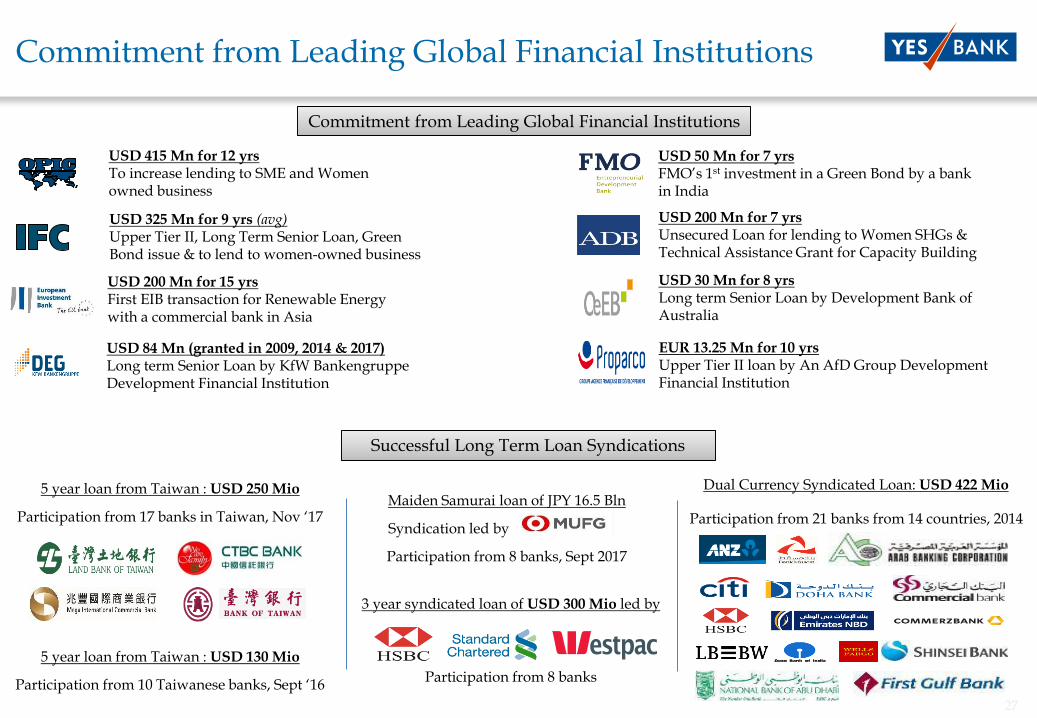
Commitment from Leading Global Financial Institutions
USD 415 Mn for 12 yrsTo increase lending to SME and Women owned business
USD 325 Mn for 9 yrs (avg)Upper Tier II, Long Term Senior Loan, Green Bond issue & to lend to women-owned business
USD 50 Mn for 7 yrsFMO’s 1st investment in a Green Bond by a bank in India
Maiden Samurai loan of JPY 16.5 Bln
Syndication led by
Participation from 8 banks, Sept 2017
5 year loan from Taiwan : USD 250 Mio
Participation from 17 banks in Taiwan, Nov ‘17
5 year loan from Taiwan : USD 130 Mio
Participation from 10 Taiwanese banks, Sept ‘16
Successful Long Term Loan Syndications
3 year syndicated loan of USD 300 Mio led by
Participation from 8 banks
Dual Currency Syndicated Loan: USD 422 Mio
Participation from 21 banks from 14 countries, 2014
USD 200 Mn for 7 yrsUnsecured Loan for lending to Women SHGs & Technical Assistance Grant for Capacity Building
USD 200 Mn for 15 yrsFirst EIB transaction for Renewable Energy with a commercial bank in Asia
USD 30 Mn for 8 yrsLong term Senior Loan by Development Bank of Australia
USD 84 Mn (granted in 2009, 2014 & 2017)Long term Senior Loan by KfW BankengruppeDevelopment Financial Institution
EUR 13.25 Mn for 10 yrsUpper Tier II loan by An AfD Group Development Financial Institution
Commitment from Leading Global Financial Institutions
28
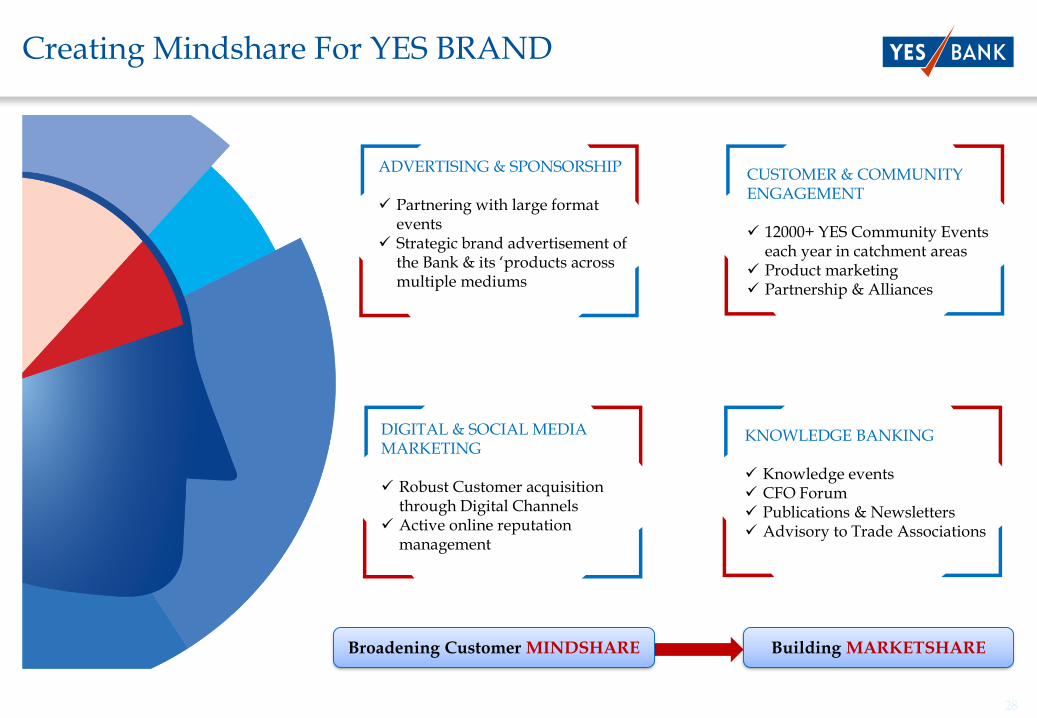
Creating Mindshare For YES BRAND
ADVERTISING & SPONSORSHIP
✓ Partnering with large format events
✓ Strategic brand advertisement of the Bank & its ‘products across multiple mediums
DIGITAL & SOCIAL MEDIA MARKETING
✓ Robust Customer acquisition through Digital Channels
✓ Active online reputation management
CUSTOMER & COMMUNITY ENGAGEMENT
✓ 12000+ YES Community Events each year in catchment areas
✓ Product marketing✓ Partnership & Alliances
KNOWLEDGE BANKING
✓ Knowledge events✓ CFO Forum✓ Publications & Newsletters✓ Advisory to Trade Associations
Broadening Customer MINDSHARE Building MARKETSHARE
29
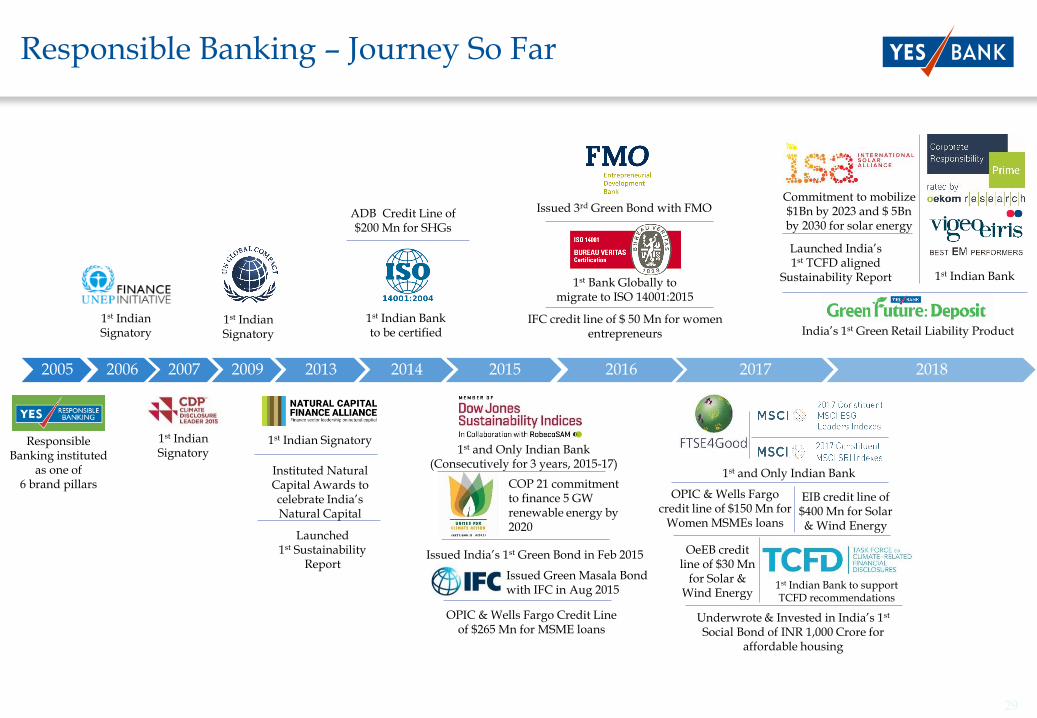
Responsible Banking – Journey So Far
1st Indian Signatory
1st Indian Signatory
1st Indian Signatory
ADB Credit Line of $200 Mn for SHGs
1st Indian Bank to be certified
1st Indian Signatory
Launched 1st Sustainability
Report
Instituted Natural Capital Awards to celebrate India’s Natural Capital
India’s 1st Green Retail Liability Product
Launched India’s 1st TCFD aligned
Sustainability Report
Commitment to mobilize $1Bn by 2023 and $ 5Bn by 2030 for solar energy
1st Indian Bank
Responsible Banking instituted
as one of 6 brand pillars
Issued India’s 1st Green Bond in Feb 2015
COP 21 commitment to finance 5 GW renewable energy by 2020
OPIC & Wells Fargo Credit Line of $265 Mn for MSME loans
1st and Only Indian Bank (Consecutively for 3 years, 2015-17)
Issued Green Masala Bond with IFC in Aug 2015
1st Bank Globally to migrate to ISO 14001:2015
IFC credit line of $ 50 Mn for women entrepreneurs
Issued 3rd Green Bond with FMO
OPIC & Wells Fargo credit line of $150 Mn for
Women MSMEs loans
EIB credit line of $400 Mn for Solar & Wind Energy
OeEB credit line of $30 Mn
for Solar & Wind Energy
Underwrote & Invested in India’s 1st
Social Bond of INR 1,000 Crore for affordable housing
1st and Only Indian Bank
1st Indian Bank to support TCFD recommendations
2005 2006 2007 2009 2013 2014 2015 2016 2017 2018

30
Sustainable & Responsible Banking Leadership
FACILITATING SUSTAINABLE FINANCETRANSPARENCY & ACCOUNTABILITY
POLICY ADVOCACY THROUGH THOUGHT LEADERSHIP
Knowledge Reports - Climate change and sustainable development
Thought leadership in partnership with academia, multilaterals, think tanks, regulators and governments
Policy advocacy as a catalyst within financial sector
POSITIVE IMPACT CSR & SUSTAINABLE DEVELOPMENT
Livelihood and Water Security
Employability and Entrepreneurship
Environment sustainability
Media for social change
Social Value Creation
Triple Bottom Line accounting and reporting
Enhanced climate disclosures
Environmental, Social and Governance (ESG) disclosures
Green House Gas (GHG) accounting and Portfolio mapping
Environment Management Systems (ISO 14001) implementation and certification
Mainstreaming green products and practices
Innovative financing and modelling
Environment and social risks management
Climate finance literacy
31
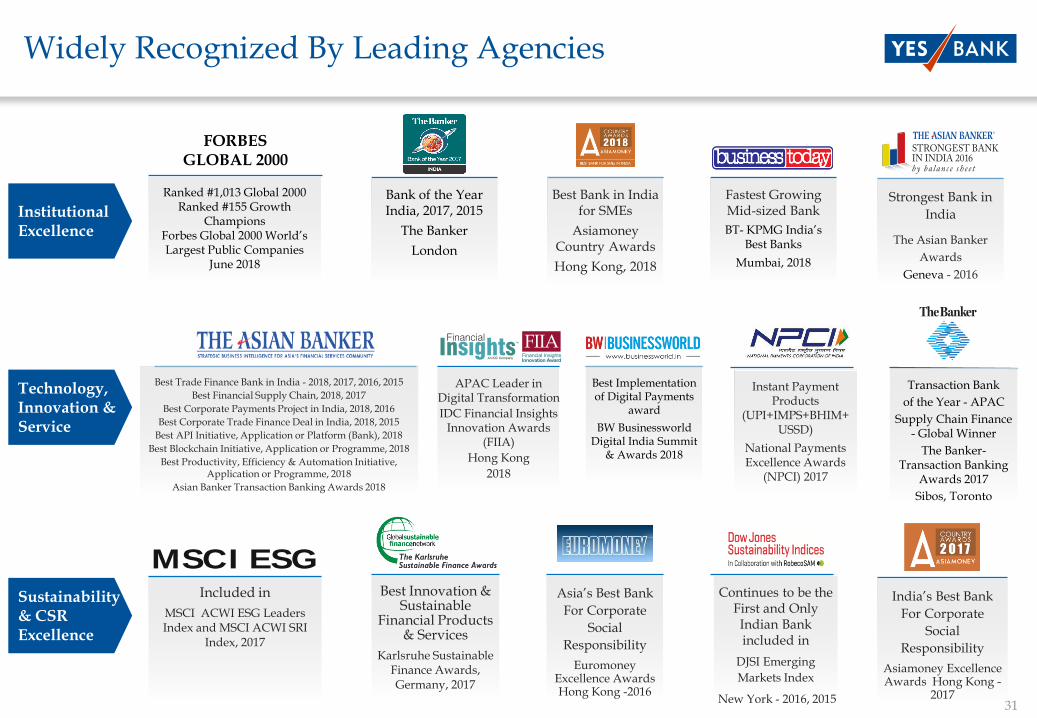
Widely Recognized By Leading Agencies
Transaction Bank
of the Year - APAC
Supply Chain Finance - Global Winner
The Banker-Transaction Banking
Awards 2017
Sibos, Toronto
Sustainability & CSR Excellence
Institutional Excellence
Technology, Innovation & Service
Strongest Bank in
India
The Asian Banker
Awards
Geneva - 2016
Included in
MSCI ACWI ESG Leaders Index and MSCI ACWI SRI
Index, 2017
MSCI ESG Best Innovation &
Sustainable Financial Products
& Services
Karlsruhe Sustainable Finance Awards, Germany, 2017
Asia’s Best Bank
For Corporate
Social
Responsibility
EuromoneyExcellence Awards Hong Kong -2016
Continues to be the First and Only Indian Bank included in
DJSI Emerging
Markets Index
New York - 2016, 2015
India’s Best Bank
For Corporate
Social
Responsibility
Asiamoney Excellence Awards Hong Kong -
2017
Best Trade Finance Bank in India - 2018, 2017, 2016, 2015
Best Financial Supply Chain, 2018, 2017
Best Corporate Payments Project in India, 2018, 2016
Best Corporate Trade Finance Deal in India, 2018, 2015
Best API Initiative, Application or Platform (Bank), 2018
Best Blockchain Initiative, Application or Programme, 2018
Best Productivity, Efficiency & Automation Initiative, Application or Programme, 2018
Asian Banker Transaction Banking Awards 2018
Fastest Growing Mid-sized Bank
BT- KPMG India’s Best Banks
Mumbai, 2018
Bank of the Year India, 2017, 2015
The Banker
London
Best Bank in India for SMEs
AsiamoneyCountry Awards
Hong Kong, 2018
Ranked #1,013 Global 2000Ranked #155 Growth
ChampionsForbes Global 2000 World’s Largest Public Companies
June 2018
FORBES GLOBAL 2000
Best Implementation of Digital Payments
award
BW BusinessworldDigital India Summit
& Awards 2018
Instant Payment Products
(UPI+IMPS+BHIM+USSD)
National Payments Excellence Awards
(NPCI) 2017
APAC Leader in Digital Transformation
IDC Financial Insights Innovation Awards
(FIIA)
Hong Kong
2018
32
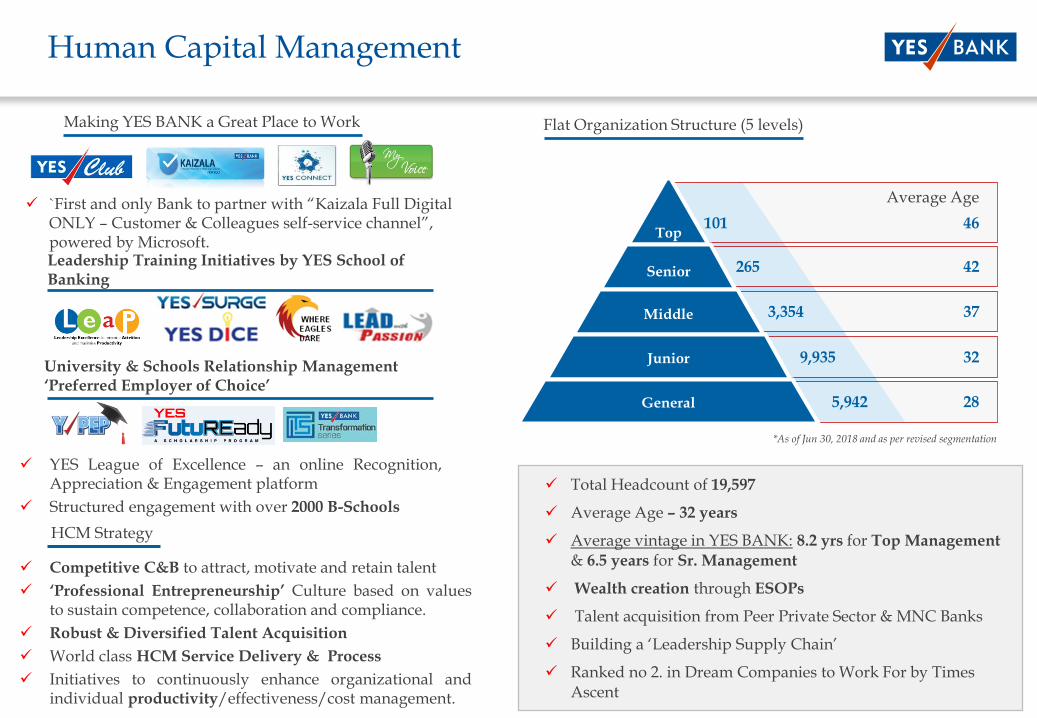
Human Capital Management
HCM Strategy
Making YES BANK a Great Place to Work Flat Organization Structure (5 levels)
✓ `First and only Bank to partner with “Kaizala Full Digital ONLY – Customer & Colleagues self-service channel”, powered by Microsoft. Leadership Training Initiatives by YES School of Banking
University & Schools Relationship Management‘Preferred Employer of Choice’
✓ YES League of Excellence – an online Recognition,Appreciation & Engagement platform
✓ Structured engagement with over 2000 B-Schools
✓ Competitive C&B to attract, motivate and retain talent
✓ ‘Professional Entrepreneurship’ Culture based on valuesto sustain competence, collaboration and compliance.
✓ Robust & Diversified Talent Acquisition
✓ World class HCM Service Delivery & Process
✓ Initiatives to continuously enhance organizational andindividual productivity/effectiveness/cost management.
✓ Total Headcount of 19,597
✓ Average Age – 32 years
✓ Average vintage in YES BANK: 8.2 yrs for Top Management
& 6.5 years for Sr. Management
✓ Wealth creation through ESOPs
✓ Talent acquisition from Peer Private Sector & MNC Banks
✓ Building a ‘Leadership Supply Chain’
✓ Ranked no 2. in Dream Companies to Work For by Times Ascent
*As of Jun 30, 2018 and as per revised segmentation
Top
Senior
Middle
Junior
General 28
32
42
37
46
Average Age
9,935
265
3,354
101
5,942
33
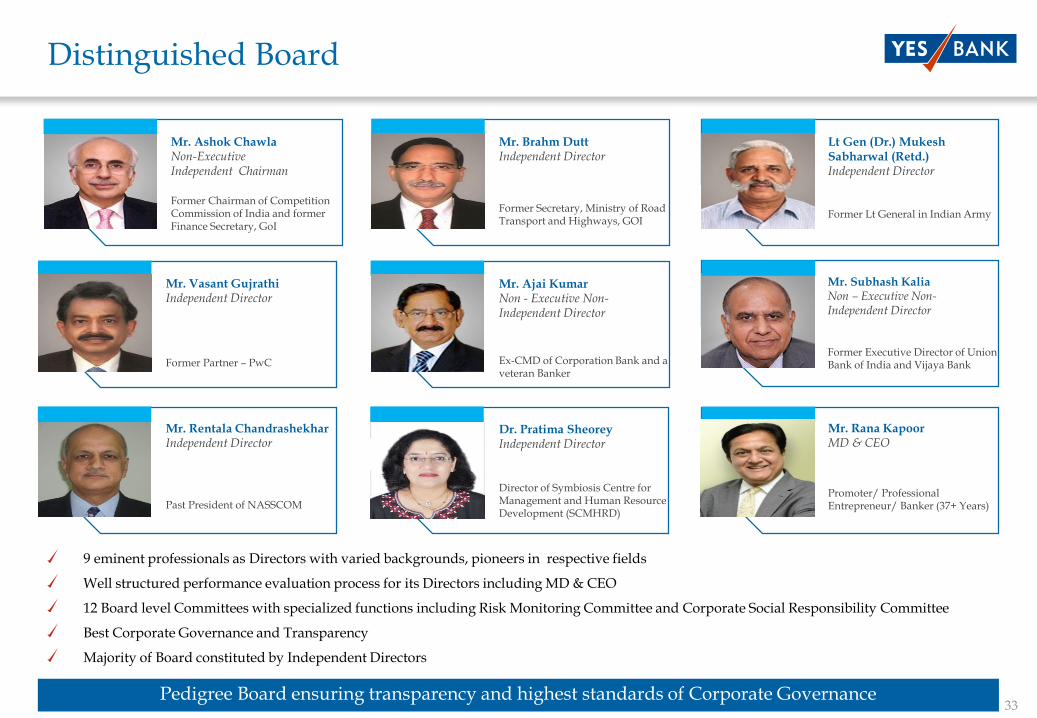
Distinguished Board
9 eminent professionals as Directors with varied backgrounds, pioneers in respective fields
Well structured performance evaluation process for its Directors including MD & CEO
12 Board level Committees with specialized functions including Risk Monitoring Committee and Corporate Social Responsibility Committee
Best Corporate Governance and Transparency
Majority of Board constituted by Independent Directors
Pedigree Board ensuring transparency and highest standards of Corporate Governance
Lt Gen (Dr.) MukeshSabharwal (Retd.)Independent Director
Former Lt General in Indian Army
Mr. Rana KapoorMD & CEO
Promoter/ Professional Entrepreneur/ Banker (37+ Years)
Mr. Subhash KaliaNon – Executive Non-Independent Director
Former Executive Director of Union Bank of India and Vijaya Bank
Mr. Ashok ChawlaNon-Executive Independent Chairman
Former Chairman of Competition Commission of India and former Finance Secretary, GoI
Mr. Rentala ChandrashekharIndependent Director
Past President of NASSCOM
Mr. Vasant GujrathiIndependent Director
Former Partner – PwC
Mr. Brahm DuttIndependent Director
Former Secretary, Ministry of Road Transport and Highways, GOI
Mr. Ajai KumarNon - Executive Non-Independent Director
Ex-CMD of Corporation Bank and a veteran Banker
Dr. Pratima SheoreyIndependent Director
Director of Symbiosis Centre for Management and Human Resource Development (SCMHRD)
No representation or warranty, express or implied is made as to, and no reliance should be placed on, the fairness, accuracy, completeness or correctness of such information or opinions
contained herein. The information contained in this presentation is only current as of its date. Certain statements made in this presentation may not be based on historical information or
facts and may be “forward looking statements”, including those relating to the Company’s general business plans and strategy, its future financial condition and growth prospects, and
future developments in its industry and its competitive and regulatory environment. Actual results may differ materially from these forward-looking statements due to a number of
factors, including future changes or developments in the Company’s business, its competitive environment and political, economic, legal and social conditions in India. This
communication is for general information purpose only, without regard to specific objectives, financial situations and needs of any particular person. This presentation does not
constitute an offer or invitation to purchase or subscribe for any shares in the Company and neither any part of it shall form the basis of or be relied upon in connection with any contract
or commitment whatsoever. The Company may alter, modify or otherwise change in any manner the content of this presentation, without obligation to notify any person of such revision
or changes. This presentation can not be copied and/or disseminated in any manner.Thank you

ANNEXURES

36
Key Financial Parameters
* Including profit & excluding prorated Dividend
Profit & Loss
` Million Q1FY19 Q1FY19Growth %
(y-o-y)Q4FY18
Growth %(q-o-q)
Net Interest Income 22,191 18,089 22.7% 21,542 3.0%
Non Interest Income 16,941 11,322 49.6% 14,210 19.2%
Total Net Income 39,133 29,411 33.1% 35,752 9.5%
Operating Expense 14,586 14,398 17.9% 12,061 1.3%
Operating Profit 24,547 17,042 44.0% 21,354 15.0%
Provisions & Contingencies 6,257 2,858 118.9% 3,996 56.6%
Profit After Tax 12,604 9,655 30.5% 11,794 6.9%
Balance Sheet
` Million Jun ‘’18 Jun, 2017 Growth Mar,2018 Growth
Y-o-Y Q-o-Q
Assets 3,325,493 2,221,452 49.7% 3,124,456 6.4%
Advances 2,147,201 1,399,718 53.4% 2,035,339 5.5%
Investments 829,532 521,362 59.1% 683,989 21.3%
Liabilities 3,325,493 2,221,452 49.7% 3,124,456 6.4%
Shareholders’ Funds 2,63,139 223,874 17.5% 257,583 2.2%
Total Capital Funds 469,837 325,413 44.4% 469,757 0.0%
Borrowings 787,902 383,021 105.7% 748,936 5.2%
Deposits 2,133,945 1,502,409 42.0% 2,007,381 6.3%
CASA 749,300 552,151 35.7% 731,762 2.4%