MyostatinInducesInsulinResistanceviaCasitasB-Lineage ... · investigation by the Nanyang...
19
Myostatin Induces Insulin Resistance via Casitas B-Lineage Lymphoma b (Cblb)-mediated Degradation of Insulin Receptor Substrate 1 (IRS1) Protein in Response to High Calorie Diet Intake * Received for publication, October 28, 2013, and in revised form, January 16, 2014 Published, JBC Papers in Press, January 22, 2014, DOI 10.1074/jbc.M113.529925 Sabeera Bonala ‡1 , Sudarsanareddy Lokireddy ‡§1,2 , Craig McFarlane § , Sreekanth Patnam ‡ , Mridula Sharma ¶ , and Ravi Kambadur ‡§3 From the ‡ School of Biological Sciences, Nanyang Technological University, Singapore 637551, § Singapore Institute for Clinical Sciences (A*STAR), Brenner Centre for Molecular Medicine, 30 Medical Drive, Singapore 117609, and ¶ Department of Biochemistry, YLL School of Medicine, National University of Singapore, Singapore 117597 Background: Excess nutrient intake and elevated levels of Mstn are both associated with the development of insulin resistance. Results: High calorie diet increases Mstn levels. Mstn induces insulin resistance through Cblb. Conclusion: Mstn promotes insulin resistance via Cblb-mediated degradation of IRS1 in response to energy dense diets. Significance: Inhibition of Mstn is a potential therapeutic to combat insulin resistance and T2D. To date a plethora of evidence has clearly demonstrated that continued high calorie intake leads to insulin resistance and type-2 diabetes with or without obesity. However, the necessary signals that initiate insulin resistance during high calorie intake remain largely unknown. Our results here show that in response to a regi- men of high fat or high glucose diets, Mstn levels were induced in muscle and liver of mice. High glucose- or fat- mediated induction of Mstn was controlled at the level of transcription, as highly con- served carbohydrate response and sterol-responsive (E-box) ele- ments were present in the Mstn promoter and were revealed to be critical for ChREBP (carbohydrate-responsive element-binding protein) or SREBP1c (sterol regulatory element-binding protein 1c) regulation of Mstn expression. Further molecular analysis sug- gested that the increased Mstn levels (due to high glucose or fatty acid loading) resulted in increased expression of Cblb in a Smad3- dependent manner. Casitas B-lineage lymphoma b (Cblb) is an ubiquitin E3 ligase that has been shown to specifically degrade insulin receptor substrate 1 (IRS1) protein. Consistent with this, our results revealed that elevated Mstn levels specifically up-regu- lated Cblb, resulting in enhanced ubiquitin proteasome-mediated degradation of IRS1. In addition, over expression or knock down of Cblb had a major impact on IRS1 and pAkt levels in the presence or absence of insulin. Collectively, these observations strongly suggest that increased glucose levels and high fat diet, both, result in increased circulatory Mstn levels. The increased Mstn in turn is a potent inducer of insulin resistance by degrading IRS1 protein via the E3 ligase, Cblb, in a Smad3-dependent manner. A number of studies on mice have been performed to under- stand the effect of dietary fats, sugars, and proteins on the eti- ology of obesity and type-2 diabetes (T2D) 4 (1–3). These find- ings indicate that high nutrient intake increases the risk of obesity and T2D. Insulin resistance in skeletal muscle is a key phenotype associated with obesity and T2D for which the molecular mediators remain unclear. Insulin resistance is seen independent of obesity and as a strong predictor of develop- ment of T2D. To date very little information is known about the factors and signaling events that are activated in response to high calorie diets, which in turn promote the development of insulin resistance in skeletal muscle. Myostatin (Mstn) is a TGF- superfamily member and a lack of Mstn increases lean muscle mass. Recent studies have reported increased Mstn expression in both muscle and adi- pose tissues derived from obese leptin-deficient (ob/ob) mice (4). In addition, increased secretion and expression of Mstn has been observed in plasma and skeletal muscle of obese women (5). Furthermore, higher levels of Mstn mRNA expression were observed in T2D individuals (6). Consistent with this, studies have reported increased Mstn expression during streptozoto- cin-induced type-1 diabetes (7). Taken together, these studies clearly demonstrate that during pathological conditions such as obesity, type-1 and type-2 diabetes Mstn expression is high in both circulation and in peripheral tissues including skeletal muscle and adipose tissues. However, to date it is not well iden- tified what signaling events trigger the up-regulation of Mstn. Previous studies have revealed that MyoD and glucocorticoids can up-regulate Mstn at the transcriptional level in skeletal * This work was supported by the Agency for Science, Technology, and Research (A*STAR) and National Research Foundation, Singapore. 1 Both authors contributed equally to this work. 2 Present address: Dept. of Cell Biology, Harvard Medical School, Boston, MA 02115. 3 To whom correspondence should be addressed: School of Biological Sci- ences, 60 Nanyang Dr., Nanyang Technological University, Singapore 637551. Tel.: 65-6513-8043; E-mail: [email protected]. 4 The abbreviations used are: T2D, type-2 diabetes; Mstn, myostatin; SREBP1c, sterol regulatory element-binding protein 1c; ChREBP, carbohydrate-re- sponsive element-binding protein; ChoRE, carbohydrate response ele- ment; BW, body weight; IB, immunoblotting; IP, immunoprecipitation; PA palmitate; GTT, glucose tolerance test; ITT, insulin tolerance test; HFD, high fat diet; Cblb, Casitas B-lineage lymphoma b; NE, nuclear extract; CD, chow diet; CE, cytoplasmic extract; IRS1, insulin receptor substrate 1. THE JOURNAL OF BIOLOGICAL CHEMISTRY VOL. 289, NO. 11, pp. 7654 –7670, March 14, 2014 © 2014 by The American Society for Biochemistry and Molecular Biology, Inc. Published in the U.S.A. 7654 JOURNAL OF BIOLOGICAL CHEMISTRY VOLUME 289 • NUMBER 11 • MARCH 14, 2014 This article has been withdrawn by the authors. In this article, we reported a mechanism through which myostatin induces insulin resistance. After a thorough investigation by the Nanyang Technological University in Singapore, data falsifications were found in some of the in vitro laboratory studies, which invalidate the results reported. Thus, the co-authors wish to withdraw this publication and offer our sincere apologies to all those investigators who may have been affected and misled by this. by guest on May 23, 2020 http://www.jbc.org/ Downloaded from
Transcript of MyostatinInducesInsulinResistanceviaCasitasB-Lineage ... · investigation by the Nanyang...

Myostatin Induces Insulin Resistance via Casitas B-LineageLymphoma b (Cblb)-mediated Degradation of InsulinReceptor Substrate 1 (IRS1) Protein in Response to HighCalorie Diet Intake*
Received for publication, October 28, 2013, and in revised form, January 16, 2014 Published, JBC Papers in Press, January 22, 2014, DOI 10.1074/jbc.M113.529925
Sabeera Bonala‡1, Sudarsanareddy Lokireddy‡§1,2, Craig McFarlane§, Sreekanth Patnam‡, Mridula Sharma¶,and Ravi Kambadur‡§3
From the ‡School of Biological Sciences, Nanyang Technological University, Singapore 637551, §Singapore Institute for ClinicalSciences (A*STAR), Brenner Centre for Molecular Medicine, 30 Medical Drive, Singapore 117609, and ¶Department of Biochemistry,YLL School of Medicine, National University of Singapore, Singapore 117597
Background: Excess nutrient intake and elevated levels of Mstn are both associated with the development of insulinresistance.Results: High calorie diet increases Mstn levels. Mstn induces insulin resistance through Cblb.Conclusion: Mstn promotes insulin resistance via Cblb-mediated degradation of IRS1 in response to energy dense diets.Significance: Inhibition of Mstn is a potential therapeutic to combat insulin resistance and T2D.
To date a plethora of evidence has clearly demonstrated thatcontinued high calorie intake leads to insulin resistance and type-2diabetes with or without obesity. However, the necessary signalsthat initiate insulin resistance during high calorie intake remainlargely unknown. Our results here show that in response to a regi-men of high fat or high glucose diets, Mstn levels were induced inmuscle and liver of mice. High glucose- or fat- mediated inductionof Mstn was controlled at the level of transcription, as highly con-served carbohydrate response and sterol-responsive (E-box) ele-ments were present in the Mstn promoter and were revealed to becritical for ChREBP (carbohydrate-responsive element-bindingprotein) or SREBP1c (sterol regulatory element-binding protein1c) regulation of Mstn expression. Further molecular analysis sug-gested that the increased Mstn levels (due to high glucose or fattyacid loading) resulted in increased expression of Cblb in a Smad3-dependent manner. Casitas B-lineage lymphoma b (Cblb) is anubiquitin E3 ligase that has been shown to specifically degradeinsulin receptor substrate 1 (IRS1) protein. Consistent with this,our results revealed that elevated Mstn levels specifically up-regu-lated Cblb, resulting in enhanced ubiquitin proteasome-mediateddegradation of IRS1. In addition, over expression or knock down ofCblb had a major impact on IRS1 and pAkt levels in the presence orabsence of insulin. Collectively, these observations strongly suggestthat increased glucose levels and high fat diet, both, result inincreased circulatory Mstn levels. The increased Mstn in turn is apotent inducer of insulin resistance by degrading IRS1 protein viathe E3 ligase, Cblb, in a Smad3-dependent manner.
A number of studies on mice have been performed to under-stand the effect of dietary fats, sugars, and proteins on the eti-ology of obesity and type-2 diabetes (T2D)4 (1–3). These find-ings indicate that high nutrient intake increases the risk ofobesity and T2D. Insulin resistance in skeletal muscle is a keyphenotype associated with obesity and T2D for which themolecular mediators remain unclear. Insulin resistance is seenindependent of obesity and as a strong predictor of develop-ment of T2D. To date very little information is known about thefactors and signaling events that are activated in response tohigh calorie diets, which in turn promote the development ofinsulin resistance in skeletal muscle.
Myostatin (Mstn) is a TGF-� superfamily member and a lackof Mstn increases lean muscle mass. Recent studies havereported increased Mstn expression in both muscle and adi-pose tissues derived from obese leptin-deficient (ob/ob) mice(4). In addition, increased secretion and expression of Mstn hasbeen observed in plasma and skeletal muscle of obese women(5). Furthermore, higher levels of Mstn mRNA expression wereobserved in T2D individuals (6). Consistent with this, studieshave reported increased Mstn expression during streptozoto-cin-induced type-1 diabetes (7). Taken together, these studiesclearly demonstrate that during pathological conditions such asobesity, type-1 and type-2 diabetes Mstn expression is high inboth circulation and in peripheral tissues including skeletalmuscle and adipose tissues. However, to date it is not well iden-tified what signaling events trigger the up-regulation of Mstn.Previous studies have revealed that MyoD and glucocorticoidscan up-regulate Mstn at the transcriptional level in skeletal
* This work was supported by the Agency for Science, Technology, andResearch (A*STAR) and National Research Foundation, Singapore.
1 Both authors contributed equally to this work.2 Present address: Dept. of Cell Biology, Harvard Medical School, Boston, MA
02115.3 To whom correspondence should be addressed: School of Biological Sci-
ences, 60 Nanyang Dr., Nanyang Technological University, Singapore637551. Tel.: 65-6513-8043; E-mail: [email protected].
4 The abbreviations used are: T2D, type-2 diabetes; Mstn, myostatin; SREBP1c,sterol regulatory element-binding protein 1c; ChREBP, carbohydrate-re-sponsive element-binding protein; ChoRE, carbohydrate response ele-ment; BW, body weight; IB, immunoblotting; IP, immunoprecipitation; PApalmitate; GTT, glucose tolerance test; ITT, insulin tolerance test; HFD, highfat diet; Cblb, Casitas B-lineage lymphoma b; NE, nuclear extract; CD, chowdiet; CE, cytoplasmic extract; IRS1, insulin receptor substrate 1.
THE JOURNAL OF BIOLOGICAL CHEMISTRY VOL. 289, NO. 11, pp. 7654 –7670, March 14, 2014© 2014 by The American Society for Biochemistry and Molecular Biology, Inc. Published in the U.S.A.
7654 JOURNAL OF BIOLOGICAL CHEMISTRY VOLUME 289 • NUMBER 11 • MARCH 14, 2014
This article has been withdrawn by the authors. In this article, we reported a mechanism through which myostatin induces insulin resistance. After a thorough investigation by the Nanyang Technological University in Singapore, data falsifications were found in some of the in vitro laboratory studies, which invalidate the results reported. Thus, the co-authors wish to withdraw this publication and offer our sincere apologies to all those investigators who may have been affected and misled by this.
by guest on May 23, 2020
http://ww
w.jbc.org/
Dow
nloaded from

muscle (8, 9). Moreover, peroxisome proliferator-activatedreceptor-�, CCAAT/enhancer-binding protein-�, and sterolregulatory element-binding protein 1c (SREBP1c) have beenshown to increase Mstn promoter activity in 3T3L1 adipocytes(4). Furthermore nutrients like high protein diet or high glucosetreatment have been reported to increase Mstn expression (10,11). However, the mechanism(s) behind up-regulation of Mstnin response to high nutrients and, for that matter, the down-stream targets of Mstn that promote the development of insulinresistance remain poorly focused.
Casitas B-lineage lymphoma b (Cblb) is a RING-type E3ubiquitin ligase that belongs to the Cbl family of proteins, con-sisting of Cblb, c-Cbl, and Cbl-c. Cbl family proteins share aconserved N-terminal region containing a tyrosine kinase bind-ing domain and a RING-finger domain to facilitate E3 ubiquitinligase activity. In addition, the C-terminal regions of Cblb andc-Cbl have another domain termed a ubiquitin-associated(UBA) domain (12). Studies have reported that Cblb, Cbl-c,and c-Cbl proteins share commonalties in their mode of actionand target selection. The three Cbl family proteins have beenshown to down-regulate EGFR-mediated signaling (13–15).Interestingly, Cbl-and c-Cbl-deficient mice are protected fromhigh fat diet-induced adiposity and insulin resistance withimproved energy expenditure and improved insulin sensitivity(16 –18). Moreover, Cblb has been shown to be a highly corre-lated susceptibility gene for the development of type-1 diabetesboth in humans and rodents (19 –21). In addition, it has beenreported that Cblb can target insulin receptor substrate 1(IRS1) and reduce pAkt levels during skeletal muscle atrophy(22). However, to date the role of Cblb in energy metabolism aswell as the development of skeletal muscle insulin resistance isnot fully understood.
Our results here show that in response to a regimen of highfat or high glucose, Mstn levels were induced in muscle andliver of mice. This induction is mediated at the level of tran-scription through carbohydrate-responsive element-bindingprotein (ChREBP) and SREBP1c binding to carbohydrateresponse (ChoRE) and sterol-responsive (E-box) elements,respectively, on the Mstn gene promoter. Furthermore, wepresent data to support that increased Mstn levels during highcalorie intake promotes the development of insulin resistancevia Smad3-mediated up-regulation of Cblb and subsequentdegradation of IRS1.
EXPERIMENTAL PROCEDURES
Animals—All wild type (WT) mice (C57BL/6) were pur-chased from Center for Animal Resources, National Universityof Singapore (NUS-CARE) Singapore. Mstn�/� mice, Cblb�/�,and WT mice were maintained at 20 °C with a 12-h light-darkcycle. All animal procedures were reviewed and approved bythe Institutional Animal Ethics Committee (IACUC), Singa-pore. 8 –10-week-old mice were used for all animal experi-ments. WT and Mstn�/� mice (n � 8) were fed either a high fatdiet (58V8, Test Diet, IN) or chow diet (58Y2, Test Diet, IN) for12 weeks. After the 12-week feeding regimen, mice were eutha-nized with CO2, and tissues were harvested for further analysis.The supplementation of glucose in WT and Mstn�/� mice (n �8) was performed as previously published (23). To study the
effect of excess Mstn on insulin resistance, C57BL/6J mice wererandomly grouped into two groups (n � 8) and either injectedwith 5 �g/kg body weight (BW) recombinant Mstn protein oran identical volume of saline subcutaneously 3 times a week for12 weeks. The recombinant Mstn protein (both human andmouse) was expressed and purified from Escherichia coli asdescribed previously (24). Gastrocnemius muscle and liver tis-sue were collected from all trial mice for subsequent molecularanalysis.
Cell Culture—Mouse C2C12 myoblasts (25) and human hep-atocellular carcinoma cells (HepG2) (26) were obtained fromAmerican Type Culture Collection (ATCC, Manassas, VA).C2C12 and HepG2 were maintained as previously described(27, 28). Human primary myoblasts (hMb15) (29, 30) weremaintained as previously described (24). Primary myoblast cul-tures were isolated from Cblb�/� mice, Smad3�/�, and fromMstn injected mice as previously described (31). Smad3 knock-down C2C12 myoblasts were generated in our laboratory andhave been previously reported (32). To induce differentiation,C2C12, human and Cblb�/� primary myoblasts were plated ata density of 25,000 cells/cm2 and grown in differentiationmedium consisting of DMEM containing 2% HS and 1% P/S(PS; Invitrogen). All cells were treated with recombinant Mstnprotein at a final concentration of 5 �g/ml for 24 h unless oth-erwise stated.
In Vitro Glucose and Palmitate Treatment—To generate thein vitro model of high glucose-induced insulin resistance,C2C12 myoblasts, 96-h-differentiated C2C12 myotubes, orHepG2 cells were treated with 2.5 mM (control), 10 or 25 mM
glucose as previously described (33, 34). To generate an in vitromodel of high fat-induced insulin resistance, C2C12 myoblasts,96-h differentiated C2C12 myotubes or HepG2 cells were sub-jected to palmitate loading as described previously (35, 36).Cells were treated with either glucose or palmitate for a periodof 24 h. Palmitate was purchased from Sigma (catalog #P9767).
Plasmids, Lentivirus, and Lentiviral-mediated Transduction—Generation and use of the 1.6-kb bovine Mstn promoter-re-porter vector construct has been previously reported (9). The0.9-kb Mstn promoter sequence was amplified using the follow-ing primers: forward (5�-GCT AGC ATG AGA AAC TGGCAA AGG AAG-3�) and reverse (5�-AAG CTT AGA CAACTT GCC ACA CCA G-3�). The amplified product was sub-cloned into the pGL3-basic (pGL3b) luciferase reporter vectorand verified by sequencing. FLAG tagged-ChREBP and HAtagged-Mlx� overexpression vectors were gifts of Prof. HowardC. Towle (Center for Diabetes research, University of Minne-sota, Minneapolis/St. Paul, MN) (37). The lentiviral packagingplasmid pCMV-dR8.2 dvpr (8455), envelope plasmid pCMV-VSVG (8454), and the FLAG-tagged SREBP1c overexpressionvector (ID 32017) were purchased from Addgene. TheChREBP-shRNA (catalog #RHS4533) vectors were pur-chased from Open Biosystems, Huntsville, AL 35806.SREBP1c-shRNA vectors were purchased from Origene (cat-alog #TG514167). The Cblb (hCblb)-specific overexpressinglentiviral particles (catalog #OHS5899-202619951) were pur-chased from Open Biosystems. Generation of ChREBP andSREBP1c shRNA lentiviral particles and lentiviral-mediated
Mechanism of Mstn-induced Insulin Resistance
MARCH 14, 2014 • VOLUME 289 • NUMBER 11 JOURNAL OF BIOLOGICAL CHEMISTRY 7655
by guest on May 23, 2020
http://ww
w.jbc.org/
Dow
nloaded from

transduction of myoblasts/myotubes was performed as previ-ously described (38).
Transfection and Luciferase Reporter Assays—Co-transfec-tion of plasmids into myoblasts using LF2000 has been previ-ously described (38). After transfection, myoblasts were subse-quently differentiated into myotubes for further analysis.Assessment of Mstn promoter-reporter (1.6 and 0.9 kb) activitywas performed as previously described (38).
Quantitative Real Time PCR and Primer Sequences—Tissueand whole cell RNA was extracted using TRIzol reagent as perthe manufacturer’s protocol (Invitrogen). Synthesis of cDNA,quantitative real time PCR, and subsequent data analysis wasperformed as previously described (31). The gene-specificprimers used in this manuscript are available upon request.
Protein Isolation, Immunoblotting (IB), and Immunoprecipi-tation (IP)—Protein isolation, quantification, gel electrophore-sis, and target protein detection were performed as previouslypublished (31). Co-immunoprecipitation analysis of Cblb andIRS1 interaction was performed as previously described (40).For the detection of ChREBP and SREBP-1c, nuclear and cyto-plasmic extracts were prepared using the NE-PER� Nuclearand Cytoplasmic Extraction kit from Thermo Fisher Scientific,Rockford, IL (catalog # 78833). The nuclear (50 �g) and cyto-plasmic (50 �g) proteins prepared from cells and tissues weresubjected to 10% SDS-PAGE. The details of the antibodies usedin this manuscript are available upon request.
Electrophoretic Mobility Shift Assay (EMSA)—Nuclear ex-tracts were prepared as described above. The 3� biotin-labeleddouble-stranded oligonucleotides, which contained the wildtype/mutated ChoRE sequences or putative SREBP1c interact-ing E-box sequences specific for the Mstn promoter, were com-mercially synthesized by Sigma. The sequences of the MstnChoRE probes used are as follows: wt-ChoRE (5�-AGA TCCCTG Cca ggt gTC TGC cct ctg GTC AAA ATG A (biotin)-3�and mut-ChoRE (5�-AGA TCC CTG CTC TGC cct ctg GTCAAA ATG A (biotin)-3�). The E-box sequences, which make upthe ChoRE in the Mstn promoter, are indicated in lowercase.The mut-ChoRE probe lacks the 5� most E-box sequence(CAGGTG). The sequences of Mstn E-box #1, #2, and #3 usedas probes are as follows: E-box #1, 5�-ATC CTG ACG Aca cttgTC TCC TCT AAG T-3�; E-box #2, 5�-TAT GAA GTA GTcaaa tgA ATC AGC TTG C-3�; E-box #3, 5�-AGA TCC CTG Ccaggt gTC TGC CCT CTG G-3�. The Mstn promoter-specificE-box sequences located within each probe are indicated inlowercase. All EMSA were performed using the LightshiftChemiluminescent EMSA kit (catalog #20148, Thermo FisherScientific) as per the manufacturer’s protocol. Briefly, myo-blasts were plated at a density of 15,000 cells/cm2. Cells were90% confluent at the time of extraction for nuclear extract prep-aration. Nuclear extracts were prepared, and final protein con-centration was measured and adjusted to 1 �g/�l with extrac-tion buffer for use in the gel shift assay. The ChoRE and E-boxcontaining oligos both unlabeled and labeled with 3� biotinwere diluted to 1 pmol/�l concentration before use. The sam-ples were prepared by adding 10� binding buffer, nuclearextract, and oligos (labeled and unlabeled). Following 30 min ofincubation at room temperature, loading dye was added to afinal concentration of 1�, and the samples were subjected to
PAGE, after which they were transferred to nylon membrane.The detection of specific interactions was performed using theLightShift Chemiluminescent EMSA kit as per the manufactur-er’s protocol.
Chromatin Immunoprecipitation (ChIP)—ChIP was per-formed using myoblasts transfected with the 1.6-kb bovineMstn promoter alone or together with FLAG-ChREBP andHA-Mlx� in the absence (2.5 mM) or presence of glucose (25mM). ChIP was also performed on C2C12 myoblasts transfectedwith the FLAG-SREBP1c construct and treated with or without0.25 mM palmitate (PA). ChIP was performed as described pre-viously (38). The sequences of the primers used to detect theMstn promoter-specific ChoRE element are forward (5�-AAAAAG CCC CAT TCT CTG CT-3�) and reverse (5�-TGC CCATTT TTC TGC TTC TC-3�). The sequences of the primersused to detect the Mstn promoter-specific E-box sequences are:E-box #1 forward (5�-ATA CTG CTT GGT GAC TTG TGA-3�) and reverse (5�-CAG GGA GTC CTG TAT ACT G-3�);E-box #2 forward (5�-AGA TCT GCA CTC CAA GTC TTAAAG GA-3�) and reverse (5�-GTT AAA ACC CTG TCT GTCACA AG-3�); E-box #3 forward (5�-ATA CTG CTT GGT GACTTG TGA-3�) and reverse (5�-CAG GGA GTC CTG TATATA CTG-3�); �-actin forward (5�-CCA GAA TGC AGG CCTAGT AA-3� and �-actin reverse (5�-CGA GAG AGA AAGCGA GAT TG-3�). The �-actin gene promoter was extractedfrom the Transcriptional Regulatory Element Database withpromoter ID 72793.
Insulin Stimulation—All in vitro insulin stimulation was car-ried out as follows. Cells were plated at a density 15,000 cell/cm2 and grown in DMEM. After 24 h, medium was removedand replaced with 2 ml of serum-free MEM-�, and cells wereincubated for 15 min at 37 °C, 5% CO2. After this the mediumwas removed, the fresh serum-free MEM-� was added (2 ml),and the cells were further incubated for 16 h at 37 °C, 5% CO2.After 16 h fasting in serum-free MEM-�, the cells were incu-bated in 1 ml of fresh serum-free-MEM-� without or withincreasing concentrations (0.001, 0.1, and 1 �M) of eitherbovine (Sigma; catalog #10516) or porcine (Sigma; catalog#I6634) insulin for 15 min at 37 °C, 5% CO2. After stimulation,cells lysates were collected for subsequent IB analysis.
Statistical Analysis—All variations were compared usingone-way analysis of variance and two-tailed Student’s t-tests.Comparisons between four different groups during high fat dietfeeding and in response to high glucose injection were calcu-lated using two-way analysis of variance with multiple compar-isons. Results were deemed statistically significant at p � 0.05.Data are presented as the mean � S.E. For statistical analysisGraphPad Prism Version 4 software was used.
RESULTS
Mstn Is Up-regulated upon High Glucose Treatment andHigh Fat Diet Feeding—Quantitative real time PCR and IB anal-ysis revealed that Mstn expression was significantly up-regu-lated in response to high glucose and palmitate treatment inC2C12 myotubes and HepG2 human hepatocytes (Fig. 1, A–D)when compared with control-treated cells. The increase inMstn due to high glucose was both time-and dose-dependent(Fig. 1A). In addition to elevated Mstn, high glucose and palmi-
Mechanism of Mstn-induced Insulin Resistance
7656 JOURNAL OF BIOLOGICAL CHEMISTRY VOLUME 289 • NUMBER 11 • MARCH 14, 2014
by guest on May 23, 2020
http://ww
w.jbc.org/
Dow
nloaded from

tate treatment led to reduced levels of pAkt, which is consistentwith impaired insulin signaling (Fig. 1, C and D). We next vali-dated these results in vivo. Upon 12 weeks of injections withhigh glucose, WT mice gained BW (Fig. 2A), exhibitedincreased fat pad weights (Fig. 2B) and increased liver weights(Fig. 2C), and developed insulin resistance, as measured by glu-cose tolerance testing (GTT) (Fig. 2G) and insulin tolerancetesting (ITT) (Fig. 2H). Similarly, WT mice gained significantBW, fat mass, and liver weight upon high fat diet (HFD) feeding(Fig. 2, D–F) and developed insulin resistance, as measured byGTT (Fig. 2I) and ITT (Fig. 2J). A list of the full biochemical datarelating to high glucose and HFD trials is provided in Table 1.Consistent with the in vitro experiments above (Fig. 1, A–D),molecular and biochemical analysis confirmed that treatingmice with either high glucose or HFD induces the expression of
Mstn (Fig. 1, E–H) concomitant with reduced pAkt levels (Fig.1, E and F). Although IB analysis confirmed increased Mstnlevels in skeletal muscle and liver in response to high glucose(Fig. 1E) or HFD (Fig. 1F), ELISA also revealed significantlyincreased Mstn levels in serum collected from high glucose (Fig.1G)- and HFD (Fig. 1H)-treated WT mice. These data demon-strate that nutrient-rich diets induce Mstn both in vitro and invivo.
ChREBP and SREBP1c Induce Mstn Expression in Response toHigh Glucose and Fatty Acid Loading, Respectively—Analysis ofthe Mstn gene promoter revealed the presence of a putativeChoRE (Fig. 3A, upper panel). Subsequent promoter-reporteranalysis revealed that the 1.6-kb Mstn upstream element wassufficient for robust activation by high glucose (Fig. 3A, lowerpanel). Partial deletion of the ChoRE element, however,
FIGURE 1. High glucose and palmitate loading increases Mstn expression in vitro and in vivo. Mstn mRNA expression in glucose (Glu)-treated (A) or inPA-treated (B) cells, normalized to GAPDH. Shown is IB analysis of Mstn, pAkt, and total Akt in glucose-treated (C) or in PA-treated (D) cells. Tubulin levels wereassessed to ensure equal loading. Shown is IB analysis of Mstn, pAkt, and total Akt protein levels in muscle (M) and liver (L) tissue from WT mice injected witheither saline or glucose (E) or in muscle (M) and liver (L) tissue from WT mice fed on CD or HFD (F). Tubulin levels were assessed to ensure equal loading (n � 4,for each group). All graphs display the mean � S.E. *, p � 0.05; **, p � 0.01, and ***, p � 0.001. G, ELISA of Mstn levels in serum from WT mice injected with eithersaline or glucose (n � 8, for each group). H, ELISA of Mstn levels in serum from WT mice fed either CD or HFD (n � 8 for each group).
Mechanism of Mstn-induced Insulin Resistance
MARCH 14, 2014 • VOLUME 289 • NUMBER 11 JOURNAL OF BIOLOGICAL CHEMISTRY 7657
by guest on May 23, 2020
http://ww
w.jbc.org/
Dow
nloaded from

resulted in a complete loss of Mstn promoter-reporter activityin response to high glucose (Fig. 3A, lower panel). ChREBP is awell characterized transcription factor that in response to glu-cose binds to ChoREs in target genes to regulate expression(41– 44). Consistent with this, we found increased ChREBPtranslocation into the nucleus upon high glucose treatment invitro (Fig. 3B, upper panel) and in muscle and liver tissues ofWT mice injected with high glucose (Fig. 3B, lower panel). Fur-thermore, EMSAs revealed enhanced dose-dependent interac-tion between nuclear extracts (NE) from high glucose treatedmyoblasts and the wild type ChoRE (wt-ChoRE) sequence
found in the Mstn promoter region (Fig. 3C, upper panel),which was ablated upon incubation with a probe containing amutated ChoRE sequence (mut-ChoRE) (Fig. 3C, lower panel).This shifted band could be competed out with unlabeled oligo(wt-un ChoRE), confirming the specificity of the protein-DNAcomplex (Fig. 3C, lower panel). In addition, overexpression ofChREBP and its obligatory partner Mlx� increased Mstnexpression (Fig. 3D) and Mstn promoter-reporter activity (Fig.3E), which was further enhanced upon treatment with highglucose. Consistent with this, knockdown of ChREBP expres-sion (Fig. 3, F and G) abolished glucose-mediated induction ofMstn promoter-reporter activity (Fig. 3H). Three independentChIP experiments further confirmed that ChREBP does indeedbind to the identified ChoRE within the Mstn promoter andthat this interaction was enhanced in response to high glucosetreatment (Fig. 3I).
Similar to high glucose, treatment with palmitate alsoincreased Mstn promoter-reporter activity (Fig. 4A). SREBP1chas been previously shown to regulate Mstn promoter activityin 3T3L1 cells (4). In agreement with this, we observed strongnuclear translocation of SREBP1c in cells treated with palmi-tate (Fig. 4B) and in muscle and liver tissues of WT mice fedwith HFD (Fig. 4C). Furthermore, overexpression of SREBP1cdramatically enhanced Mstn expression (Fig. 4D) and Mstn-promoter reporter activity (Fig. 4E), which was furtherenhanced upon treatment with palmitate. Consistent with this,knock down of SREBP1c expression (Fig. 4, F and G) blockedpalmitate-mediated induction of Mstn-promoter reporteractivity in muscle cells (Fig. 4H). It is well documented thatSREBP1c can bind to E-box motifs to regulate target gene acti-vation (45, 46). Analysis of the Mstn gene promoter revealed thepresence of five E-box motifs consisting of three different con-sensus E-box sequences (Fig. 4I). With this in mind we per-formed EMSA using the 3 different E-box sequences containedwithin the Mstn 1.6-kb promoter region on nuclear extractsfrom palmitate-treated hMb15 myoblasts. Results revealed thata specific band shift was seen upon incubation with labeledoligo containing Mstn E-box #1 sequence (5�-CACTTG-3�)(Fig. 4J), whereas no band shift was observed upon incubation
FIGURE 2. Physiological changes in WT mice during high glucose and highfat diet regimens. A, BW changes of mice injected with either high glucose orsaline for 12 weeks (n � 8 per group). B, epididymal (Epi), retroperitoneal(Retro), and inguinal (Ingu) white adipose tissue (WAT) weight changes, nor-malized as percentage BW in mice injected with either high glucose or saline(n � 8 per group). C, liver weight changes of mice injected with either highglucose or saline for 12 weeks (n � 8 per group). D, BW changes of mice fedeither CD or HFD for 12 weeks (n � 8 per group). E, epididymal, retroperito-neal, and inguinal WAT weight changes, normalized as percentage BW micefed either CD or HFD (n � 8 per group). F, liver weight changes of mice fedeither CD or HFD for 12 weeks (n � 8 per group). G, GTT on mice injected withhigh glucose or saline (n � 8 per group). H, ITT on mice injected with highglucose or saline (n � 8 per group). I, GTT performed on mice fed either CD orHFD (n � 8 per group). J, ITT performed on mice fed either CD or HFD (n � 8per group). All graphs display the mean � S.E. *, p � 0.05; **, p � 0.01; ***, p �0.001.
TABLE 1Changes in blood triglyceride, cholesterol, glucose, insulin, adiponec-tin, and leptin levels in WT mice during high glucose or HFDp values represent comparisons made between either saline-injected and glucose orCD-fed and HFD-fed mice. (n � 8 per group).
Measurements Saline Glucose Units
Plasma triglycerides 152 � 4.1 284.3 � 2.1a mg/dlPlasma adiponectin 10 � 1.2 16 � 2.0b ng/mlPlasma leptin 2.8 � 0.5 14 � 2.4a ng/mlBlood glucose 6 � 1.3 9 � 1.1b mmol/literPlasma insulin 137 � 6.0 352 � 4.0a ng/mlPlasma cholesterol 100 � 3.3 263 � 4.9c mg/dl
CD HFD Units
Plasma triglycerides 100 � 6.3 166 � 2.7b mg/dlPlasma adiponectin 11 � 1.5 20 � 3.2a ng/mlPlasma leptin 2 � 0.8 16 � 2.9a ng/mlBlood glucose 6 � 0.2 12.9 � 2.6b mmol/literPlasma insulin 112 � 6.8 232 � 5.2a pmol/literPlasma cholesterol 90 � 4.0 220 � 10.2a mg/dl
a p � 0.01.b p � 0.05.c p � 0.001.
Mechanism of Mstn-induced Insulin Resistance
7658 JOURNAL OF BIOLOGICAL CHEMISTRY VOLUME 289 • NUMBER 11 • MARCH 14, 2014
by guest on May 23, 2020
http://ww
w.jbc.org/
Dow
nloaded from

with labeled oligos containing either Mstn E-box #2 (5�-CAAATG-3�) or Mstn E-box #3 sequences (5�-CAGGTG-3�)(Fig. 4J). Moreover, we observed a super shift upon the additionof an anti-SREBP1c-specific antibody, confirming the SREBP1cinteraction with Mstn E-box #1 sequence (5�-CACTTG-3�) inthe Mstn promoter region (Fig. 4K). ChIP analysis further con-firmed that SREBP1c does indeed bind to the Mstn E-box #1sequence (5�-CACTTG-3�) of the Mstn promoter and that thisinteraction was enhanced in response to palmitate treatment(Fig. 4L).
Mstn Induces Degradation of IRS1 Protein by Activating theE3 Ligase Cblb—To find out the possible mechanisms throughwhich Mstn can induce insulin resistance, microarray was per-formed on Mstn-treated myotubes (Fig. 5A). The differentialgene expression changes observed in response to Mstn treat-ment are listed in Table 2 (up-regulated) and Table 3 (down-regulated). We identified that Cblb, a ubiquitin E3 ligase, wasup-regulated in response to Mstn treatment (Table 2). Interest-ingly, Cblb has been shown to degrade IRS1 protein duringmuscle atrophy and is linked with the development of type-1
FIGURE 3. The ChREBP transcription factor is critical for high glucose regulation of Mstn expression. A, schematic showing the homology of the consensusChoRE sequence between human (hMstn), bovine (bMstn), and mouse (mMstn) Mstn promoter sequences (upper panel), the 1. 6- and 0.9-kb Mstn promoter-reporter constructs (middle panel), and Mstn promoter-reporter luciferase activity in glucose (Glu)-treated C2C12 myotubes (bottom). B, upper panel, IB analysisof ChREBP protein levels in cytoplasmic extracts (CE) and NE prepared from cells treated with (�) or without (�) Glu and in CE and NE prepared from muscle(M) and liver (L) tissues of saline (�)- or high glucose (�)-injected mice (lower panel). C, top EMSA performed in the absence (-) or presence (�) of nuclear extracts(NE) from C2C12 myoblasts treated with glucose. Bottom, competition and mutation analysis of EMSA performed in the absence (�) or presence (�) of NE. D,IB analysis of ChREBP and Mstn in control, empty vector, or FLAG-ChREBP�Mlx�-transfected 96-h-differentiated C2C12 myotubes. E, Mstn promoter-reporterluciferase activity in C2C12 myotubes co-transfected with FLAG-ChREBP and HA-Mlx� constructs and treated with glucose. F, ChREBP mRNA expression inmyotubes infected with shChREBP or shCon expressing lentivirus normalized to GAPDH. G, IB analysis of ChREBP protein levels in CE and NE from myoblastsinfected with shChREBP or shCon expressing lentivirus. H, Mstn promoter-reporter luciferase activity in C2C12 myotubes infected with either shChREBP orshCon expressing lentivirus and treated with glucose. I, ChIP assay of ChREBP interaction with the Mstn promoter in C2C12 myoblasts co-transfected withFLAG-ChREBP and HA-Mlx� after treatment with (�) or without (�) glucose. ChREBP interaction with the �-actin gene promoter in the absence (�) or presence(�) of glucose was also performed as a negative control (lower panel). Input DNA is shown for all ChIP assays. The ChIP data are representative of threeindependent experiments. Tubulin levels were assessed to ensure equal loading in all IBs. All IB images and graphs are representative of at least twoindependent experiments. All luciferase activities were normalized to Renilla and expressed as -fold change relative to respective controls (A, E, and H). Allgraphs display the mean � S.E. of at least two independent experiments. *, p � 0.05; **, p � 0.01; ***, p � 0.001.
Mechanism of Mstn-induced Insulin Resistance
MARCH 14, 2014 • VOLUME 289 • NUMBER 11 JOURNAL OF BIOLOGICAL CHEMISTRY 7659
by guest on May 23, 2020
http://ww
w.jbc.org/
Dow
nloaded from

FIGURE 4. The SREBP1c transcription factor is critical for fatty acid regulation of Mstn expression. A, Mstn promoter-reporter luciferase activity inPA-treated C2C12 myotubes. Shown is IB analysis of SREBP1c protein levels in CE and NE prepared from cells treated with (�) or without (�) PA (B) and in CEand NE prepared from muscle (M) and liver (L) tissues of CD (�) or HFD (�) fed mice (C). D, IB analysis of SREBP1c and Mstn expression in control, empty vector,or FLAG-SREBP1c-transfected 96-h differentiated myotubes. E, Mstn promoter-reporter luciferase activity in C2C12 myoblasts transfected with either FLAG-SREBP1c or pCMV4 constructs and treated with PA. F, SREBP1c mRNA expression in myotubes infected with shSREBP1c or shCon expressing lentivirus. G, IBanalysis of SREBP1c protein levels in CE and NE from myoblasts infected with shSREBP1c or shCon expressing lentivirus. H, Mstn promoter-reporter luciferaseactivity in C2C12 myotubes infected with shSREBP1c or shCon expressing lentivirus and treated with PA. I, schematic showing the five different consensusE-box motifs identified in the Mstn promoter. Consensus E-box motifs are highlighted in red and underlined. J, EMSA performed in the absence (�) orpresence (�) of NE from PA-treated C2C12 myoblasts. K, EMSA performed in the absence (�) or presence (�) of NE from PA-treated C2C12 myoblast with(�) or without (�) an anti-SREBP1c antibody. L, ChIP assay of SREBP1c interaction with Mstn promoter in C2C12 myoblasts treatment with (�) or without(�) PA. SREBP1c interaction with the �-actin gene promoter in the absence (�) or presence (�) of PA was also performed as a negative control (lowerpanel). Input DNA is shown for all ChIP assays. The ChIP data are representative of three independent experiments. Tubulin levels were assessed toensure equal loading in all IBs. All IB images and graphs are representative of at least two independent experiments. All luciferase activities werenormalized to Renilla and are expressed as -fold change relative to respective controls (A, E, and H). All graphs display the mean � S.E. of at least twoindependent experiments. *, p � 0.05; **, p � 0.01.
Mechanism of Mstn-induced Insulin Resistance
7660 JOURNAL OF BIOLOGICAL CHEMISTRY VOLUME 289 • NUMBER 11 • MARCH 14, 2014
by guest on May 23, 2020
http://ww
w.jbc.org/
Dow
nloaded from

diabetes in rats and in humans (19 –22, 47). However, to datethe role of Cblb in the development of insulin resistanceremains unknown. Hence we considered Cblb as a valid candi-date gene through which Mstn may regulate insulin sensitivity.Cblb expression was validated through quantitative real timePCR and IB analysis, and our results revealed that Mstn treat-ment significantly increased Cblb mRNA levels in C2C12 myo-tubes and HepG2 cells (Fig. 5B, upper panel). The increasedlevels of Cblb were associated with reduced IRS1 and pAkt pro-tein levels in the presence of Mstn in C2C12 myotubes andHepG2 cells (Fig. 5B, lower panel). Consistent with this, siRNA-mediated knock down of Mstn in C2C12 myotubes and HepG2cells resulted in a significant reduction in Mstn expression con-comitant with low levels of Cblb and increased IRS1 and pAktlevels (Fig. 5C, upper panel). Furthermore, muscle and livertissues isolated from Mstn�/� mice also had low Cblb expres-sion as well as increased levels of IRS1 and pAkt (Fig. 5C, lower
panel), suggesting that Mstn is a potent regulator of Cblb acti-vation. Importantly, co-IP studies revealed enhanced associa-tion of IRS1 with Cblb (Fig. 5D) as well as increased ubiquitina-tion (Ub) of IRS1 upon Mstn treatment of myotubes (Fig. 5D).In agreement with this, blockade of the ubiquitin-proteasomepathway through treatment with the proteasome inhibitorMG132 prevented Mstn-mediated loss of IRS1 (Fig. 5E). Takentogether these data confirm that loss of IRS1 in response toincreased Mstn is ubiquitin proteasome pathway-dependent.
Cblb Expression Is Essential for Mstn-induced InsulinResistance—We next treated mice with Mstn, and GTT andITT confirmed that Mstn-treated WT mice developed insulinresistance (Fig. 6, A and B). Mstn treatment resulted inincreased BW (Fig. 6C) with significantly increased epididymalfat mass (Fig. 6D) and reduced tibialis anterior and quadricepsmuscle weights (Fig. 6E) despite normal comparable foodintake between the groups (Fig. 6F). A list of the full biochem-
FIGURE 5. Mstn up-regulates Cblb, an ubiquitin E3 ligase in skeletal muscle. A, heat map representation of gene expression changes in 96-h differentiatedmyotubes treated with Mstn at different time points. B, Cblb mRNA expression in control and Mstn-treated cells normalized to GAPDH (upper panel). IB analysisof Cblb, IRS1, pAkt, and total Akt in cells treated with (�) or without (�) Mstn (lower panel) is shown. C, IB analysis of Mstn, Cblb, IRS1, pAkt, and total Akt in cellstransfected with (�) or without (�) Mstn siRNA (upper panel) is shown. IB analysis of Cblb, IRS1, pAkt, and total Akt in muscle and liver tissues derived from WTand Mstn�/� mice (lower panel) is shown. D, top, IB analysis of IRS1 protein immunoprecipitated with Cblb in C2C12 myotubes treated with (�) or without (�)Mstn. Bottom, IB analysis of ubiquitinated IRS1 protein levels in C2C12 myotubes treated with (�) or without (�) Mstn. E, IB analysis of IRS1 protein levels inC2C12 myotubes treated with (�) or without (�) Mstn in the presence (�) or absence (�) of the proteasome inhibitor MG132. The graph shows densitometricanalysis for IRS1 protein in arbitrary units (A.U). Tubulin levels were assessed in all IBs to ensure equal loading. All IB images and graphs are representative of atleast two independent experiments. All graphs display the mean � S.E. *, p � 0.05.
Mechanism of Mstn-induced Insulin Resistance
MARCH 14, 2014 • VOLUME 289 • NUMBER 11 JOURNAL OF BIOLOGICAL CHEMISTRY 7661
by guest on May 23, 2020
http://ww
w.jbc.org/
Dow
nloaded from

ical data relating to circulatory triglycerides, adiponectin, lep-tin, total cholesterol, and insulin levels in saline- and Mstn-treated mice is provided in Table 4. Treatment with excessMstn resulted in elevated Cblb levels in skeletal muscle andliver tissues (Fig. 6, G and H), which was associated withreduced IRS1 and pAkt protein levels (Fig. 6, G and H). Primarymyoblasts cultures established from Mstn-injected mice alsoexpressed higher levels of Cblb with reduced IRS1 and pAkt(Fig. 6I). Furthermore, insulin-mediated phosphorylation ofAkt was impaired in these myoblasts. To further confirm therole of Cblb in Mstn-induced insulin resistance, primary myo-tubes from Cblb�/� mice were challenged with Mstn. Theabsence of Cblb resulted in a rescue of Mstn-mediated degra-
dation of IRS1 and loss of pAkt (Fig. 6J). Moreover, the absenceof Cblb prevented the enhanced ubiquitination of IRS1observed after treatment with Mstn (Fig. 6K). Collectively,these data reveal that increased Mstn induces insulin resistancethrough a mechanism involving Cblb-mediated loss of IRS1protein.
Mstn Signal through Smad3 to Regulate Cblb Expression—Mstn has been previously shown to signal through Smad3 toelicit biological function (24). Consistent with this, in silicoanalysis revealed the presence of several putative Smad3 bind-ing motifs in the Cblb promoter region (Fig. 7A). To testwhether Smad3 is important in Mstn regulation of Cblb, weinitially assessed the levels of active phosphorylated Smad3 in
TABLE 2List of genes up-regulated in Mstn-treated myotubes compared to control treated myotubes at all time points in the microarrayGene accession numbers, gene symbols, complete gene names, and -fold change are given.
GenBankTM
accessionGene
symbol Description-Fold change of genes listed (p < 0.05)
2 h 4 h 8 h 12 h 24 h
NM_178886 Ldlrad3 Low density lipoprotein receptor class A domain containing 3 1.62 5.15 6.33 4.58 1.80NM_198612 Glt8d4 Glycosyltransferase 8 domain containing 4 1.12 3.24 3.75 4.19 4.05NM_199011 Dgkq Diacylglycerol kinase, � 1.07 1.37 2.92 3.63 3.47NM_175475 Cyp26b1 Cytochrome P450, family 26, subfamily b, polypeptide 1 1.54 2.31 2.64 2.45 3.03NM_173784 Ubtd2 Ubiquitin domain containing 2 1.28 1.41 2.30 4.87 6.44NM_134072 Akr1c14 Aldo-keto reductase family 1, member C14 1.24 1.38 1.56 2.63 3.07NM_080555 Ppap2b Phosphatidic acid phosphatase type 2B 2.79 2.01 3.35 5.18 9.99NM_030612 Nfkbiz Nuclear factor of � light polypeptide gene enhancer in B-cells inhibitor, � 1.08 2.00 3.70 2.84 2.68NM_029415 Slc10a6 Solute carrier family 10 (sodium/bile acid cotransporter family), member 6 1.13 3.03 4.56 3.42 2.76NM_025367 Sphk1 Sphingosine kinase 1 (Sphk1), transcript variant 2 1.29 2.36 1.87 1.80 2.15NM_024406 Fabp4 Fatty acid-binding protein 4, adipocyte 1.03 1.10 1.97 2.06 2.99NM_024406 Fabp4 Fatty acid-binding protein 4, adipocyte 1.27 1.52 2.07 2.25 2.30NM_021894 Capn12 Calpain 12 1.07 1.38 2.07 2.29 3.63NM_021398 Slc43a3 Solute carrier family 43, member 3 1.45 2.42 1.42 1.56 4.69NM_020581 Angptl4 Angiopoietin-like 4 1.52 2.41 1.77 2.48 2.08NM_019804 B4galt4 UDP-Gal:�GlcNAc �-1,4-galactosyltransferase, polypeptide 4 1.47 2.78 7.69 9.41 11.07NM_017373 Nfil3 Nuclear factor, interleukin 3, regulated 1.15 1.36 1.26 2.11 4.26NM_013743 Pdk4 Pyruvate dehydrogenase kinase, isoenzyme 4 8.62 140.13 193.28 176.22 163.74NM_013526 Gdf6 Growth differentiation factor 6 1.15 1.21 1.55 2.20 2.60NM_013495 Cpt1a Carnitine palmitoyltransferase 1a, liver (Cpt1a), nuclear gene encoding
mitochondrial protein1.15 1.49 1.74 2.03 2.01
NM_013454 Abca1 ATP-binding cassette, subfamily A (ABC1), member 1 1.27 1.32 2.02 2.97 1.98NM_011867 Slc26a4 Solute carrier family 26, member 4 1.13 1.15 2.01 2.67 2.85NM_011158 Prkar2b Protein kinase, cAMP-dependent regulatory, type II � 1.14 1.70 3.10 1.69 2.96NM_010907 Nfkbia Nuclear factor of � light polypeptide gene enhancer in B-cells inhibitor, � 1.35 1.33 1.96 4.08 5.30NM_010283 Ggta1 Glycoprotein galactosyltransferase �1,3 2.85 17.19 10.41 8.58 5.09NM_010207 Fgfr2 Fibroblast growth factor receptor 2 (Fgfr2), transcript variant 1 2.86 12.99 8.10 6.18 3.70NM_009994 Cyp1b1 Cytochrome P450, family 1, subfamily b, polypeptide 1 1.12 2.81 7.16 4.79 1.83NM_009644 Ahrr Aryl-hydrocarbon receptor repressor 1.10 3.58 3.84 3.62 3.73NM_009579 Slc30a1 Solute carrier family 30 (zinc transporter), member 1 2.12 2.23 3.41 4.35 3.54NM_009579 Slc30a1 Solute carrier family 30 (zinc transporter), member 1 1.07 1.73 4.10 6.43 7.18NM_009200 Slc1a6 Solute carrier family 1 (high affinity aspartate/glutamate transporter),
member 61.88 4.70 3.33 2.52 2.96
NM_008979 Ptpn22 Protein-tyrosine phosphatase, non-receptor type 22 1.23 1.19 1.84 2.75 2.16NM_008875 Pld1 Phospholipase D1 2.27 4.72 11.15 10.40 68.83NM_008706 Nqo1 NAD(P)H dehydrogenase, quinone 1 1.10 2.31 1.97 1.81 3.51NM_008696 Map4k4 Mitogen-activated protein kinase kinase kinase kinase 4 1.04 1.48 2.14 2.66 2.43NM_008687 Nfib Nuclear factor I/B (Nfib), transcript variant 3, 1.28 2.64 3.96 4.16 3.63NM_008630 Mt2 Metallothionein 2 1.01 3.97 1.54 1.88 2.61NM_008509 Lpl Lipoprotein lipase 2.35 1.73 1.52 2.16 1.52NM_007558 Bmp8a Bone morphogenetic protein 8a 1.05 1.13 2.17 2.75 2.83NM_007554 Bmp4 Bone morphogenetic protein 4 1.88 2.14 4.70 2.59 1.09NM_007416 Adra1b Adrenergic receptor, �1b 1.14 1.17 1.21 2.33 3.60NM_001081349 Slc43a1 Solute carrier family 43, member 1 1.55 1.69 1.44 13.50 2.80NM_001077495 Pik3r1 Phosphatidylinositol 3-kinase, regulatory subunit, polypeptide 1 2.03 3.98 11.94 23.58 34.44NM_001077495 Pik3r1 Phosphatidylinositol 3-kinase, regulatory subunit, polypeptide 1 3.49 4.96 16.84 31.09 41.17NM_001033453 Ppm2c Protein phosphatase 2C, magnesium-dependent, catalytic subunit 4.23 8.62 6.36 4.21 2.33NM_001033167 Slc22a23 Solute carrier family 22, member 23 40.09 83.10 122.77 117.08 232.97NM_001033167 Slc22a23 Solute carrier family 22, member 23 23.46 2.85 2.29 1.95 1.89NM_001008533 Adora1 Adenosine A1 receptor (Adora1), transcript variant 1, mRNA 1.25 1.78 1.92 2.42 2.40BC096542 Nfib Nuclear factor I/B (Nfib), transcript variant 1 1.51 2.06 2.45 2.24 4.95BC083148 Rpl13 Ribosomal protein L13 3.77 4.78 3.57 3.77 2.57BC057074 Sod1 Superoxide dismutase 1, soluble 1.05 1.48 3.19 4.46 1.70AK082774 UDP-N-acetyl-�-D-galactosamine:polypeptide
N-acetylgalactosaminyltransferase 101.18 1.61 2.19 2.02 1.60
AK045005 Cblb Casitas B-lineage lymphoma proto-oncogene B 1.03 1.33 1.80 2.27 2.80AF169286 Ptplb Protein-tyrosine phosphatase-like protein PTPLB 2.39 1.70 3.18 3.40 3.63
Mechanism of Mstn-induced Insulin Resistance
7662 JOURNAL OF BIOLOGICAL CHEMISTRY VOLUME 289 • NUMBER 11 • MARCH 14, 2014
by guest on May 23, 2020
http://ww
w.jbc.org/
Dow
nloaded from

response to high glucose (Fig. 7B) and HFD regimen (Fig. 7C).Consistent with elevated Mstn levels (Fig. 1, A–H) the abun-dance of phosphorylated Smad3 was increased in response toboth high glucose (Fig. 7B) and HFD regimen in vivo (Fig. 7C).Furthermore, treatment with Mstn failed to up-regulate CblbmRNA expression (Fig. 7, D and F) or protein levels (Fig. 7, Eand G) in both Smad3 knock down myotubes (Fig. 7, D and E)and in primary myoblasts isolated from Smad3�/� mice (Fig. 7,F and G) when compared with respective controls. In addition,Mstn-mediated loss of IRS1 and pAkt levels was also rescued inboth Smad3 knock down myotubes and in primary myoblastsisolated from Smad3�/� mice when compared with respectivecontrols (Fig. 7, E and G). Taken together these data suggestthat Smad3 has an indispensible role in Mstn-mediated activa-tion of Cblb at the transcript level.
Glucose and Fatty Acids Require Mstn-Cblb Signaling to Pro-mote Insulin Resistance—To ascertain whether or not theMstn-Cblb pathway plays a role in the development of insulinresistance in response to high glucose and HFD regimen, wenext assessed the expression of Cblb, IRS1, and pAkt in highglucose- and palmitate-treated C2C12 myotubes and HepG2cells in the presence or absence of Mstn. In agreement with theelevated Mstn levels detected in response to in vitro treatmentwith high glucose or palmitate (Fig. 1, A–D), we also notedincreased levels of Cblb and reduced IRS1 and pAkt levels inC2C12 myotubes and HepG2 cells after treatment with highglucose (Fig. 8A) and palmitate (Fig. 8C). However,siRNA-mediated knock down of Mstn in C2C12 myotubesand HepG2 cells treated with high glucose (Fig. 8B) or palmi-tate (Fig. 8D) led to reduced Cblb levels, concomitant with a
TABLE 3List of genes down-regulated in Mstn-treated myotubes compared to control treated myotubes at all time points in the microarrayGene accession numbers, gene symbols, complete gene names, and -fold change are given.
GenBankTM
accessionGene
symbol Description-Fold change of genes listed (p < 0.05)
2 h 4 h 8 h 12 h 24 h
NM_021041 Abcc9 ATP-binding cassette, sub-family C (CFTR/MRP), member 9 2.36 1.87 1.42 2.32 3.31NM_133904 Acacb Acetyl-coenzyme A carboxylase � 16.19 24.00 61.30 87.87 79.24NM_144823 Acsl6 Acyl-CoA synthetase long-chain family member 6 1.19 1.07 1.72 4.27 8.29NM_130863 Adrbk1 Adrenergic receptor kinase, � 1 1.05 1.24 1.14 2.03 2.09NM_013464 Ahr Aryl-hydrocarbon receptor 1.07 1.38 3.34 2.73 4.32NM_009647 Ak3l1 Adenylate kinase 3-like 1 (Ak3l1), nuclear gene encoding mitochondrial
protein1.71 2.23 4.64 4.45 3.38
NM_054080 Akr1c20 Aldo-keto reductase family 1, member C20 42.40 7.04 25.71 37.24 2.40NM_001033303 Ampd1 Adenosine monophosphate deaminase 1 (isoform M) 1.51 1.21 1.59 3.16 5.16NM_033264 Arpp21 Cyclic AMP-regulated phosphoprotein, 21 1.09 1.08 1.86 2.83 4.89NM_009710 Art1 ADP-ribosyltransferase 1 1.18 1.05 2.38 5.18 5.03NM_175650 Atp13a5 ATPase type 13A5 1.33 1.10 1.75 2.57 11.95NM_144900 Atp1a1 ATPase, Na�/K� transporting, �1 polypeptide 1.18 1.40 2.18 1.83 3.07NM_033149 B3galt5 UDP-Gal:�GlcNAc � 1,3-galactosyltransferase, polypeptide 5 1.29 1.21 1.86 3.02 2.85NM_198611 B3gnt4 UDP-GlcNAc:�Gal �-1,3-N-acetylglucosaminyltransferase 4 1.32 1.53 2.05 2.98 2.73NM_028055 Btbd17 BTB (POZ) domain containing 17 1.03 1.42 4.67 11.14 18.51BC048957 Dgkd Diacylglycerol kinase, , (cDNA clone IMAGE:6490713), complete cds. 1.11 1.04 1.24 2.19 2.59NM_010050 Dio2 Deiodinase, iodothyronine, type II 1.38 1.29 1.86 3.00 5.36NM_013509 Eno2 Enolase 2, � neuronal 1.06 2.15 2.76 1.66 1.46NM_021272 Fabp7 Fatty acid-binding protein 7, brain 1.10 1.05 2.19 5.24 1.01NM_001001160 Fbxo41 F-box protein 41 5.69 4.13 41.82 60.67 8.44NM_001038699 Fn3k Fructosamine 3 kinase (Fn3k), transcript variant 2, 1.95 2.47 9.33 21.05 7.86NM_194060 Foxo6 Forkhead box O6 1.01 1.01 2.19 3.03 4.03NM_172904 Fsd2 Fibronectin type III and SPRY domain containing 2 1.52 1.14 1.82 3.98 7.90NM_008046 Fst Follistatin 1.01 1.04 1.85 2.14 2.64NM_008061 G6pc Glucose-6-phosphatase, catalytic 18.06 19.92 10.86 9.79 15.06NM_008070 Gabrb2 �-Aminobutyric acid (GABA-A) receptor, subunit �2 1.32 1.74 2.66 6.06 7.04NM_008070 Gabrb2 �-Aminobutyric acid (GABA-A) receptor, subunit �2 1.40 1.65 1.86 2.76 6.90NM_172971 Inpp4a Inositol polyphosphate-4-phosphatase, type I 1.20 1.29 2.71 3.65 2.45NM_001024617 Inpp4b Inositol polyphosphate-4-phosphatase, type II 1.21 1.60 2.07 4.42 4.93NM_011831 Insl5 Insulin-like 5 2.94 2.11 2.41 2.47 1.66NM_199251 Kcnk12 Potassium channel, subfamily K, member 12 3.12 3.83 1.84 2.30 4.96NM_016977 Mc4r Melanocortin 4 receptor 1.45 1.72 2.96 6.31 8.47NM_008657 Myf6 Myogenic factor 6 1.41 1.43 6.75 17.59 16.83NM_010856 Myh6 Myosin, heavy polypeptide 6, cardiac muscle, � 1.21 1.02 1.23 2.37 5.24NM_010866 Myod1 Myogenic differentiation 1 1.48 2.63 1.50 1.65 2.30NM_001033621 Myot Myotilin 1.32 1.18 1.39 2.51 5.48NM_025980 Nrarp Notch-regulated ankyrin repeat protein 1.64 3.77 4.28 3.53 3.09NM_138648 Olr1 Oxidized low density lipoprotein (lectin-like) receptor 1 1.09 1.52 1.03 4.90 11.48AK137625 Padi4 Peptidyl arginine deiminase, type IV 1.40 1.11 1.52 2.06 5.31NM_029595 Pbp2 Phosphatidylethanolamine-binding protein 2 1.23 1.93 1.57 3.06 20.69M63554 Pkia Inhibitor protein of cAMP-dependent protein kinase, complete cds. 1.09 1.12 1.43 2.59 2.28NM_012044 Pla2g2e Phospholipase A2, group IIE 1.06 1.01 3.20 3.05 1.49NM_023200 Ppp1r7 Protein phosphatase 1, regulatory (inhibitor) subunit 7 1.21 1.06 1.40 5.24 3.92NM_021880 Prkar1a Protein kinase, cAMP-dependent regulatory, type I, � 1.06 1.02 1.47 2.00 2.12NM_053190 S1pr5 Sphingosine-1-phosphate receptor 5 1.70 1.77 2.31 2.85 1.40NM_173403 Slc10a4 Solute carrier family 10 (sodium/bile acid cotransporter family), member 4 2.15 1.43 2.83 3.95 7.40NM_030696 Slc16a3 Solute carrier family 16 (monocarboxylic acid transporters), member 3 1.01 1.10 4.06 3.47 2.68NM_172659 Slc2a6 Solute carrier family 2 (facilitated glucose transporter), member 6 1.06 1.04 1.79 3.08 5.41NM_172653 Slc39a10 Solute carrier family 39 (zinc transporter), member 10 1.19 1.48 5.00 3.67 3.11NM_023557 Slc44a4 Solute carrier family 44, member 4 1.24 1.32 1.97 3.09 10.91NM_023557 Slc44a4 Solute carrier family 44, member 4 1.48 1.11 1.98 3.43 10.14NM_053077 Slc45a2 Solute carrier family 45, member 2 2.13 2.94 1.96 1.06 1.15
Mechanism of Mstn-induced Insulin Resistance
MARCH 14, 2014 • VOLUME 289 • NUMBER 11 JOURNAL OF BIOLOGICAL CHEMISTRY 7663
by guest on May 23, 2020
http://ww
w.jbc.org/
Dow
nloaded from

rescue in the levels of IRS1 and pAkt, which is consistent withimproved insulin sensitivity. In agreement with the in vitroanalysis above, whereas high glucose and HFD treatment
resulted in increased Cblb levels in both skeletal muscle andliver isolated from WT mice (Fig. 8, E and F), when comparedwith respective controls (saline or chow diet (CD)-fed), noincrease in Cblb levels was noted in Mstn�/� mice fed eitherhigh glucose or HFD (Fig. 8, E and F). Moreover, the levels ofIRS1 and pAkt in both skeletal muscle and liver were compara-ble between CD-fed controls and high glucose or HFD-treatedMstn�/� mice (Fig. 8, E and F). However, in contrast, a dramaticreduction in the levels of both IRS1 and pAkt was observed inWT mice during high glucose and HFD treatment (Fig. 8, E andF), which was consistent with both the high levels of Cblb pro-tein (Fig. 8, E and F) and the development of insulin resistanceobserved in WT mice (Fig. 2, G–J). Furthermore, overexpres-sion of Cblb through lentiviral-mediated transduction inhMb15 myoblasts reduced both basal and insulin-stimulatedpAkt levels together with IRS1 protein (Fig. 8G). On the other
FIGURE 6. Mstn injection into mice promotes insulin resistance and up-regulates Cblb to degrade IRS1 protein. GTT (A) and ITT (B) on WT mice injectedwith Mstn or saline are shown. C, BW changes of WT mice injected with Mstn or saline. D, epididymal (Epi), retroperitoneal (Retro), and Inguinal (Ingu) whiteadipose tissue (WAT) weight changes, normalized as percentage BW, in WT mice injected with Mstn or saline. E, gastrocnemius (GAS), extensor digitorumlongus (EDL), tibialis anterior (TA), soleus (Sol), and quadriceps (Quad) skeletal muscle weight changes, normalized as percentage BW, in WT mice injected withMstn or saline. F, graph showing average food consumption (mouse/day) during 12 weeks of saline or Mstn injection. IB analysis of Cblb, IRS1, pAkt, and totalAkt in muscle (G) and liver (H) collected from saline- and Mstn-injected mice. I, IB analysis of Cblb, IRS1, pAkt, and total Akt in primary myoblasts isolated fromsaline- and Mstn-injected WT mice in the presence of increasing concentrations of insulin (0, 0.01, 0.1, and 1 �M). J, IB analysis of IRS1, pAkt, and total Akt inprimary myotubes isolated from Cblb�/� and Cblb�/� mice treated with (�) or without (�) Mstn. K, IB analysis of ubiquitinated IRS1 protein levels in primarymyotubes isolated from Cblb�/� and Cblb�/� mice treated with (�) or without (�) Mstn. Tubulin levels were assessed in all IBs to ensure equal loading. All IBimages and graphs are representative of at least two independent experiments. All graphs display the mean � S.E. *, p � 0.05; **, p � 0.01.
TABLE 4Changes in blood triglyceride, cholesterol, glucose, insulin, adiponec-tin, and leptin levels in saline and Mstn-treated WT micep values represent comparisons made between saline-injected and Mstn-treatedWT mice. (n � 8 per group)
Measurements Saline Mstn Units
Plasma triglycerides 126.18 � 12.3 199.62 � 9.2a mg/dlPlasma adiponectin 11.4 � 0.9 14.4 � 2.0b ng/mlPlasma leptin 1.02 � 0.6 1.3 � 0.9 ng/mlBlood glucose 7.2 � 0.6 16.5 � 3.9b mmol/literPlasma insulin 64.75 � 7.0 235.18 � 12.0c pmol/literPlasma cholesterol 106.38 � 8.4 148.14 � 15b mg/dlFasting glucose 6.02 � 2.6 12.5 � 1.7 b mmol/literLiver weight 1.31 � 0.4 1.53 � 0.2 g
a p � 0.05.b p � 0.01.c p � 0.001.
Mechanism of Mstn-induced Insulin Resistance
7664 JOURNAL OF BIOLOGICAL CHEMISTRY VOLUME 289 • NUMBER 11 • MARCH 14, 2014
by guest on May 23, 2020
http://ww
w.jbc.org/
Dow
nloaded from

hand, enhanced basal and insulin stimulated pAkt levels, andIRS1 abundance was observed in myoblasts derived fromCblb�/� mice when compared with myoblasts isolated fromcontrol Cblb�/� mice (Fig. 8H). Taken together these data con-
firm that the Mstn-Cblb pathway appears to play a critical roleduring the induction of insulin resistance in response to bothhigh glucose and HFD regimen and that Cblb plays a major rolein inhibiting insulin signaling.
FIGURE 7. Mstn signals through Smad3 to increase Cblb expression in skeletal muscle. A, schematic showing the presence of consensus Smad3 bindingmotifs identified in the Cblb promoter. Consensus Smad3 binding motifs are highlighted in red and underlined. IB analysis of pSmad2/3 protein levels in muscletissues of saline- or high glucose-injected mice (B) and in muscle tissue of CD- or HFD-fed mice (C) is shown. The graph shows densitometric analysis forpSmad2/3 protein in arbitrary units (A.U). n � 4 per group. D, Cblb mRNA expression in C2C12 myotubes expressing either shCon or shSmad3 and treated with(�) or without (�) Mstn normalized to GAPDH. E, IB analysis of Cblb, IRS1, pAkt, and total Akt protein levels in C2C12 myotubes expressing either shCon orshSmad3 and treated with (�) or without (�) Mstn. The graph shows densitometric analysis for Cblb protein in arbitrary units. F, Cblb mRNA expression inprimary myoblasts isolated from Smad3�/� and Smad3�/� mice treated with (�) or without (�) Mstn normalized to GAPDH. IB analysis of Cblb, IRS1, pAkt, andtotal Akt protein levels in primary myoblasts isolated from Smad3�/� and Smad3�/� mice treated with (�) or without (�) Mstn (G). The graph showsdensitometric analysis for Cblb protein in arbitrary units. Tubulin levels were assessed to ensure equal loading in all IBs. All the IB images and graphs arerepresentative of at least two independent experiments. All graphs display the mean � S.E. **, p � 0.01; ***, p � 0.001.
Mechanism of Mstn-induced Insulin Resistance
MARCH 14, 2014 • VOLUME 289 • NUMBER 11 JOURNAL OF BIOLOGICAL CHEMISTRY 7665
by guest on May 23, 2020
http://ww
w.jbc.org/
Dow
nloaded from

DISCUSSION
Energy-dense diets that are high in fat, protein, and sugar areassociated with a risk of obesity and T2D (48). Insulin resistanceis key predictor of T2D and is associated with both non-obeseand obese pathological conditions (49). However, the underly-ing molecular mechanism(s) that initiates the development ofinsulin resistance during continued high calorie intake is poorlycharacterized. Previous work by Hittel et al. (50) has revealedthat injection of exogenous Mstn protein into mice leads to thedevelopment of insulin resistance. However, the role of Mstn ininitiating insulin resistance in response to high calorie intake
has not been studied. Here we show a conclusive mechanismthrough which energy-rich diets in mice induce high levels ofMstn, which subsequently results in the targeted degradationof the critical insulin-signaling molecule IRS1 by up-regulationof the ubiquitin E3 ligase Cblb.
The myokine, Mstn, belongs to the TGF-� super family andprimarily functions to control muscle growth and development(51). However, recent reports have shown that Mstn also playsa role in regulating muscle metabolism; in fact, either inhibitionof Mstn or lack of Mstn reduces fat accumulation and enhancesinsulin sensitivity (24, 52). Our laboratory characterized in-creased AMP-activated protein kinase and peroxisome prolif-erator-activated receptor signaling in Mstn�/� muscle asmechanisms behind the increased fat oxidation observed inMstn�/� mice (24). Moreover, recent evidence also reveals thatelevated levels of Mstn in muscle in both human and mousemodels are associated in obesity, type-1 and type-2 diabetes (5,7, 53). Therefore, we considered Mstn to be an excellent candi-date that could potentially respond to nutrient signals to fur-ther regulate muscle metabolism. Indeed we observed that invitro treatment of C2C12 and HepG2 cells with high glucose orfatty acid (palmitate) as well as subjecting mice to high glucoseor HFD feeding in vivo significantly increased Mstn levels, sug-gesting that Mstn expression is indeed under the control ofmajor nutrient factors like glucose and fatty acids. In agreementwith this, high glucose treatment of C2C12 has been previouslyshown to increase Mstn, block myogenesis, and promote myo-tube atrophy (10). Specifically, our results revealed that glucoseand fatty acid/HFD treatment induce Mstn via independenttranscription factors; although SREBP1c was shown to be suf-ficient to induce Mstn in response to fatty acids by binding to anE-box motif, ChREBP was found to be responsible for glucose-mediated induction of Mstn through interaction with a ChoRE.Glucose regulation of gene transcription through ChREBP isnot a new concept; in fact studies have reported that in responseto high glucose treatment, ChREBP binds and activates genesinvolved in lipogenesis (54 –56). In addition, fatty acid regula-tion of SREBP1c has been previously reported whereby treat-ment with palmitate was shown to increase SREBP1c mRNAand protein levels (57). Moreover, SREBP1c-mediated up-reg-ulation of Mstn promoter has been reported in adipocytes pre-viously (4). Thus, these data reveal that ChREBP and SREBP1care critical for Mstn gene regulation in response to energy-richdiets.
It is noteworthy to mention that in addition to elevated Mstnlevels we consistently observed concomitant reduction in thephosphorylation of Akt in both in vitro and in vivo models,suggesting that increased Mstn inhibited insulin signaling. Todelineate the molecular mechanism through which Mstn pro-moted insulin resistance, microarray was employed, and nota-bly we discovered that Mstn potently induces the expression ofCblb, an ubiquitin E3 ligase previously shown to target anddegrade IRS1 protein in skeletal muscle (22). It is noteworthy tomention that the expression of other IRS1-specific E3 ligases,including Cul-7, SOCS1, and SOCS3, was not significantlyaltered in the microarray analysis (data not shown). Cblb hasbeen previously reported to be associated with type-1 diabetesboth in rodents and humans (19 –21). In addition, it has also
FIGURE 8. High glucose injection or HFD increases Cblb protein levels inmuscle and liver tissues. IB analysis of Cblb, IRS1, pAkt, and total Akt in cellstreated with (�) or without (�) glucose (Glu) (A) and in cells transiently trans-fected with either negative siRNA (�) or Mstn siRNA (�) and treated with (�)glucose (Glu) (B). IB analysis of Cblb, IRS1, pAkt, and total Akt cells treated with(�) or without (�) PA (C) and in cells transfected with either negative siRNA(�) or Mstn siRNA (�) and treated with (�) PA (D) is shown. IB analysis of Cblb,IRS1, pAkt and total Akt protein levels in muscle and liver tissues collectedfrom WT and Mstn�/� mice injected with either saline (-) or glucose (�) (E)and in muscle and liver tissues collected from WT and Mstn�/� mice fed eitherCD (�) or HFD (�) (F) is shown (n � 2 for each group). G, IB analysis of Cblb,IRS1, pAkt, and total Akt in hMb15 myoblasts infected with either control(pLOC) or with Cblb overexpressing lentivirus (pLOC-Cblb) in the presence ofincreasing concentrations of insulin (0, 0.01, 0.1, and 1 �M). IB analysis of IRS1,pAkt, and total Akt in myoblasts derived from Cblb�/� and Cblb�/� micestimulated with increasing concentrations of insulin (0, 0.01, 0.1 and 1 �M) (H)is shown. Tubulin levels were assessed in all IBs to ensure equal loading. All IBimages are representative of at least two independent experiments.
Mechanism of Mstn-induced Insulin Resistance
7666 JOURNAL OF BIOLOGICAL CHEMISTRY VOLUME 289 • NUMBER 11 • MARCH 14, 2014
by guest on May 23, 2020
http://ww
w.jbc.org/
Dow
nloaded from
been shown that during skeletal muscle atrophy Cblb targetsIRS1 protein for degradation via the ubiquitin proteasomepathway (22). However to date, the importance of Cblb duringthe development of insulin resistance and for that matter fac-tors that regulate Cblb expression during obesity are poorlyunderstood. Subsequent quantitative PCR and IB analysis inde-pendently confirmed that Mstn indeed induces Cblb expres-sion not only in vitro but also in mice in vivo. Consistent withthe E3 ligase function of Cblb, induction of Cblb by Mstn led toincreased association of Cblb with IRS1 and subsequent ubiq-uitination of IRS1 protein. The Mstn-Cblb-IRS1 pathway wasfurther confirmed when Mstn failed to reduce IRS1 proteinlevels either in the absence of Cblb or in the presence of theproteasome inhibitor MG132. IRS1 is a key molecule in theinsulin-signaling pathway (58 – 60) and is highly expressed inskeletal muscle and white adipose tissue (61). Consistent withthis, deletion of IRS1 in mice induces severe insulin resistance(62– 64). Moreover, reduced IRS1 mRNA and/or protein levelsare detected in subjects with T2D (65, 66). Therefore, Mstn/Cblb-mediated loss of IRS1 would most certainly contribute tothe insulin resistance phenotype observed in response toincreased Mstn levels.
Importantly, studies have also reported that serine phosphor-ylation of IRS1, in contrast to the tyrosine phosphorylation of
IRS1 normally observed after insulin treatment, is associatedwith T2D (67, 68). In addition, serine phosphorylation of IRS1has been shown to promote both enhanced degradation of IRS1through the ubiquitin proteasome pathway (69) and develop-ment of insulin resistance. However, it is noteworthy to men-tion that in the current study we did not assess the serine phos-phorylation status of IRS1; as such, development of insulinresistance, due to increased serine phosphorylation of IRS1 inresponse to high calorie diet and Mstn treatment cannot beruled out. Nevertheless, through several independent investi-gations we have clearly shown that initiation of the Mstn-Cblbpathway leads to degradation of IRS1.
We hypothesized that Mstn-Cblb degradation of IRS1 wouldfurther result in hypophosphorylation of Akt and developmentof insulin resistance. In agreement with this, overexpression ofCblb resulted in loss of IRS1 and reduced pAkt levels, whereasthe absence of Cblb blocked IRS1 degradation and increasedthe levels of pAkt under basal conditions and in response toinsulin. These data strongly suggest increased insulin sensitiv-ity in the absence of Cblb. In addition, we observed a greaterincrease in Mstn and Cblb protein levels in both skeletal muscleand liver tissues of mice treated with either high glucose orHFD, with an associated decrease in IRS1 protein, reducedphosphorylation of Akt, and impaired insulin sensitivity in WT
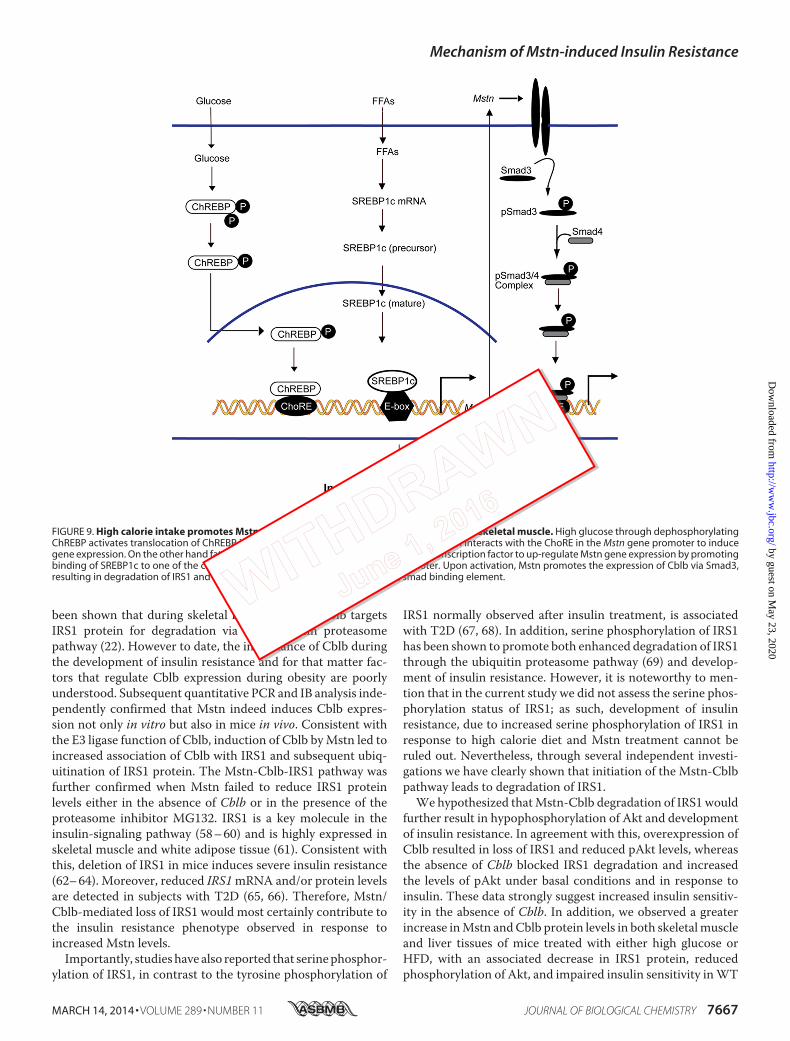
FIGURE 9. High calorie intake promotes Mstn-Cblb signaling leading to insulin resistance in skeletal muscle. High glucose through dephosphorylatingChREBP activates translocation of ChREBP into nucleus. The ChREBP transcription factor then interacts with the ChoRE in the Mstn gene promoter to inducegene expression. On the other hand fatty acids (palmitate) signal through the SREBP1c transcription factor to up-regulate Mstn gene expression by promotingbinding of SREBP1c to one of the consensus E-box motifs present in the Mstn promoter. Upon activation, Mstn promotes the expression of Cblb via Smad3,resulting in degradation of IRS1 and insulin resistance. FFA, free fatty acids; SBE, smad binding element.
Mechanism of Mstn-induced Insulin Resistance
MARCH 14, 2014 • VOLUME 289 • NUMBER 11 JOURNAL OF BIOLOGICAL CHEMISTRY 7667
by guest on May 23, 2020
http://ww
w.jbc.org/
Dow
nloaded from

mice but not in Mstn�/� mice. These data demonstrate that inthe absence of Mstn, high glucose and HFD feeding failed toactivate Cblb in both liver and muscle tissues. These observa-tions also support a role for Mstn in promoting insulin resist-ance in liver in response to high glucose and HFD feeding,which is in fact quite consistent with a previously publishedreport demonstrating that lack of Mstn protects the liver fromdiet-induced insulin resistance (39). Although Wilkes et al. (39)speculated that the improved insulin sensitivity observed in theliver may be due to reduced TNF-� levels, our data presentedhere suggests that loss of Mstn may also lead to reduced activa-tion of Cblb in liver and improved insulin sensitivity.
In summary, we for the first time report that energy-richdiets, specifically high glucose and high fat, signal throughChREBP and SREBP1c, respectively, to induce high levels ofMstn, subsequently resulting in the targeted degradation of thecritical insulin-signaling molecule IRS1 via Smad3-dependentup-regulation of the ubiquitin E3 ligase Cblb (Fig. 9).
Acknowledgments—Mstn�/� mice (C57BL/6 background) were kindgifts of Se-Jin Lee (Johns Hopkins University). We thank Prof. WallaceLangdon (University of Western Australia) for the gift of the Cblb�/�
mice (C56BL/6 background) and Prof. Walter Wahli (University ofLausanne, Switzerland) for the gift of the Smad3�/� mice. Humanprimary myoblasts (hMb15) were kind gifts from Drs. Vincent Moulyand Gillian Butler-Browne (Institut de Myologie, France), and theHepG2 cells were gifts from Dr. Antonio Bertoletti (Singapore institutefor Clinical Sciences, Singapore). We thank Prof. Howard C. Towle,University of Minnesota, for providing the FLAG-ChREBP andHA-Mlx� expression vectors. We also thank Addgene (Cambridge,MA) for providing the FLAG-SREBP1c plasmid (Dr. David Sabatini,ID 32017), the lentiviral packaging plasmid pCMV-dR8.2 dvpr (Dr.Bob Weinberg, ID 8455), and the envelope plasmid pCMV-VSVG (Dr.Bob Weinberg, ID 8454).
REFERENCES1. Brand-Miller, J. C., Holt, S. H., Pawlak, D. B., and McMillan, J. (2002)
Glycemic index and obesity. Am. J. Clin. Nutr. 76, 281S–285S2. Bray, G. A., Smith, S. R., de Jonge, L., Xie, H., Rood, J., Martin, C. K., Most,
M., Brock, C., Mancuso, S., and Redman, L. M. (2012) Effect of dietaryprotein content on weight gain, energy expenditure, and body composi-tion during overeating. A randomized controlled trial. JAMA 307, 47–55
3. Winzell, M. S., and Ahrén, B. (2004) The high-fat diet-fed mouse. A modelfor studying mechanisms and treatment of impaired glucose tolerance andtype 2 diabetes. Diabetes 53, S215–S219
4. Allen, D. L., Cleary, A. S., Speaker, K. J., Lindsay, S. F., Uyenishi, J., Reed,J. M., Madden, M. C., and Mehan, R. S. (2008) Myostatin, activin receptorIIb, and follistatin-like-3 gene expression are altered in adipose tissue andskeletal muscle of obese mice. Am. J. Physiol. Endocrinol. Metab. 294,E918 –E927
5. Hittel, D. S., Berggren, J. R., Shearer, J., Boyle, K., and Houmard, J. A. (2009)Increased secretion and expression of myostatin in skeletal muscle fromextremely obese women. Diabetes 58, 30 –38
6. Brandt, C., Nielsen, A. R., Fischer, C. P., Hansen, J., Pedersen, B. K., andPlomgaard, P. (2012) Plasma and muscle myostatin in relation to type 2diabetes. PLoS ONE 7, e37236
7. Chen, Y., Cao, L., Ye, J., and Zhu, D. (2009) Upregulation of myostatin geneexpression in streptozotocin-induced type 1 diabetes mice is attenuatedby insulin. Biochem. Biophys. Res. Commun. 388, 112–116
8. Ma, K., Mallidis, C., Bhasin, S., Mahabadi, V., Artaza, J., Gonzalez-Cada-vid, N., Arias, J., and Salehian, B. (2003) Glucocorticoid-induced skeletalmuscle atrophy is associated with upregulation of myostatin gene expres-
sion. Am. J. Physiol. Endocrinol. Metab. 285, E363–E3719. Spiller, M. P., Kambadur, R., Jeanplong, F., Thomas, M., Martyn, J. K., Bass,
J. J., and Sharma, M. (2002) The myostatin gene is a downstream targetgene of basic helix-loop-helix transcription factor MyoD. Mol. Cell. Biol.22, 7066 –7082
10. Grzelkowska-Kowalczyk, K., Wieteska-Skrzeczyńska, W., Grabiec, K.,and Tokarska, J. (2013) High glucose-mediated alterations of mechanismsimportant in myogenesis of mouse C2C12 myoblasts. Cell Biol. Int. 37,29 –35
11. Nakazato, K., Hirose, T., and Song, H. (2006) Increased myostatin synthe-sis in rat gastrocnemius muscles under high-protein diet. Int. J. Sport.Nutr. Exerc. Metab. 16, 153–165
12. Swaminathan, G., and Tsygankov, A. Y. (2006) The Cbl family proteins.Ring leaders in regulation of cell signaling. J. Cell Physiol. 209, 21– 43
13. Ettenberg, S. A., Keane, M. M., Nau, M. M., Frankel, M., Wang, L. M.,Pierce, J. H., and Lipkowitz, S. (1999) cbl-b inhibits epidermal growthfactor receptor signaling. Oncogene 18, 1855–1866
14. Levkowitz, G., Waterman, H., Ettenberg, S. A., Katz, M., Tsygankov, A. Y.,Alroy, I., Lavi, S., Iwai, K., Reiss, Y., Ciechanover, A., Lipkowitz, S., andYarden, Y. (1999) Ubiquitin ligase activity and tyrosine phosphorylationunderlie suppression of growth factor signaling by c-Cbl/Sli-1. Mol. Cell 4,1029 –1040
15. Kim, M., Tezuka, T., Suziki, Y., Sugano, S., Hirai, M., and Yamamoto, T.(1999) Molecular cloning and characterization of a novel cbl-family gene,cbl-c. Gene 239, 145–154
16. Molero, J. C., Turner, N., Thien, C. B., Langdon, W. Y., James, D. E., andCooney, G. J. (2006) Genetic ablation of the c-Cbl ubiquitin ligase domainresults in increased energy expenditure and improved insulin action. Di-abetes 55, 3411–3417
17. Molero, J. C., Waring, S. G., Cooper, A., Turner, N., Laybutt, R., Cooney,G. J., and James, D. E. (2006) Casitas b-lineage lymphoma-deficient miceare protected against high-fat diet-induced obesity and insulin resistance.Diabetes 55, 708 –715
18. Molero, J. C., Jensen, T. E., Withers, P. C., Couzens, M., Herzog, H., Thien,C. B., Langdon, W. Y., Walder, K., Murphy, M. A., Bowtell, D. D., James,D. E., and Cooney, G. J. (2004) c-Cbl-deficient mice have reduced adipos-ity, higher energy expenditure, and improved peripheral insulin action.J. Clin. Invest. 114, 1326 –1333
19. Yokoi, N., Komeda, K., Wang, H. Y., Yano, H., Kitada, K., Saitoh, Y., Seino,Y., Yasuda, K., Serikawa, T., and Seino, S. (2002) Cblb is a major suscepti-bility gene for rat type 1 diabetes mellitus. Nat. Genet. 31, 391–394
20. Bergholdt, R., Taxvig, C., Eising, S., Nerup, J., and Pociot, F. (2005) CBLBvariants in type 1 diabetes and their genetic interaction with CTLA4.J. Leukoc. Biol. 77, 579 –585
21. Yokoi, N., Fujiwara, Y., Wang, H. Y., Kitao, M., Hayashi, C., Someya, T.,Kanamori, M., Oiso, Y., Tajima, N., Yamada, Y., Seino, Y., Ikegami, H., andSeino, S. (2008) Identification and functional analysis of CBLB mutationsin type 1 diabetes. Biochem. Biophys. Res. Commun. 368, 37– 42
22. Nakao, R., Hirasaka, K., Goto, J., Ishidoh, K., Yamada, C., Ohno, A., Oku-mura, Y., Nonaka, I., Yasutomo, K., Baldwin, K. M., Kominami, E., Hi-gashibata, A., Nagano, K., Tanaka, K., Yasui, N., Mills, E. M., Takeda, S.,and Nikawa, T. (2009) Ubiquitin ligase Cbl-b is a negative regulator forinsulin-like growth factor 1 signaling during muscle atrophy caused byunloading. Mol. Cell. Biol. 29, 4798 – 4811
23. Bonala, S., McFarlane, C., Ang, J., Lim, R., Lee, M., Chua, H., Lokireddy, S.,Sreekanth, P., Leow, M. K., Meng, K. C., Shyong, T. E., Lee, Y. S., Gluck-man, P. D., Sharma, M., and Kambadur, R. (2013) Pid1 induces insulinresistance in both human and mouse skeletal muscle during obesity. Mol.Endocrinol. 27, 1518 –1535
24. Zhang, C., McFarlane, C., Lokireddy, S., Bonala, S., Ge, X., Masuda, S.,Gluckman, P. D., Sharma, M., and Kambadur, R. (2011) Myostatin-defi-cient mice exhibit reduced insulin resistance through activating the AMP-activated protein kinase signalling pathway. Diabetologia 54, 1491–1501
25. Yaffe, D., and Saxel, O. (1977) Serial passaging and differentiation of myo-genic cells isolated from dystrophic mouse muscle. Nature 270, 725–727
26. Knowles, B. B., Howe, C. C., and Aden, D. P. (1980) Human hepatocellularcarcinoma cell lines secrete the major plasma proteins and hepatitis Bsurface antigen. Science 209, 497– 499
Mechanism of Mstn-induced Insulin Resistance
7668 JOURNAL OF BIOLOGICAL CHEMISTRY VOLUME 289 • NUMBER 11 • MARCH 14, 2014
by guest on May 23, 2020
http://ww
w.jbc.org/
Dow
nloaded from

27. Pedersen, K. B., Buckley, R. S., and Scioneaux, R. (2010) Glucose inducesexpression of rat pyruvate carboxylase through a carbohydrate responseelement in the distal gene promoter. Biochem. J. 426, 159 –170
28. McFarlane, C., Hennebry, A., Thomas, M., Plummer, E., Ling, N., Sharma,M., and Kambadur, R. (2008) Myostatin signals through Pax7 to regulatesatellite cell self-renewal. Exp. Cell Res. 314, 317–329
29. Bigot, A., Jacquemin, V., Debacq-Chainiaux, F., Butler-Browne, G. S.,Toussaint, O., Furling, D., and Mouly, V. (2008) Replicative aging down-regulates the myogenic regulatory factors in human myoblasts. Biol. Cell100, 189 –199
30. Jacquemin, V., Furling, D., Bigot, A., Butler-Browne, G. S., and Mouly, V.(2004) IGF-1 induces human myotube hypertrophy by increasing cell re-cruitment. Exp. Cell Res. 299, 148 –158
31. Ge, X., McFarlane, C., Vajjala, A., Lokireddy, S., Ng, Z. H., Tan, C. K., Tan,N. S., Wahli, W., Sharma, M., and Kambadur, R. (2011) Smad3 signaling isrequired for satellite cell function and myogenic differentiation of myo-blasts. Cell Res. 21, 1591–1604
32. Lokireddy, S., McFarlane, C., Ge, X., Zhang, H., Sze, S. K., Sharma, M., andKambadur, R. (2011) Myostatin induces degradation of sarcomeric pro-teins through a Smad3 signaling mechanism during skeletal muscle wast-ing. Mol. Endocrinol. 25, 1936 –1949
33. Mailloux, R. J., and Harper, M. E. (2010) Glucose regulates enzymaticsources of mitochondrial NADPH in skeletal muscle cells. A novel role forglucose-6-phosphate dehydrogenase. FASEB J. 24, 2495–2506
34. Suchankova, G., Nelson, L. E., Gerhart-Hines, Z., Kelly, M., Gauthier,M. S., Saha, A. K., Ido, Y., Puigserver, P., and Ruderman, N. B. (2009)Concurrent regulation of AMP-activated protein kinase and SIRT1 inmammalian cells. Biochem. Biophys. Res. Commun. 378, 836 – 841
35. Schmitz-Peiffer, C., Craig, D. L., and Biden, T. J. (1999) Ceramide gener-ation is sufficient to account for the inhibition of the insulin-stimulatedPKB pathway in C2C12 skeletal muscle cells pretreated with palmitate.J. Biol. Chem. 274, 24202–24210
36. Choi, Y. J., Choi, S. E., Ha, E. S., Kang, Y., Han, S. J., Kim, D. J., Lee, K. W.,and Kim, H. J. (2011) Involvement of visfatin in palmitate-induced up-regulation of inflammatory cytokines in hepatocytes. Metabolism 60,1781–1789
37. Stoeckman, A. K., Ma, L., and Towle, H. C. (2004) Mlx is the functionalheteromeric partner of the carbohydrate response element-binding pro-tein in glucose regulation of lipogenic enzyme genes. J. Biol. Chem. 279,15662–15669
38. Bonala, S., Lokireddy, S., Arigela, H., Teng, S., Wahli, W., Sharma, M.,McFarlane, C., and Kambadur, R. (2012) Peroxisome proliferator-acti-vated receptor �/ induces myogenesis by modulating myostatin activity.J. Biol. Chem. 287, 12935–12951
39. Wilkes, J. J., Lloyd, D. J., and Gekakis, N. (2009) Loss-of-function mutationin myostatin reduces tumor necrosis factor alpha production and protectsliver against obesity-induced insulin resistance. Diabetes 58, 1133–1143
40. Lokireddy, S., Mouly, V., Butler-Browne, G., Gluckman, P. D., Sharma, M.,Kambadur, R., and McFarlane, C. (2011) Myostatin promotes the wastingof human myoblast cultures through promoting ubiquitin-proteasomepathway-mediated loss of sarcomeric proteins. Am. J. Physiol. Cell Physiol.301, C1316 –C1324
41. Ma, L., Robinson, L. N., and Towle, H. C. (2006) ChREBP*Mlx is theprincipal mediator of glucose-induced gene expression in the liver. J. Biol.Chem. 281, 28721–28730
42. Ma, L., Tsatsos, N. G., and Towle, H. C. (2005) Direct role of ChREBP. Mlxin regulating hepatic glucose-responsive genes. J. Biol. Chem. 280,12019 –12027
43. Billin, A. N., and Ayer, D. E. (2006) The Mlx network. Evidence for aparallel Max-like transcriptional network that regulates energy metabo-lism. Curr. Top. Microbiol. Immunol. 302, 255–278
44. Towle, H. C. (2001) Glucose and cAMP. Adversaries in the regulation ofhepatic gene expression. Proc. Natl. Acad. Sci. U.S.A. 98, 13476 –13478
45. Yokoyama, C., Wang, X., Briggs, M. R., Admon, A., Wu, J., Hua, X., Gold-stein, J. L., and Brown, M. S. (1993) SREBP-1, a basic-helix-loop-helix-leucine zipper protein that controls transcription of the low density lipo-protein receptor gene. Cell 75, 187–197
46. Kim, J. B., Spotts, G. D., Halvorsen, Y. D., Shih, H. M., Ellenberger, T.,
Towle, H. C., and Spiegelman, B. M. (1995) Dual DNA binding specificityof ADD1/SREBP1 controlled by a single amino acid in the basic helix-loop-helix domain. Mol. Cell. Biol. 15, 2582–2588
47. Kosoy, R., Yokoi, N., Seino, S., and Concannon, P. (2004) Polymorphicvariation in the CBLB gene in human type 1 diabetes. Genes Immun. 5,232–235
48. Flier, J. S. (2004) Obesity wars. Molecular progress confronts an expandingepidemic. Cell 116, 337–350
49. Olefsky, J. M., and Nolan, J. J. (1995) Insulin resistance and non-insulin-dependent diabetes mellitus. Cellular and molecular mechanisms. Am. J.Clin. Nutr. 61, 980S–986S
50. Hittel, D. S., Axelson, M., Sarna, N., Shearer, J., Huffman, K. M., and Kraus,W. E. (2010) Myostatin decreases with aerobic exercise and associateswith insulin resistance. Med. Sci. Sports Exerc. 42, 2023–2029
51. McPherron, A. C., Lawler, A. M., and Lee, S. J. (1997) Regulation of skeletalmuscle mass in mice by a new TGF-� superfamily member. Nature 387,83–90
52. McPherron, A. C., and Lee, S. J. (2002) Suppression of body fat accumu-lation in myostatin-deficient mice. J. Clin. Invest. 109, 595– 601
53. Milan, G., Dalla Nora, E., Pilon, C., Pagano, C., Granzotto, M., Manco, M.,Mingrone, G., and Vettor, R. (2004) Changes in muscle myostatin expres-sion in obese subjects after weight loss. J. Clin. Endocrinol. Metab. 89,2724 –2727
54. Denechaud, P. D., Bossard, P., Lobaccaro, J. M., Millatt, L., Staels, B., Gi-rard, J., and Postic, C. (2008) ChREBP, but not LXRs, is required for theinduction of glucose-regulated genes in mouse liver. J. Clin. Invest. 118,956 –964
55. Ishii, S., Iizuka, K., Miller, B. C., and Uyeda, K. (2004) Carbohydrate re-sponse element binding protein directly promotes lipogenic enzyme genetranscription. Proc. Natl. Acad. Sci. U.S.A. 101, 15597–15602
56. da Silva Xavier, G., Rutter, G. A., Diraison, F., Andreolas, C., and Leclerc,I. (2006) ChREBP binding to fatty acid synthase and L-type pyruvate ki-nase genes is stimulated by glucose in pancreatic beta-cells. J. Lipid Res.47, 2482–2491
57. Kato, T., Shimano, H., Yamamoto, T., Ishikawa, M., Kumadaki, S., Matsu-zaka, T., Nakagawa, Y., Yahagi, N., Nakakuki, M., Hasty, A. H., Takeuchi,Y., Kobayashi, K., Takahashi, A., Yatoh, S., Suzuki, H., Sone, H., andYamada, N. (2008) Palmitate impairs and eicosapentaenoate restores in-sulin secretion through regulation of SREBP-1c in pancreatic islets. Dia-betes 57, 2382–2392
58. Saltiel, A. R., and Kahn, C. R. (2001) Insulin signalling and the regulation ofglucose and lipid metabolism. Nature 414, 799 – 806
59. Shepherd, P. R., and Kahn, B. B. (1999) Glucose transporters and insulinaction. Implications for insulin resistance and diabetes mellitus. N. Engl.J. Med. 341, 248 –257
60. Thirone, A. C., Huang, C., and Klip, A. (2006) Tissue-specific roles of IRSproteins in insulin signaling and glucose transport. Trends Endocrinol.Metab. 17, 72–78
61. Withers, D. J., Gutierrez, J. S., Towery, H., Burks, D. J., Ren, J. M., Previs, S.,Zhang, Y., Bernal, D., Pons, S., Shulman, G. I., Bonner-Weir, S., and White,M. F. (1998) Disruption of IRS-2 causes type 2 diabetes in mice. Nature391, 900 –904
62. Tamemoto, H., Kadowaki, T., Tobe, K., Yagi, T., Sakura, H., Hayakawa, T.,Terauchi, Y., Ueki, K., Kaburagi, Y., and Satoh, S. (1994) Insulin resistanceand growth retardation in mice lacking insulin receptor substrate-1. Na-ture 372, 182–186
63. Kadowaki, T., Tamemoto, H., Tobe, K., Terauchi, Y., Ueki, K., Kaburagi,Y., Yamauchi, T., Satoh, S., Sekihara, H., Aizawa, S., and Yazaki, Y. (1996)Insulin resistance and growth retardation in mice lacking insulin receptorsubstrate-1 and identification of insulin receptor substrate-2. Diabet Med.13, S103–S108
64. Araki, E., Lipes, M. A., Patti, M. E., Brüning, J. C., Haag, B., 3rd, Johnson,R. S., and Kahn, C. R. (1994) Alternative pathway of insulin signalling inmice with targeted disruption of the IRS-1 gene. Nature 372, 186 –190
65. Carvalho, E., Jansson, P. A., Axelsen, M., Eriksson, J. W., Huang, X., Groop,L., Rondinone, C., Sjöström, L., and Smith, U. (1999) Low cellular IRS 1gene and protein expression predict insulin resistance and NIDDM.FASEB J. 13, 2173–2178
Mechanism of Mstn-induced Insulin Resistance
MARCH 14, 2014 • VOLUME 289 • NUMBER 11 JOURNAL OF BIOLOGICAL CHEMISTRY 7669
by guest on May 23, 2020
http://ww
w.jbc.org/
Dow
nloaded from

66. Kovacs, P., Hanson, R. L., Lee, Y. H., Yang, X., Kobes, S., Permana, P. A.,Bogardus, C., and Baier, L. J. (2003) The role of insulin receptor sub-strate-1 gene (IRS1) in type 2 diabetes in Pima Indians. Diabetes 52,3005–3009
67. Bouzakri, K., Roques, M., Gual, P., Espinosa, S., Guebre-Egziabher, F.,Riou, J. P., Laville, M., Le Marchand-Brustel, Y., Tanti, J. F., and Vidal, H.(2003) Reduced activation of phosphatidylinositol-3 kinase and increasedserine 636 phosphorylation of insulin receptor substrate-1 in primary cul-ture of skeletal muscle cells from patients with type 2 diabetes. Diabetes
52, 1319 –132568. Morino, K., Petersen, K. F., Dufour, S., Befroy, D., Frattini, J., Shatzkes, N.,
Neschen, S., White, M. F., Bilz, S., Sono, S., Pypaert, M., and Shulman, G. I.(2005) Reduced mitochondrial density and increased IRS-1 serine phos-phorylation in muscle of insulin-resistant offspring of type 2 diabetic par-ents. J. Clin. Invest. 115, 3587–3593
69. Pederson, T. M., Kramer, D. L., and Rondinone, C. M. (2001) Serine/threonine phosphorylation of IRS-1 triggers its degradation. Possible reg-ulation by tyrosine phosphorylation. Diabetes 50, 24 –31
Mechanism of Mstn-induced Insulin Resistance
7670 JOURNAL OF BIOLOGICAL CHEMISTRY VOLUME 289 • NUMBER 11 • MARCH 14, 2014
by guest on May 23, 2020
http://ww
w.jbc.org/
Dow
nloaded from

Mridula Sharma and Ravi KambadurSabeera Bonala, Sudarsanareddy Lokireddy, Craig McFarlane, Sreekanth Patnam,
Response to High Calorie Diet Intake(Cblb)-mediated Degradation of Insulin Receptor Substrate 1 (IRS1) Protein in
Myostatin Induces Insulin Resistance via Casitas B-Lineage Lymphoma b
doi: 10.1074/jbc.M113.529925 originally published online January 22, 20142014, 289:7654-7670.J. Biol. Chem.
10.1074/jbc.M113.529925Access the most updated version of this article at doi:
Alerts:
When a correction for this article is posted•When this article is cited•
to choose from all of JBC's e-mail alertsClick here
http://www.jbc.org/content/289/11/7654.full.html#ref-list-1This article cites 69 references, 30 of which can be accessed free at
by guest on May 23, 2020
http://ww
w.jbc.org/
Dow
nloaded from

Mridula Sharma and Ravi KambadurSabeera Bonala, Sudarsanareddy Lokireddy, Craig McFarlane, Sreekanth Patnam,
Response to High Calorie Diet Intake(Cblb)-mediated Degradation of Insulin Receptor Substrate 1 (IRS1) Protein in
Myostatin Induces Insulin Resistance via Casitas B-Lineage Lymphoma b
doi: 10.1074/jbc.M113.529925 originally published online January 22, 20142014, 289:7654-7670.J. Biol. Chem.
10.1074/jbc.M113.529925Access the most updated version of this article at doi:
Alerts:
When a correction for this article is posted•
When this article is cited•
to choose from all of JBC's e-mail alertsClick here
http://www.jbc.org/content/289/11/7654.full.html#ref-list-1
This article cites 69 references, 24 of which can be accessed free at
by guest on May 23, 2020
http://ww
w.jbc.org/
Dow
nloaded from