My Document - Bioinformatics & Biological Computing … · CASAVAv1.8.2UserGuide v TableofContents...
192
Transcript of My Document - Bioinformatics & Biological Computing … · CASAVAv1.8.2UserGuide v TableofContents...


ii Part # 15011196 RevC
CASAVA v1.8.2 User Guide i
This document and its contents are proprietary to Illumina, Inc. and its affiliates ("Illumina"), and areintended solely for the contractual use of its customer in connection with the use of the product(s)described herein and for no other purpose. This document and its contents shall not be used or distributedfor any other purpose and/or otherwise communicated, disclosed, or reproduced in any way whatsoeverwithout the prior written consent of Illumina. Illumina does not convey any license under its patent,trademark, copyright, or common-law rights nor similar rights of any third parties by this document.
The instructions in this document must be strictly and explicitly followed by qualified and properly trainedpersonnel in order to ensure the proper and safe use of the product(s) described herein. All of the contentsof this document must be fully read and understood prior to using such product(s).
FAILURE TO COMPLETELY READ AND EXPLICITLY FOLLOW ALL OF THE INSTRUCTIONSCONTAINED HEREIN MAY RESULT IN DAMAGE TO THE PRODUCT(S), INJURY TO PERSONS,INCLUDING TO USERS OR OTHERS, AND DAMAGE TO OTHER PROPERTY.
ILLUMINA DOES NOT ASSUME ANY LIABILITY ARISING OUT OF THE IMPROPER USE OF THEPRODUCT(S) DESCRIBED HEREIN (INCLUDING PARTS THEREOF OR SOFTWARE) OR ANY USEOF SUCH PRODUCT(S) OUTSIDE THE SCOPE OF THE EXPRESS WRITTEN LICENSES ORPERMISSIONS GRANTED BY ILLUMINA IN CONNECTION WITH CUSTOMER'S ACQUISITION OFSUCH PRODUCT(S).
FOR RESEARCH USE ONLY
© 2009-2011 Illumina, Inc. All rights reserved.
Illumina, illuminaDx, BeadArray, BeadXpress, cBot, CSPro, DASL, DesignStudio, Eco, GAIIx,Genetic Energy, Genome Analyzer, GenomeStudio, GoldenGate, HiScan, HiSeq, Infinium, iSelect,MiSeq, Nextera, Sentrix, Solexa, TruSeq, VeraCode, the pumpkin orange color, and the Genetic Energystreaming bases design are trademarks or registered trademarks of Illumina, Inc. All other brands andnames contained herein are the property of their respective owners.

ii Part # 15011196 RevC

CASAVA v1.8.2 User Guide iii
RevisionHistory
Part # Revision Date Description of Change
15011196 C October2011
Supports dual indexing and adapter masking forCASAVA v1.8.2
15011196 B May 2011 Supports CASAVA v1.8
15011196 A March2010
1509919 A November2009

iv Part # 15011196 RevC

CASAVA v1.8.2 User Guide v
Table ofContents
Revision History iiiTable of Contents vList of Tables vii
Chapter 1 Overview 1Introduction 2CASAVA Features 5What’s New 9Frequently Asked Questions 10
Chapter 2 Interpretation of RunQuality 11Introduction 12Quality Tables and Graphs 13SummaryTab 17
Chapter 3 Bcl Conversion and Demultiplexing 19Introduction 20Bcl Conversion Input Files 26Running Bcl Conversion and Demultiplexing 32Bcl Conversion Output Folder 37
Chapter 4 Sequence Alignment 47Introduction 48configureAlignment Input Files 50Running configureAlignment 55configureAlignment Output Files 75Running ELAND as a Standalone Program 87
Chapter 5 Variant Detection and Counting 89Introduction 90Methods 93Variant Detection Input Files 95Running Variant Detection and Counting 98Variant Detection and Counting Output Files 104
Appendix A Requirements and Software Installation 113Hardware and Software Requirements 114InstallingCASAVA 118
Appendix B Using Parallelization 121

vi Part # 15011196 RevC
“Make” Utilities 122
Appendix C Reference Files CASAVA 125Introduction 126ELANDReference Files 127Variant Detection and Counting Reference Files 129Getting Reference Files 130
Appendix D Algorithm Descriptions 133Introduction 134ELANDv2 and ELANDv2e 135Variant Detection 143readBases Counting Method 160
Appendix E Qseq Conversion 161Introduction 162Qseq Converter Input Files 163Running Qseq Converter 165Qseq Converter Parameters 166Qseq Converter Output Data 167
Appendix F Export to SAMConversion 169Introduction 170SAM Format 171Usage 175
Glossary 177
Index 179
Technical Assistance 181

CASAVA v1.8.2 User Guide vii
List of Tables
Table 1 ASCII Characters Encoding Q-scores 0–40 41Table 2 GERALDConfiguration File Core Parameters 56Table 3 configureAlignment Configuration File Optional Parameters 57Table 4 configureAlignment Configuration File Paired-End Analysis Options 58Table 5 ANALYSIS Variables 63Table 6 USE_BASES Options 64Table 7 Parameters for KAGU_PAIR_PARAMS and KAGU_PARAMS 67Table 8 Parameters for KAGU_PAIR_PARAMS Only 67Table 9 Parameters for ANALYSIS eland_extended 70Table 10 Parameters for ANALYSIS eland_rna 73Table 11 Intermediate Output File Descriptions 84Table 12 Intermediate Output File Formats 84Table 13 Required Parameters for ELAND_standalone.pl 87Table 14 Options for ELAND_standalone.pl 87Table 15 Targets for Variant Detection and Counting 99Table 16 Major File Options for Variant Detection and Counting 100Table 17 Behavioral Options for Variant Detection and Counting 100Table 18 Global Analysis Options for Variant Detection and Counting 101Table 19 Analysis Options for sort 101Table 20 Analysis Options for rnaCounts 102Table 21 Analysis Options for bam 102Table 22 Global Analysis Options for Variant Detection and Counting 154Table 23 Options for assembleIndels 155Table 24 Workflow Options for callSmallVariants 156Table 25 Read Mapping Options for callSmallVariants 156Table 26 SNP and Indel Options for callSmallVariants 157Table 27 SNP Options for callSmallVariants 157Table 28 Indel Options for callSmallVariants 158Table 29 Illumina General Contact Information 181Table 30 Illumina Customer Support Telephone Numbers 181

viii Part # 15011196 RevC

Chapter1
CASAVA v1.8.2 User Guide 1
Chapter 1 Overview
Overview
Introduction 2CASAVA Features 5What’s New 9Frequently Asked Questions 10

Overview
2 Part # 15011196 RevC
Introduction
This user guide documents CASAVA 1.8.2 (short for "Consensus Assessment ofSequence And VAriation"). CASAVA is the part of Illumina's sequencing analysissoftware that performs alignment of a sequencing run to a reference genome andsubsequent variant analysis and read counting. The basic pieces of functionality ofIllumina's sequencing analysis cascade are described below.
Analysis of Sequencing DataAfter the sequencing platform generates the sequencing images, the data are analyzed infive steps: image analysis, base calling, bcl conversion, sequence alignment, and variantanalysis and counting. CASAVA performs the bcl conversion, sequence alignment, andvariant analysis and counting steps, demultiplexes multiplexed samples during the bclconversion step.
1 Image analysis—Uses the raw images to locate clusters, and outputs the clusterintensity, X,Y positions, and an estimate of the noise for each cluster. The outputfrom image analysis provides the input for base calling. Image analysis isperformed by the instrument control software.
2 Base calling—Uses cluster intensities and noise estimates to output the sequence ofbases read from each cluster, a confidence level for each base, and whether the readpasses filtering. Base calling is performed by the instrument control software’s RealTime Analysis (RTA) or the Off-Line Basecaller (OLB).
3 Bcl conversion—Converts *.bcl files into *.fastq.gz files (compressed FASTQ files) inCASAVA. Multiplexed samples are demultiplexed during this step.
4 Sequence alignment—Aligns samples to a reference sequence using thecompressed FASTQ files.
5 Variant analysis and counting—Calls Single Nucleotide Polymorphisms (SNPs)and indels, and performs read counting (for RNA sequencing).
After variant analysis and counting are finished, the results can be viewed andanalyzed further in the GenomeStudio® software, or the result files can be analyzedusing third-party software.

Introductio
n
CASAVA v1.8.2 User Guide 3
Figure 1 Sequencing Data Analysis Workflow
Default AnalysisWorkflowSeveral analysis software products can be used for the analysis cascade. The defaultworkflow uses these software products:} HiSeq Control Software (HCS) and Real Time Analysis (RTA), or GenomeAnalyzer’s Sequencing Control Software (SCS) and RTA. The instrument computerrunning this software performs the following in real time:• Image analysis• Base calling
} CASAVA 1.8.2, running on a Linux analysis server, performs:• Bcl conversion and demultiplexing• Off-line sequence alignment• SNP calling and indel detection, read counting (for RNA sequencing)
NOTEAs of 1.8, CASAVA uses *.bcl as primary input, and does not support the _qseq.txt format. For *_qseq.txt files, use an older version of CASAVA, orconvert the _qseq.txt format as described in Qseq Conversion on page 161.

Overview
4 Part # 15011196 RevC
Supporting SoftwareThere are a number of software applications that support CASAVA:} The Off-Line Base caller (OLB) is an alternative for the on-instrument base callingby RTA.
} The Analysis Visual Controller (AVC) provides a GUI interface for runningCASAVA, and is especially convenient for users not proficient with runningapplications through the Linux command line.
} GenomeStudio contains modules for viewing the data analysis results in thegenomic context. These modules are the GenomeStudio ChIP Sequencing Module,DNA Sequencing Module, and RNA Sequencing Module.
} The Sequencing Analysis Viewer (SAV) allows you to view primary analysismetrics from the sequencing instrument.
To download these applications and their documentation, go tohttp://www.illumina.com or https://icom.illumina.com.
NOTEIf you do not have an iCom account, register as a new user. Itmay take up to three business days for initial review of theapplication.

CASAVAFeatures
CASAVA v1.8.2 User Guide 5
CASAVAFeatures
The CASAVA 1.8 package processes sequencing reads provided by RTA or OLB.CASAVA can generate the following data:} Sample-specific reads from multiplexed flow cells} Aligned reads} SNP calls} Indel calls} Expression levels for exons, genes and splice junctions in the RNA Sequencinganalysis
In addition, CASAVA automatically generates a range of statistics, such as mean depthand percentage chromosome coverage, to enable comparison with previous builds orother samples.CASAVA analyzes sequencing reads in three stages:} FASTQ file generation and demultiplexing} Alignment to a reference genome} Variant detection and countingThese three stages are explained below.
Figure 2 CASAVAWorkflow
Bcl ConversionCASAVA 1.8 uses *.bcl files as primary sequence input. The first step, bcl conversion,performs the following:} Generates compressed FASTQ files that can be used by configureAlignment.

Overview
6 Part # 15011196 RevC
} Organizes the output in Project and Sample folders (based on the sample sheet, ifprovided).
} Demultiplexes samples into that same run folder organization, based on the samplesheet.
NOTEThe separate demultiplexing step present in CASAVA 1.7 has beenintegrated in the bcl conversion step.
DemultiplexingMultiplexed sequencing allows you to run multiple samples per lane. The samples areidentified by index sequences (barcodes) that are attached to the template during samplepreparation. For TruSeq dual-indexing, you can analyze up to 96 individual samplesper lane, while TruSeq multiplexing with a single index allows up to 12 samples in onelane.Multiplexed sequencing runs from SCS 2.4 and later versions set the index reads asseparate reads. Sample demultiplexing in CASAVA creates several subdirectories todispatch the data associated with the different barcodes. Each subdirectory has astructure similar to the original BaseCalls directory.
Aligning ReadsCASAVA performs sequence alignment using the configureAlignment module, which isa set of utilities supplied as source code and scripts.The output data produced by configureAlignment are stored in a hierarchical folderstructure called the run folder. The run folder includes all data folders generated fromthe sequencing platform and the data analysis software.For the alignment step, the standard input files for reads are the compressed FASTQfiles (<sample name>_<barcode sequence>_L<lane>_R<read number>.<0-padded 3-digitset number>.fastq.gz). The standard output files for reads are the export files (<samplename>_<barcode sequence>_L<lane>_R<read number>.<0-padded 3-digit set number>_export.gz).
Alignment AlgorithmsCASAVA provides the alignment algorithm Efficient Large-Scale Alignment ofNucleotide Databases (ELAND). ELAND is very fast and should be used to match alarge number of reads against the reference genome.ELAND has been improved a number of times:} CASAVA 1.6 introduced a new version of ELAND, ELANDv2. The most importantimprovements of ELANDv2 are its ability to perform multiseed and gappedalignments.
} As of CASAVA 1.8 a new version of ELANDv2 is available, ELANDv2e. The mostimportant improvements of ELANDv2e are improved repeat resolution andimplementation of orphan alignment.
A short description of these improvements is provided below; more information aboutELANDv2 is available in Algorithm Descriptions on page 133.
Multiseed and Gapped AlignmentELANDv2e performs multiseed alignment by aligning consecutive sets of 16 to 32 basesseparately. After this, ELANDv2e extends each candidate alignment to the full length of

CASAVAFeatures
CASAVA v1.8.2 User Guide 7
the read, using a gapped alignment method that allows for gaps (indels) of up to 10bases. ELANDv2e then picks the best alignment based on alignment scores.
Repeat ResolutionELANDv2e aligns reads in repeat regions using two new modes: semi-repeat resolutionand full repeat resolution. Both modes take repetitive hits into account for the multiseedpass of ELAND. Full repeat resolution is more sensitive and places more reads in repeatregions, but will result in longer run time.By default, ELANDv2e runs in semi-repeat resolution mode. Full repeat resolution canbe turned on with the option INCREASED_SENSITIVITY.
Orphan AlignmentELANDv2e performs orphan alignment by identifying read pairs for which only one ofthe reads aligns. ELANDv2e tries to align the other read in a defined window (bydefault 450 bp). If the number of mismatches is <10% of the read length, ELANDv2ereports the alignment.
Variant Detection and CountingDuring variant detection and counting, CASAVA generates a CASAVA build, which isa post-sequencing analysis of data from reads aligned to a reference genome byconfigureAlignment.The CASAVA build process is divided into several modules (or targets), each of whichcompletes a major portion of the post-alignment analysis pipeline:
1 The first module, 'sort', bins aligned reads into separate regions of the referencegenome, sorts these reads by alignment position and optionally removes PCRduplicates (for paired-end reads) and finally converts these reads into BAM format.
2 In a paired-end analysis the next module, 'assembleIndels', is used to search forclusters of poorly aligned and anomalous reads. These clusters of reads are de-novoassembled into contigs which are aligned back to the reference to produce candidateindels.
3 Subsequently, the 'callSmallVariants' module uses the sorted BAM files and thecandidate indels predicted by the assembleIndels module to perform local readrealignment and genotype SNPs and indels under a diploid model.
4 In an RNA-Seq build the 'rnaCounts' module will also be run to calculate gene andexon counts. Other optional modules can be added to the build process to performadditional functions.
For the variant discovery and counting step, the standard input file format for reads isthe export format (<sample name>_<barcode sequence>_L<lane>_R<read number>.<0-padded 3-digit set number>_export.gz). The standard output file format for reads is theBAM format. The sorted.bam files are stored in chromosome-specific directories underthe output directory.Use and properties of CASAVA's post-alignment modules are explained in VariantDetection and Counting on page 89. More information about the algorithms is availablein Variant Detection on page 143.

Overview
8 Part # 15011196 RevC
Capabilities and LimitationsThis section explains the capabilities and limitations of CASAVA when performingdata analysis.
DemultiplexingDemultiplexing is required for downstream analysis when a run is indexed.Demultiplexing processes the read data so that the reads are segregated and copied intoseparate directories, along with the indexing read or barcodes being parsed andremoved.
AlignmentAlignment is controlled by the configureAlignment.pl wrapper script, which includesseveral analysis modes that initiate single-end (eland_extended), paired-end (eland_pair), and single-end RNA (eland_rna) analysis. The default behavior ofconfigureAlignment.pl is to perform a multi-seeded, gapped alignment. This allows forthe identification of small indels (<= 10 nt) during alignment; a gap of up to 10 basescan be opened during seed extension.} DNA: The eland_extended and eland_pair analysis modes can be used to alignreads to a genome. The types of experiments supported include genomeresequencing, exome-capture, targeted capture, and ChIP-Seq data.
} Methylation: There is currently no support for aligning Bisulfite-Seq data withEland.
} RNA:Eland_rna will align transcriptome data. Transcript data is limited to singlereads that cross at most one splice junction. Eland_rna cannot align paired-enddata. For paired-end read transcriptome data, it is recommended that a third partytool such as BowTie/TopHat be used.
Variant AnalysisVariant analysis and RNA counting are controlled by the configureBuild.pl script. Thescript can be used to describe the following types of variation:} Site genotypes and SNPs: Homozygous and heterozygous single nucleotidevariants (SNPs) are called using a Bayesian site genotyping model, which takes intoaccount base calls, quality scores, and alignment scores of the reads at the givenposition.
} Indels: Indels are called using a two-stage process. First, contigs are assembled frompoorly aligned/anomolous reads and aligned back to the reference genome toproduce indel candidates, and then the variant caller consolidates these candidates,performs local realignment, and genotypes the indel. Indels of up to 300 bases inlength can be genotyped using this process. Small indels (up to 10 bases) can bedetected directly from the gapped alignment.
} RNA counting: The number of bases that fall into the exonic regions of each geneare summed to obtain gene level counts, normalized according to feature size, andexpressed as RPKM (Reads Per Kilobase per Million of mapped reads). Only splicesites from known splice variants are reported, one at a time. If a read represents anew splice variant or spans multiple splice junctions it will not be counted.

What’s
New
CASAVA v1.8.2 User Guide 9
What’s New
Important Changes in CASAVA 1.8.2
Bcl Conversion and Demultiplexing} Supports dual and single indices} Supports adapter masking} CASAVA 1.8.2 FASTQ files contain only reads that passed filtering. If you want allreads in a FASTQ file, use the --with-failed-reads option.
For more information, see the Release Notes for CASAVA 1.8.2, or the Changes file in{CASAVAInstallationDirectory}/share/CASAVA-1.8.2.
NewOptionsThe new options for release 1.8.2 are listed below.
Bcl Conversion and DemultiplexingFor descriptions, see Options for Bcl Conversion and Demultiplexing on page 33.
--adapter-sequence
--with-failed-reads

Overview
10 Part # 15011196 RevC
Frequently AskedQuestions
Frequently asked questions are available online.Go to http://www.illumina.com/FAQs, and click on Software.
Reporting ProblemsWhen reporting an issue, it is critical to capture all the output and error messagesproduced by a run. This is done by redirecting the output using “nohup” or thefacilities of a cluster management system. For an explanation of “nohup,” see NohupCommand on page 24.Provide a description of the error / bug / feature, along with the following information, ifavailable:
Demultiplexing/Bcl Conversion} The configureBclToFastq.pl command-line} Nohup.out from the make execution} SampleSheet.csv} support.txt file in the Unaligned folder
Alignment} The configureAlignment.pl command-line} Nohup.out from the make execution} Config.txt} support.txt file in the Aligned folder
Variant Detection/Counting} The command-line} CASAVA.log} conf/project.conf

Chapter2
CASAVA v1.8.2 User Guide 11
Chapter 2 Interpretation of Run Quality
InterpretationofRunQuality
Introduction 12Quality Tables and Graphs 13SummaryTab 17

InterpretationofR
unQuality
12 Part # 15011196 RevC
Introduction
Before beginning a secondary analysis, you should do an assessment of a sequencingrun’s performance metrics. This can help reveal any issues which may affect thesecondary analysis.To assess a run, you can use either the RTA-based output, or the Sequence AnalysisViewer (SAV). The SAV is an Illumina software package available on the Illuminawebsite (iCom), and can be used to view the performance metrics of a sequencing run.You can download it as part of the HiSeq Control Software (HCS) package:
1 Log on icom.illumina.com.
2 Click on Downloads.
3 Search for SAV.
4 Click on the HCS Software link.
5 Download the *Installers.zip file.
6 Extract the SAV.x.x.xx.x.msi file from the zip file.
7 Run the SAV.x.x.xx.x.msi file and follow the installation instructions.In general, using a PhiX or other balanced, suitable control sample (such as humangenomic DNA sequencing) as guide helps when interpreting these graphs.

Quality
Tab
lesand
Grap
hs
CASAVA v1.8.2 User Guide 13
Quality Tables andGraphs
Before beginning an analysis run, you should check the following tables and graphs instatus.htm or SAV:} Run Info: You can view basic information on the run’s configuration, read length,and control specifications on the Run Info tab of the Status.htm output or theSummary tab of the SAV window.
} Data by Cycle: These graphs help you examine intensities, focus metrics (FWHM),percent base, qscores, error rates and other metrics per cycle and per lane. You canidentify sample properties or instrument related events that affect the data.
} Data by Tile Charts: These graphics show run metrics by cycle and by lane andtile. These can be used to identify any issues which may be specific to a certainlane, or group of tiles.
} Cluster Density Box Plots: These plots show the raw cluster densities per lane, andthe clusters passing filter.
NOTEMany of the run quality metrics are depicted as box plots. In these plots, thered line shows the median, the box delimits the middle 50% of the data(interquartile range), and the error bars indicate the sample minimum andmaximum.
The sections below describe a number of examples of good runs and bad runs.
Excellent Quality MetricsThe figure below shows a screen shot from SAV displaying a run with excellent qualitymetrics. Note the trend of high Q-scores (%>Q30) across each cycle (left side) and thecumulative distribution of %>Q30 among the reads (right side).
Figure 3 SAV Screenshot Showing Excellent Quality Metrics
Low Diversity SamplesThe figure below shows a screen shot from SAV displaying the percent base per cyclefor a low diversity sample, which might result from sequencing a small number of PCRartifacts.

InterpretationofR
unQuality
14 Part # 15011196 RevC
Figure 4 Low Diversity Samples
In contrast, the figure below shows the percent base per cycle graph for a more diversesample. Note the low diversity for cycles 102-109: this was a multiplexed sample andthese are the index read cycles, so this is normal.
Figure 5 Proper Diversity Samples
Cluster DensityThe figure below shows a screen shot from SAV displaying cluster densities for lanes 1-8 of a flow cell. The cluster density of lanes 7 and 8 is very low: if any of these lanes isset as the control lane for the run, you might need to repeat basecalling (using OLB)with a more successful control lane. Note that the raw cluster density for lane 1 is too

Quality
Tab
lesand
Grap
hs
CASAVA v1.8.2 User Guide 15
high, resulting in a lower percentage of clusters passing filter (the green box), althoughthe total number of clusters passing filter is still acceptable.
Figure 6 Cluster Density
Fluidics LeakThe figure below depicts a flow cell with spatial variability in intensity. Typically, wewould expect intensity to be nearly even within each lane. This variability mightindicate a fluidics issue such as a large volume of bubbles moving through the flow cell

InterpretationofR
unQuality
16 Part # 15011196 RevC
Figure 7 Fluidics Leak

Sum
maryT
ab
CASAVA v1.8.2 User Guide 17
SummaryTab
Another tab in the status.htm page or SAV that you should examine is the Summarytab. The key parameters are listed in the following sections, along with conditions,possible causes for those conditions, and suggested actions to correct the condition.
ClustersThis column contains the average number of clusters per tile detected in the first cycleimages.
Condition Possible Cause Suggested ActionFewer clusters than expected: Reanalyze with new default offsets in OLB.
You will need *.cif files for that.Few bright clusterson the flow cell
Problem with cluster formation
Blurred images Poor focus or dirty flow cell surfaceLots of clustersvisible
Cluster density or size is too great todistinguish individual objects
More clusters than expected:Too many clusterson the flow cell
Problem with cluster formation
Very large clusters Double counting
Average First Cycle IntensityGenerally, brighter is better, but this result is instrument and sample dependent.
Condition Possible CauseLowintensity
Problem with cluster formation or poorfocus
Percentage of First Cycle Intensity Remaining After 20 Cycles ofSequencing
Generally, the higher, the better. The intensity remaining can be sample dependent.
Condition Possible Cause Suggested ActionLow value A correct measure of rapid signal decay deduced
from intensity plotsCheck experiment fluidics ortemperature control
Problem with cycle 20 deduced from intensityplots.
Check fluidics and focus for thiscycle
Exceptionallyhigh value
Low first cycle intensity Check first cycle focus
Percentage of Clusters Passing FiltersTo remove the least reliable data from the analysis, the raw data can be filtered toremove any clusters that have “too much” intensity corresponding to bases other thanthe called base. By default, the purity of the signal from each cluster is examined overthe first 25 cycles and calculated as Chastity = Highest_Intensity / (Highest_Intensity +Next_Highest_Intensity) for each cycle. The new default filtering implemented at thebase calling stage allows at most one cycle that is less than the Chastity threshold.

InterpretationofR
unQuality
18 Part # 15011196 RevC
The higher the value, the better. This value is very dependent on cluster density, sincethe major cause of an impure signal in the early cycles is the presence of another clusterwithin a few micrometers.
Condition Possible Cause Suggested ActionVery few clusterspassing filter
Poor flow cell, perhaps unblockedDNAFaint clustersOut of focusPoor matrixA fluidics or sequencing failureBubbles in individual tilesToo many clustersLarge clustersHigh phasing or prephasing
Some of the causes may be at a single cycle. Ifthe problem is isolated to these early cycles, itis possible that this filtering throws away verygood data.Base calling errors may be limited to affectedcycles, and, as early cycles are fairly resistantto minor focus and fluidics problems, even thenumber of errors may be few. The filteringcan always be set manually to some othervalues.Check before assuming all the data are poor.
Percentage of Phasing and PrephasingIdeally, these values should be as low as possible.
Condition Possible Cause Suggested ActionHigh phasing orprephasing
Reagent issue (reagentshave deteriorated)Fluidics
Check for leaks or bubbles in images or early cyclediscrepancies in intensity plots.
Poor flow cell Poor blocking can be evident as intensity in all channelsfrom cycle 1.
Ambient temperature ofsystem
Check whether machine or facility temperature getsbeyond recommended limits.
Standard DeviationsMany values have standard deviations associated with them. This can be the firstindication as to the uniformity of the flow cell. If standard deviations are high, then itindicates variability from tile to tile with a lane.
Condition Possible Cause Suggested ActionHigh standarddeviations
Check poor tilesfor:• Bubbles• Focus• Dirty flowcell surface
Look at the tile-by-tile statistics that appear below the flow cell-wide summary.
After reviewing the tables in Summary.htm, examine the thumbnails.

Chapter3
CASAVA v1.8.2 User Guide 19
Chapter 3 Bcl Conversion and Demultiplexing
BclConversionandDemultiplexing
Introduction 20Bcl Conversion Input Files 26Running Bcl Conversion and Demultiplexing 32Bcl Conversion Output Folder 37

BclConversionandDem
ultiplexing
20 Part # 15011196 RevC
Introduction
As of CASAVA 1.8, configureAlignment uses FASTQ files as input. Since Illuminasequencing instruments generate *.bcl files as primary sequencing output, CASAVAcontains a BCL to FASTQ converter that combines these per-cycle *.bcl files from a runand translates them into FASTQ files.
NOTEAs of 1.8, CASAVA uses *.bcl as primary input, and does not support the _qseq.txt format. For *_qseq.txt files, use an older version of CASAVA, orconvert the _qseq.txt format as described in Qseq Conversion on page 161.
CASAVA 1.8 can start with bcl conversion and alignment as soon as the first read hasbeen sequenced completely.In addition to generating FASTQ files, CASAVA uses a user-created sample sheet todivide the run output in projects and samples, and stores these in separate directories. Ifno sample sheet is provided, all samples will be put in the Undetermined_Indicesdirectory by lane, and not demultiplexed. Each directory can be independently analyzed(alignment, variant analysis, and counting) with CASAVA and contains the filesnecessary for alignment, variant analysis, and counting with CASAVA.
NOTESome of the files needed for the alignment are at the top level of theUnaligned directory.
At the same time, CASAVA also separates multiplexed samples (demultiplexing).Multiplexed sequencing allows you to run multiple individual samples in one lane. Thesamples are identified by index sequences that were attached to the template duringsample prep. The multiplexed samples are assigned to projects and samples based onthe sample sheet, and stored in corresponding project and sample directories asdescribed above. At this stage, adapter masking may also be performed. With thisfeature, CASAVA will check whether a read has proceeded past the genomic insert andinto adapter sequence. If adapter sequence is detected, the corresponding basecalls willbe changed to N in the resultant FASTQ file.
WARNINGThe CASAVA 1.8 directory organization differs considerably from thedirectory organization used in CASAVA 1.7.
NOTEYou cannot start Bcl conversion, demultiplexing, and alignment in one stepusing CASAVA.
Bcl Conversion/Demultiplexing Directory StructureBcl conversion and demultiplexing is done in a single step, and generates a newdirectory in the Run folder called Unaligned, which contains all of the demultiplexedcompressed FASTQ files. One level down from the Unaligned directory are the projectdirectories and within each project directory are the sample directories.Reads with undetermined indices will be placed in the directory Undetermined_indices,unless the sample sheet specifies a specific sample and project for reads without indexin that lane.
NOTECASAVA 1.8 introduces samples and projects as organizing principle, whichdiffers from CASAVA 1.7, which organized output by lanes or index.

Introductio
n
CASAVA v1.8.2 User Guide 21
Figure 8 Typical Run Folder Structure after Bcl Conversion and Demultiplexing

BclConversionandDem
ultiplexing
22 Part # 15011196 RevC
Sample SheetThe sample sheet (SampleSheet.csv file) directs the software how to assign reads tosamples, and samples to projects. The sample sheet specifies for every index in everylane which sample and which project it belongs to. Lanes with samples that were notindexed can also be assigned to samples and projects using the sample sheet. Projectscan consist of multiple samples, and samples can consist of multiple lanes andmultiple indexes.The sample sheet contains the following columns:
Column DescriptionFCID Flow cell IDLane Positive integer, indicating the lane number (1-8)SampleID ID of the sampleSampleRef The name of the referenceIndex Index sequence(s)Description Description of the sampleControl Y indicates this lane is a control lane, N means
sampleRecipe Recipe used during sequencingOperator Name or ID of the operatorSampleProject The project the sample belongs to
NOTEThe column SampleProject is new in CASAVA 1.8 and links samples toprojects.
Every project in the sample sheet is linked to a corresponding project directory. Eachsample belonging to that project is linked to a corresponding sample directory withinthat project directory. Reads are stored in the FASTQ files located in the project andsample directories specified in the sample sheet, as illustrated below for the sample inline 4 of the sample sheet.

Introductio
n
CASAVA v1.8.2 User Guide 23
Figure 9 Relation between Sample Sheet and Directory Structure
Bcl Conversion/Demultiplexing ExamplesBcl conversion and demultiplexing support four scenarios:} Multiplexed samples present, with sample sheet.Reads are placed within the directory structure specified by the sample sheet, basedon the index and lane information. Reads for which the index sequence wasambiguous will be placed in a project directory called Undetermined_indices,unless the sample sheet specifies a specific sample and project for reads withoutindex in that lane.
} Multiplexed and non-multiplexed samples present, with sample sheet.Reads are placed within the directory structure specified by the sample sheet, basedon the index and lane information. Reads containing ambiguous or no barcodeswill be placed in a project directory called Undetermined_indices, unless the samplesheet specifies a specific sample and project for reads without index in that lane.
} No multiplexed samples present, with sample sheet.Reads are placed within the directory structure directed by the sample sheet, basedon the lane information.
} No multiplexed samples present, without sample sheet.Reads are placed in a project directory named after the flow cell, and sampledirectories based on the lane number.

BclConversionandDem
ultiplexing
24 Part # 15011196 RevC
Bcl Conversion As You GoBcl conversion supports alignment of the first read of a paired-end run beforecompletion of the run (align as you go). You can kick off Bcl conversion for read 1 usingthe target r1 when running make at any time after the last read has started (formultiplexed runs, this is after completion of the indexing read). You can also startalignment using the target r1 when running make for configureAlignment, or you canuse the POST_RUN_COMMAND_R1 variable to automatically start the alignment of read 1at the end of the Bcl conversion.For instructions, see Starting Bcl Conversion for Read 1 on page 35.
Demultiplexing MethodsDemultiplexing involves splitting the FASTQ files and updating the statistics andreporting files. This section describes these two steps.
Splitting FASTQ FilesThe first step of demultiplexing in CASAVA is splitting the base call files, based on theindex sequence. This is done the following way for each cluster:
1 Get the raw index for each index read from the .bcl file.
2 Identify the appropriate directory for the index based on the sample sheet.
3 Optional: Detect and correct up to one error on the barcode, and identify theappropriate directory. If there are multiple index reads, detect and correct up to oneerror in each index read.
4 Optional: Detect the presence of adapter sequence at the end of read. If adaptersequence is detected, mask the corresponding basecalls with N.
5 For each read:a Write the index sequence into the index field.b Append the end to the appropriate new FASTQ file in the selected directory.
6 If the index cannot be identified, the data is written into the Undetermined_indicesdirectory, unless the sample sheet specifies a project and sample for reads withoutindex.
Updating Statistics and ReportingThe sample demultiplexer updates the following files:} Generates statisticsWhile splitting the FASTQ files, CASAVA recalculates the base calling analysisstatistic that were computed during base calling for the unsplit lanes. These files(Demultiplex_Stats.htm, BustardSummary.xml, and IVC.htm) are stored in theUnaligned/Basecall_Stats_FCID folder.
} Regenerates the analysis plots for each multiplexed sample} Regenerates the BustardSummary.xml for each multiplexed sample} Updates config.xml for each multiplexed sample} Copies raw matrix and phasing files} Updates sample sheet

Introductio
n
CASAVA v1.8.2 User Guide 25
The sample demultiplexer strips all the non-relevant indexes from the originalsample sheet and places the stripped out version in the appropriate directory.
} Creates the Demultiplex_Stats_FCID.csv file in the Unaligned folder to indicate inwhich subdirectory each index has been written.
For a description of these files, see Bcl Conversion Output Folder on page 37.

BclConversionandDem
ultiplexing
26 Part # 15011196 RevC
BclConversion Input Files
Demultiplexing needs a BaseCalls directory and a sample sheet to start a run. Thesefiles are described below. See also image below.
NOTEFor installation instructions, see Requirements and Software Installation onpage 113.
Figure 10 Bcl Conversion Input Files
Folder and File NamingThe top level run folder name is generated using three fields to identify the<ExperimentName>, separated by underscores. For example:

BclC
onversio
nInp
utFiles
CASAVA v1.8.2 User Guide 27
YYMMDD_machinename_NNNN
You should not deviate from the run folder naming convention, as this may cause thesoftware to stop.
1 The first field is a six-digit number specifying the date of the run. The YYMMDDordering ensures that a numerical sort of run folders places the names inchronological order.
2 The second field specifies the name of the sequencing machine. It may consist ofany combination of upper or lower case letters, digits, or hyphens, but may notcontain any other characters (especially not an underscore). It is assumed that thesequencing platform is synonymous with the PC controlling it, and that the namesassigned to the instruments are unique across the sequencing facility.
3 The third field is a four-digit counter specifying the experiment ID on thatinstrument. Each instrument should be capable of supplying a series ofconsecutively numbered experiment IDs (incremental unique index) from theonboard sample tracking database or a LIMS.
NOTEIt is desirable to keep Experiment-IDs (or Sample-ID) and instrument namesunique within any given enterprise. You should establish a convention underwhich each machine is able to allocate run folder names independently ofother machines to avoid naming conflicts.
A run folder named 070108_instrument1_0147 indicates experiment number 147, runon instrument 1, on the 8th of Jan 2007. While the date and instrument name specify aunique run folder for any number of instruments, the addition of an experiment IDensures both uniqueness and the ability to relate the contents of the run folder back to alaboratory notebook or LIMS.Additional information is captured in the run folder name in fields separated by anunderscore from the first three fields. For example, you may want to capture the flowcell number in the run folder name as follows: YYMMDD_machinename_XXXX_FCYYY.
NOTEWhen publishing the data to a public database, it is desirable to extend theexclusivity globally, for instance by prefixing each machine with the identityof the sequencing center.
BaseCalls DirectoryDemultiplexing requires a BaseCalls directory as generated by RTA or OLB (Off-LineBasecaller), which contains the binary base call files (*.bcl files).
NOTEAs of 1.8, CASAVA does not use *_qseq.txt files as input anymore.
The BCL to FASTQ converter needs the following input files from the BaseCallsdirectory:} *.bcl files.} *.stats files.} *.filter files.} *.control files} *.clocs, *.locs, or *_pos.txt files. The BCL to FASTQ converter determines which typeof position file it looks for based on the RTA version that was used to generatethem.

BclConversionandDem
ultiplexing
28 Part # 15011196 RevC
} RunInfo.xml file. The RunInfo.xml is at the top level of the run folder.} config.xml fileRTA is configured to copy these files off the instrument computer machine to theBaseCalls directory on the analysis server. The files are described below.
Bcl FilesThe *.bcl files can be found in the BaseCalls directory:
<run directory>/Data/Intensities/BaseCalls/L<lane>/C<cycle>.1
They are named as follows:s_<lane>_<tile>.bcl
The *.bcl files are binary base call files with the format described below.
Bytes Description Data typeBytes 0–3 Number N of cluster Unsigned 32bits little
endian integerBytes 4–(N+3)Where N is thecluster index
Bits 0-1 are the bases, respectively [A, C, G, T]for [0, 1, 2, 3]:bits 2-7 are shifted by two bits and contain thequality score.All bits ‘0’ in a byte is reserved for no-call.
Unsigned 8bits integer
Stats FilesThe stats files can be found in the BaseCalls directory:
<RunDirectory>/Data/Intensities/BaseCalls/L00<lane>/C<cycle>.1
They are named as follows:s_<lane>_<tile>.stats
The Stats file is a binary file containing base calling statistics; the content is describedbelow. The data is for clusters passing filter only.
Start Description Datatype
Byte 0 Cycle number integerByte 4 Average Cycle Intensity doubleByte 12 Average intensity for A over all clusters with intensity for A doubleByte 20 Average intensity for C over all clusters with intensity for C doubleByte 28 Average intensity for G over all clusters with intensity for G doubleByte 36 Average intensity for T over all clusters with intensity for T doubleByte 44 Average intensity for A over clusters with base call A doubleByte 52 Average intensity for C over clusters with base call C doubleByte 60 Average intensity for G over clusters with base call G doubleByte 68 Average intensity for T over clusters with base call T doubleByte 76 Number of clusters with base call A integerByte 80 Number of clusters with base call C integerByte 84 Number of clusters with base call G integerByte 88 Number of clusters with base call T integerByte 92 Number of clusters with base call X integer

BclC
onversio
nInp
utFiles
CASAVA v1.8.2 User Guide 29
Start Description Datatype
Byte 96 Number of clusters with intensity for A integerByte 100 Number of clusters with intensity for C integerByte 104 Number of clusters with intensity for G integerByte 108 Number of clusters with intensity for T integer
Filter FilesThe filter files can be found in the BaseCalls directory.The *.filter files are binary files containing filter results; the format is described below.
Bytes DescriptionBytes 0–3 Zero value (for backwards compatibility)Bytes 4–7 Filter format version numberBytes 8–11 Number of clustersBytes 12–(N+11)Where N is the cluster number
unsigned 8-bits integer:• Bit 0 is pass or failed filter
Control FilesThe control files can be found in the BaseCalls directory:
<run directory>/Data/Intensities/BaseCalls/L00<lane>/
They are named as follows:s_<lane>_<tile>.control
The *.control files are binary files containing control results; the format is describedbelow.
Bytes DescriptionBytes 0–3 Zero value (for backwards compatibility)Bytes 4–7 Format version numberBytes 8–11 Number of clustersBytes 12–(2xN+11)Where N is the clusterindex
The bits are used as follows:• Bit 0: always empty (0)• Bit 1: was the read identified as a control?• Bit 2: was the match ambiguous?• Bit 3: did the read match the phiX tag?• Bit 4: did the read align to match the phiX tag?• Bit 5: did the read match the control index sequence?• Bits 6,7: reserved for future use• Bits 8..15: the report key for the matched record in thecontrols.fasta file (specified by the REPORT_KEY metadata)
Position FilesThe BCL to FASTQ converter can use different types of position files and will expect atype based on the version of RTA used:} *.locs: the locs files can be found in the Intensities directory.} *.clocs: the clocs files are compressed versions of locs file and can be found in theIntensities directory.
} *_pos.txt: the pos files can be found in the Intensities directory.

BclConversionandDem
ultiplexing
30 Part # 15011196 RevC
The *_pos.txt files are text files with 2 columns and a number of rows equal to thenumber of clusters. The first column is the X-coordinate and the second column isthe Y-coordinate. Each line has a <cr><lf> at the end.
RunInfo.xml FileThe top level Run Folder contains a RunInfo.xml file. The file RunInfo.xml (normallygenerated by SCS/HCS) identifies the boundaries of the reads (including index reads).The XML tags in the RunInfo.xml file are self-explanatory.
config.xml FilesIn the Intensities folder you will find the config.xml file that records any informationspecific to the generation of the subfolders. This contains a tag-value list describing thecycle-image folders used to generate each folder of intensity and sequence files.In the BaseCalls folder there is another config.xml file containing the meta-informationabout the base caller runs.
Adapter Sequences FileThe adapter sequences FASTA contains the Illumina adapter sequences, and needs to beprovided if the option --adapter-masking is used. FASTA files for various Illuminaadapters are available from teh Illumina website (through iCom).
Generating the Sample SheetThe user generated sample sheet (SampleSheet.csv file) describes the samples andprojects in each lane, including the indexes used. The sample sheet should be located inthe BaseCalls directory of the run folder. You can create, open, and edit the sample sheetin Excel.The sample sheet contains the following columns:
ColumnHeader
Description
FCID Flow cell IDLane Positive integer, indicating the lane number (1-8)SampleID ID of the sampleSampleRef The reference used for alignment for the sampleIndex Index sequences. Multiple index reads are separated by a hyphen (for example,
ACCAGTAA-GGACATGA).Description Description of the sampleControl Y indicates this lane is a control lane, N means sampleRecipe Recipe used during sequencingOperator Name or ID of the operatorSampleProject The project the sample belongs to
You can generate it using Excel or other text editing tool that allows .csv files to besaved. Enter the columns specified above for each sample, and save the Excel file in the.csv format. If the sample you want to specify does not have an index sequence, leavethe Index field empty.

BclC
onversio
nInp
utFiles
CASAVA v1.8.2 User Guide 31
Illegal CharactersProject and sample names in the sample sheet cannot contain illegal characters notallowed by some file systems. The characters not allowed are the space character andthe following:
? ( ) [ ] / \ = + < > : ; " ' , * ^ | & .
Multiple Index ReadsIf multiple index reads were used, each sample must be associated with an indexsequence for each index read. All index sequences are specified in the Index field. Theindividual index read sequences are separated with a hyphen character (-). For example,if a particular sample was associated with the sequence ACCAGTAA in the first indexread, and the sequence GGACATGA in the second index read, the index entry would beACCAGTAA-GGACATGA.
Samples Without IndexAs of CASAVA 1.8, you can assign samples without index to projects, sampleIDs, orother identifiers by leaving the Index field empty.

BclConversionandDem
ultiplexing
32 Part # 15011196 RevC
RunningBclConversionandDemultiplexing
Bcl conversion and demultiplexing is performed by one script, configureBclToFastq.pl.This section describes how to perform Bcl conversion and demultiplexing in CASAVA1.8.
Usage of configureBclToFastq.plThe standard way to run bcl conversion and demultiplexing is to first create thenecessary Makefiles, which configure the run. Then you run make on the generatedfiles, which executes the calculations.
1 Enter the following command to create a makefile for demultiplexing:/path-to-CASAVA/bin/configureBclToFastq.pl[options]
NOTEThe options have changed significantly between CASAVA 1.7 and 1.8. SeeOptions for Bcl Conversion and Demultiplexing on page 33.
2 Move into the newly created Unaligned folder specified by --output-dir.
3 Type the “make” command. Suggestions for “make” usage, depending on yourworkflow, are listed below.
Make Usage Workflownohup make -j N Bcl conversion and demultiplexing (default).nohup make -j N r1 Bcl conversion and demultiplexing for read 1.
• The -j option specifies the extent of parallelization, with the options dependingon the setup of your computer or computing cluster (see Using Parallelization onpage 121).
• The Unix nohup command redirects the standard output and keeps the “make”process running even if your terminal is interrupted or if you log out.
SeeMakefile Options for Bcl Conversion and Demultiplexing on page 34 for explanationof the options.
NOTEThe ALIGN option, which kicked off configureAlignment afterdemultiplexing was done in CASAVA 1.7, is no longer available.
4 After the analysis is done, review the analysis for each sample.See Demultiplex_Stats File on page 42 and DemultiplexedBustardSummary.xml File onpage 43.
Example Bcl Conversion and DemultiplexingAn example of a demultiplexing run is as follows:
1 Enter:/path-to-CASAVA/bin/configureBclToFastq.pl --input-dir
<BaseCalls_dir> --output-dir <Unaligned> --sample-sheet
<input_dir>/SampleSheet.csv
2 Go to the <Unaligned> folder.
3 Run:

Running
BclC
onversio
nand
Dem
ultiplexing
CASAVA v1.8.2 User Guide 33
nohup make -j 3
Step one will produce a set of directories in the Unaligned directory. Reads with anunresolved or erroneous index are placed in the Undetermined_indices directory.
Options for Bcl Conversion and DemultiplexingThe options for demultiplexing are described below.
Option Description Examples--fastq-cluster-count Maximum number of clusters per output
FASTQ file. Do not go over 16000000, sincethis is the maximum number of reads werecommend for one ELAND process. Specify0 to ensure creation of a single FASTQ file.Defaults to 4000000.
--fastq-cluster-
count 6000000
-i, --input-dir Path to a BaseCalls directory.\Defaults to current dir
--input-dir
<BaseCalls_dir>
-o, --output-dir Path to demultiplexed output.Defaults to <run_folder>/UnalignedNote that there can be only one Unaligneddirectory by default. If you want multipleUnaligned directories, you will have to usethis option to generate a different outputdirectory.
--output-dir <run_
folder>/Unaligned
--positions-dir Path to a directory containing positions files.Defaults depends on the RTA version that isdetected.
--positions-dir
<positions_dir>
--positions-format Format of the input cluster positionsinformation. Options:• .locs• .clocs• _pos.txtDefaults to .clocs.
--positions-format
.locs
--filter-dir Path to a directory containing filter files.Defaults depends on RTA version that isdetected.
--filter-dir
<filter_dir>
--intensities-dir Path to a valid Intensities directory.Defaults to parent of base_calls_dir.
--intensities-dir
<intensities_dir>
-s,--sample-sheet Path to sample sheet file.Defaults to <input_dir>/SampleSheet.csv
--sample-sheet
<input_
dir>/SampleSheet.csv
--tiles --tiles option takes a comma-separated list ofregular expressions to match against theexpected "s_<lane>_<tile>" pattern, where<lane> is the lane number (1-8) and <tile> isthe 4 digit tile number (left-padded with 0s).
--tiles=s_[2468]_[0-
9][0-9][02468]5,s_1_
0001
--use-bases-mask The --use-bases-mask string specifies howto use each cycle.• An “n” means ignore the cycle.• A “Y” (or "y") means use the cycle.• An “I” means use the cycle for the indexread.
• A number means that the previouscharacter is repeated that many times.
--use-bases-mask
y50n,I6n,Y50n
This means:

BclConversionandDem
ultiplexing
34 Part # 15011196 RevC
Option Description Examples• The read masks are separated by commas","
The format for dual indexing is as follows:--use-bases-mask Y*,I*,I*,Y* orvariations thereof as specified above.If this option is not specified, the mask will bedetermined from the 'RunInfo.xml' file in therun directory. If it cannot do this, you willhave to supply the --use-bases-mask.
• Use first 50 bases forfirst read (Y50)
• Ignore the next (n)• Use 6 bases for index(I6)
• Ignore next (n)• Use 50 bases for secondread (Y50)
• Ignore next (n)--no-eamss Disable the masking of the quality values with
the Read Segment Quality control metricfilter.
--no-eamss
--mismatches Comma-delimited list of number ofmismatches allowed for each read (forexample: 1,1). If a single value is provide, allindex reads will allow the same numbermismatches.Default is 0.
--mismatches 1
--flowcell-id Use the specified string as the flowcell id.(default value is parsed from the config-file)
--flowcell-id flow_
cell_id
--ignore-missing-stats Fill in with zeros when *.stats files are missing --ignore-missing-
stats
--ignore-missing-bcl Interpret missing *.bcl files as no call --ignore-missing-bcl
--ignore-missing-
control
Interpret missing control files as not-setcontrol bits
--ignore-missing-
control
--with-failed-reads Include failed reads into the FASTQ files (bydefault, only reads passing filter are included).
--with-failed-reads
--adapter-sequence Path to a FASTA adapter sequence file. Ifthere are two adapters sequences specified inthe FASTA file, the second adapter will beused to mask read 2. Else, the same adapterwill be used for all reads.Default: None (no masking)
--adapter-sequence
<adapter
dir>/adapter.fa
--man Print a manual page for this command --man
-h, --help Produce help message and exit -h
Makefile Options for Bcl Conversion and DemultiplexingThe options for make usage in demultiplexing/analysis are described below.
Parameter Descriptionnohup Use the Unix nohup command to redirect the standard output and keep the “make”
process running even if your terminal is interrupted or if you log out. The standardoutput will be saved in a nohup.out file and stored in the location where you areexecuting the makefile.nohup make -j n &The optional “&” tells the system to run the analysis in the background, leaving youfree to enter more commands.We suggest always running nohup to help troubleshooting if issues arise.
-j N The -j option specifies the extent of parallelization, with the options depending on thesetup of your computer or computing cluster.For a description of parallellization, see Using Parallelization on page 121.

Running
BclC
onversio
nand
Dem
ultiplexing
CASAVA v1.8.2 User Guide 35
Parameter Descriptionr1 Runs Bcl conversion for read 1. Can be started once the last read has started
sequencing.POST_RUN_COMMAND_R1
AMakefile variable that can be specified either on the make command line or as anenvironment variable to specify the post-run commands after completion of read one,if needed. Typical use would be triggering the alignment of read 1.
POST_RUN_COMMAND
AMakefile variable that can be specified on the make command line to specify thepost-run commands after completion of the run.
KEEP_INTERMEDIARY
The option KEEP_INTERMEDIARY tells CASAVA not to delete the intermediary filesin the Temp dir after Bcl conversion is complete. Usage: KEEP_INTERMEDIARY:=yes
NOTEIf you specify one of the more specific workflows and then run a moregeneral one, only the difference will get processed. For instance:make -j N r1
followed by:make -j N
will do read 1 in the first step, and read 2 the second one.
Starting Bcl Conversion for Read 1If you want to start Bcl to FASTQ conversion before completion of the run, use themakefile target r1 at any time after the last read has started (for multiplexed runs, thisis after completion of the indexing read).
1 Enter the following command to create a makefile for Bcl conversion:/path-to-CASAVA/bin/configureBclToFastq.pl [options]
2 Move into the newly created Unaligned folder specified by --output-dir.
3 Type the “make r1” command:make -j 8 r1
NOTEthe -j <n> command line option is supported to indicate up to <n>processes in parallel. However, for Bcl conversion the maximum level ofparallelization is 8.
Starting AlignmentYou can also start alignment before completion of the run using the target r1 whenrunning make for configureAlignment.See Starting Alignment for Read 1 on page 66.Alternatively, you can use the POST_RUN_COMMAND_R1 variable to automatically startthe alignment of read 1 at the end of the Bcl conversion. For example:
make -j 8 r1 POST_RUN_COMMAND_R1="cd ../Aligned ; make -j 16
r1"
Starting the Second ReadTo start Bcl conversion of the second read, use the regular make command in theUnaligned folder. Perform the following:
1 Move into the Unaligned folder specified by --output-dir.
2 Type the regular “make” command:make -j 8

BclConversionandDem
ultiplexing
36 Part # 15011196 RevC
3 After the analysis is done, review the analysis for each sample.See Demultiplex_Stats File on page 42 and DemultiplexedBustardSummary.xml File onpage 43.

BclC
onversio
nOutp
utFolder
CASAVA v1.8.2 User Guide 37
BclConversionOutput Folder
The Bcl Conversion output directory has the following characteristics:} The project and sample directory names are derived from the sample sheet.} The Demultiplex_Stats file shows where the sample data are saved in the directorystructure.
} The Undetermined_indices directory contains the reads with an unresolved orerroneous index.
} If no sample sheet exists, CASAVA generates a project directory named after theflow cell, and sample directories for each lane.
} Each directory is a valid base calls directory that can be used for subsequentalignment analysis in CASAVA.
NOTEIf the majority of reads end up in the 'Undetermined_indices' folder, checkthe --use-bases-mask parameter syntax and the length of the index in thesample sheet. It may be that you need to set the --use-bases-mask option tothe length of the index in the sample sheet + the character 'n' to account forphasing. Note that you will not be able to see which indices have been placedin the 'Undetermined_indices' folder

BclConversionandDem
ultiplexing
38 Part # 15011196 RevC
NOTEThere can be only one Unaligned directory by default. If you want multipleUnaligned directories, you will have to use the option --output-dir togenerate a different output directory.

BclC
onversio
nOutp
utFolder
CASAVA v1.8.2 User Guide 39
FASTQ FilesAs of 1.8, CASAVA converts *.bcl files into FASTQ files, and uses these FASTQ files assequence input for configureAlignment. The files are located in the Unaligned/Project_<ProjectName>/Sample_<SampleName> directories.
NOTEReads that were identified as sample prep controls in the control files are notsaved in the FASTQ files.
NamingIllumina FASTQ files use the following naming scheme:
<sample name>_<barcode sequence>_L<lane (0-padded to 3
digits)>_R<read number>_<set number (0-padded to 3
digits>.fastq.gz
For example, the following is a valid FASTQ file name:NA10831_ATCACG_L002_R1_001.fastq.gz
In the case of non-multiplexed runs, <sample name> will be replaced with the lanenumbers (lane1, lane2, ..., lane8) and <barcode sequence> will be replaced with"NoIndex".
Set SizeThe FASTQ files are divided in files with the file size set by the --fastq-cluster-countcommand line option of configureBclToFastq.pl.The different files are distinguished bythe 0-padded 3-digit set number.
TIPIf you need to generate one unique fastq gzipped file for use in a third-partytool, you can set the --fastq-cluster-count option to -1
CompressionFASTQ files are saved compressed in the GNU zip format, an open source filecompression program. This is indicated by the .gz file extension. CASAVAautomatically unzips the files before using them.
FormatEach entry in a FASTQ file consists of four lines:} Sequence identifier} Sequence} Quality score identifier line (consisting of a +)} Quality scoreEach sequence identifier, the line that precedes the sequence and describes it, needs tobe in the following format:
@<instrument>:<run number>:<flowcell ID>:<lane>:<tile>:<x-
pos>:<y-pos> <read>:<is filtered>:<control number>:<index
sequence>
The elements are described below.

BclConversionandDem
ultiplexing
40 Part # 15011196 RevC
Element Requirements Description@ @ Each sequence identifier line starts with @<instrument> Characters allowed:
a-z, A-Z, 0-9 andunderscore
Instrument ID
<run number> Numerical Run number on instrument<flowcell
ID>
Characters allowed:a-z, A-Z, 0-9
<lane> Numerical Lane number<tile> Numerical Tile number<x_pos> Numerical X coordinate of cluster<y_pos> Numerical Y coordinate of cluster<read> Numerical Read number. 1 can be single read or read 2 of
paired-end<is
filtered>
Y or N Y if the read is filtered, N otherwise
<control
number>
Numerical 0 when none of the control bits are on, otherwise itis an even number
<index
sequence>
ACTG Index sequence
An example of a valid entry is as follows; note the space preceding the read numberelement:
@EAS139:136:FC706VJ:2:5:1000:12850 1:Y:18:ATCACG
AAAAAAAAAAAAAAAAAAAAAAAAAAAAAAAAAAAA
+
BBBBCCCC?<A?BC?7@@???????DBBA@@@@A@@
NOTECASAVA 1.8.2 FASTQ files contain only reads that passed filtering. If youwant all reads in a FASTQ file, use the --with-failed-reads option.
Quality ScoresA quality score (or Q-score) expresses an error probability. In particular, it serves as aconvenient and compact way to communicate very small error probabilities.Given an assertion, A, the probability that A is not true, P(~A), is expressed by a qualityscore, Q(A), according to the relationship:
Q(A) =-10 log10(P(~A))
where P(~A) is the estimated probability of an assertion A being wrong.The relationship between the quality score and error probability is demonstrated withthe following table:
Quality score,Q(A)
Error probability,P(~A)
10 0.120 0.0130 0.001
Quality Scores EncodingQuality scores are encoded into a compact form in FASTQ files which uses only onebyte per quality value. In this encoding the quality score is represented as the character

BclC
onversio
nOutp
utFolder
CASAVA v1.8.2 User Guide 41
with an ASCII code equal to its value + 33, as of CASAVA 1.8. The following tabledemonstrates the relationship between the encoding character, the character's ASCIIcode, and the quality score represented.
WARNINGQuality score encoding schemes in previous version of CASAVA used anIllumina-specific offset value of 64.
Symbol ASCIICode
Q-Score
Symbol ASCIICode
Q-Score
Symbol ASCIICode
Q-Score
! 33 0 / 47 14 = 61 28
" 34 1 0 48 15 > 62 29
# 35 2 1 49 16 ? 63 30
$ 36 3 2 50 17 @ 64 31
% 37 4 3 51 18 A 65 32
& 38 5 4 52 19 B 66 33
' 39 6 5 53 20 C 67 34
( 40 7 6 54 21 D 68 35
) 41 8 7 55 22 E 69 36
* 42 9 8 56 23 F 70 37
+ 43 10 9 57 24 G 71 38
, 44 11 : 58 25 H 72 39
- 45 12 ; 59 26 I 73 40
. 46 13 < 60 27
Table 1 ASCII Characters Encoding Q-scores 0–40
Read Segment Quality Control MetricA number of factors can cause the quality of base calls to be low at the end of a read.For example, phasing artifacts can degrade signal quality in some reads, and theaffected portions of these reads have high error rates and unreliable base calls.Typically, the increase in phasing causes quality scores to be low in these regions, andthus these unreliable bases are scored correctly.However, the occurrence of phasing artifacts may not always correlate with segments ofhigh miscall rates and biased base calls, and therefore these low quality segments arenot always reliably detected by our current quality scoring methods. We therefore markall reads that end in a segment of low quality, even though not all marked portions ofreads will be equally error prone.The read segment quality control metric identifies segments at the end of reads that mayhave low quality, and unreliable quality scores. If a read ends with a segment of mostlylow quality (Q15 or below), then all of the quality values in the segment are replacedwith a value of 2 (encoded as the letter # in Illumina's text-based encoding of qualityscores), while the rest of the quality values within the read remain unchanged. We flagthese regions specifically because the initially assigned quality scores do not reliablypredict the true sequencing error rate. This Q2 indicator does not predict a specific errorrate, but rather indicates that a specific final portion of the read should not be used infurther analyses.This is not a read-level filter; the occurrence of consecutive Q2 values in a read does notindicate that the read itself is unreliable, but rather that only the base calls flagged with

BclConversionandDem
ultiplexing
42 Part # 15011196 RevC
Q2 are unreliable. Note, however, that these regions are included in the Gerald error ratecalculations for aligned reads. In typical sequencing runs, most reads are reliable overtheir entire length, and are not marked with Q2 indicators. Of the reads that are markedwith the Q2 indicator, most are flagged only in the final few cycles.
Demultiplex_Stats FileThe Demultiplex_Stats.htm file provides stats about demultiplexing and shows wheresamples are saved in the directory structure. The Demultiplex_Stats file is located in theUnaligned/Basecall_Stats_FCID directory.The file contains the sample information from the sample sheet, with added rows forreads that end up in the Undetermined_indices directory. If no sample sheet exists,CASAVA generates rows for each lane. The Demultiplex_Stats file has a number ofadditional columns that display demultiplexing stats and show the directory thesamples are saved in. The Demultiplex_Stats file contains the following fields:
Field DescriptionLane Positive integer, indicating the lane number (1-8)SampleID ID of the sampleSampleRef The reference sequence for the sampleIndex Index sequenceDescription Description of the sampleControl Y indicates this lane is a control lane, N means sampleProject The project the sample belongs to# Reads Number of reads, equals (total number of lines in fastq files)/4Yield The sum of all bases in clusters that passed filtering for the entire project.% PF The percentage of clusters that passed filtering.% of Lane Percentage of reads in the sample compared to total number of reads in
that lane.% Perfect IndexReads
Percentage of index reads in this sample which perfectly matched thegiven index.
% One MismatchReads (Index)
Percentage of index reads in this sample which had 1 mismatch to givenindex.
% of >=Q30 Bases Yield of bases with Q30 or higher from clusters passing filter divided bytotal yield of clusters passing filter.
Mean Quality Score The total sum of quality scores of clusters passing filter divided by totalyield of clusters passing filter.
Recipe Recipe used during sequencingOperator Name or ID of the operatorDirectory Full path to the directory.
Below the sample information are links to the IVC plots and BustardSummary.xml file.For a description of the data, see DemultiplexedBustardSummary.xml File on page 43.
Finding Demultiplexed SamplesThe key to finding the location of demultiplexed data is looking at the Demultiplex_Stats.htm file in the BaseCalls_Stats directory. The Directory column will indicate theproject/sample output directory. The FASTQ files within the directory contain the indexand lane as part of the name. Alternatively it can be inferred from the project name andthe sample id as described in FASTQ Files on page 39.

BclC
onversio
nOutp
utFolder
CASAVA v1.8.2 User Guide 43
DemultiplexedBustardSummary.xml FileThe DemultiplexedBustardSummary.xml file contains five types of tables withoverviews of quality metrics (described below).
NOTEIn the descriptions of the tables included in the BustardSummary.xml file, theterms chip and flow cell are used interchangeably.
Chip SummaryThe Chip Summary contains the instrument ID and the run folder. The Chip ID field isa placeholder that currently has a value of “unknown.”
Chip Results SummaryThis table displays a summary of chip-wide performance statistics for the run:} The original number of detected clusters.} The number of clusters that passed quality filtering.} The flow cell (chip) yield in Mb. This is the sum of the quality-filtered bases usedfor analysis over analyzed lanes.
Lane Results SummaryThis table displays basic data quality metrics for each lane. Apart from Lane Yield,which is the total value for the lane, all the statistics are given as means and standarddeviations over the tiles used in the lane.} Clusters (raw)—The number of clusters detected by RTA image analysis.} Clusters (PF)—The number of detected clusters that meet the filtering criterion.} First Cycle Int (PF)—The average of the four intensities (one per channel or basetype) measured at the first cycle averaged over filtered clusters.
} % Intensity after 20 cycles (PF)—The corresponding intensity statistic at cycle 20 asa percentage of that at the first cycle.
} % PF Clusters—The percentage of clusters passing filtering.
Expanded Lane SummaryThis displays more detailed quality metrics for each lane. Apart from the phasing andprephasing information (which display values for an entire lane), all values are tilemeans for the lane.} Clusters (tile mean) (raw)—The number of clusters detected by RTA of images.} % Phasing—The estimated (or specified) value used by RTA for the percentage ofmolecules in a cluster for which sequencing falls behind the current position (cycle)within a read.
} % Prephasing—The estimated value used by RTA for the percentage of moleculesin a cluster for which sequencing jumps ahead of the current position (cycle) withina read.
} % Retained—The percentage of clusters that passed filtering.} Cycle 2-4 Av Int (PF)—The intensity averaged over cycles 2, 3, and 4 for clustersthat passed filtering.
} Cycle 2-10 Av % Loss (PF)—The average percentage intensity drop per cycle overcycles 2–10, derived from a best fit straight line for log intensity versus cyclenumber.

BclConversionandDem
ultiplexing
44 Part # 15011196 RevC
} Cycle 10-20 Av % Loss (PF)—The average percentage intensity drop per cycle overcycles 10–20, derived from a best fit straight line for log intensity versus cyclenumber.
Per-Tile StatisticsBelow the two types of lane summaries are per-tile statistics, grouped into a table foreach lane. The statistics are a subset of those in the Lane Results Summary, but arepresented as averages over the detected (raw) or passing-filter (PF) clusters inindividual tiles.In the event that no clusters in a tile pass filtering, all the statistics for that tile aredisplayed within square brackets. This suggests an exceptional situation (e.g., a bubble)within the tile. The brackets indicate that the tile has been excluded from the calculationof lane statistics and that the values are reported only for diagnostic purposes.
IVC PlotsThe BustardSummary.xml file provides a link to the Intensity versus Cycle (IVC) Plotsat the bottom of the page. These plots display lane averages over all tiles in a lane. Theplots displayed are All, Called, %Base_Calls, %All, and %Called.} All—This displays the mean intensity of clusters after adjustment for cross-talkbetween channels. The data is plotted as a function of cycle, and each channel (A,C, G, T) is plotted separately as a different colored line. Means are calculated overall clusters, regardless of base calling.If all bases are present in the sample at 25% of total and a well-balanced matrix isused for analysis, the graph displays all channels with similar intensities. Ifintensities are not similar, the results could indicate poor cross-talk correction orpoor absolute intensity balance between each channel.
} Called—This plot is similar to All, except means are calculated for each channelusing clusters that the base caller has called in that channel.If all bases are present in the sample at 25% with pure signal (zero intensity in thenon-called channels), the Called intensity is four times that of All, as the intensitiesare only averaged over 25% of the clusters. For impure clusters, the difference inintensity is less than four times that of All.The Called intensities are independent of base representation, so a well-balancedmatrix displays all channels with similar intensities.
} %Base_Calls—The percentage of each base called as a function of cycle. Ideally,this should be constant for a genomic sample, reflecting the base representation ofthe sample. In practice, later cycles often show some bases more than others. As thesignal decays, some bases may start to fall into the noise while others still riseabove it. Matrix adjustments may help to optimize data.
} %All and %Called—Exactly the same as All and Called, but expressed as apercentage of the total intensities. These plots make it easier to see changes inrelative intensities between channels as a function of cycle by removing anyintensity decay.
All Intensity PlotsThe BustardSummary.xml file provides a link to the All Intensity Plots at the bottom ofthe page. These plots give a tile-by-tile representation of the mean matrix-adjustedintensity of clusters plotted as a function of cycle. Each channel (A, C, G, T) is

BclC
onversio
nOutp
utFolder
CASAVA v1.8.2 User Guide 45
represented as a different colored line. Means are calculated over all clusters, regardlessof base calling.If all bases are present in the sample at 25% of total and a well-balanced matrix is usedfor analysis, the graph displays all channels with similar intensities. Dissimilarintensities could indicate poor cross-talk correction or poor absolute intensity balancebetween each channel. A genome rich in GC content may not provide a balanced matrixfor accurate cross-talk correction and absolute intensity balance.
NOTEFor large experiments, All.htm only shows a subset of tiles. However, each filecontains links to the full output results. The full output files may take some timeto open.

46 Part # 15011196 RevC

Chapter4
CASAVA v1.8.2 User Guide 47
Chapter 4 Sequence Alignment
SequenceAlignment
Introduction 48configureAlignment Input Files 50Running configureAlignment 55configureAlignment Output Files 75Running ELAND as a Standalone Program 87

Seq
uenceAlignm
ent
48 Part # 15011196 RevC
Introduction
The CASAVA module configureAlignment performs sequence alignments. This chapterdescribes running configureAlignment, parameters, analysis variables, configuration fileoptions, and ELANDv2e alignments.
NOTEFor installation instructions, see Requirements and Software Installation onpage 113.
Configuring configureAlignmentYou can define configureAlignment analysis parameters in a configuration file or in thecommand line. Command line arguments take precedence over parameters set in theconfiguration file. For a full description of analysis parameters and variables, seeconfigureAlignment Parameters Detailed Description on page 63.configureAlignment uses multiple analysis parameters. Therefore, it is recommended toinclude the parameters in a configuration file and provide that file as input toconfigureAlignment.
configureAlignment and Align As You GoBcl conversion supports alignment of the first read of a paired-end run beforecompletion of the run (align as you go). You can kick off alignment for read 1 using thetarget r1 when running make at any time after Bcl conversion for read 1 is complete.For instructions, see Starting Alignment for Read 1 on page 66.
configureAlignment OutputconfigureAlignment output is a flat text file called *_export.txt.gz containing each readand information about its alignment to the reference. In addition, configureAlignmentproduces statistics and diagnostic plots that can be used to assess data quality. Theseare presented in the form of html pages found in the Aligned output folder.As a result of running the configureAlignment.pl script, a new directory is created in therun folder. This directory is named using the format Aligned. If you want to rerun theanalysis and change parameters, you can rerun configureAlignment with newparameters if you specify a new alignment directory (OUT_DIR).CASAVA 1.8 also contains a script that converts *_export.txt files to SAM files (seeIntroduction on page 170 and SAM Format on page 171).
Alignment AlgorithmsCASAVA provides the alignment algorithm Efficient Large-Scale Alignment ofNucleotide Databases (ELAND). ELAND is very fast and should be used to match alarge number of reads against the reference genome.ELAND has been improved a number of times:} CASAVA 1.6 introduced a new version of ELAND, ELANDv2. The most importantimprovements of ELANDv2 are its ability to perform multiseed and gappedalignments.

Introductio
n
CASAVA v1.8.2 User Guide 49
} As of CASAVA 1.8 a new version of ELANDv2 is available, ELANDv2e. The mostimportant improvements of ELANDv2e are improved repeat resolution andimplementation of orphan alignment.
A short description of these improvements is provided below; more information aboutELANDv2 is available in Algorithm Descriptions on page 133.
ELANDv2The most important improvement of ELANDv2 are the following:} Handles indels and mismatches better by performing multiseed and gappedalignments.
} Enhanced match descriptor options to handle the gaps identified (see Export.txt.gzon page 81).
} Ability to split queries on a per tile basis now to allow for much greaterparallelization.
The hashing method in ELANDv2 has been optimized in CASAVA 1.7 for performance.This leads to a significant improvement in running times for the seed-matching step ofthe alignment in CASAVA. More information about ELANDv2 is available in on page133.
ELANDv2e Alignment ImprovementsCASAVA 1.8 features ELANDv2e. This updated alignment program includes thefollowing new features: Better repeat resolution A new orphan alignerShorter run timeswith a new version of alignmentResolver

Seq
uenceAlignm
ent
50 Part # 15011196 RevC
configureAlignment Input Files
The folder structure and format of configureAlignment input has changed significantlyin CASAVA 1.8. The major changes are as follows:} configureAlignment uses FASTQ files as sequence input.} Bcl conversion and demultiplexing are merged in one step, and both multiplexedand non-multiplexed samples need to be processed.
} The FASTQ files for both multiplexed and non-multiplexed samples are organizedusing the Project and Sample concepts, as governed by the sample sheet.
} configureAlignment uses the sample sheet to identify projects and samples, and thesample organization as described in the sample sheet should always match theactual Unaligned folder organization.
As a result of these changes, configureAlignment expects the following input files:} A Unaligned directory with fastq.gz files (even for cases where only one projectexists).
} A config.txt file, which specifies the analysis.} A base calling summary.xml file (DemultiplexedBustardSummary.xml).} A base calling config.xml file (DemultiplexedBustardConfig.xml).} A FASTA reference genome for alignments.} For RNA applications, additional files are required.This section explains these files. For file locations, see figure below. Note that thereference files may be located in a different location, depending on your CASAVAinstallation.

config
ureAlignm
entInp
utFiles
CASAVA v1.8.2 User Guide 51
Figure 11 Locations of configureAlignment Input Files
Sequence FilesconfigureAlignment needs a Unaligned directory as generated by BCL to FASTQconverter, which contains the gzipped sequence files ( *.fastq.gz files).
NOTEAs of CASAVA 1.8, configureAlignment uses FASTQ input files instead of *_qseq.txt files.
For a description of the FASTQ files, see FASTQ Files on page 39.

Seq
uenceAlignm
ent
52 Part # 15011196 RevC
Configuration FileThe configureAlignment configuration file (generally named config.txt) specifies whatanalysis should be done for each lane. The requirements and options for theconfigureAlignment configuration file are described in configureAlignment ConfigurationFile on page 56.
Sample SheetThe SampleSheet.csv file describes the samples and projects in each lane, including theindexes used. It is derived from the user generated sample sheet that is required for bclconversion and demultiplexing. The sample sheet should be located in the Unaligneddirectory of the run folder.The sample sheet has to match the directory structure created during the bcl conversionand demultiplexing. If you need to change the sample sheet, it is best to rerun the bclconversion and demultiplexing.
DemultiplexedBustardSummary.xmlThe DemultiplexedBustardSummary.xml file in the Unaligned directory contains theintensity summary results that are merged with configureAlignment's alignment resultsto produce Summary.xml and Summary.htm. The DemultiplexedBustardSummary.xmlfile is derived from the BustardSummary.xml file generated during base calling, butrenamed and moved by the BCL to FASTQ converter.
DemultiplexedBustardConfig.xml FileThe base calling configuration file (DemultiplexedBustardConfig.xml) in thedemultiplexed directory includes the start and end cycles of each read. TheDemultiplexedBustardConfig.xml file is derived from the Config.xml file generatedduring base calling, but renamed and moved by the BCL to FASTQ converter.
Reference GenomeCASAVA uses a reference genome in FASTA format. Both single sequence FASTA andmulti-sequence FASTA genome files are supported.Genome sequence files for most commonly used model organisms are available throughiGenome (Getting Reference Files on page 130).
NOTEAs of CASAVA 1.8, you do not need to squash the reference genomeanymore.
Single Sequence FASTA FilesCASAVA accepts single-sequence FASTA files as genome reference, which should beprovided unsquashed for both alignment and post-alignment steps. The chromosomename is derived from the file name.Direct CASAVA to a folder containing the FASTA files using the option ELAND_GENOMEfor configureAlignment.

config
ureAlignm
entInp
utFiles
CASAVA v1.8.2 User Guide 53
Multi-Sequence FASTA FilesAs of version 1.8, CASAVA accepts a multi-sequence FASTA file as genome reference.This should be provided as a single genome, SAM compliant, unsquashed file, for bothalignment and post-alignment steps. The chromosome name is derived directly fromthe first word in the header for each sequence.Direct CASAVA to a multi-sequence FASTA file using the option SAMTOOLS_GENOMEfor configureAlignment.
WARNINGGenomeStudio does not support the use of multi-sequence FASTA files.Therefore, if you want to analyze your output in GenomeStudio, werecommend using single sequence FASTA reference files.
Chromosome Naming RestrictionsCASAVA does not accept the following characters in the FASTA chromosome nameheader:
- ? ( ) [ ] / \ = + < > : ; " ' , * ^ | &
This validation can be disabled in configureAlignment using the following option:CHROM_NAME_VALIDATION off
WARNINGYou may run into problems with downstream analysis if you disablechromosome name validation.
NOTEIf ELAND finds two alignments with identical alignment scores, ELANDwillpick the first alignment (in the single-end case) or combination of alignments(in the paired-end case) that exhibit the highest observed alignment quality.These are the alignments that make it into the export files (which onlycontain the best alignment for each read). In practice, post-alignmentCASAVA ignores these reads because of the low alignment qualities.Using areference with lexicographic chromosome names (like chr1) will yieldslightly different results compared to a reference with numericalchromosome names (like 1) for these reads, since the hits are sorted in adifferent way.
Reference Sequence BlocksFor reasons of efficiency, ELAND treats the reference sequence as being in “blocks” of 16 MB, of which there can be at most 240. This limits the total length of DNA that ELANDcan match against in a single run.In a single ELAND run you can match against:} One file of at most 240 x 16=3824 MB} 239 files, each up to 16 MB in size} Something in between, such as 24 files of up to 160 MB each. (The NCBI humangenome will fit.)
Additional eland_rna Input FilesThe following additional files are needed for eland_rna:} refFlat.txt.gz or seq_gene.md.gz file—as of CASAVA 1.7, eland_rna uses therefFlat.txt.gz or seq_gene.md.gz file to generate the splice junction set automatically.

Seq
uenceAlignm
ent
54 Part # 15011196 RevC
The refFlat.txt.gz file is available from UCSC, while the seq_gene.md.gz file is fromNCBI. They should be provided gzip compressed, and should be from the samebuild as the reference files you are using for alignment. This negates the need toprovide separate splice junction sets as in earlier versions of CASAVA. Theparameter to use for either one is ELAND_RNA_GENOME_ANNOTATOTION.
WARNINGDo not change the names of the refFlat.txt.gz or seq_gene.md.gz file.CASAVA uses the name to determine the type of file.
} A set of contaminant sequences for the genome—typically the mitochondrial andribosomal sequences. These must be in single FASTA format. The parameter to useto direct to the contaminant sequence files is ELAND_RNA_GENOME_CONTAM.

Running
config
ureAlignm
ent
CASAVA v1.8.2 User Guide 55
RunningconfigureAlignment
When running configureAlignment, two concepts are important to understand: theconfigureAlignment configuration file that specifies analysis, and the make utility thatmanages the analysis.
configureAlignment Configuration FileconfigureAlignment uses a text-based configuration file containing all parametersrequired for alignment, visualization, and filtering. These parameters specify the type ofanalysis to perform, which bases to use for alignment, and the reference files for asequence alignment. Analysis can be specified by lane, index (barcode), sample,reference, or project.
Make UtilityconfigureAlignment is a collection of Perl scripts and C++ executables, and is managedby the “make” utility. The “make” utility is commonly used to build executables fromsource code and is designed to model dependency trees by specifying dependency rulesfor files. These dependencies are stored in a file called a makefile. TheconfigureAlignment.pl script is used to generate a makefile.config containing variabledefinitions which uses static makefiles as required. These static makefiles (including themain Makefile) have fixed content and so can be included in the distribution and donot have to be regenerated for every run.When running configureAlignment, the configureAlignment configuration file specifiesthe analysis, and the make utility manages that analysis.
Standard configureAlignment AnalysisThe standard way to run configureAlignment is to set the parameters in a configurationfile, create a makefile, and start the analysis with the “make” command.
1 Edit the configureAlignment configuration file as described in configureAlignmentConfiguration File on page 56.
2 Check the analysis by running the configureAlignment.pl command without --make./path-to-CASAVA/bin/configureAlignment.pl config.txt
--EXPT_DIR path_to_Unaligned_folder
3 Enter the configureAlignment.pl command, but now with --make. This creates themakefile for sequence alignment./path-to-CASAVA/bin/configureAlignment.pl config.txt
--EXPT_DIR path_to_Unaligned_folder --make
4 Move into the newly created Aligned folder under the Run folder (seeconfigureAlignment Output Files on page 75). Type the “make” command for basicanalysis:make
NOTEYou may prefer to use the parallelization option as follows:make -j 3 all

Seq
uenceAlignm
ent
56 Part # 15011196 RevC
The extent of the parallelization depends on the setup of your computer orcomputing cluster.For a description of parallellization, see Using Parallelization on page 121.
5 After the analysis is done, review the analysis.a View the analysis results of your run. See Analysis Summary on page 76 and
Analysis Results on page 81.b Interpret the run quality. See Interpretation of configureAlignment Run Quality on
page 85.
configureAlignment Configuration FileThis section describes the features and parameters of the configureAlignmentconfiguration text file.The configureAlignment configuration file specifies the analysis for each lane, sample,project, reference, or index (barcode). The configureAlignment configuration file is a textfile, and the path to the file should be the first argument after the configureAlignment.plcommand. configureAlignment translates the analysis in the configuration file into amakefile. The makefile specifies exactly what commands will be executed to carry outthe requested analysis.As part of the creation of the Aligned output folder, the configureAlignmentconfiguration file is copied to the Aligned output folder using the filename config.txt.Some sites use standard configuration files, which may be stored in a central repository.
Config File Parameter ListThe following tables list the parameters that can be specified in a configureAlignmentconfiguration file.The section configureAlignment Parameters Detailed Description on page 63 provides adetailed description of these parameters.
Core Parameters
Parameter DefinitionEXPT_DIR data/110113_ILMN-1_0217_
FC1234/Unaligned
Provide the path to the experiment (demultiplexed)directory in the run folder, if not specified on the commandline. Usually the output folder from the BCL to FASTQconverter. The path should always be to the Unaligneddirectory, even when the run only contains one projectFor a description of the run folder, see Bcl ConversionOutput Folder on page 37.
USE_BASES nY*n Ignore the first and last base of the read.The USE_BASES string contains a character for each cycle.• If the character is “Y”, the cycle is used for alignment.• If the character is “n”, the cycle is ignored.• Wild cards (*) are expanded to the full length of theread.
USE_BASES should not be used for masking custom indexcycles; use the --use-bases-mask option (Options for BclConversion and Demultiplexing on page 33).
Table 2 GERALD Configuration File Core Parameters

Running
config
ureAlignm
ent
CASAVA v1.8.2 User Guide 57
Parameter DefinitionDefault is USE_BASES Y*n, which means perform a single-read alignment and ignore the last base. For a detaileddescription of USE_BASES syntax, see USE_BASES Optionon page 64.
ELAND_GENOME /home/user/Genomes/
Eland/BAC_plus_vector/
Specify the single FASTA files that you want to use asgenome reference for alignment with ELANDv2e.
SAMTOOLS_GENOME Direct CASAVA to a multi-sequence FASTA reference file.ANALYSIS eland_extended Specify the type of alignment that should be performed.
Available options are:• ANALYSIS eland_extended
• ANALYSIS eland_pair
• ANALYSIS eland_rna
• ANALYSIS none
The default is ANALYSIS none
See ANALYSIS Variables on page 63 for more information.ELAND_FASTQ_FILES_PER_PROCESS N The maximum number of files analyzed by each ELAND
process, needed to ensure that the memory usage staysbelow 2 GB. The optimal value is such that there areapproximately 10 to 13 million lines (reads) in one set.Only available for ANALYSIS eland_extended, ANALYSISeland_pair, and ANALYSIS eland_rna.See ELAND_FASTQ_FILES_PER_PROCESS on page 65 formore information. Default value is 3.ANALYSIS Variableson page 63
WARNINGDefault for USE_BASES is Y*n, which means perform a single-readalignment and ignore the last base. If running ANALYSIS eland_pair, makesure to specify the USE_BASES option for two reads (for example USE_BASES Y*n,Y*n).
Optional Parameters
Parameter DefinitionSINGLESEED If SINGLESEED is set to --singleseed, ELANDv2e aligns only in
singleseed mode. Only available for ANALYSIS eland_extendedand ANALYSIS eland_pair, for which multiseed alignment isdefault.See ELANDv2 Algorithm Description on page 135 for moreinformation.
UNGAPPED If UNGAPPED is set to --ungapped, ELANDv2e aligns only inungapped mode.See ELANDv2 Algorithm Description on page 135 for moreinformation.
INCREASED_SENSITIVITY If you specify INCREASED_SENSITIVITY--sensitive,ELANDv2e aligns in full repeat mode. Semi-repeat resolutionalignment is default.You can also use --INCREASED_SENSITIVITY=--sensitive on thecommand line.See Repeat Resolution on page 139 for more information.
Table 3 configureAlignment Configuration File Optional Parameters

Seq
uenceAlignm
ent
58 Part # 15011196 RevC
Parameter DefinitionOUT_DIR Path to configureAlignment output. The path must be to a
directory not already present.Defaults to <run_folder>/AlignedNote that there can be only one Aligned directory by default. Ifyou want multiple Aligned directories, you will have to use thisoption to generate a different output directory.
DATASET_POST_RUN_COMMAND
/yourPath/yourCommand yourArgs
Allows user-defined scripts to be run after all configureAlignmenttargets have been built. Invoked per barcode-lane for multiplexedsamples, per lane for non-multiplexed samples.See also Using DATASET_POST_RUN_COMMAND on page 68.
EMAIL_LIST [email protected]
EMAIL_SERVER mailserver
EMAIL_DOMAIN example.com
Send a notification to the user at the end of an analysis run.For more information on email notification, see Setting Up EmailReporting on page 118.
WEB_DIR_ROOT
file://server.example.com/share
NUM_LEADING_DIRS_TO_STRIP
Include hyperlinks with a specific prefix to the run folder.
Specifies the number of directories to strip from the start of thefull run folder path before prepending the WEB_DIR_ROOT
ELAND_RNA_GENOME_CONTAM Points to the folder containing a set of contaminant sequences forthe genome—typically the mitochondrial and ribosomalsequences. The files must be in single FASTA format.
ELAND_RNA_GENOME_ANNOTATION Path to transcripts mapping to the genome (refFlat.txt.gz or seq_gene.md.gz ). See also Using ANALYSIS eland_rna on page 72.
ELAND_RNA_GENE_MD_GROUP_LABEL The group label above specifies which assembly to use in the seq_gene file, and is found in column 13 of the file. seq_gene files canhold entries for multiple assemblies.Example: ELAND_RNA_GENE_MD_GROUP_LABEL GRCh37.p2-
Primary Assembly.KAGU_PARAMS KAGU_PARAMS passes options to the alignmentResolver
through the configureAlignment configuration file.For additional information, see KAGU_PAIR_PARAMS andKAGU_PARAMS on page 67.
Paired-End Analysis Options
Parameter DefinitionANALYSIS
eland_pair
Use the paired-end alignment mode of ELANDv2e to align paired reads against a target.
USE_BASES
Y*,nY*n
Use all bases of the first read and ignore the first and last base of the second read.
6:USE_BASES
nY25
Ignore the first base on both the first and second read of lane 6; use 25 bases each andignore any other bases for lane 6 only.
KAGU_PAIR_
PARAMS
KAGU_PAIR_PARAMS passes options for paired-end runs to the alignmentResolverthrough the configureAlignment configuration file.For additional information, see KAGU_PAIR_PARAMS and KAGU_PARAMS on page67.
Table 4 configureAlignment Configuration File Paired-End Analysis Options
For more information on USE_BASES syntax, see USE_BASES Option on page 64.

Running
config
ureAlignm
ent
CASAVA v1.8.2 User Guide 59
Specifying AnalysisAnalysis can be specified by project, reference, sample, index, or lane, which isexplained in this section.
Lane-Specific AnalysisBy adding the lane number(s) followed by colon in front of an analysis option, you statethat the analysis option is only for samples from that lane. The lane number is onlyvalid for the configureAlignment settings on that same line.For example, 567:ANALYSIS eland_extended tells configureAlignment that eland_extended should be run on samples from lane 5, 6, and 7.
Sample-Specific AnalysisThe config.txt file has some keywords that enable you to specify analysis for project,reference, sample, or index: PROJECT, REFERENCE, SAMPLE, and BARCODE. Thesekeywords refer to the SampleProject, SampleRef, SampleID, and Index specified in thesamplesheet.csv file located in the Unaligned directory of the run folder.Lines starting with PROJECT, REFERENCE, SAMPLE, and BARCODE override anydefault settings specified in the config.txt file, but only for those samples for which theSampleProject, SampleRef, SampleID, or Index matches the PROJECT, REFERENCE,SAMPLE, or BARCODE. The override is only valid for the configureAlignment settingson that same line.
Example Sample-Specific AnalysisFor example ,if the config.txt file describes the following analysis:
ANALYSIS eland_rna
REFERENCE human ANALYSIS eland_pair
with the following sample sheet:
FCID Lane SampleID
SampleRef
Index Descrip-tion
Control Recipe Operator SampleProject
12345AAXX 1 sample1 human ATCACG desc1 N R1 name Proj112345AAXX 1 sample2 human CGATGT desc2 N R1 name Proj112345AAXX 2 sample3 rat TTAGGC desc3 N R1 name Proj212345AAXX 2 sample4 mouse TGACCA desc4 N R1 name Proj3
then this will initiate an eland_pair analysis for all human samples (sample1 andsample2), and use the global analysis eland_rna for all other samples (sample3 andsample4). This allows you to set the analysis, reference genome, and all other ELANDparameters project by project, or reference by reference, or sample by sample, or barcodeby barcode.
Combining SpecificityIt is also possible to combine specific analyses, like in this example:
12: REFERENCE human ANALYSIS eland_pair
which tells configureAlignment to perform eland_pair analysis on the human referencesamples from lanes 1 and 2.

Seq
uenceAlignm
ent
60 Part # 15011196 RevC
PriorityIf multiple specific settings conflict, configureAlignment uses the following order ofpriority:
1 PROJECT
2 REFERENCE
3 SAMPLE
4 BARCODE
5 Lane
6 Global settingsThis means, PROJECT settings override any other settings, while REFERENCE settingscan only be overruled by PROJECT settings, and so on.
WARNINGThe attribute cannot be set for more than one scope at a time. In otherwords the following is not allowed:PROJECT test BARCODE ACGT ANALYSIS eland_extended
Additional ExamplesSome more examples are listed below:} Standard flow-cell-level variables
USE_BASES y*,y*
CHROM_NAME_VALIDATION off
ANALYSIS eland_rna
ELAND_FASTQ_FILES_PER_PROCESS 2
} Flow-cell-level ELAND_GENOME variable set for all data sets with ReferenceHumanNCBI37ELANDREFERENCE HumanNCBI37ELAND ELAND_GENOME
/home/user/genomes/archive/UCSChg18/fasta
} Flow-cell-level SAMTOOLS_GENOME variable set for all data sets with ReferenceAMPLICONS180111JRB_ELANDREFERENCE AMPLICONS180111JRB_ELAND SAMTOOLS_GENOME
/home/user/genomes/AMPLICONS180111JRB/AMPLICONS180111JRB.fa
} Flow-cell-level SAMTOOLS_GENOME variable set for all data sets with ReferenceTSC1_ELANDREFERENCE TSC1_ELAND SAMTOOLS_GENOME
/illumina/user/TSC1/TSC1.fa
} Overrides global ANALYSIS with eland_extended if the reference is TSC1_ELANDREFERENCE TSC1_ELAND ANALYSIS eland_extended
} If the reference is unknown (default for Undetermined barcode data sets), sets theanalysis to none. Only affects lanes 1,2,3 and 41234:REFERENCE unknown ANALYSIS none
} Alternative way of ensuring Undetermined barcode data sets do not get aligned.Only affects lanes 5,6,7 and 85678:BARCODE Undetermined ANALYSIS none

Running
config
ureAlignm
ent
CASAVA v1.8.2 User Guide 61
Specific ScenariosBelow a number of scenarios are written out, assuming SampleSheet.csv has twoprojects: idxProj and noIdxProj} Analyze only data for idxProj, not noIdxProj.• Disable analysis by default:ANALYSIS none
• Then the following analysis specifiations only affect sample sheet entries thathave idxProj as their project field:
PROJECT idxProj ANALYSIS eland_pair
PROJECT idxProj USE_BASES Y*n,Y*n
PROJECT idxProj ELAND_GENOME x/y/z/G1
} Align only PhiX of idxProj, assuming there are 2 references for idxProj (hum andPhiX).• Disable analysis by default so that anything not explicity described is notanalysed:
ANALYSIS none
• Disable analysis for noIdxProj. This will take priority over REFERENCE-scopeattributes below:
PROJECT noIdxProj ANALYSIS none
• Set REFERENCE-scope variables so that when the data belongs to PhiX, theyhave an effect ( noIdxProj will not be analysed as PROJECT-scope has higherpriority):
REFERENCE phix ANALYSIS eland_pair
REFERENCE phix USE_BASES Y*n,Y*n
REFERENCE phix ELAND_GENOME x/y/z/GP
} Align only human for Lane 2, assuming 2 references for idxProj (human, PhiX).• Disable analysis by default so that anything not explicitly described is notanalysed
ANALYSIS none
Notice that everything below is set only for lane 2 so the rest of the data has'ANALYSIS none' from above.
• Disable analysis for noIdxProj. This will take priority over REFERENCE - scopeattributes below
2: PROJECT noIdxProj ANALYSIS none
• Set REFERENCE-scope variables so that when the data belongs to PhiX, theyhave an effect(noIdxProj will not be analysed as PROJECT-scope has higherpriority).
2: REFERENCE hum ANALYSIS eland_pair
2: REFERENCE hum USE_BASES Y*n,Y*n
2: REFERENCE hum ELAND_GENOME x/y/z/GH
Samples Without IndexUnless otherwise specified in the sample sheet, samples without index will end up inthe project folder Undetermined_indices, and in a sample folder named after the lane(e.g. Sample_lane1).If you want to specify analysis for these samples without index other than the globalanalysis, you can use identifiers PROJECT Undetermined_indices or SAMPLE lane1.

Seq
uenceAlignm
ent
62 Part # 15011196 RevC
NOTENormally you would want to use:PROJECT Undetermined_indices ANALYSIS none
orREFERENCE unknown ANALYSIS none
to avoid wasting CPU time on the Undetermined_indices data, which often isof poor quality.
Config.txt ExamplesThe configureAlignment configuration file (generally named config.txt) specifies whatanalysis should be done for each lane. Some examples for DNA Sequencing analysis areshown below:
Assignment by LaneIf you want to:} Use as reference single FASTA files from human genome build hg18 in your<GenomesFolder>
} Align paired-end data from lanes 1, 2, and 3} Use all bases except the last one for both readsGenerate the following config.txt file:
ELAND_GENOME <GenomesFolder>/iGenomes/Homo_
sapiens/UCSC/hg18/Sequence/Chromosomes
123:ANALYSIS eland_pair
123:USE_BASES y*n,y*n
Assignment by PROJECTIf you instead want to align the samples from your project named Project1, generate thefollowing config.txt file:
ELAND_GENOME <GenomesFolder>/iGenomes/Homo_
sapiens/UCSC/hg18/Sequence/Chromosomes
PROJECT Project1 ANALYSIS eland_pair
PROJECT Project1 USE_BASES y*n,y*n
Assignment by SAMPLEIf you just want to align the samples from your sample named Sample1, generate thefollowing config.txt file:
ELAND_GENOME <GenomesFolder>/iGenomes/Homo_
sapiens/UCSC/hg18/Sequence/Chromosomes
SAMPLE Sample1 ANALYSIS eland_pair
SAMPLE Sample1 USE_BASES y*n,y*n
Assignment by REFERENCEIf you want to align the samples assigned to a human reference in the sample sheet,generate the following config.txt file:
ELAND_GENOME <GenomesFolder>/iGenomes/Homo_
sapiens/UCSC/hg18/Sequence/Chromosomes
REFERENCE human ANALYSIS eland_pair
REFERENCE human USE_BASES y*n,y*n

Running
config
ureAlignm
ent
CASAVA v1.8.2 User Guide 63
The requirements and options for the configureAlignment configuration file aredescribed in configureAlignment Configuration File on page 56.
Full-Size ExampleA full-sized example of a config.txt is shown below:
123456: ANALYSIS eland_pair
78: ANALYSIS eland_rna
ELAND_GENOME /data/pipeline_in/genomes/human/hg19_fasta/
123456: USE_BASES Y*n,Y*n
78: USE_BASES Y50n*,n*
REFERENCE human ELAND_GENOME /data/pipeline_in/genomes/human/hg19_
fasta/
REFERENCE human ELAND_RNA_GENOME_ANNOTATION /data/pipeline_
in/genomes/human/humanrefflat/refFlat.txt.gz
REFERENCE human ELAND_RNA_GENOME_CONTAM /data/pipeline_
in/genomes/human/contams_fasta/
REFERENCE phix ANALYSIS eland_pair
REFERENCE phix ELAND_GENOME /data/pipeline_in/genomes/phi/
configureAlignment Parameters Detailed DescriptionconfigureAlignment can be run in various analysis modes. Customize your analysis byspecifying variables, parameters, and options.
ANALYSIS VariablesSet the ANALYSIS variable to define the type of analysis you want to perform for eachlane. The various analysis modes include default, eland_extended, eland_pair, eland_rna, and none. You can mix and match analyses between lanes.
Variable AlignmentProgram
Application Description
ANALYSIS eland_
extended
ELANDv2 Single reads Aligns single-read data reads against a target usingELANDv2e alignments.• Works well with reads > 32 bases• Each alignment is given a confidence value basedon its base quality scores
• A single file of sorted alignments is produced foreach lane
For a detailed description, see configureAlignmentInput Files on page 50.
ANALYSIS eland_pair ELANDv2 Paired reads Aligns paired-end reads against a target usingELANDv2 alignments. A single-read alignment isdone for each half of the pair, and then the best-scoring alignments are compared to find the bestpaired-read alignment. For a detailed description, seeUsing ANALYSIS eland_pair on page 71.
Table 5 ANALYSIS Variables

Seq
uenceAlignm
ent
64 Part # 15011196 RevC
Variable AlignmentProgram
Application Description
ANALYSIS eland_rna ELANDv2 Single reads Aligns each read against a large reference genome,splice junctions, and contaminants using ELANDv2e.For more information on ELAND_rna, see UsingANALYSIS eland_rna on page 72.
ANALYSIS none None Anyapplication
Omits the indicated lane from the analysis.Setting the parameter 8:ANALYSIS none ignores lane 8.
WARNINGDefault for USE_BASES is Y*n, which means perform a single-readalignment and ignore the last base. If running ANALYSIS eland_pair, makesure to specify the USE_BASES option for two reads (for example Y*n,Y*n).
USE_BASES OptionThe USE_BASES option identifies which bases of a full read produced by a sequencingrun should be used for the alignment analysis. A fully expanded USE_BASES value is astring with one character per sequencing cycle but more compact formats can be usedas described in USE_BASES Option on page 64. Each character in the string identifieswhether the corresponding cycle should be aligned. The following notation is used:} A lower-case “n” means ignore the cycle.
NOTEPrephasing correction cannot be applied to the last base, since you need toknow the next base in the sequence. Thus there will be a minor errorincrease at the last base. Ignoring the last base from the sequence analysiscan reduce alignment errors somewhat.For this reason Illumina recommends that if 'n' bases of sequence aredesired, 'n+1' cycles should be run.
} An upper-case “Y” means use the cycle for the alignment.} A comma (,) denotes a read boundary used for multiple reads.} An asterisk (*) means “fill up the read as far as possible with the precedingcharacter.”
} A number means that the previous character is repeated that many times.Unspecified cycles are set to “n” by default. If USE_BASES is not specified at all,every cycle is used for the alignment.
} Note that the symbol "I" for indexing is no longer accepted syntax for USE_BASES.NOTEDefault is USE_BASES Y*n, which means perform a single-read alignmentand ignore the last base. If running ANALYSIS eland_pair, make sure tospecify the USE_BASES option for two reads (for example USE_BASESY*n,Y*n).
The following table describes examples of USE_BASES options.
Option DefinitionUSE_BASES nYYY Ignore the first base and use bases 2–4.USE_BASES Y30 Align the first 30 bases.USE_BASES nY30 Ignore the first base and align the next 30 bases.USE_BASES nY30n Ignore the first base, align the next 30 bases, and ignore the last base.
Table 6 USE_BASES Options

Running
config
ureAlignm
ent
CASAVA v1.8.2 User Guide 65
Option DefinitionUSE_BASES nY*n Ignore the first base, perform a single read alignment, and ignore the last
base.The length of read is automatically set to the number of sequencing cyclesminus two.
USE_BASES Y*n This means perform a single-read alignment and ignore the last base.Default for single-read alignment.
USE_BASES Y*n,Y*n Perform a paired read alignment but ignore the last base of each read,resulting in the length of each read being set to the number of sequencingcycles associated with it minus one. The two reads do not need to be of thesame length.
USE_BASES nY*,nY* Ignore the first base of each read and perform a paired read alignment,resulting in the length of each read being set to the number of sequencingcycles associated with it minus one. The two reads do not need to be of thesame length.
USE_BASES nY* This means ignore the first base and perform a single-read alignment.USE_BASES n*,Y*n Ignore the first read and perform a single-read alignment with the second
read, ignoring the last base.USE_BASES Y*n,n* Perform a single-read alignment with the first read, ignoring the last base,
and ignore the second read.
ELAND_FASTQ_FILES_PER_PROCESSCASAVA requires a minimum of 2 GB RAM per core. The parameter ELAND_FASTQ_FILES_PER_PROCESS (optional) in the configureAlignment config.txt specifies themaximum number of FASTQ files aligned by each ELAND process, to limit the per-corememory consumption.
NOTEELAND_FASTQ_FILES_PER_PROCESS supersedes the ELAND_SET_SIZEparameter used in CASAVA 1.7 and earlier.
The optimal value leads to approximately 10 to 13 million clusters in one set. Since theFASTQ file size (in reads) is determined by the Bcl conversion option --fastq-cluster-count , while the maximum number of files per process is determined by ELAND_FASTQ_FILES_PER_PROCESS, the product of these options should not exceed 16million:(ELAND_FASTQ_FILES_PER_PROCESS value) × (--fastq-cluster-count value) ≤16 million
NOTEThe --fastq-cluster-count used during Bcl conversion can be found inUnaligned/Makefile.
See the table below for set size - cluster count combinations.CAUTIONSetting the right value for the ELAND_FASTQ_FILES_PER_PROCESS is veryimportant. Too high may result in silent crashes due to too high memoryutilization, and should be avoided. Too low may result in a decreasedperformance. Use is optional, and we generally recommend using defaultvalues.
--fastq-cluster-count
ELAND_FASTQ_FILES_PER_PROCESS
Reads perprocess
Comment
12 000 000 1 120000006 000 000 2 12000000

Seq
uenceAlignm
ent
66 Part # 15011196 RevC
--fastq-cluster-count
ELAND_FASTQ_FILES_PER_PROCESS
Reads perprocess
Comment
4 000 000 3 12000000 Default values3 000 000 4 120000002 000 000 6 120000001 000 000 12 12000000
NOTESlight differences can be expected when using different combinations of --fastq-cluster-count and ELAND_FASTQ_FILES_PER_PROCESS.
The --fastq-cluster-count used during Bcl conversion can be found inUnaligned/Makefile.
Make OptionThe --make option creates Aligned output directories and makefiles. Without the option,configureAlignment.pl will not create any directories and files and only operates in adiagnostic mode. You must specify this option to generate the Aligned analysis folderand subsequently run the analysis.
Rerunning the AnalysisThe config.txt file used to generate an analysis is copied to the analysis folder so it canbe used by configureAlignment if a reanalysis of the same data is required.
Parallelization SwitchIf your system supports automatic load-sharing to multiple CPUs, you can parallelizethe analysis run to <n> different processes by using the “make” utility parallelizationswitch.
make all -j n
For more information on parallelization, see Using Parallelization on page 121.
Nohup CommandYou should use the Unix nohup command to redirect the standard output and keep the“make” process running even if your terminal is interrupted or if you log out. Thestandard output will be saved in a nohup.out file and stored in the location where youare executing the makefile. nohup.out can be used by Illumina Technical Support fortroubleshooting should problems arise
nohup make all -j n &
The optional “&” tells the system to run the analysis in the background,leaving you freeto enter more commands.
Starting Alignment for Read 1If you want to start alignment before completion of the run, use the makefile target r1.This can be started once Bcl conversion for read 1 has finished (Starting Bcl Conversionfor Read 1 on page 35).Set up a regular configureAlignment analysis, but run make using the r1 target, forexample:
nohup make -j 16 r1

Running
config
ureAlignm
ent
CASAVA v1.8.2 User Guide 67
NOTEthe -j <n> command line option is supported to indicate up to <n>processes in parallel.
Starting the Second ReadTo start alignment of the second read, use the regular "make" command in the Alignedfolder. Perform the following:
1 Move into the Aligned folder.
2 Type the regular “make” command:make -j n
KAGU_PAIR_PARAMS and KAGU_PARAMSThe parameters KAGU_PARAMS (for all runs) and KAGU_PAIR_PARAMS (for paired-end runs) pass options to the alignmentResolver through the configureAlignmentconfiguration file. For additional information, see configureAlignment Configuration Fileon page 56.The parameters can be specified lane-by-lane. All of the options must be specified on asingle line and space-separated, as in the following examples:
8:KAGU_PAIR_PARAMS --circular --muf 0
or8:KAGU_PARAMS --mmaq 4
The following tables describe the parameters.
Parameter Description--mmaq Minimum Mate Alignment Quality. Each read is given a single-read
alignment score.This is identical to the alignment score from an eland_extended analysis.If a read has a zero paired-read alignment score, but a single-readalignment score that exceeds this threshold, its alignment will still go inthe export.txt.gz files.If the alignments of the two reads can not be paired (resulting in a zeropaired score) and only one of the reads has an alignment exceeding --min-single-read-alignment-score, the read pair is treated as a singleton.The alignment of the orphan read is unreliable enough to be ignored.The default value is 4.
Table 7 Parameters for KAGU_PAIR_PARAMS and KAGU_PARAMS
Parameter Description--circular This causes alignmentResolver to treat each chromosome as circular and
not linear, enabling it to detect valid pairings that “wrap around” whenthe two alignments are mapped onto the linear representation of thechromosome.--circular=my_mitochondria_file.faTreat alignments to my_mitochondria_file.fa as circular but otherchromosomes as linear (as you might want to do when e.g. aligning tothe whole human genome)
Table 8 Parameters for KAGU_PAIR_PARAMS Only

Seq
uenceAlignm
ent
68 Part # 15011196 RevC
Parameter Description--muf Minimum percentage of Unique Fragments. A unique pair is defined as a
read pair such that its constituent reads can each be aligned to a uniqueposition in the genome without needing to make use of the fact that theyare paired.alignmentResolver works in a two-pass fashion:1. On the first pass it looks for all clusters that pass the quality filter andhave a unique alignment of each of their two reads, then uses thisinformation to determine the nominal insert size distribution and therelative orientation of the two reads.
2. On a second pass this information is used to resolve repeats and otherambiguous cases.
The number of unique pairs, expressed as a percentage of the totalnumber of non-orphaned clusters passing filters, must exceed a certainnumber, set as decimal (for example, --muf 0.1). Otherwise, no pairing isattempted and the two reads are effectively treated as two sets of singlereads.• By default, this threshold is set to 0• For some applications it may be useful to switch off the pairingcompletely by specifying --muf 1.0
--mcf Minimum percentage of Consistent Fragments, set as set as decimal (forexample, --mcf 0.6). Of the unique pairs, the vast majority should havethe same orientation with respect to each other. If they don't, it isindicative of the following problems:• Sample prep• A reference sequence is extremely diverged from the sample data
In such cases, no pairing is attempted and the two reads are effectivelytreated as two sets of single reads.By default, the threshold for this parameter is set to 0.7
--mfaq Minimum Fragment Alignment Quality. For each cluster, all possiblepairings of alignments between the two reads are compared. This is thescore of the best one. Since we are considering the two reads as onefragment, both reads in a cluster get the same paired-read alignmentscore.The alignment score is nominally on a Phred scale. However, it isprobably not safe to assume the calibration is perfect. Nevertheless, it is agood discriminator between good and bad alignments. The score mustexceed this threshold to go in the export.txt.gz file.The default value is 4.
Using DATASET_POST_RUN_COMMANDDATASET_POST_RUN_COMMAND will be invoked at completion of DATASETalignment, and may be constructed of a single or multiple shell calls (for latter,separated by semicolon ;). Following variables, derived from SampleSheet, will beavailable (please use brackets properly): $(project) $(sample) $(barcode) $(lane).Assuming we use the following SampleSheet:
FCID,Lane,S-
ampleID,SampleRef,Index,Description,Control,Recipe,Operator,Project
B809UWABXX-1TILE-DMX,1,human1,human,GCCAAT,myTest,N,32+7,CB,testPRC1
B809UWABXX-1TILE-DMX,1,human1,human,CTTGTA,myTest,N,32+7,CB,testPRC2
B809UWABXX-1TILE-DMX,1,phix1,phix,TTAGGC,myTest,N,32+7,CB,testPRC1
B809UWABXX-1TILE-DMX,2,human1,human,GCCAAT,myTest,N,32+7,CB,testPRC1
B809UWABXX-1TILE-DMX,2,phix2,phix,TTAGGC,myTest,N,32+7,CB,testPRC2

Running
config
ureAlignm
ent
CASAVA v1.8.2 User Guide 69
B809UWABXX-1TILE-DMX,3,human1,human,TGACCA,myTest,N,32+7,CB,testPRC1
B809UWABXX-1TILE-DMX,4,phix4,phix,TTAGGC,myTest,N,32+7,CB,testPRC3
B809UWABXX-1TILE-DMX,5,human1,human,TGACCA,myTest,N,32+7,CB,testPRC1
B809UWABXX-1TILE-DMX,5,human5,human,GCCAAT,myTest,N,32+7,CB,testPRC2
B809UWABXX-1TILE-DMX,6,human1,human,CGATGT,myTest,N,32+7,CB,testPRC1
B809UWABXX-1TILE-DMX,7,human1,human,CGATGT,myTest,N,32+7,CB,testPRC1
B809UWABXX-1TILE-DMX,8,human1,human,CGATGT,myTest,N,32+7,CB,testPRC1
B809UWABXX-1TILE-DMX,8,human8,human,TGACCA,myTest,N,32+7,CB,testPRC2
Examples below illustrate use of DATASET_POST_RUN_COMMAND:
DATASET_POST_RUN_COMMAND limited to a PROJECTFollowing config file for PROJECT selection:
ANALYSIS none
PROJECT testPRC1 ANALYSIS eland_extended
PROJECT testPRC1 USE_BASES Y*n
PROJECT testPRC1 ELAND_GENOME
/illumina/scratch/iGenomes/PhiX/Illumina/RTA/Sequence/Squashed-
PhiX-Illumina-RTA
PROJECT testPRC1 DATASET_POST_RUN_COMMAND echo $(project)
$(sample) $(barcode) $(lane) >> out.DPRC.txt
will generate out.DPRC.txt in /Aligned folder:testPRC1 phix1 TTAGGC 1
testPRC1 human1 CGATGT 7
testPRC1 human1 CGATGT 8
testPRC1 human1 CGATGT 6
testPRC1 human1 TGACCA 3
testPRC1 human1 TGACCA 5
testPRC1 human1 GCCAAT 1
testPRC1 human1 GCCAAT 2
DATASET_POST_RUN_COMMAND limited to a LANEFollowing config file for LANE selection:
ANALYSIS none
1:ANALYSIS eland_extended
1:USE_BASES Y*n
1:ELAND_GENOME
/illumina/scratch/iGenomes/PhiX/Illumina/RTA/Sequence/Squashed-
PhiX-Illumina-RTA
1:DATASET_POST_RUN_COMMAND echo $(project) $(sample)
$(barcode) $(lane) >> out.DPRC.txt
will generate following out.DPRC.txt in /Aligned folder:testPRC1 phix1 TTAGGC 1
Undetermined_indices lane1 Undetermined 1
testPRC1 human1 GCCAAT 1
testPRC2 human1 CTTGTA 1
POST_RUN_COMMANDYou can also run the workflow-wide POST_RUN_COMMAND from the makecommand lane, for example:

Seq
uenceAlignm
ent
70 Part # 15011196 RevC
make all POST_RUN_COMMAND:=’echo everything is done’
Using ANALYSIS eland_extendedANALYSIS eland_extended is an improved version of the ANALYSIS eland mode thatexisted in Pipeline and is now deprecated. ANALYSIS eland could align reads longerthan 32 bases but demanded that the first 32 bases of the read have a unique bestmatch in the genome. The position of this match is used as a "seed" to extend the matchalong the full length of the read. ANALYSIS eland_extended removes the uniquenessrestriction by considering multiple 32 base matches and extending them.
Multiseed, Gapped, Repeat AlignmentANALYSIS eland_extended performs the following alignment features implemented inELANDv2 and ELANDv2e:} By default performs multiseed alignment by aligning consecutive sets of 16 to 32bases separately.
} Uses a gapped alignment method to extend each candidate alignment to the fulllength that allows for gaps (indels) of up to 10 bases.
} Aligns reads in repeat regions using two new modes: semi-repeat resolution andfull repeat resolution. Full repeat resolution is more sensitive and places more readsin repeat regions, but will result in longer run time. By default, ELANDv2e runs insemi-repeat resolution mode. Full repeat resolution can be turned on with the optionINCREASED_SENSITIVITY.
Configuring ANALYSIS eland_extendedThere are three parameters that affect the output of the alignment, ELAND_SEED_LENGTH1, ELAND_SEED_LENGTH2, and ELAND_MAX_MATCHES. Both parameterscan be specified lane-by-lane.The following table describes the parameters for ANALYSIS eland_extended.
Parameter DescriptionELAND_SEED_LENGTH1
ELAND_SEED_LENGTH2
By default, the first 32 bases of the read are used as a “seed” alignment.Setting ELAND_SEED_LENGTH1 to 25 will use 25 bases in read 1 insteadof the maximum of 32 for the initial seed alignment. This should increasethe sensitivity since two errors per 25 bases is less stringent than twoerrors per 32 bases.A read is more likely to be repetitive at the 25 base level than at the 32 base level, so a decrease in ELAND_SEED_LENGTH should probably beused in conjunction with an increase in ELAND_MAX_MATCHES.Setting this to very low values will drastically slow down the alignmenttime and will probably result in a lot of poor confidence alignments.
ELAND_MAX_MATCHES By default, ANALYSIS eland_extended will consider at most tenalignments of each read. This canELAND_MAX_MATCHES allows the maximum number of alignmentsconsidered per read to be varied between 1 and 255.
Table 9 Parameters for ANALYSIS eland_extended
Both ANALYSIS eland_extended and ANALYSIS eland_pair produce export files thatcontain all read, quality value, and alignment information for the analysis.For a detailed description of the export.txt.gz files, see Text-Based Analysis Results onpage 51.

Running
config
ureAlignm
ent
CASAVA v1.8.2 User Guide 71
Using ANALYSIS eland_pairBased heavily on ANALYSIS eland_extended, ANALYSIS eland_pair allows theanalysis of a paired-read run using ELANDv2e alignments. As part of the analysis, itwill:} Align both read 1 and read 2 to the reference genome} Determine the insert size distribution of the sample} Use the insert size distribution to resolve repeats and ambiguitiesThe export.txt.gz files are meant to contain all information necessary for downstreamprocessing of the alignment data. Other files produced that may be useful in somecircumstances are:} s_N_1_eland_extended.txt, s_N_2_eland_extended.txt - these contain the candidatealignments for each read 1 and read 2. The software chooses from these possibilitiesin attempting to pick the best alignment of the read pair.
} Another output file produced is s_N_anomaly.txt, which contains reads that do notalign. For some applications, reads that do not align may be of interest, sinceamongst those that are due to read errors may be some that represent genuinedifferences between the sequenced DNA and the reference.
For a detailed description of the export.txt files, see Text-Based Analysis Results on page 51.
Multiseed, Gapped, Repeat, Orphan AlignmentANALYSIS eland_pair performs the following alignment features implemented inELANDv2 and ELANDv2e:} By default performs multiseed alignment by aligning consecutive sets of 16 to 32bases separately.
} Uses a gapped alignment method to extend each candidate alignment to the fulllength that allows for gaps (indels) of up to 10 bases.
} Aligns reads in repeat regions using two new modes: semi-repeat resolution andfull repeat resolution. Full repeat resolution is more sensitive and places more readsin repeat regions, but will result in longer run time. By default, ELANDv2e runs insemi-repeat resolution mode. Full repeat resolution can be turned on with the optionINCREASED_SENSITIVITY.
} Performs orphan alignment by identifying read pairs for which only one of thereads aligns. ELANDv2e then tries to align the other read in a defined window (bydefault 450 bp).
Configuring a Paired-Read AnalysisThe alignments of the two reads that provide input to the pairing process may bevaried by setting ELAND_SEED_LENGTH and ELAND_MAX_MATCHES. Bothparameters may be set lane-by-lane, but the same values will apply to each of the tworeads in a lane.The paired-read analysis may be configured by passing options to alignmentResolver.This is done by setting a parameter KAGU_PAIR_PARAMS in the configureAlignmentconfiguration file. For additional information, see KAGU_PAIR_PARAMS and KAGU_PARAMS on page 67.KAGU_PAIR_PARAMS can be specified lane-by-lane. All of the options must bespecified on a single line and space-separated, as in the following example:
8:KAGU_PAIR_PARAMS --circular --muf 0

Seq
uenceAlignm
ent
72 Part # 15011196 RevC
Using ANALYSIS eland_rnaeland_rna is the eland module built specifically for RNA Sequencing , and is required toprovide the input files for CASAVA. eland_rna delivers the following information:} Read alignments to the genome.} Read alignments to splice junctions.} Read alignments to contaminants.
NOTEeland_rna does not support paired-end cDNA reads yet.
PrerequisitesFour sets of data files are needed:} A genome sequence file.} Fasta files of all chromosomes for on-fly splice junction generation.} refFlat .txt.gz (from UCSC) or seq_gene.md.gz file (from NCBI) —as of CASAVA 1.7,eland_rna uses the refFlat.txt.gz or seq_gene.md.gz file to generate the splicejunction set automatically. These files come from the following sources.• The refFlat.txt.gz file is available from UCSC• The seq_gene.md.gz file is available from NCBI.They should be provided gzip compressed, and should be from the same build asthe reference files you are using for alignment. This negates the need to provideseparate splice junction sets as in previous version of CASAVA.
} A set of contaminant sequences for the genome - typically the mitochondrial andribosomal sequences.
Description of the eland_rna AlgorithmThe algorithm aligns the reads to each of three targets:} Contaminants} Genome} Splice junctions; alignments need to span splice junctionThen a script decides which of the alignments is most likely for each read. Thefollowing steps are taken in order:
1 If a read aligns to the contaminants then the read is discarded. It is marked in theexport file as 'RM' - for 'repeat masked.'
2 If the read aligns to the genome and/or splice junctions:• If there is a unique alignment to the genome or splice junctions then thatalignment is printed.
• If there are multiple possible alignments to the genome and splice junctionsthen the read is marked as 'RM' and discarded as above.
3 If there is no alignment to either the contaminants, the genome or the splicejunctions then the read is marked as 'NM' - for 'not matched.'
Multiseed, Repeat AlignmentANALYSIS eland_rna performs the following alignment features implemented inELANDv2 and ELANDv2e:

Running
config
ureAlignm
ent
CASAVA v1.8.2 User Guide 73
} By default performs multiseed alignment by aligning consecutive sets of 16 to 32bases separately.
} Aligns reads in repeat regions using two new modes: semi-repeat resolution andfull repeat resolution. Full repeat resolution is more sensitive and places more readsin repeat regions, but will result in longer run time. By default, ELANDv2e runs insemi-repeat resolution mode. Full repeat resolution can be turned on with the optionINCREASED_SENSITIVITY.
Running an eland_rna AnalysisThe configureAlignment configuration file specifies how the sequences from a flow cellare processed, which is described in configureAlignment Configuration File on page 56.The ANALYSIS parameter within the configureAlignment configuration file specifieswhat analysis to perform on the sequences; you will need to set up this parameter thefollowing way (example shown):
ANALYSIS eland_rna
ELAND_GENOME /data/Genome/ELAND/hg18/
ELAND_RNA_GENOME_ANNOTATION /data/Genome/ELAND_
RNA/Human/refFlat.txt.gz
ELAND_RNA_GENOME_CONTAM /data/Genome/ELAND_RNA/Human/MT_Ribo_
Filter/
This tells configureAlignment it needs to perform eland_rna, and communicates thelocations of the genome, splice-junction and contaminant files.The following table describes the parameters for ANALYSIS eland_rna.
Parameter DescriptionELAND_GENOME Must point to the reference genome, just as for a standard
ELANDv2e analysis.ELAND_RNA_GENOME_ANNOTATION Must point to the refFlat.txt.gz file (gzip compressed) or seq_
gene.md.gz file (gzip compressed).ELAND_RNA_GENOME_CONTAM Must point to the files of ultra-abundant sequences (generally
ribosomal and mitochondrial). Any read that hits to these isignored.
Table 10 Parameters for ANALYSIS eland_rna
Considerations When Running eland_rnaWhen running eland_rna, bear in mind the following points:} The above parameters may be specified on a lane-by-lane basis in the usual fashion,for example to do lanes one, two, and four, enter the following:124:ANALYSIS eland_rna
124:ELAND_GENOME /data/Genome/ELAND/hg18/
124:ELAND_RNA_GENOME_ANNOTATION /data/Genome/ELAND_
RNA/Human/refFlat.txt.gz
124:ELAND_RNA_GENOME_CONTAM /data/Genome/ELAND_RNA/Human/MT_
Ribo_Filter/
} The output file export.txt.gz has the same format as those generated by eland_extended; for a description see Export.txt.gz on page 81. The existing code 'RM'('repeat masked') denotes all reads that hit to abundant sequences or with any otherunresolvable ambiguity.

Seq
uenceAlignm
ent
74 Part # 15011196 RevC
KEEP_INTERMEDIARY OptionThe option KEEP_INTERMEDIARY tells CASAVA not to delete the intermediaryalignment files in the alignment Temp dir after alignment is complete. This is a makeoption, and needs to be used when you run make. For example:
nohup qmake -cwd -v PATH -q genexpr.q -- -j32 all KEEP_
INTERMEDIARY:=yes&

config
ureAlignm
entOutp
utFiles
CASAVA v1.8.2 User Guide 75
configureAlignmentOutput Files
The configureAlignment output files contain run information, statistical analysis,sequence information, and alignment information. They are described below.
Figure 12 Run Folder after configureAlignment Analysis

Seq
uenceAlignm
ent
76 Part # 15011196 RevC
NOTEThere can be only one Aligned directory by default. If you want multipleAligned directories, you will have to use the option OUT_DIR to generate adifferent output directory.
Analysis SummaryThe results of an analysis are summarized as web pages that enable a large number ofgraphs to be viewed as thumbnail images. This section is intended to help you interpretthe various graphs that appear in an analysis directory.} For each project, a Sample_Summary.htm file is produced, which containscomprehensive results and performance measures of your analysis run for a projectper sample. It is located in the Aligned/project folder and provides an overview ofquality metrics for a project with links to more detailed information in the form ofpages of graphs.
} For each project, a Barcode_Lane_Summary.htm file is produced, which containscomprehensive results and performance measures of your analysis run for a projectper barcode and lane. It is located in the Aligned/project folder and provides anoverview of quality metrics for a project with links to more detailed information inthe form of pages of graphs.
} For each run, a FlowCellSummary.htm file is produced, which containscomprehensive results and performance measures of your entire analysis run acrossall projects. It is located in the Aligned folder.
Sample_Summary PageFor each sample, a Sample_Summary.htm file and Barcode_Lane_Summary.htm file isproduced, which contains comprehensive results and performance measures of youranalysis run for a project. It is located in the Aligned/Project_<ProjectName>/Summary_Stats folder and provides an overview of quality metrics for a run per sample with linksto more detailed information in the form of pages of graphs.The metrics are described below.
Project SummaryThe Project Summary contains general project information:} Project Name} Machine name} Run Folder—full path to the run folder} Flow Cell ID} Platform—instrument type} Control Software and version,} Primary Analysis software and version} Secondary Analysis software and version
Project Results SummaryThis table displays a summary of project-wide performance statistics for the run:} Clusters—Original number of detected clusters.} Clusters (PF)—Number of clusters that passed quality filtering.} Yield—The sum of all bases (in Mb) in clusters that passed filtering for the entireproject.

config
ureAlignm
entOutp
utFiles
CASAVA v1.8.2 User Guide 77
Barcode-Lane SummaryThe Barcode-Lane Summary records information about the barcoded samples in eachflow cell lane and the analysis that has been specified for it.} Barcode-Lane—The identity of the barcoded sample in a lane. The identity followsthe following format: <SampleName>_<Barcode>_<Lane>.
} Sample—Sample name.} Barcode—The sequence of the barcode (index).} Lane} Species—The reference sequence against which was aligned. Depending on theanalysis mode, this may be the name of a folder containing one or more sequencefiles or the name of an individual file. The acceptable file formats also depend onthe analysis mode.
} Analysis Type—Contains the analysis mode for reads from this lane.} Length—The number of bases used per read (excluding any bases masked outusing USE_BASES). Where multiple reads are produced per cluster and adistinction is maintained between them during analysis, as in eland_pair analysisof paired-end reads, their respective lengths will be listed.
} Num Tiles—The number of tiles from the lane that are used in the analysis.} Genome Directory— Full path to the genome directory.
Sample Results SummaryThis table displays basic data quality metrics for each sample, displayed on theSummary - sample page.} Sample Yield—The sum of all bases (in Mb) in clusters that passed filtering for thesample.
} Clusters (raw)—The number of clusters detected by the image analysis module.} Clusters (PF)—The number of detected clusters that meet the filtering criterion.} 1st Cycle Int (PF)—The average of the four intensities (one per channel or base type)measured at the first cycle averaged over filtered clusters.
} % Intensity after 20 cycles (PF)—The corresponding intensity statistic at cycle 20 asa percentage of that at the first cycle.
} % PF Clusters—The percentage of clusters passing filtering.} % Align (PF)—The percentage of reads passing filter that were uniquely aligned tothe reference. For eland_rna it is number of PF reads aligned to the genome andsplice junctions. Reads aligned to abundant sequences and masked by eland_rna donot participate in this number.
} Alignment Score (PF)—The average filtered read alignment score (reads withmultiple or no alignments effectively contribute scores of 0). For phiX spikes, thenumber of reads aligning to PhiX is small and therefore the reported alignmentscore (small number of aligned reads divided by total number of PF reads) isusually small.
} Mismatch Rate (PF)—The percentage of called bases in aligned reads that do notmatch the reference.
} % >=Q30 bases (PF)—Yield of bases with Q30 or higher from clusters passing filterdivided by total yield of clusters passing filter.
} Mean Quality Score (PF)—The total sum of quality scores of clusters passing filterdivided by total yield of clusters passing filter.

Seq
uenceAlignm
ent
78 Part # 15011196 RevC
If eland_pair analysis has been specified for one or more lanes, then two Lane ResultsSummaries are produced, one for each read. All lanes for which analysis has beenspecified are represented in the Read 1 table, but only those for which eland_pairanalysis has been specified contribute statistics to the Read 2 table.
Expanded Sample SummaryThis displays more detailed quality metrics for each sample.} Clusters (raw)—The number of clusters detected by the image analysis module.} % Phasing—The estimated (or specified) value used for the percentage of moleculesin a cluster for which sequencing falls behind the current position (cycle) within aread.
} % Prephasing—The estimated (specification is not recommended) value used forthe percentage of molecules in a cluster for which sequencing jumps ahead of thecurrent position (cycle) within a read.
} % Mismatch Rate (raw)—The percentage of called bases in aligned reads from alldetected clusters that do not match the reference.
} % PF Clusters—The percentage of clusters that passed filtering.} Cycle 2-4 Av Int (PF)—The intensity averaged over cycles 2, 3, and 4 for clustersthat passed filtering.
} Cycle 2-10 Av % Loss (PF)—The average percentage intensity drop per cycle overcycles 2–10 (derived from a best fit straight line for log intensity versus cyclenumber).
} Cycle 10-20 Av % Loss (PF)—The average percentage intensity drop per cycle overcycles 10–20 (derived from a best fit straight line for log intensity versus cyclenumber).
} % Align (PF)—The percentage of reads passing-filter that were uniquely aligned tothe reference.
} % Mismatch Rate (PF)—The percentage of called bases in aligned reads passing-filter that do not match the reference.
} % >=Q30 bases (PF)—Yield of bases with Q30 or higher from clusters passing filterdivided by total yield of clusters passing filter.
} Mean Quality Score (PF)—The total sum of quality scores of clusters passing filterdivided by total yield of clusters passing filter.
If eland_pair analysis has been specified for one or more lanes, then two ExpandedLane Results Summaries are produced, one for each read. All lanes for which analysishas been specified are represented in the Read 1 table, but only those for which eland_pair analysis has been specified contribute statistics to the Read 2 table.
Bustard Summary FileBelow the expanded sample summaries is a link to the BustardSummary.xml file,generated during bcl conversion. For a description of the data, seeDemultiplexedBustardSummary.xml File on page 43.
Per-Tile StatisticsBelow the link to the BustardSummary.xml file is a link to a file containing per-tilestatistics. The displayed metrics are similar to the expanded Lane 1 : Read 1 tables inthe CASAVA 1.8 configureAlignment summary files.

config
ureAlignm
entOutp
utFiles
CASAVA v1.8.2 User Guide 79
IVC PlotsNext is a link to IVC plots. The IVC.htm file (Intensity versus Cycle) contains plots thatdisplay lane averages for samples:} All—This is the lane average of the data displayed in All.htm. It plots each channel(A, C, G, T) separately as a different colored line. Means are calculated over allclusters, regardless of base calling. If all clusters are T, then channels A, C, and Gwill be zero. If all bases are present in the sample at 25% of total and a well-balanced matrix is used for analysis, the graph will display all channels withsimilar intensities. If intensities are not similar, the results could indicate either poorcross-talk correction or poor absolute intensity balance between each channel.
} Called—This plot is similar to All, except means are calculated for each channelusing clusters that the base caller has called in that channel. If all bases are presentin the sample at 25% with pure signal (zero intensity in the non-called channels),the Called intensity will be four times that of All, as the intensities will only beaveraged over 25% of the clusters. For impure clusters, the called intensity will beless than four times that of All.The Called intensities are independent of base representation, so a well-balancedmatrix will display all channels with similar intensities.
} %Base_Calls—The percentage of each base called as a function of cycle. Ideally,this should be constant for a genomic sample, reflecting the base representation ofthe sample. In practice, later cycles often show some bases more than others. As thesignal decays, some bases may start to fall into the noise while other still rise aboveit. Matrix adjustments may help to optimize data.
} %All and %Called—Exactly the same as All and Called, but expressed as apercentage of the total intensities. These plots make it easier to see changes inrelative intensities between channels as a function of cycle by removing anyintensity decay.
All Intensity PlotsThe link to All.htm file gives a representation of the mean matrix-adjusted intensity ofclusters plotted as a function of cycle. It plots each channel (A, C, G, T) separately as adifferent colored line. Means are calculated over all clusters, regardless of base calling.If all clusters are T, channels A, C, and G will be at zero. If all bases are present in thesample at a rate of 25% and a well-balanced matrix is used for analysis, the graph willdisplay all channels with similar intensities. If intensities are not similar, the resultscould indicate either poor cross-talk correction or poor absolute intensity balance amongeach channel.A genome rich in GC content may not provide a balanced matrix for accurate cross-talkcorrection and absolute intensity balance.
Mismatch GraphsThe Mismatch Graphs link leads to a file with graphs of error rates on a flow cell. Thered bar shows the percentage of bases at each cycle that are wrong, as calculated basedon alignment to the reference sequence. Issues such as focus or fluidics problemsmanifest themselves as spikes in the graph.ELANDv2e is capable of aligning against large genomes, such as human, in reasonabletime. However, it allows only two errors per seed. This means that error rates based onELANDv2e alignments are underestimated.

Seq
uenceAlignm
ent
80 Part # 15011196 RevC
Mismatch CurvesThe Mismatch Curves link leads to a file with graphs of the proportion of reads in a tilethat have 0, 1, 2, 3, or 4 errors by the time they get to a given cycle.
Additional Paired StatisticsFor samples for which eland_pair analysis was performed, there is a table calledAdditional Paired Statistics. This table provides statistics about the alignment outcomesof the two reads individually and as a pair, the latter including relative orientation andseparation (insert size) of partner read alignments.If the criteria for paired alignment are not met, the subset of tables reporting pairedalignment results are replaced with the statement, “Paired alignment not performed.”When this happens, CASAVA builds for these paired reads cannot be performedwithout first rerunning configureAlignment.pl and adjusting parameters such as --min-percent-unique-pairs and --min-percent-consistent-pairs toproduce acceptable paired data and summaries."The following sections are displayed in Additional Paired Statistics:} Relative Orientation Statistics—The relative orientation of a pair is the orientationof read 2 relative to the orientation of read 1, based on the definition that the read 1orientation is forward. The relative orientation is defined as positive if the read 2position is greater than the read 1 position.These statistics are given only for those pairs in which both reads were individuallyuniquely aligned, since these are the reads used to determine the predominantrelative orientation. Other orientations are considered anomalous and are filteredout.The symbols used in the column headings are intended as a visual reminder of thedefinitions of the four possible relative orientations. In the example below, thenominal orientation is correctly computed as the two reads “pointing to” eachother, as expected for the standard Illumina short insert paired-read sample prep.Unlike these short insert pairs that have a predominance in opposite and inwardlyfacing read pairs (R+: > R1 R2 <), the large insert mate pair libraries expect toproduce a predominance in opposite and outwardly facing read pairs (R-: < R2 R1>). High frequencies of paired reads having the same orientation (F-: > R2 R1 > orF+: > R1 R2 >) may be indicative of a sample preparation problem, or evidence ofan adapter read through problem found when the read lengths are long relative tothe library insert size.
} Insert Size Statistics—Statistics are derived from the insert sizes of those pairs inwhich both reads were individually uniquely aligned and have the predominantrelative orientation. First, the median is determined. Then, a standard deviationvalue is determined independently for those values below the median and thoseabove it. The lower and upper thresholds for acceptable insert sizes are then definedas three of the relevant standard deviations below and above the median,respectively.
} Insert Statistics (% of individually uniquely alignable pairs)—This table shows thenumber of inserts (out of those used to calculate insert size statistics) consideredacceptable in size and of those falling outside the thresholds displayed in the InsertSize Statistics table. The percentages are relative to the original number of pairs inwhich both reads were individually uniquely aligned.

config
ureAlignm
entOutp
utFiles
CASAVA v1.8.2 User Guide 81
Barcode_Lane_Summary PageThe Barcode_Lane_Summary.htm file provides similar metrics as the Sample_Summarypage, with the following differences:} The results are displayed for each barcoded sample in a lane, instead of forsamples.
} Tables are named accordingly: the equivalents for the Sample Results Summaryand Expanded Sample Summary are named Barcode Lane Results Summary andExpanded Barcode Lane Summary
} The Barcode_Lane_Summary page contains a Barcode-Lane Summary, describedbelow.
For a description, see the equivalent section in the Sample_Summary Page description(Barcode-Lane Summary on page 77).
Flow Cell SummaryFor each run a FlowCellSummary_FCID.htm file is produced, which contains the ProjectSummaries and Sample Results Summaries of all projects. This provides an overviewof the most relevant metrics for the entire run. It is located in the Aligned folder.For a description of Project Summaries and Sample Results Summaries, see Sample_Summary Page on page 76.
Analysis ResultsThe output files for each lane of a flow cell are named using the format export.txt.gz. Forpaired-read analysis, there are two parallel output files, one for each read. The files arenamed using the format : <sample name>_<barcode sequence>_L<lane>_R<readnumber>.<0-padded 3-digit set number>_export.gz. The files are found in theAligned/Project_ID/SAmple_ID folder of a finished analysis run.
Export.txt.gzThe standard naming format for *_export.txt.gz files is <sample name>_<barcodesequence>_L<lane>_R<read number>.<0-padded 3-digit set number>_export.gz, like in:NA10831_ATCACG_L001_R1_001_export.txt.gz. The *_export.txt.gz files are saved ascompressed gzipped files. The content of the *_export.txt.gz files is described below; notall fields are relevant to a single-read analysis.
NOTEThe old Illumina-specific transformation (ASCII offset of 64) will still be usedin the export files, but export.txt.gz is meant to be an internal file format.
1 Machine (Parsed from run folder name)
2 Run Number (Parsed from run folder name)
3 Lane
4 Tile
5 X Coordinate of cluster. As of RTA 1.6, OLB 1.6, and CASAVA 1.6, the X and Ycoordinates for each clusters are calculated in a way that makes sure thecombination will be unique. The new coordinates are the old coordinates times 10,+1000, and then rounded.

Seq
uenceAlignm
ent
82 Part # 15011196 RevC
6 Y Coordinate of cluster. As of RTA 1.6, OLB 1.6, and CASAVA 1.6, the X and Ycoordinates for each clusters are calculated in a way that makes sure thecombination will be unique. The new coordinates are the old coordinates times 10,+1000, and then rounded.
7 Index sequence or 0. For no indexing, or for a file that has not been demultiplexedyet, this field should have a value of 0.
8 Read number (1 for single reads; 1 or 2 for paired ends or multiplexed single reads;1, 2, or 3 for multiplexed paired ends)
9 Called sequence of read
10 Quality string--In symbolic ASCII format (ASCII character code = quality value + 64)
11 Match chromosome — Name of chromosome match OR code indicating why nomatch resulted.• "ee:ss:dd": too many hits, where ee is the number of exact hits, ss is the numberof hits with a single mismatch and dd is the number of hits with a doublemismatch
• NM: no match• QC: QC failure• RM: repeat masked, for example match against abundant sequences
12 Match Contig--Gives the contig name if there is a match and the matchchromosome is split into contigs (Blank if no match found)
13 Match Position--Always with respect to forward strand, numbering starts at 1(Blank if no match found)
14 Match Strand--"F" for forward, "R" for reverse (Blank if no match found)
15 Match Descriptor--Concise description of alignment (Blank if no match found)• A numeral denotes a run of matching bases• A letter denotes substitution of a nucleotide: For a 35 base read, "35" denotes anexact match and "32C2" denotes substitution of a "C" at the 33rd position
• The escape sequence "^..$" represents an indel. An integer in the indel escapesequence (e.g. "10^2$18") indicates an insertion relative to reference of thespecified size. A sequence in the indel escape sequence (e.g. "10^AG$20")indicates a deletion relative to reference, with the sequence given the deletedreference sequence.
16 Single-Read Alignment Score--Alignment score of a single-read match, or for apaired read, alignment score of a read if it were treated as a single read. Blank if nomatch found; any scores less than 4 should be considered as aligned to a repeat. -1for orphan reads.
17 Paired-Read Alignment Score--Alignment score of a paired read and its partner,taken as a pair. Blank if no match found; any scores less than 4 should beconsidered as aligned to a repeat. Note that in single-ended analyses it is alwaysblank.
18 Partner Chromosome--Name of the chromosome if the read is paired and its partneraligns to another chromosome
19 Partner Contig

config
ureAlignm
entOutp
utFiles
CASAVA v1.8.2 User Guide 83
• Not blank if read is paired and its partner aligns to another chromosome andthat partner is split into contigs.
• Blank for single-read analysis
20 Partner Offset• If a partner of a paired read aligns to the same chromosome and contig, thisnumber, added to the Match Position, gives the alignment position of thepartner.
• If partner is a orphan read, this value is 0.• If partner aligns to a different chromosome and/or contig, the number representsthe absolute position of the partner.
• Blank for single-read analysis unless the record belongs to a part of a splicedRNA read.
21 Partner Strand--To which strand did the partner of the paired read align? "F" forforward, "R" for reverse ("N" if no match found, blank for single-read analysis)
22 Filtering--Did the read pass filtering? N - No, Y - Yes.
Additional configureAlignment Output Files
s_N_TTTT_rescore.txtThe "txt" score and rescore files are produced by tile. The corresponding XMLsummaries are by lane. Various breakdowns of base mismatches within aligned reads(e.g. by cycle, called base and reference base), along with associated statistics. Tabulartext format, header data included.
rnaqc.txtThe output file rnaqc.txt files in the Aligned folder provides the following information onalignment distribution for eland_rna:
1 totalClusters—number of total clusters.
2 PFClusters—number of clusters passing purity filter.
3 Usable—number of reads passing filter and aligned uniquely to the genome plussplice junction.
4 QC—number of reads passing filter that were not aligned due to too many bases notcalled (QC in the 11th field of the export file).
5 noMatch—number of reads passing filter that did not match anything (includingrepeat-masked); these reads have NM label in the 11th field of the export file.
6 repeatMasked—number of reads passing filter that were masked by eland_rna (RMlabel in the 11th field of the export file). These are reads mapping to abundantsequences and reads that do not have unique alignments to the genome or splicejunctions.
NOTESum of Usable, QC, noMatch, and repeatMasked reads is equal to number ofreads reported in PFClusters.
7 spliceUsable—number of reads passing filter aligned uniquely to the splicejunctions;
8 genomeUsable—number of reads passing filter aligned uniquely to the genome;

Seq
uenceAlignm
ent
84 Part # 15011196 RevC
NOTESum of spliceUsable and genomeUsable is equal to Usable.
9 In the last rows numbers are provided for number of passing filter reads aligned toeach reference sequence file within the AbundantSequences directory. The namesare derived from the fasta headers (up to first space) used to list each reference inthe multifasta abundant sequences file. If you want a more descriptive names, likeribosomal, E.coli, or phiX, you should modify fasta headers in the abundantsequences file.
NOTEDifference between repeatMasked and sum of all abundant sequences givesthe number of reads that do not have unique alignments.
contam_export.txt.gzContains unique alignments to sequences in the CONTAM directory, in the exportformat (see Export.txt.gz on page 81).
Intermediate Output Data FilesIntermediate output files are found in the Aligned folder and contain data used to buildthe more meaningful results files described in Pipeline Analysis Output on page 43.
CAUTIONDo not use the intermediate files as input for custom scripts. These files maynot be generated anymore in future CASAVA versions.
The files are named using one of the following formats:} s_N_TTTT_name.txt, where N is the lane number, T is the tile Number} <sample name>_<barcode sequence>_L<lane>_R<read number>.<0-padded 3-digitset number>_name.txt
Output File configureAlignmentAnalysis Mode
Description
*_eland_extended.txt ANALYSIS eland_extended
Contains the corrected alignment positions and the fullalignment descriptions for >32 base reads. This file is notpurity filtered.*_eland_extended.txt ANALYSIS eland_
pair*_extended_contam.txt ANALYSIS eland_rna Alignments to the ELAND_RNA_GENOME_CONTAM.*_extended_splice.txt ANALYSIS eland_rna Alignments to the splice junctions.
Table 11 Intermediate Output File Descriptions
Output File Formats_N_TTTT_align.txts_N_TTTT_realign.txts_N_TTTT_prealign.txt
Deprecated sequence alignment format.Space-separated text values:1. Sequence2. Best score3. Number of hits at that score4. The following columns only appear if hits equal 1 (a single, uniquematch)
5. Target:pos6. Strand7. Target sequence8. Next best score
Table 12 Intermediate Output File Formats

config
ureAlignm
entOutp
utFiles
CASAVA v1.8.2 User Guide 85
Interpretation of configureAlignment RunQualityAfter the analysis of a run is complete, you need to interpret the data in the reportsummary and various graphical outputs. This section describes a standard, systematicway to examine your data.The starting point is to know what a standard run of acceptable quality looks like. Thisis something of a moving target and is dependent on individual instruments,instrument configuration, genomic sample type, type of analysis, flow cell preparation,and the current state of the art. Therefore, the numbers shown in this section are forexample only.
Summary PagesAfter analysis is complete, check the FlowCellSummary_FCID.htm file, Sample_Summary.htm, and Barcode_Lane_Summary.htm files. These provide metrics per flowcell, sample, and barcode-lane, respectively. For a description of the tables found, seeFlow Cell Summary on page 81., Sample_Summary Page on page 76, and Barcode_Lane_Summary Page on page 81.The key parameters that you should examine are listed in SummaryTab on page 17 andin the following sections.
Percentage of Clusters Passing Filters that Align Uniquely to theReference GenomeOptimal value depends on the genome sequenced and the read-length; the higher (up to100% max), the better.This result is genome specific and dependent on the completeness of the reference. Afailure to align could be due to repeat or missing regions, or due to indels where sampleand reference do not match.
Condition Possible Cause Suggested ActionMuchlower thanexpectedwhenusingELANDv2
Fluidics orinstrumentproblem
Look for an intensity dip in IVC plots. If there is a problemand it occurs after a sufficiently useful read-length, re-runELANDv2e analysis using only the “good” cycles before theinstrument problem.
Contaminationfrom othergeneticmaterialresulting in aninability toalign data
Align a few sample tiles. Genomic contamination will showas early cycle error rates. If error rates remain fairly constantwith cycle, then the “correct” genome has probablysequenced correctly. Non smooth error rate plots or IVCplots indicate the presence of specific tags or sequences.
Percentage Mismatch Rate of Clusters Passing FiltersThis value should be as low as possible, but it is very dependent on read-length. If thereis a sudden rise beyond cycle 32, then it is likely that ELANDv2e has effectively filteredout many clusters with more than two errors, thus suppressing the true error rate up tothis point. The percentage aligning will also be low.
IVC.htmFor a detailed description of the plots found in the IVC.htm file, see IVC Plots on page79.

Seq
uenceAlignm
ent
86 Part # 15011196 RevC
Condition Possible CauseIntensity curves are not smooth Cycle to cycle focus or fluidics problemsCalled intensities are not equal(“% Called” may be +/- 5% out withoutmajor problems)
Poor fluidics or poorly blocked flow cellIf from cycle 1, initial matrix estimate mayalso be in error
All.htm andMismatch.htmThe results in both files should show consistency from tile to tile down a lane and fromlane to lane, if the results are from the same sample.
Condition Possible CauseTile variability Bubbles
Rapid focus fluctuationsDirty flow cell surface
Rising mismatch rates(Rates will always rise eventually at high read-lengths)
Low intensity at startHigh decay rateHigh phasing orprephasingAdapter read through
High, but constant mismatch rates from cycle 1 Genomic contamination

Running
ELA
NDas
aStand
alone
Program
CASAVA v1.8.2 User Guide 87
RunningELANDas aStandaloneProgram
You can run ELAND without the rest of configureAlignment as a post-analysis step.ELAND can be run as a standalone program for the following reasons:} To test the effect of different filter parameters} To test alignment targets} To test applications that read export filesTo run ELAND as a standalone program, use the scriptPath/to/CASAVA1.8/bin/ELAND_standalone.pl.
Path/to/CASAVA1.8/bin/ELAND_standalone.pl -if read1.fastq -if
read2.fastq
-ref /lustre/data01/Mondas_software/Genomes/E_coli_ELAND
Option Short Form Description--input-file <input file> -if Specify at least one file for single-reads and two files for paired-
reads (mandatory)--ref-sequences <path togenome dir>
-ref Full path of a genome directory (mandatory)
Table 13 Required Parameters for ELAND_standalone.pl
Option Short Form Description--bam Enables BAM output.--base-quality <value> -bq Assumes all bases have this quality when in fasta mode (default is set
to 30)--copy-references -cr Copies the references to the output directory. Use this option if your
reference sequence directory is write-protected.--force Forces existing output files to be overwritten.--input-type <inputformat>
-it Type of input file (FASTQ, FASTA, export, or qseq).
--log <path to log> -l The path to the log file. Default =ELAND_standalone.log.--output-directory<output dir>
-od The output directory.
--output-prefix<prefix>
-op Produces a set of output files with a prefix of this value (default valueis “reanalysis”)
--kagu-options<"options">
-ko Indicates paired-read analysis parameters to pass toalignmentResolver. e.g. -ko "-c" enables circular reference sequencesupport.Multiple arguments must be contained in quotation marks.
--remove-temps -rt removes all files except exports, BAM files, and log files uponsuccessful completion.
--seed-length <value> -sl Length of read substring (seed) used for ELAND alignment (defaultsto the lower of read-length and 32). Use twice for paired-end datasets.
--use-bases <value> -ub Expanded mask to apply to the FASTQ filetwo values if paired analysisDefaults to Y*n
--help -h Shows help text.
Table 14 Options for ELAND_standalone.pl
NOTEThe orphan aligner is always enabled when performing paired-end analysiswith ELAND standalone – just like configureAlignment.

Seq
uenceAlignm
ent
88 Part # 15011196 RevC
The orphan aligner is always enabled when performing paired-end analysis withELAND standalone – just like GERALD.Running ELAND as a standalone program does not perform all of the various stepsthat are included during a configureAlignment run. The most important differences are:} ELAND standalone does not generates many of the statistics} ELAND standalone is not massively parallel like configureAlignmentIf you require any or all of the above, it is best to create a modified config file to align toa different genome, and rerun configureAlignment. For more information, see RunningconfigureAlignment on page 55.
FASTQ FormatAny FASTQ file will be supported, but the CASAVA FASTQ file format is optimal forpopulating the appropriate fields. The format is: (note the space between y-pos and readnumber:
@<instrument-name>:<run ID>:<flowcell ID>:<lane>:<tile>:<x-
pos>:<y-pos> " " <read number>:<is filtered>:<control
number>:<barcode sequence>
The elements are described below.
Element Requirements Description@ @ Each sequence identifier
line starts with @<instrument-name> Characters allowed:
a-z, A-Z, 0-9Instrument-name
<RunID> Characters allowed:a-z, A-Z, 0-9
Run ID
<flowcell ID> Characters allowed:a-z, A-Z, 0-9
flowcell ID
<lane> Numerical Lane number<tile> Numerical Tile number<x-pos> Numerical X coordinate of cluster<y-pos> Numerical Y coordinate of cluster<read number> Numerical Is usually 1 or 2 for paired-
end reads or 1 for single-end reads. There field cansupport more than tworeads.
<is filtered> Y or N is Y if the read is filtered,N otherwise
<control number> 0 Is 0 when none of thecontrol bits are on(reserved for future use)
<barcode sequence> ACGT Represents the USE_BASES masked barcodesequence, emptyotherwise
An example is shown below@EAS139:136:FC706VJ:2:5:1000:12850 1:Y:18:ATCACG
AAAAAAAAAAAAAAAAAAAAAAAAAAAAAAAAAAAA
+
BBBBCCCC?<A?BC?7@@???????DBBA@@@@A@@

Chapter5
CASAVA v1.8.2 User Guide 89
Chapter 5 Variant Detection and Counting
VariantDetectionandCounting
Introduction 90Methods 93Variant Detection Input Files 95Running Variant Detection and Counting 98Variant Detection and Counting Output Files 104

Variant
DetectionandCounting
90 Part # 15011196 RevC
Introduction
This chapter explains how to use CASAVA1.8 to detect Single NucleotidePolymorphisms (SNPs) and insertions/deletions (indels), and count hits on transcriptsfor RNA sequencing.CASAVA generates a CASAVA build, which is a post-sequencing analysis of data fromreads aligned to a reference genome by configureAlignment.The CASAVA build process is divided into several modules (or targets), each of whichcompletes a major portion of the post-alignment analysis pipeline. The first module,'sort', bins aligned reads into separate regions of the reference genome, sorts these readsand optionally removes PCR duplicates (for paired-end reads) and finally convertsthese reads into BAM format. In a paired-end analysis the next module,'assembleIndels', is used to search for clusters of poorly aligned and anomalous reads.These clusters of reads are de-novo assembled into contigs which are aligned back tothe reference to produce candidate indels. Subsequently, the 'callSmallVariants' moduleuses the sorted BAM files and the candidate indels predicted by the assembleIndelsmodule to perform local read realignment and genotype SNPs and indels under adiploid model. In an RNA-Seq build the 'rnaCounts' module will also be run tocalculate gene and exon counts. Other optional modules can be added to the buildprocess to perform additional functions.CASAVA automatically generates a range of statistics, such as mean depth andpercentage chromosome coverage, to enable comparison with previous builds or otherindividuals. Moreover, CASAVA provides expression levels for exons, genes and splicejunctions in the RNA Sequencing analysis.
Use CasesThe application has three basic use cases:} DNA Sequencing for large genomes.} DNA Sequencing for small genomes (data sets).} RNA Sequencing.All types of analysis take export files from configureAlignment as input and produceSNP and indel calls, but note that gapped alignments are required for indel calls inRNA and single-ended DNA builds. In addition, RNA Sequencing analysis providescounts for exons, genes and splice junctions.
DNA Sequencing Analysis for Large GenomesDNA Sequencing whole genome analysis can be used for large genomes and highcoverage (like the human genome at 30x coverage), and both single-read and paired-endruns. CASAVA can take the large numbers of aligned single-read or paired-endsequences from multiple experiments, arrange them into a genome build, and describedifferences from the reference sequence.For big data sets (30x coverage human genome), the process can take between 5 hoursand several days, depending on available infrastructure.
NOTELarge projects like human genome resequencing require high-performancecomputer clusters; see Hardware and Software Requirements on page 114.

Introductio
n
CASAVA v1.8.2 User Guide 91
DNA Sequencing Analysis for Small GenomeDNA Sequencing for small genomes, such as whole genome sequencing of bacteria ortargeted resequencing, is very similar to DNA Sequencing for large genomes with theonly difference being that it may process data from one lane or less. Thus a singlecomputer is enough to make the build.
RNA Sequencing AnalysisRNA Sequencing analysis supports whole transcriptome sequencing projects. Inaddition to SNP and indel calls there are a few more data types produced. Exon counts,splice junction counts and gene counts can be used to determine gene expression levelsand expressed splice variants.
TIPAs long as a gapped alignment is performed, small indels (up to 10nucleotides) can be called from RNA-Sequencing builds.
NOTERNA Sequencing only supports single-read runs.
Post-Alignment WorkflowThe CASAVA workflow for variant detection and counting is illustrated below
Figure 13 CASAVA Variant Detection and Counting Workflow
Post-sort BAMCASAVA has a number of changes in the way files are handled in the post-alignmentworkflow:

Variant
DetectionandCounting
92 Part # 15011196 RevC
} CASAVA 1.8 operates entirely on BAM files after the sort module in the post-alignment workflow has completed, sorted.txt files are no longer created or stored..This significantly reduces the build size: the combined changes in the new variantcaller and BAM files for CASAVA reduce the human DNA Sequencing post-alignment builds size by 75-80%.
} Archival mode: CASAVA can be run so that all input reads are retained in thebuild in their entirety. Variant calling and RNA counting results are identical inarchival and non-archival versions of the build.
} Fast creation of whole genome BAM files: After the sort module has completed, 30-40x whole genome BAM files can now be created and indexed in approximately 1hour.
} Spliced alignments are now represented in BAM using the same format as TopHat,allowing visualization of splice junctions in IGV.
Archival BuildArchival builds, turned on with the option --sortKeepAllReads, include all readsgiven as input to the build in their entirety:} Purity filtered and duplicate reads are stored in the primary BAM files with theappropriate bit settings to identify them. These will be ignored by variant callingand RNA read counting.
} To handle various types of unmapped reads, the CASAVA 1.7 "NMNM" directoryhas been renamed as "notMapped". Reads within this directory are classified intoseparate BAM files for the following categories: noMatch, qcFail, nonUnique,repeatMasked, mixed.
} In any situation where reads were trimmed in CASAVA 1.7 they are now soft-clipped. In some cases, where a read would be removed in non-archival mode dueto some anomalous condition, that read is now marked as unmapped and stored inthe build instead. Note that the small variant caller is designed to preserve any soft-clip regions from an input read (though it may expand them as part of localrealignment).
NOTEThis is independent of the bam files produced by the target bam,whichaggregates all reads into a single BAM file with chromosome re-labeling (seeTargets on page 98).
} This is independent of the archival bam file, which can be produced using theoption --sortKeepAllReads(see Archival Build on page 92).

Metho
ds
CASAVA v1.8.2 User Guide 93
Methods
CASAVA uses a number of methods to efficiently assemble indel candidates, call SNPsand indels, and provide counts. This section explains the methods.
Variant DetectionPost-alignment CASAVA performs variant detection using two modules:} The assembleIndels module (Grouper) detects candidate indels usingsingleton/orphan and anomalous read pairs. The assembleIndels module workswell for detecting larger indels. The candidate indels detected by the assembleIndelsmodule are passed on to the small variant caller for consolidation and genotyping.
} The callSmallVariants module genotypes and provides quality scores for SNPs andindels. Indels can be called from candidate indel evidence provided by bothELAND gapped-read alignments (for smaller indels) and from the assembleIndelsmodule (for larger indels).
For each SNP or indel call the probability of both the called genotype and any non-reference genotype is provided as a quality score (Q-score). Reads are re-aligned aroundcandidate indels to improve the quality of SNP calls and site coverage summaries.The callSmallVariants module also generates files which summarize the depth andgenotype probabilities for every site in the genome. As a final step it produces tablesand html-formatted reports of SNP and indel calls .
assembleIndels AlgorithmThe assembleIndels module (Grouper) runs only during paired-read DNA CASAVAbuilds. In CASAVA v1.8, it uses orphan reads and anomalous read pairs to detectindels.Grouper detects indels in five stages:
1 Compute clusterings of non-aligned 'orphan reads'.
2 Compute clusterings of anomalous read pairs, with an insert size that isanomalously large (possible deletion) or small (possible insertion).
3 Combine clusters that appear to correspond to the same event.
4 Assemble them into contigs.
5 Align the contigs back to the genome, using the positions of associated 'singleton'reads to narrow the search to a couple of thousand bp or so.
Variant Caller MethodsThe callSmallVariants module calls SNPs and small indels from both the sortedalignment files (sorted.bam) and optionally also from the candidate indel contigsproduced by assembleIndels. The procedure is outlined below.} Read in read alignments and candidate indel contigs. Filter out read alignmentsbased on quality checks, paired-end anomalies, or ELAND alignment score. Filterout contig alignments containing adjacent insertion/deletion events.
} Consolidate indel evidence from read and contig alignments to produce a set ofcandidate indels.
} Perform local read realignment using candidate indels.

Variant
DetectionandCounting
94 Part # 15011196 RevC
} Call indels based on the set of alignments for each read which intersect/include acandidate indel.
} Select most likely read realignment for subsequent site counting and genotyping.} Further filter individual basecalls based on mismatch density or ambiguity ('N').} Use all remaining base calls to predict site genotypes and SNPs.} Filter to remove SNP and indel calls near the centromeres and within high-copynumber regions.
readBases Counting MethodAs of version 1.6, CASAVA uses the readBases counting method. This method is forexon and gene counts, and counts the number of bases that belong to each feature. Bothreads that map to the genome and reads that map to splice junctions contribute to exonbase coverage value.
NOTEBefore counting CASAVA split alignments to the splice junction to twoshorter genomic reads.
Counts for splice junctions are provided for convenience and correspond to the numberof reads that cover the junction point. Bases within reads aligned to the junction arecounted only once in the exon counts.The number of bases that fall into the exonicregions of each gene is summed to obtain gene level counts, and normalized accordingto feature size, and expressed as RPKM (Reads Per Kilobase per Million of mappedreads).Exons that have overlapping exons from other genes on the forward or reverse strandare excluded from counting and are also not included to compute the total gene length.
Variant Caller and Counting Detailed DescriptionFor a detailed description of the variant caller algorithm, see Variant Detection on page143.

Variant
Detectio
nInp
utFiles
CASAVA v1.8.2 User Guide 95
VariantDetection Input Files
The variant detection and counting input files come from the configureAlignmentmodule using the following eland modules:} eland_extended (configureAlignment Input Files on page 50) for single-read DNAsequencing projects.
} eland_pair (Using ANALYSIS eland_pair on page 71) for paired-end DNAsequencing projects.
} eland_rna (Using ANALYSIS eland_rna on page 72) for single-read RNA sequencingprojects (paired-end RNA sequencing projects are not supported).
The configureAlignment input files for CASAVA variant detection can be found in theAligned directory of the run folder, and are described below.In addition, CASAVA variant detection and counting uses annotation files (genomesequence files and refFlat.txt.gz or seq_gene.md.gz file) .
Figure 14 CASAVA Input Files
export.txt.gz FilesThe export.txt.gz files contain the aligned sequence information from theconfigureAlignment module, and are required.The export.txt.gz files are tab delimited text files; for a detailed description, see See"Output File Formats".
Run.conf.xmlThe run.conf.xml file provides the location of the configureAlignment data (export.txt.gz) for each flow cell run, and describes their properties of each flow cell run. There is onerun section for each flow cell run, one set section for each Aligned folder in each flowcell run, and one lane section for each lane in each set. The run.conf.xml file can be

Variant
DetectionandCounting
96 Part # 15011196 RevC
provided (created) by the user or CASAVA will generate it automatically based oncommand line options. run.conf.xml file should be placed in buildDirectory/conf/
Pair.xmlThe pair.xml file provides information about pair distribution in theconfigureAlignment output (only for paired-end sequencing). Pair.xml is required forpaired samples to be treated as paired. You do not need to point to it specifically, sinceit should have been placed in the Aligned/Project/Sample folder for your sample byconfigureAlignment.
Genomesize.xmlThe *_genomesize.xml file contains names of reference genomes, and is required forvariant detection. You do not need to point to it specifically, since it should have beenplaced in the Aligned/Project/Sample folder for your sample by configureAlignment.
Reference GenomeCASAVA uses a reference genome in FASTA format. Both single sequence FASTA andmulti-sequence FASTA genome files are supported.Genome sequence files for most commonly used model organisms are available throughiGenome (Getting Reference Files on page 130).
Single Sequence FASTA FilesCASAVA accepts single-sequence FASTA files as genome reference, which should beprovided unsquashed for both alignment and post-alignment steps. The chromosomename is derived from the file name.Direct CASAVA to a folder containing the FASTA files using the option --refSequences=PATH for variant detection and counting.
Multi-Sequence FASTA FilesAs of version 1.8, CASAVA accepts a multi-sequence FASTA file as genome reference.This should be provided as a single genome, SAM compliant, unsquashed file, for bothalignment and post-alignment steps. The chromosome name is derived directly fromthe first word in the header for each sequence.Direct CASAVA to multi-sequence FASTA file using the option --samtoolsRefFile=FILE for variant detection and counting.
WARNINGGenomeStudio does not support the use of multi-sequence FASTA files.Therefore, if you want to analyze your output in GenomeStudio, werecommend using single sequence FASTA reference files.
Chromosome Naming RestrictionsCASAVA does not accept the following characters in the chromosome name:
- ? ( ) [ ] / \ = + < > : ; " ' , * ^ | &

Variant
Detectio
nInp
utFiles
CASAVA v1.8.2 User Guide 97
refFlat.txt.gz or seq_gene.md.gz FileCASAVA 1.8 generates the non-overlapping exon coordinates set automatically usingthe refFlat.txt.gz file (from UCSC) or seq_gene.md.gz file (from NCBI). They should befrom the same build as the reference files you are using for alignment, and are availablefrom iGenome for the most common model organisms (Getting Reference Files on page130).

Variant
DetectionandCounting
98 Part # 15011196 RevC
RunningVariantDetectionandCounting
The major use cases for running CASAVA variant detection and counting are listedbelow.Set additional options to define the type of analysis you want to perform for eachproject. The options are listed in the next section.
Major Use Cases} SNP and Indel CallingTo run CASAVA with callSmallVariants and assembleIndels, enter:/path-to-CASAVA/bin/configureBuild.pl [options]
} SNP and Indel calling without large-indel assemblyTo run CASAVA with callSmallVariants, but without assembleIndels, enter:/path-to-CASAVA/bin/configureBuild.pl --targets all
noassembleIndels --variantsSkipContigs [options]
} SNP and Indel calling, Single-end BuildTo run CASAVA with callSmallVariants for a single-end build, enter:/path-to-CASAVA/bin/configureBuild.pl [options]
} RNA SequencingTo run CASAVA for RNA Sequencing, enter:/path-to-CASAVA/bin/configureRnaBuild.pl [options]
Other Use Cases} HelpTo get the CASAVA Help for callSmallVariants, enter:/path-to-CASAVA/bin/configureBuild.pl --help callSmallVariants
} Rerun callSmallVariantsIn any pre-existing build in which the sort module was previously completed (andthe assembleIndels module for a paired end build), Small variant calling may bererun using:/path-to-CASAVA/bin/configureBuild.pl -od $PROJECT_DIR --
targets callSmallVariants
NOTEWe only support data sets originated from the same version of the software.
} Generate BAM File with Altered AlignmentsAn advanced option useful for variant diagnosis is to create BAM files for thosereads which had their alignments altered by the variant caller during localrealignment. This may be done by adding the command --variantsWriteRealigned to any command-line which runs the variant caller.
TargetsThe targets that define CASAVA analysis are listed in the tables below.

Running
Variant
Detectio
nand
Counting
CASAVA v1.8.2 User Guide 99
Option Descriptionall Run all pre-configured targets for the given analysis type (default), except for
target bam.sort Bin reads and sort by position; Remove PCR duplicates for paired-end data.assembleIndels Search for candidate indels from paired-end reads via de-novo assembly of
contigs which are aligned back to the reference.callSmallVariants Call SNPs and indels from locally re-aligned reads. Candidate indels from the
assembleIndels target can be used to improve indel results. See also TargetcallSmallVariants Usage on page 99.
rnaCounts Calculate gene and exon counts in an RNA-Seq build.bam Aggregate all reads into a single BAM file with chromosome re-labeling. This
target is not part of target all, and is therefore not done by default. Must bepreceded by or combined with target sort.This BAM file is independent of the archival bam file, which can be producedusing the option --sortKeepAllReads(see Archival Build on page 92).
gsIndex Pre-compute Genome Studio linear index for all reads in the build.
Table 15 Targets for Variant Detection and Counting
If you run a target other than the default target (all), make sure to read the help writtenfor the target. This will help you identify any dependencies for the target you want torun.Target help can be accessed by typing:
Path/to/CASAVA/bin/configureBuild.pl --help <target>
NOTEPrefixing any target name with nowill exclude it from the targets list.Example:path-to-CASAVA/bin/configureBuild.pl --targets all
noassembleIndels --variantsSkipContigs [options]
Target callSmallVariants UsageThe callSmallVariants module is designed to use the results of the assembleIndelsmodule if available, so a new paired-end build could be run with the followingminimum set of targets:
--targets sort assembleIndels callSmallVariants
If assembleIndels (Grouper) cannot be run, an alternative workflow is:--targets sort callSmallVariants --variantsSkipContigs
NOTETo have the plugin provide a BAM file containing all reads which have hadtheir alignments altered during realignment, add the following to theconfiguration command line:
--variantsWriteRealigned
These reads will appear in the file "sorted.realigned.bam" in thechromosome realigned bam directory.
OptionsThe primary options that define CASAVA variant detection and counting analysis arelisted in the tables below (with SE = single end (single read), PE = paired end).The primary options that define CASAVA variant detection and counting analysis arelisted on the next pages (with SE = single end (single read), PE = paired end).

Variant
DetectionandCounting
100 Part # 15011196 RevC
Advanced options for fine-tuning the variant calling are listed in Advanced Options forVariant Detection on page 154.
NOTEThe option --outDir is mandatory for all analysis types. CASAVAwill notrun if this option is missing.CASAVAwill only run without --inSampleDir if the build has been alreadyconfigured with --inSampleDir before.
Global OptionsThe options described below are global options used to specify analysis across differenttargets.
Option Application Description-id,
--inSampleDir=PATH
SE, PE PATH to the aligned sample input directory.Example: -id TestData/Aligned/Project_
<SampleProject>/Sample_<SampleID>
-od,
--outDir=PATH
SE, PE PATH to the build sample output directory.Example: -od /home/user_name/data/Project_01
-ref,
--refSequences=PATH
SE, PE PATH of the reference genome sequences. Default isbuildDir/genomes/.Example: -ref /data/Genome/CASAVA/hg18
The FASTA files should not be squashed for CASAVA.--samtoolsRefFile=FILE SE, PE PATH to a single samtools-style reference file
Table 16 Major File Options for Variant Detection and Counting
Option Application Description-a,
--applicationType=TYPE
SE, PE Type of analysis [DNA, RNA]; default is DNA.Example: -a RNA
-f,
--force
SE, PE Ignore errors from previous CASAVA execution.Example: -f
-h,
--help [TARGET]
SE, PE Prints on screen usage guide. If TARGET is specified, prints usageguide for the corresponding plugin targetExample: --help bam
-j, --jobsLimit SE, PE Limit number of parallel jobs. Defaults: -1 (unlimited) for --sgeAuto. 1 for --workflowAuto.Do not set it to the maximum number of processors as this mightcause the terminal to become unresponsive
--postRunCmd=CMDLINE SE, PE Post Run Commands can be launched after CASAVA completesby including the --postRunCmd option, followed by thecommands to be launched
-sa, --sgeAuto SE, PE Generates the workflow definition file and runs it on SGE (usewith --sgeQueue)
--sgeQsubFlags SE, PE Extra parameters to be passed to SGE qsub by the taskServer.pl--sgeQueue SE, PE SGE queue name, used with --sgeAuto or --workflow (e.g: all.q)--targets=LIST SE, PE Space-separated list of targets to run (see Targets on page 98).
Default is all.Example: --targets sort bam
--tempDir SE, PE Overrides default path for local temporary files--verbose=NUMBER SE, PE Sets the verbose level (default is 0, which is the minimum).
Example: --verbose=1
Table 17 Behavioral Options for Variant Detection and Counting

Running
Variant
Detectio
nand
Counting
CASAVA v1.8.2 User Guide 101
Option Application Description--version SE, PE Prints version information.
Example: --version-w,
--workflow
SE, PE Instead of running CASAVA , generates the workflow definitionfiletasks-DATA.txtExample: -w
-wa,
--workflowAuto
SE, PE Generates the workflow definition file and runs it. See --jobsLimit.Example: --workflowAuto
--workflowFile=FILE SE, PE Overrides workflow file name. Default is tasks.<date>.txtExample: --workflowFile=FILENAME.txt
Option Application Description--QVCutoff=NUMBER PE Sets the paired-end alignment score threshold to NUMBER
(default 90).Example: --QVCutoff=60
--QVCutoffSingle=NUMBER SE, PE Sets the single-read alignment score threshold to NUMBER(default 10).Example: --QVCutoffSingle=60
--read=NUMBER PE Limit input to the specified read only. Forces single-endedanalysis on one read of a double-ended data set.Example: --read=1
--singleScoreForPE=VALUE PE Sets the variant caller to filter reads with single score belowQVCutoffSingle in PE mode YES|NO. Default NO.Example: --singleScoreForPE=YES
--sortKeepAllReads SE, PE Generate an archive BAM file. Keep all purity filtered, duplicateand unmapped reads in the build. These reads will be ignoredduring variant calling.Example: --sortKeepAllReads
--toNMScore=NUMBER SE, PE Minimum SE alignment score to put a read to NM. Default=-1 (-1 means option is turned off)
--ignoreUnanchored PE Ignore unanchored read pairs in indel assembly and variantcalling. Unanchored read pairs have a single-read alignmentscore of 0 for both reads.Example: --ignoreUnanchored
Table 18 Global Analysis Options for Variant Detection and Counting
Options for Target sortThe options described below are used to specify analysis for target sort.
Option Application Description--rmDup=YES|NO PE Turn On/Off PCR duplicate marking/removal for paired-end
reads (default YES).--sortBufferSize=INTEGER SE, PE Buffer size used by the read sorting process, in megabytes
(default: 1984).--sortKeepAllReads SE, PE Run the sort module in archival mode instead of the default
filtered mode.See Archival Build on page 92).Example: --sortKeepAllReads
Table 19 Analysis Options for sort

Variant
DetectionandCounting
102 Part # 15011196 RevC
Options for Target rnaCountsThe options described below are used to specify analysis for target rnaCounts.
Option Application Description--refFlatFile SE Name and location of UCSC refFlat.txt.gz file.
The file must be gz-compressed.Example: --refFlatFile=/data/Genome/ELAND_
RNA/Human/refFlat.txt.gz
--seqGeneMdFile SE Name and location of NCBI seq_gene.md.gzfile.Example: --seqGeneMdFile=/data/Genome/ELAND_
RNA/Human/seq_gene.md.gz
--seqGeneMdGroupLabel SE The group label specifies which assembly to usein the seq_gene file, and is found in column 13of the file. seq_gene files can hold entries formultiple assemblies.Required for RNA counting when you use theannotation seqGeneMd file from NCBI.Example: --seqGeneMdGroupLabel‘GRCh37.p2-Primary Assembly’
Table 20 Analysis Options for rnaCounts
Options for Target bamThe options described below are used to specify analysis for target bam.
Option Application Description--bamChangeChromLabels=
OFF/NOFA/UCSC
SE, PE Change chromosome labels in the bam plugin output. Theavailable behaviors are:OFF Use unmodified CASAVA chromosome labels (defaultbehavior).NOFA Remove any ".fa" suffix found on each chromosome label.For example "c11.fa" is changed to "c11".UCSC Remove any ".fa" suffix found on each chromosome labeland attempt to map the result to the corresponding UCSChuman chromosome label. For example "c11.fa" is changed to"chr11".
--bamSkipRefSeq SE, PE Do not generate a reference sequence file with each bam file. Thedefault behavior can be restored with --no-bamSkipRefSeq.
Table 21 Analysis Options for bam
Configuring Multiple RunsTo add multiple runs you can modify the run configuration file (run.conf.xml):
a Go to /Human/conf/run.conf.xml (see Run.conf.xml on page 95).b Add the additional entries to the run.conf.xml file.c Then run the configuration again by executing:./configureBuild.pl -p /Human/

Running
Variant
Detectio
nand
Counting
CASAVA v1.8.2 User Guide 103
Targeted ResequencingSince targeted resequencing only sequences part of a genome, we recommend using theoption --variantsNoCovCutoff to turn off high-coverage filtration of SNPs andindels.
ExamplesThe CASAVA installation provides examples of common use cases, such as:} E. coli Single End} E. coli Paired End} RNA sequencingThe details of these examples are available on the configureBuild.pl help page.Go to the CASAVA installation directory, and type:
./configureBuild.pl
The examples are listed at the bottom of the help page.

Variant
DetectionandCounting
104 Part # 15011196 RevC
VariantDetectionandCountingOutput Files
Once the post-alignment build is complete, all relevant information is listed in the builddirectory, such as:} Build summary html pages.The build summary html pages are located in the buildDir/html folder, andprovides access to run information and graphs of important statistics.
} Variant calls and counts.The CASAVA build contains sequence, SNP, indels, and (for RNA Sequencing)counts information, and is located in buildDir/Parsed_DATE.
} Computer readable statistics.Computer readable statistics are located in buildDir/stats.
} Configuration files.CASAVA configuration files are located in buildDir/conf.
These files are described below.
Build DirectoryAn outline of the CASAVA build directory is shown below.

Variant
Detectio
nand
Counting
Outp
utFiles
CASAVA v1.8.2 User Guide 105
Figure 15 CASAVA Build Directory
The most important folders for downstream analysis are listed below.} Html FolderThe html folder contains the build summary html pages (see Build Html Page onpage 106), which provides access to run information and graphs of importantstatistics.
} Parsed_xx-xx-xx folderThe Parsed_xx-xx-xx folder contains most of the sequencing information, such assorted alignments, SNP and indel calls, and (for RNA Sequencing) gene counts,exon counts, and splice junction counts (see CASAVA Build on page 107). Thisinformation is organized in chromosome folders named c1 or c2, for example.
} Stats Folder

Variant
DetectionandCounting
106 Part # 15011196 RevC
The stats folder contains statistical information in computer readable form, such asthe runs_summary.xml file, which shows which lanes from which run wereaggregated and called for a CASAVA build.
} Conf FolderThe conf folder contains information about the configuration of the project, such asthe project.conf file.
Build Html PageThe build html page is located in buildDir/html. When you open the file Home.html,you will find a list of all runs, and a link to statistics.
Figure 16 Build Html Page
A Report Menu link
The Report Menu link on the build html page will lead you to graphs and tables forimportant statistics:
• Coverage• Duplicates• Indels statistics• SNPs statistics

Variant
Detectio
nand
Counting
Outp
utFiles
CASAVA v1.8.2 User Guide 107
Figure 17 Coverage Graph in Home.html
CASAVA BuildThe CASAVA build, containing sequence, SNP, indels, and (for RNA Sequencing)counts information, is located in the buildDir/Parsed_xx-xx-xx folder.
Sorted.bam FilesThe sorted.bam file is a binary file that contains sorted sequence alignments. There isone sorted.bam file for each chromosome, stored in the 'bam' subdirectory under eachchromosome specific directory.
BAM FormatThe Binary Alignment/Map (BAM) file is the binary equivalent of SAM files and iscompressed in the BGZF format. Each BAM file is much smaller than its SAMequivalent, yet it can be easily converted to SAM, e.g. with samtools using "samtoolsview -h file.bam".When a BAM file is created for each chromosome, these files are placed in the bamdirectory immediately under the Parsed chromosome directory. For example the BAMfile for chromosome 1 in a human build would be located here:
Project_Dir/Parsed_NN-NN-NN/c1.fa/bam/

Variant
DetectionandCounting
108 Part # 15011196 RevC
When one BAM file is created for the entire genome (using the target bam) it can befound in:
Project_Dir/genome/bam/
A set of auxillary files is created with the whole genome BAM file to facilitate use indownstream packages such as SAMtools or the Broad IGV. These files are:} sorted.bam—the bam file itself} sorted.bam.bai—index of the bam file} sorted.bam.fa.gz—gzipped fasta file containing the reference sequence(s)For a description of the BAM format, see samtools.sourceforge.net.The format of SAM files is described in SAM Format on page 171. BAM files are thebinary equivalent of SAM files, and Illumina's BAM convention has the followingfeatures:} The new private optional tag "XC" has been added to provide read statusinformation normally conveyed in the chromosome field of the export.txt file forunmapped reads. Specifically, "XC:Z:QC" is used to mark an ELAND QC failureread, "XC:Z:RM" is used to mark an ELAND repeat mask read, and"XC:Z:CONTROL" is used to mark a control read. No optional field is added toreads which are marked as no match ("NM") in the export file – it is understoodthat this is the default status of an unmapped read..
} Reads which cross a splice junction are annotated as a single record using the SAMCIGAR "N" (SKIP) character. For example, a 75-base read spanning a 1000-baseintron may have the cigar string: "35M1000N40M".
} Chromosome names cannot be changed in the chromosome BAM files on whichCASAVA operates. The bam module may be used to create a whole genome BAMfile with translated chromosome labels. Note that whole genome bam files are nowthe only option for the bam module.
Converting Sam and Bam FilesIf you want to convert Sam files into Bam files, enter the following:
samtools view -b -h -S -o output.bam. <in.sam>
Where:-b Output in the BAM format.-h Include the header in the output.-S Input is in SAM. If @SQ header lines are absent, the ‘-t’ option is required.-o FILE Output file [stdout]
If you want to convert Bam files into Sam files, enter the following:samtools view -h -o output.sam <in.bam>
Where:-h Include the header in the output.-o FILE Output file [stdout]
For more information, see samtools.sourceforge.net.
Variant Detection Output FilesAll variant caller output files are written in a text format composed of one headersegment followed by one data segment.

Variant
Detectio
nand
Counting
Outp
utFiles
CASAVA v1.8.2 User Guide 109
All lines in the header segment begin with the '#' character. Header lines beginning withthe sequence '#$' contain a key,value pair. The reserved key 'COLUMNS' has anassociated value containing the set of column labels in the following data segment.The data segment contains one entry per line, where each line is a set of tab-delimitedcolumns. Wherever appropriate, columns for sequence name and position number areincluded such that the files are tabix compatible.The following files are generated by CASAVA variant detection and counting:} Depth and single position genotype call scores for every mapped site in thereference genome are saved in each bin directory in the gzipped file "sites.txt.gz":Project_Dir/Parsed_NN-NN-NN/c1/0000/sites.txt.gz
Note that this output can be omitted with the --variantsNoSitesFiles option.} The SNPs for each reference sequence are aggregated and filtered according to the -
-variantsSnpCovCutoff setting and summarized in the chromosome-level filesnps.txt:Project_Dir/Parsed_NN-NN-NN/c1/snps.txt
} The indels for each reference sequence are aggregated and filtered according to the --variantsIndelCovCutoff setting and summarized in the chromosome-levelfile indels.txt:Project_Dir/Parsed_NN-NN-NN/c1/indels.txt
} If any SNPs and indels are removed by the high-depth filter, they can be found intheir corresponding bin directory as:Project_Dir/Parsed_NN-NN-NN/c1/0000/snps.removed.txt
Project_Dir/Parsed_NN-NN-NN/c1/0000/indels.removed.txt
} When the --variantsWriteRealigned option is selected, there will alse be aBAM file written to each reference sequence realigned bam directory containing onlythose reads aligned to an alternate alignment by the variant caller. The BAMfilename is sorted.realigned.bam:Project_Dir/Parsed_NN-NN-NN/
c1/bam/realigned/sorted.realigned.bam
} Statistics for coverage, as well as snp and indel calls for all reference sequences arefound in the 'stats' directory:Project_Dir/stats/coverage.summary.txt
Project_Dir/stats/snps.summary.txt
Project_Dir/stats/indels.summary.txt
} A summary of the same information is also available on the following html pages:Project_Dir/html/coverage.html
Project_Dir/html/snps.html
Project_Dir/html/indels.html
To summarize the snps and indels in the stats and html directories above, qualitythresholds are used to select a subset of snps and indels for summary reporting. Thedefault thresholds are Q(snp) >= 20 and Q(indel) >= 20. These values may be changedusing the options --variantsSummaryMinQsnp and --variantsSummaryMinQindel.
snps.txt and sites.txt FilesThe snps.txt files contain the SNP calls sorted by position, while the sites.txt filesprovide depth and single position genotype call scores for every mapped site. There isone snp.txt file for each chromosome, stored in the chromosome-specific directory under

Variant
DetectionandCounting
110 Part # 15011196 RevC
the Parsed-dd-mm-yy directory. The snps.txt and sites.txt files are tab delimited text filescontain the same columns, which are the following:
No Label Description1 seq_name Reference sequence label2 Pos Sequence position of the site/snp3 bcalls_used Basecalls used to make the genotype call for this site4 bcalls_filt Basecalls mapped to the site but filtered out before
genotype calling5 Ref Reference Base6 Q(snp) A Q-value expressing the probability of the homozygous
reference genotype, subject to the expected rate ofhaplotype difference as expressed by the (Watterson) thetaparameter (see New Variant Calling Parameter: Theta on page152).
7 max_gt The most likely genotype (subject to theta, as above).8 Q(max_gt) A Q-value expressing the probability that the genotype is
not the most likely genotype above (subject to theta).9 max_gt|poly_site The most likely genotype assuming this site is polymorphic
with an expected allele frequency of 0.5 (theta is still used tocalculate the probability of a third allele -- i.e. the chance ofobserving two non-reference alleles).
10 Q(max_gt|poly_site) A Q-value expressing the probability that the genotype isnot the most likely genotype above assuming this site ispolymorphic.
11 A_used 'A' basecalls used12 C_used 'C' basecalls used13 G_used 'G' basecalls used14 T_used 'T' basecalls used
Indels.txt FilesIndels for each chromosome are summarized within each chromosome directory in afile called indels.txt. This file contains indels which have been called in each referencesequence by the small variant caller, and filtered to remove those indels which arefound at a depth greater than a multiple of the mean chromosomal depth (3 times themean chromosomal depth is used by default, which can be changed using the --variantsIndelCovCutoff option). This filter is designed to remove indel calls inregions close to centromeres and other high depth regions likely to generate spuriouscalls.
NOTEThis filter is off for RNA variant calling, and we recommend to turn it off fortargeted resequencing.
The indels.txt file follows the general variant caller output file structure. The datasegment of this file consists of 16 tab-delimited fields. The fields are described in theTable below (note that all information is given with respect to the forward strand of thereference sequence):
No Label Description1 seq_name Reference sequence label

Variant
Detectio
nand
Counting
Outp
utFiles
CASAVA v1.8.2 User Guide 111
No Label Description2 pos Except for right-side breakpoints, the reported start position of the indel
is the first (left-most) reference position following the indel breakpoint.For right-side breakpoints the reported position is the right-most positionpreceding the breakpoint. Also note that wherever the same indel couldbe represented in a range of locations, the caller attempts to report it inthe left-most position possible.
3 type String summarizing the indel type. One of:• nI—Insertion of length n (e.g. 10I is a 10 base insertion)• nD—Deletion of length n (e.g. 10D is a 10 base deletion)• BP_LEFT—Left-side breakpoint• BP_RIGHT—Right-side breakpoint
4 ref_upstream Segment of the reference sequence 5’ of the indel event. For right-sidebreakpoints this field is set to the value ‘N/A’.
5 ref/indel Equal length sequences corresponding to the reference and indel alleleswhich span the indel event. The character ‘-‘ indicates a gap sequence ofthe reference or the indel allele.
6 ref_downstream
Segment of the reference sequence 3’ of the indel event. For left-sidebreakpoints this field is set to the value ‘N/A’.
7 Q(indel) Phred scaled quality score of the indel, which refers to probability thatthis indel does not exist at the given position. The Q-values given onlyreflect those error conditions which can be represented in the indel callingmodel, which is not comprehensive. See also Quality Scores on page 150.By default the variant caller reports all indels with Q(indel) > 0.
8 max_gtype Most probable indel genotype. The indel genotype categories are asfollows:hom refers to a homozygous indel.het refers to a heterozygous indel.ref refers to no indel at this position.Note that these do refer to true genotypes where indels overlap becausethe model is not capable of jointly calling overlapping indels. In the caseof overlapping indels, max_gtype refers to the most likely copy-numberof the indel. Note that indel calls where ref is the most-likely genotypewill be reported. These correspond to indels with very low Q(indel)values.
9 Q(max_gtype) Phred scaled quality score of the most probable indel genotype, whichrefers to the probability that the genotype of the indel is not that given as“max_gtype”. The Q-values given only reflect those error conditionswhich can be represented in the indel calling model, which is notcomprehensive. See also Quality Scores on page 150.
10 depth Except for right-side breakpoints, this field reports the depth of theposition preceding the left-most indel breakpoint. For right-sidebreakpoints this is the depth of the position following the breakpoint.
11 alt_reads Number of reads strongly supporting either the reference path or analternate indel path.
12 indel_reads Number of reads strongly supporting the indel path.13 other_reads Number of reads intersecting the indel, but not strongly supporting
either the reference or any one indel path.14 repeat_unit The smallest repeating sequence unit within the inserted or deleted
sequence. For breakpoints this field is set to the value ‘N/A’.15 ref_repeat_
countNumber of times the repeat_unit sequence is contiguously repeatedstarting from the indel start position in the reference case.
16 indel_repeat_count
Number of times the repeat_unit sequence is contiguously repeatedstarting from the indel start position in the indel case.

Variant
DetectionandCounting
112 Part # 15011196 RevC
Note that for a read to strongly support either the reference or the indel alignment, itmust overlap an indel breakpoint by at least 6 bases and the probability of the read’salignment following either the reference or the indel path must be at least 0.999.
Count.txt FilesThere are three different types of _count.txt files, for exon, gene, or splice junction:} Chromosome_exon_count.txt. The _exon_count.txt provides counts for the numberof times a particular exon has been detected in a sample.
} Chromosome_genes_count.txt. The _genes_count.txt provides counts for thenumber of times a particular gene has been detected in a sample.
} Chromosome_splice_count.txt. The _splice_count.txt provides counts for thenumber of reads that align over a particular splice junction
_count.txt files are generated by RNA Sequencing, sorted by position, and there is one ofeach type per chromosome (for example, c19_exon_count.txt). The _count.txt files arestored in the chromosome-specific directory under the Parsed-dd-mm-yy directory, andcontain the following columns:
1 Chromosome—starting with a c. The chromosome on which the exon resides. “cM”indicates a mitochondrial DNA alignment.
2 Start—The start of the gene.
3 End—The end of the gene.
4 Genes—The gene symbol.
5 Normalized count (RPKM)=(109 x raw count)/(feature length x number of mappedbases)
6 Raw count=sum of coverages for each base within the feature.NOTEFor overlapping genes with different gene names only the non-overlappingportions for each gene participate in count generation.
Exon counts are sum of base coverages from genomic and spliced reads. Therefore genecounts are the sum of exon counts. And junction counts (in reads) are provided forhistorical reasons and for alternative splicing analysis.An example of a chromosome_genes_count.txt file opened in Excel is shown below.
Figure 18 Chromosome_genes_count.txt File Opened in Excel

AppendixA
CASAVA v1.8.2 User Guide 113
Appendix A Requirements and Software Installation
RequirementsandSoftwareInstallation
Hardware and Software Requirements 114InstallingCASAVA 118

Req
uirementsandSoftwareInstallation
114 Part # 15011196 RevC
Hardware andSoftwareRequirements
Network InfrastructureThe large data volumes generated and moved when running CASAVA mean that youwill need the following:
1 A high-throughput ethernet connection (1 Gigabit recommended) or other datatransfer mechanism.
2 A suitably large holding area for the analysis output (1 TB per run). As there willalmost certainly be some overlap between copying, analysis, possible reanalysis, 2–3 TB is an absolute minimum.
3 You need to consider which parts of the data you want to store long-term and whatstorage infrastructure you want to provide. CASAVA provides the option to performloss-less data compression.
Storage ConfigurationsYou can configure your analysis server with either local storage or external networkstorage.} Local server storage can be internal to the server, or Direct Attached Storage (DAS),which is a separate chassis attached to the server.• Internal—Simple but not scalable. Results data must be moved off to networkstorage at some point to make room for subsequent runs.
• DAS—External chassis that is scalable since more than one DAS can beconnected to the server. The server is an application server running CASAVAand a file server providing access to results and receiving incoming raw datafiles.
} External network storage is either Network Attached Storage (NAS) or Storage AreaNetwork (SAN). NAS and SAN are functionally equivalent, but SAN is larger, withhigher performance, more connections, and more management options.• NAS—External chassis connected via an Ethernet to the server, instrument PC,and other clients on the network. NAS devices are scalable and highlyoptimized.
• SAN—The most scalable with the highest performance. They have a very highbandwidth and support many simultaneous clients, but are complex to manageand significantly more expensive.
Server ConfigurationsYou can use either a single multi-processor, multi-core computer running Linux, or acluster of Linux servers with a head node. CASAVA can take advantage of clusteredand multi-processing servers.} Single multi-processor, multi-core server—Simple but not scalable. It can onlyanalyze data from one sequencing platform, or two depending on power and yourturn-around requirements.
} Linux Cluster—Highly scalable and capable of running multiple jobssimultaneously. It requires one server as a management node and a minimumnumber of computational notes to be as efficient as a standalone server. By addingcomputational nodes, the cluster can service more instruments.

Hard
ware
andSoftw
areReq
uirements
CASAVA v1.8.2 User Guide 115
NOTEWe test our software with SGE; other cluster configurations (like LSF or PBS)are not recommended.
Analysis ComputerIllumina supports running CASAVA only on Linux operating systems. It may bepossible to run CASAVA on other 64-bit Unix variants, if all of the prerequisitesdescribed in this section are met.Illumina recommends the IlluminaCompute data processing solution for CASAVA.IlluminaCompute is available as a multi-tier option, with the volume of instrumentdata output per week determining the recommended Tier level. For more information,contact Illumina Support.For example, for a laboratory generating 200 GB of sequence per week, the Tier 1IlluminaCompute solution is recommended, for which the specifications are listedbelow (non-IlluminaCompute systems satisfying these requirements are also fullysupported):} 1 APC Netshelter: 40U Rack with 1U KMM console} 3 Dell R610 Server: 8 CPU cores, 48 GB RAM} 3 Isilon IQ12000x storage modules} 1 Serial MGT Console 16} 2 Cisco 3750e switchesSequence alignment takes somewhere between a few hours (using our fast short-readwhole-genome alignment program ELAND) and days (using more traditional alignmentprograms).CASAVA parallelization is built around the multi-processor facilities of the “make”utility and scales very well to beyond eight nodes. Substantial speed increases areexpected for parallelization across several hundred CPUs. For a detailed description, seeUsing Parallelization on page 121.
Disk Space RequirementsWhen running CASAVA without keeping temporary data (removeTemps=ON):} Disk space needed while running = 3 x size of export files} Disk space needed after running = 1.5 x size of export fileWhen running with all temporary files saved (removeTemps=Off):} Disk space while running = 5 x size of export filesFor example: to generate a build from one lane of E. coli data (1 GB withremoveTemps=ON), we recommend an additional 3 GB of disc space while runningCASAVA and ~1.5 GB for the final build directory.
NOTEFor large projects (such as human genome resequencing) we recommendusing highly distributed disk storage (like Lustre or Isilon).
The space requirements for ELAND temporary files inside the Aligned directory, as longas you stay at <13M reads per eland set size, are as follows:} Eight bytes per match} This should equate to less than 0.6 GB per process} This is less than 5GB for 8 ELAND processesIf /tmp space is an issue, perform the following:

Req
uirementsandSoftwareInstallation
116 Part # 15011196 RevC
} Increase space for /tmp.} Decrease ELAND_FASTQ_FILES_PER_PROCESS (see ELAND_FASTQ_FILES_PER_PROCESS on page 65). Setting the right value for the ELAND_FASTQ_FILES_PER_PROCESS is very important, because too low may result in a decreasedperformance.
Memory RequirementsCASAVA requires a minimum of 2 GB RAM per core. The parameter ELAND_FASTQ_FILES_PER_PROCESS in the configureAlignment config.txt specifies the maximumnumber of files aligned by each ELAND process. The optimal value is such that thereare approximately 10 to 13 million lines (reads) in one set.
NOTEPeak memory usage occurs during the ELANDv2e portion ofconfigureAlignment.
Software RequirementsCASAVA has been primarily developed and tested on CentOs 5, Illumina'srecommended and supported platform. It may be possible to install and run CASAVAon other 64-bit Linux distributions (particularly on similar distributions such as RedHatand Fedora) or on other Unix variants, if all of the prerequisites described in this sectionare met.The required software environment is described below:} CASAVA installation may not work properly with gcc versions 3.x. If you have agcc version 3.x, install gcc 4.0.0 or newer up to and including version gcc 4.5.2,with the exception of gcc version 4.0.2, which is not supported.
} Installation of CASAVA 1.8 now requires the Boost C++ library, version 1.44.0 andcmake version 2.8.0 and above. These packages are included in the CASAVAinstallation package, and will automatically install during the configure stage ifeither package is not found in the user’s environment.
The following software is required to run the CASAVA 1.8; check whether it has beeninstalled:} GNU make (3.81 recommended)} Perl (>= 5.8)} Python (>=2.3 and <=2.6)} PyXML} gnuplot (>= 3.7, 4.0 recommended)} ImageMagick (>= 5.4.7)} ghostscript} libxslt} libxslt-devel} libxml2} libxml2-devel} libxml2-python} ncurses} ncurses-devel} gcc (4.0.0 or newer up to and including version gcc 4.4.x, except 4.0.2), with c++} libtiff} libtiff-devel

Hard
ware
andSoftw
areReq
uirements
CASAVA v1.8.2 User Guide 117
} bzip2} bzip2-devel} zlib} zlib-devel} Perl modules• perl-XML-Dumper• perl-XML-Grove• perl-XML-LibXML• perl-XML-LibXML-Common• perl-XML-NamespaceSupport• perl-XML-Parser• perl-XML-SAX• perl-XML-Simple• perl-XML-Twig• perldoc

Req
uirementsandSoftwareInstallation
118 Part # 15011196 RevC
InstallingCASAVA
Starting with CASAVA 1.8, CASAVA must be built outside of the source directory.NOTEFor more information on the installation procedure, see the file CASAVA-1.8.0/install/CASAVA-1.8.2/src/INSTALL .
The installation procedure is as follows:
1 The Boost library 1.44.0 is bundled in the CASAVA distribution and will beautomatically built when necessary. If you want to use a preinstalled Boost library,declare the BOOST_ROOT bash variable by typing the following at the commandprompt prior to running the CASAVA./configure script:export BOOST_ROOT=/path_to_compiled_boost_directory/boost_1_
44_0
2 Download CASAVA v1.8 and copy it in a temporary directory (you will not need tokeep it once the installation is done), like /tmp for example.
3 Download and untar CASAVA v1.8 using the following commands:cd /tmp
tar xvjf CASAVA_1.8.2.tar.bz2
4 Prepare to build CASAVA:mkdir CASAVA-1.8.2-build
cd CASAVA-1.8.2-build
5 Prepare CASAVA installation directory:mkdir /illumina/software/CASAVA-1.8.2
6 Configure CASAVA so it will be first built and then install where you want (in thisexample we want to install it in /illumina/software/CASAVA-1.8.2):../CASAVA_1.8.2/src/configure --
prefix=/illumina/software/CASAVA-1.8.2
7 Build CASAVA:make
8 Finally install it:
make install
NOTEFor more information on the configuration options:
../CASAVA_1.8.2/src/configure --help
Setting Up Email ReportingThe script Gerald/runReport.pl is called at the end of a run and sends you an emailwhen a run successfully completes.To use email notification, set up an SMTP server and set the following parameters inthe configureAlignment configuration file. For additional information, seeconfigureAlignment Configuration File on page 56.
1 Enter a space-separated list of the email addresses that should receive the runcompletion notification.EMAIL_LIST [email protected] [email protected]

InstallingCASAVA
CASAVA v1.8.2 User Guide 119
2 Indicate the path to the Aligned folder. The software assumes it can create a validURL from the Aligned folder path by omitting a number of leading path elementsas specified by NUM_LEADING_DIRS_TO_STRIP (by default two) and prependingWEB_DIR_ROOT.WEB_DIR_ROOT http://server/SHARE
For example, if the path is /mnt/yourDrive/folder/folder/Aligned and WEB_DIR_ROOT is http://server/SHARE, the software will write the links ashttp://server/SHARE/folder/Aligned/File.htm.
3 Identify your domain. Your SMTP server may refuse to accept emails from or sendemails to addresses that do not end in @yourdomain.com.EMAIL_DOMAIN yourdomain.com
4 Identify your IP address.EMAIL_SERVER yourserver:25
where yourserver is the name or IP address of a mail server that will accept SMTPemail requests from you and 25 is the port number of the SMTP service on thatserver.Generally this will be 25. This is the default value if no port number is specified.The utility nmap, if installed, may help you identify which port on a server ishosting an SMTP service.
5 Test your email reporting by entering the following from the machine where you arerunning configureAlignment:telnet yourserver yourPortNumber
If you don't get a friendly message, then email reporting will not work.You can run runReport.pl directly in test mode by entering:/runReport.pl --test yourserver:25 yourdomain.com anything
You should receive a test email. If you do not, the transcript it generates shouldidentify the problem.
NOTEThe optional email reporting feature depends on how your SMTP serversare set up locally. Email reporting is not required to run theconfigureAlignment to a successful completion.

120 Part # 15011196 RevC

AppendixB
CASAVA v1.8.2 User Guide 121
Appendix B Using Parallelization
UsingParallelization
“Make” Utilities 122

Using
Parallelization
122 Part # 15011196 RevC
“Make”Utilities
Parallelization is built around the ability of the standard “make” utility to execute inparallel across multiple processes on the same computer. configureAlignment alsoprovides a series of checkpoints and hooks that enables you to customize theparallelization for your computing setup. See Customizing Parallelization on page 123 fordetails.
Standard “Make”The standard “make” utility has many limitations, but it is universally available andhas a built-in parallelization switch (“-j”). For example, on a dual-processor, dual-coresystem, running “make -j 4” instead of “make,” executes the configureAlignment run inparallel over four different processor cores, with an almost 4-fold decrease in analysisrun time. On a system with more sockets or more cores per socket, “-j 8” or more maybe advisable.
Distributed “Make”There are several distributed versions of “make” for cluster systems. Frequently usedversions include “qmake” from Sun Grid Engine (SGE).To use “qmake,” a short wrapper script is required. See below for details.There are known issues with the use of “lsmake” that prevent parts of CASAVA fromrunning. Therefore, Illumina does not recommend using “lsmake” to run CASAVA.
NOTEDistributed cluster computing may require significant systemadministration expertise.Illumina does not support external installations.
Using qmakeSGE has the utility qmake, which can run the tasks of a make across a cluster inparallel. There are two possible ways to run this.
Separate Jobs on Queuing SystemThe first generates each make tasks as a separate job run on the queuing system:
6 Move into the output folder .
7 Create a script file which contains the following:qmake -cwd –v PATH -- -j 32
8 Submit the jobs to the SGE:qsub –cwd –v PATH <script file>
The options convey the following information:} –cwd tells the job to run in the current directory} –v PATH passes the job the path to the executables needed for CASAVA.} -- tells the job to pass everything after the -- to the make command} –j tells qmake how many tasks to run at the same time. Qmake will then submitthis number of tasks to the SGE queue. As tasks finish more tasks will be submitted.

“Make”
Utilities
CASAVA v1.8.2 User Guide 123
The number after the –j should be adjusted depending on the size of the systemand the number of users sharing it.
This method uses resources efficiently, but job monitoring and management is harder. Ifyou need to kill a job you have to kill each of these tasks individually.
Slots Dedicated UpfrontThe second method uses a parallel environment where a number of slots are dedicatedupfront and the tasks are run on these slots.
1 Move into the output folder.
2 Create a script file which contains the following::qmake -cwd –v PATH –inherit -- all
3 Submit the jobs to the SGE:qsub –cwd –v PATH –pe make 32 <script file>
In addition to the options described above, this method uses the following options:} -pe make says to run in the parallel environment, make is the default one} The number after the word make says how many slots the job needs to run. If youset this number too high you may have to wait a long time for them all to becomefree. It will never run if you set it to more slots than you have on your system.The more slots you use the quicker your job will run (up to the parallelization limit)but the correct number to use depends on how big the system is, the number ofother users, and the number of jobs you want to run at any one time.
This method can have some inefficiency if there are fewer tasks than slots at any point,but it allows easy job monitoring and management. If you need to kill your job then thisis much easier with this method.When you submit the job the command will return the SGE job id. You can getinformation about the state of your job with qstat –j <job id> or viewing it withqmon.
Customizing ParallelizationMany parts of configureAlignment are intrinsically parallelizable by lane or tile.However, some parts of configureAlignment cannot be parallelized completely.configureAlignment has a series of additional hooks and check-points forcustomization.The configureAlignment can be divided into a series of steps with different levels ofscalability where synchronization “barriers” cause configureAlignment to wait for eachof the tasks within a step to finish before going to the next step.You can parallelize the steps at the run level (no parallelization), the lane level (up toeight jobs in parallel), and the tile level (up to thousands of jobs in parallel). Each stepis initiated by a “make” target. After completion of each of these steps,configureAlignment produces a file or a series of files at the lane/tile level, thatdetermines whether all jobs belonging to the step have finished. Finally, hooks areprovided upon completion of the step to issue user-defined external commands.
Parallelization LimitationsThe analysis works on a per-file basis, so the maximum degree of parallelizationachievable is equal to the total number of files generated during demultiplexing.
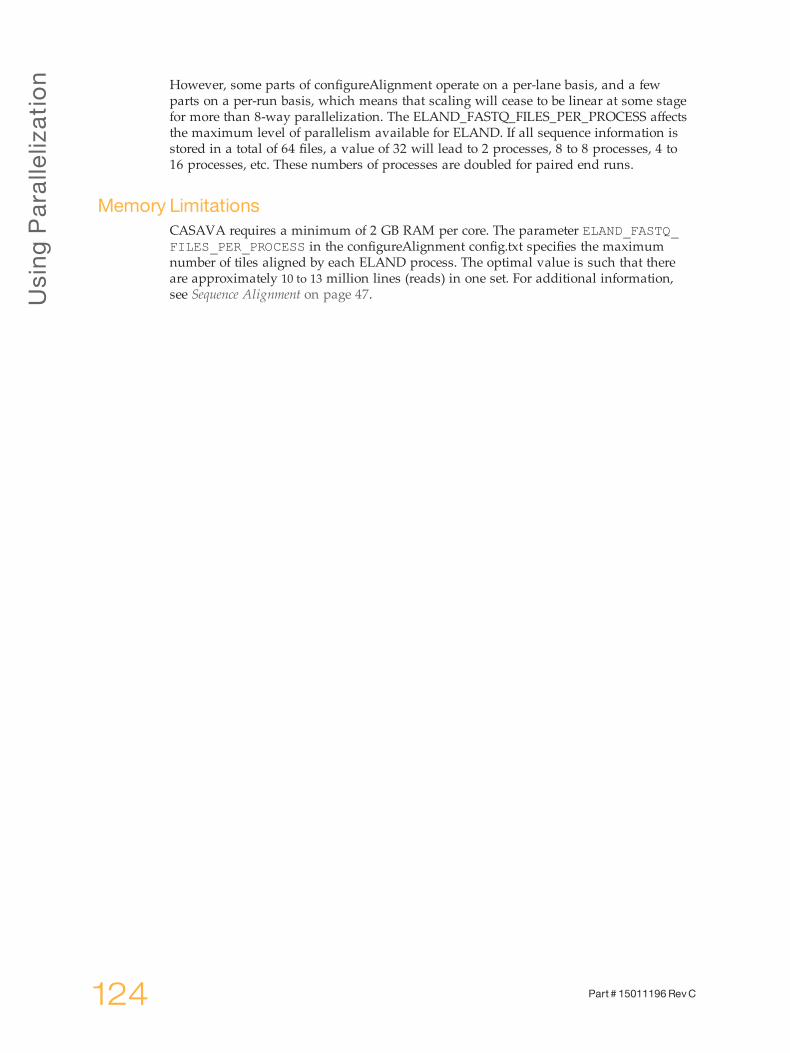
Using
Parallelization
124 Part # 15011196 RevC
However, some parts of configureAlignment operate on a per-lane basis, and a fewparts on a per-run basis, which means that scaling will cease to be linear at some stagefor more than 8-way parallelization. The ELAND_FASTQ_FILES_PER_PROCESS affectsthe maximum level of parallelism available for ELAND. If all sequence information isstored in a total of 64 files, a value of 32 will lead to 2 processes, 8 to 8 processes, 4 to16 processes, etc. These numbers of processes are doubled for paired end runs.
Memory LimitationsCASAVA requires a minimum of 2 GB RAM per core. The parameter ELAND_FASTQ_FILES_PER_PROCESS in the configureAlignment config.txt specifies the maximumnumber of tiles aligned by each ELAND process. The optimal value is such that thereare approximately 10 to 13 million lines (reads) in one set. For additional information,see Sequence Alignment on page 47.

AppendixC
CASAVA v1.8.2 User Guide 125
Appendix C Reference Files CASAVA
ReferenceFilesCASAVA
Introduction 126ELANDReference Files 127Variant Detection and Counting Reference Files 129Getting Reference Files 130

Reference
FilesCASAVA
126 Part # 15011196 RevC
Introduction
CASAVA needs a number of special reference files to run analysis, especially for RNAsequencing.This chapter describes the reference files that are needed to run Elandv2e and CASAVAvariant detection, and provides instructions how to generate these files for other speciesand builds. As of CASAVA 1.8, ELAND squashes genome files automatically when itstarts.Genome sequence files for most commonly used model organisms are available throughiGenome (Getting Reference Files on page 130).

ELA
NDReference
Files
CASAVA v1.8.2 User Guide 127
ELANDReference Files
ELAND needs the following file to perform an alignment:} Unsquashed genome sequence files. As of CASAVA 1.8, ELAND squashes genomefiles automatically when it starts.
In addition, eland_rna needs two types of files to analyze RNA Sequencing data:} Abundant sequences files: mitochondrial DNA, ribosomal region sequences, 5SRNA (optional), and other contaminants
} RefFlat.txt.gz file (UCSC type) or seq_gene.md.gz file (NCBI type).
Reference GenomeCASAVA uses a reference genome in FASTA format. Both single sequence FASTA andmulti-sequence FASTA genome files are supported.Genome sequence files for most commonly used model organisms are available throughiGenome (Getting Reference Files on page 130).
NOTEAs of CASAVA 1.8, you do not need to squash the reference genomeanymore.
Single Sequence FASTA FilesCASAVA accepts single-sequence FASTA files as genome reference, which should beprovided unsquashed for both alignment and post-alignment steps. The chromosomename is derived from the file name.Direct CASAVA to a folder containing the FASTA files using the option ELAND_GENOMEfor configureAlignment.
Multi-Sequence FASTA FilesAs of version 1.8, CASAVA accepts a multi-sequence FASTA file as genome reference.This should be provided as a single genome, SAM compliant, unsquashed file, for bothalignment and post-alignment steps. The chromosome name is derived directly fromthe first word in the header for each sequence.Direct CASAVA to a multi-sequence FASTA file using the option SAMTOOLS_GENOMEfor configureAlignment.
WARNINGGenomeStudio does not support the use of multi-sequence FASTA files.Therefore, if you want to analyze your output in GenomeStudio, werecommend using single sequence FASTA reference files.
Chromosome Naming RestrictionsCASAVA does not accept the following characters in the FASTA chromosome nameheader:
- ? ( ) [ ] / \ = + < > : ; " ' , * ^ | &
This validation can be disabled in configureAlignment using the following option:CHROM_NAME_VALIDATION off
WARNINGYou may run into problems with downstream analysis if you disablechromosome name validation.

Reference
FilesCASAVA
128 Part # 15011196 RevC
NOTEIf ELAND finds two alignments with identical alignment scores, ELANDwillpick the first alignment (in the single-end case) or combination of alignments(in the paired-end case) that exhibit the highest observed alignment quality.These are the alignments that make it into the export files (which onlycontain the best alignment for each read). In practice, post-alignmentCASAVA ignores these reads because of the low alignment qualities.Using areference with lexicographic chromosome names (like chr1) will yieldslightly different results compared to a reference with numericalchromosome names (like 1) for these reads, since the hits are sorted in adifferent way.
Reference Sequence BlocksFor reasons of efficiency, ELAND treats the reference sequence as being in “blocks” of 16 MB, of which there can be at most 240. This limits the total length of DNA that ELANDcan match against in a single run.In a single ELAND run you can match against:} One file of at most 240 x 16=3824 MB} 239 files, each up to 16 MB in size} Something in between, such as 24 files of up to 160 MB each. (The NCBI humangenome will fit.)
Abundant Sequences Files (eland_rna)eland_rna uses these files to mask hits to abundant or contaminant sequences. The filescan be derived from the following sources:} Mitochondrial DNA} Ribosomal repeat region sequences} 5S RNA (optional)} Other contaminants, for example phiX, if phiX spikes are usedeland_rna uses squashes the provided FASTA files at the start automatically, similar tothe genome sequence files.
refFlat.txt.gz or seq_gene.md.gz File (eland_rna)As of CASAVA 1.7,eland_rna uses the refFlat.txt.gz or seq_gene.md.gz file to generatethe splice junction set automatically. The refFlat.txt.gz file comes from UCSC, while theseq_gene.md.gz file comes from NCBI, and are available through iGenomes. Theyshould be provided gzip compressed, and should be from the same build as thereference files you are using for alignment. This negates the need to provide separatesplice junction sets as in previous versions of CASAVA.

Variant
Detectio
nand
Counting
Reference
CASAVA v1.8.2 User Guide 129
VariantDetectionandCountingReference Files
CASAVA variant detection and counting needs two types of files to analyze RNASequencing data:} Genome sequence files} refFlat.txt.gz or seq_gene.md.gz File (RNA Seq)
NOTECASAVA for DNA sequencing only needs the genome sequence files.
Reference GenomeCASAVA uses a reference genome in FASTA format. Both single sequence FASTA andmulti-sequence FASTA genome files are supported.Genome sequence files for most commonly used model organisms are available throughiGenome (Getting Reference Files on page 130).
Single Sequence FASTA FilesCASAVA accepts single-sequence FASTA files as genome reference, which should beprovided unsquashed for both alignment and post-alignment steps. The chromosomename is derived from the file name.Direct CASAVA to a folder containing the FASTA files using the option --refSequences=PATH for variant detection and counting.
Multi-Sequence FASTA FilesAs of version 1.8, CASAVA accepts a multi-sequence FASTA file as genome reference.This should be provided as a single genome, SAM compliant, unsquashed file, for bothalignment and post-alignment steps. The chromosome name is derived directly fromthe first word in the header for each sequence.Direct CASAVA to multi-sequence FASTA file using the option --samtoolsRefFile=FILE for variant detection and counting.
WARNINGGenomeStudio does not support the use of multi-sequence FASTA files.Therefore, if you want to analyze your output in GenomeStudio, werecommend using single sequence FASTA reference files.
Chromosome Naming RestrictionsCASAVA does not accept the following characters in the chromosome name:
- ? ( ) [ ] / \ = + < > : ; " ' , * ^ | &
refFlat.txt.gz or seq_gene.md.gz FileCASAVA 1.8 generates the non-overlapping exon coordinates set automatically usingthe refFlat.txt.gz file (from UCSC) or seq_gene.md.gz file (from NCBI). They should befrom the same build as the reference files you are using for alignment, and are availablefrom iGenome for the most common model organisms (Getting Reference Files on page130).

Reference
FilesCASAVA
130 Part # 15011196 RevC
GettingReference Files
To run CASAVA, you will need to download genome and other reference files. You canuse iGenome for most commonly used model organisms. This is explained in thissection.
Illumina Provided GenomesIllumina provides a number of commonly used genomes at ftp.illumina.com along witha reference annotation:} Arabidopsis_thaliana} Bos_taurus} Caenorhabditis_elegans} Canis_familiaris} Drosophila_melanogaster} Equus_caballus} Escherichia_coli_K_12_DH10B} Escherichia_coli_K_12_MG1655} Gallus_gallus} Homo_sapiens} Mus_musculus} Mycobacterium_tuberculosis_H37RV} Pan_troglodytes} PhiX} Rattus_norvegicus} Saccharomyces_cerevisiae} Sus_scrofaYou can login using the following credentials:} Username: igenome} Password: G3nom3s4uFor example, download the FASTA, annotation, and bowtie index files for the humanhg18 genome with the following commands:
>wget --ftp-user=igenome --ftp-password=G3nom3s4u
ftp://ftp.illumina.com/Homo_sapiens/UCSC/hg18/Homo_sapiens_
UCSC_hg18.tar.gz
Unpack the tar file:tar xvzf Homo_sapiens_UCSC_hg18.tar.gz
Unpacking will make its own folderHomo_sapiens/UCSC/hg18
Abundant Sequence Files (RNA Seq)Process the abundant sequence files the following way:
1 Generate a folder for abundant sequences.
2 Collect FASTA files for abundant sequences in the abundant sequences folder; forexample, files containing these sequences:• The cM.fa file from the genome folder.

Getting
Reference
Files
CASAVA v1.8.2 User Guide 131
• A ribosomal sequences FASTA file. You will need to find it for your genome ofinterest, for example, from GenBank.
• A 5SRNA FASTA file (optional). You will need to find it for your genome ofinterest, for example, from GenBank.
• A contaminants file. You can use the same newcontam.fa file as for human,mouse or rat.
You do not need to have all of the files listed above, but you need at least one filefor eland_rna to work properly. You can add other abundant sequences FASTA filesif desired.
NOTEAbundant sequence files need to be single-FASTA files, no multi-FASTAallowed.

132 Part # 15011196 RevC

AppendixD
CASAVA v1.8.2 User Guide 133
Appendix D Algorithm Descriptions
AlgorithmDescriptions
Introduction 134ELANDv2 and ELANDv2e 135Variant Detection 143readBases Counting Method 160
AlgorithmDescriptions
134 Part # 15011196 RevC
Introduction
This appendix explains the algorithms used in CASAVA for the following functions:} Alignment using ELAND} Indel detection and small variant genotyping} RNA sequencing counting methods

ELA
NDv2
andELA
NDv2e
CASAVA v1.8.2 User Guide 135
ELANDv2andELANDv2e
Efficient Large-Scale Alignment of Nucleotide Databases (ELAND) is a very fast alignerand should be used to match a large number of reads against a genome.As of CASAVA 1.6 a new version of ELAND is available, ELANDv2. The mostimportant improvement of ELANDv2 is its ability to perform multiseed and gappedalignments. As a consequence, ELANDv2 handles indels and mismatches better.CASAVA 1.8 also contains a new version of ELAND (ELANDv2e), with an orphanaligner, repeat resolution, and performance enhancements.
Input and Output FilesFor a detailed description of the input and output files for ELANDv2e, seeconfigureAlignment Input Files on page 50 and configureAlignment Output Files on page 75.
ELANDv2 Algorithm Description
Multiseed and Gapped AlignmentELANDv2 introduces multiseed and gapped alignments:} Multiseed alignment works by aligning the first seed of 32 bases and consecutiveseeds separately.
} Gapped alignment extends each candidate alignment to the full length of the read,using a gapped alignment method that allows for gaps up to 10 bases.
A 'match descriptor' string in the output file (see Output File Formats on page 1) encodeswhich bases in the read matched the genome and which were mismatches, and reportsthe gaps using the escape sequence "^..$" (see Export.txt.gz on page 81).The differences between gapped and ungapped alignments, and singleseed andmultiseed alignments are illustrated below.
Figure 19 Ungapped Versus Gapped Alignment

AlgorithmDescriptions
136 Part # 15011196 RevC
Figure 20 Singleseed Versus Multiseed Alignment
Note that a read has to have at least one seed that matches with at most 2 mismatches,and for that seed no gaps are allowed. For the whole read we allow any number ofgaps, as long as they correct at least five mismatches downstream.

ELA
NDv2
andELA
NDv2e
CASAVA v1.8.2 User Guide 137
Alignment Score CalculationThe base quality values and the positions of the mismatches in a candidate alignmentare used to give a probability score (p-value) to each candidate. This is the probabilitythat the candidate position in the genome aligned to would, if its bases were sequencedat error rates that correspond to the read's quality values, give rise to the observed read.This way the contribution of each base is weighted according to its quality.
NOTEA consequence of this is that the best alignment does not necessarily havethe least number of mismatches, although an exact match will always beatany alignment containing mismatches.
The alignment score of a read is computed from the p-values of the candidatealignments. The candidate with the highest p-value is the best candidate and itsalignment score is its p-value as a fraction of the sum of the p-values of all thecandidates. This is also known as a Bayes' Theorem inversion. The alignment score isexpressed on the Phred scale, i.e. Q20 corresponds to 1% chance of alignment beingwrong, Q30=0.1%, etc.For example, if there are two candidates for a read with p-values 0.9 and 0.3, thealignment score calculation would be as follows:0.9/(0.9+0.3) = 0.75, chance of highest scoring alignment being right1- 0.75 = 0.25, chance of highest scoring alignment being wrongExpressed on the Phred scale:Alignment score = -10 log (0.25) = 6.
NOTEThe alignment score of a read and the p-values of the candidate alignmentsfor the read are not the same. The former is computed from the latter.
Rest-of-Genome CorrectionIf only one candidate alignment is found, the scoring scheme above would give aninfinite Phred score. MAQ deals with this by giving such cases an arbitrary high scoreof 255. ELANDv2e uses a constant known as the 'rest-of-genome correction' thatdepends on the average base quality of the read, the read length and the size of thegenome. This gives a scoring scheme with the following properties:} Single-candidate alignments for longer reads will score more highly than single-candidate alignments of shorter reads
} Single-candidate alignments for better quality reads will score more highly thansingle-candidate alignments of lower quality reads
} Single-candidate alignments to shorter genomes will score more highly than single-candidate alignments to longer genomes
Unreported Unique AlignmentsA line in an export file will only contain alignment information if the alignment scorefor that read exceeds a threshold. The primary purpose of this threshold is to retain onlyalignments that are markedly better than any other possible alignment for the read.configureAlignment reduces alignment quality to a single confidence score and readquality, the number of mismatches in the best alignment, and the presence of othercandidate alignments all contribute to the calculation of that score. Therefore, changesin any of these three variables will affect whether the alignment passes the alignmentquality threshold. So even if only a single candidate alignment has been found for a

AlgorithmDescriptions
138 Part # 15011196 RevC
read, it may still fail the alignment quality threshold for one of two reasons, and not bereported in export.txt.gz:} Low base quality values.} Excessive number of mismatches in the candidate alignment. There will be at most2 mismatches in the seed but potentially there can be any number of mismatches inthe remainder of the read.
For most applications, this is the right thing in both cases. For example, you would notwant to use a read with 10 mismatches for SNP calling, even if it is the only candidatefound. The same applies for a read of poor base quality.
Gapped Alignment ScoringGiven a read, ELANDv2e determines positions in the genome to which substrings ofthe read (seeds of length 32 bp) match with at most two errors. We then grab xadditional bases before and after the hit position (default value for x is 5) to account forpotential gaps in the alignment phase.We then compute a global alignment between the read and the reference which meansthat the entire read is aligned to the reference. We are using affine gap penalties:opening a gap is more expensive than prolonging an existing gap. The alignmentalgorithm is furthermore banded, i.e. we restrict ourselves to a maximal length of anexpected insertion/deletion (this value is set to 10).
Conditions for Opening a GapELANDv2 tries to be conservative about when to open a gap. There are two mainconditions that have to be satisfied to open a gap:
1 A gap corrects at least five mismatches downstream: this means that the number ofmismatches between the ungapped and the gapped alignment is at least five.
2 We set the number of mismatches in the gapped and ungapped alignment inrelation to each other. The reason is that we want to distinguish gaps that improvenoisy ungapped alignments and real small insertions/deletions. To this end, wedefine the _noise ratio_ as (#(mismatches ungapped_alignment)-#(mismatchesgapped_alignment)/#(mismatches gapped_alignment). If the ratio for a givenalignment exceeds a certain value (set to 3.1 by default), we insert a gap.
If any of two conditions is not satisfied, we return an ungapped alignment as the result.
ELANDv2e Alignment ImprovementsCASAVA 1.8 features ELANDv2e. This updated alignment program includes thefollowing new features:} Better repeat resolution} A new orphan aligner} Shorter run times with a new version of alignmentResolver
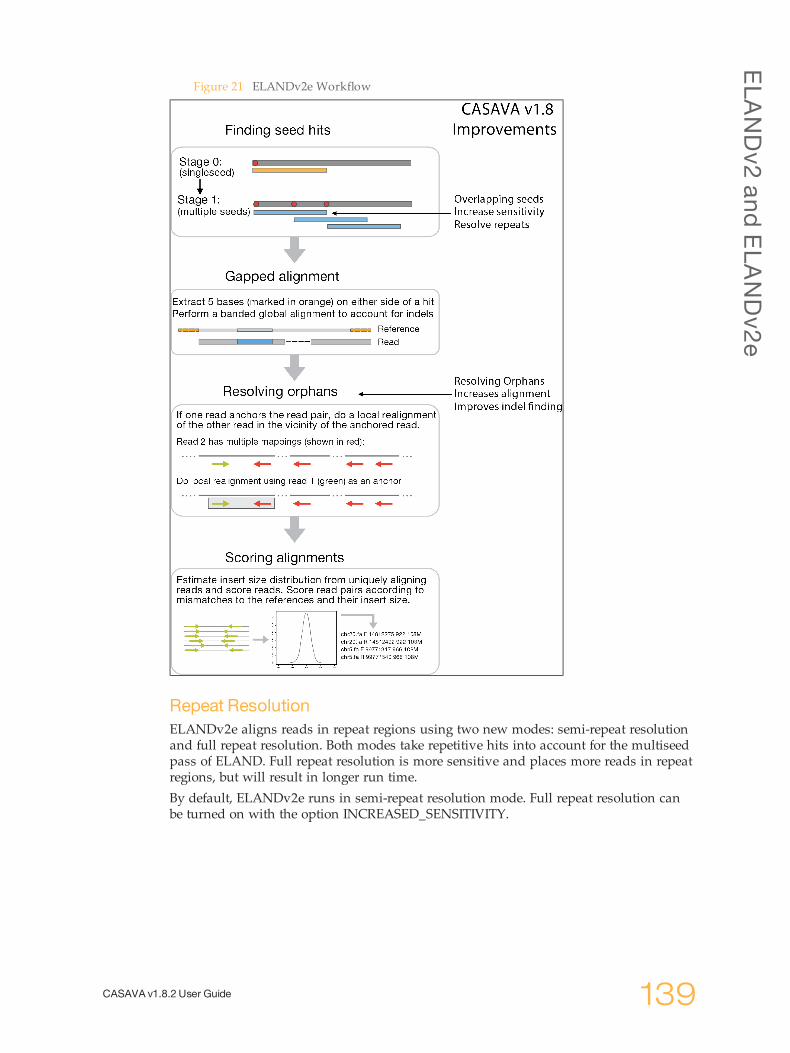
ELA
NDv2
andELA
NDv2e
CASAVA v1.8.2 User Guide 139
Figure 21 ELANDv2e Workflow
Repeat ResolutionELANDv2e aligns reads in repeat regions using two new modes: semi-repeat resolutionand full repeat resolution. Both modes take repetitive hits into account for the multiseedpass of ELAND. Full repeat resolution is more sensitive and places more reads in repeatregions, but will result in longer run time.By default, ELANDv2e runs in semi-repeat resolution mode. Full repeat resolution canbe turned on with the option INCREASED_SENSITIVITY.

AlgorithmDescriptions
140 Part # 15011196 RevC
Figure 22 Changes between CASAVA 1.7 and 1.8 in multiseed ELAND alignment
Orphan AlignmentELANDv2e performs orphan alignment by identifying read pairs for which only one ofthe reads aligns. ELANDv2e tries to align the other read in a defined window (bydefault 450 bp). If the number of mismatches is <10% of the read length, ELANDv2ereports the alignment.

ELA
NDv2
andELA
NDv2e
CASAVA v1.8.2 User Guide 141
Figure 23 Orphan Alignment
Alignment Performance ImprovementsThe multiple component updates in CASAVA were designed to improve overallalignment performance. To asses the performance change, alignment percentage,mismatch rates, and CPU run times were compared for three different configurations:CASAVA v1.7, CASAVA v1.8 with semi-repeat resolution, and CASAVA v1.8 with fullrepeat resolution. The data set consisted of three lanes of HiSeq™ data from a singlesample sequenced with TruSeq v3 chemistry. The analysis was performed on aniCompute cluster with j = 32, metrics are for reads passing filtering.
CASAVA v1.8 aligns a higher percentage of reads, with full repeat alignmentperforming best. This higher alignment rate results from the improved ability to align in

AlgorithmDescriptions
142 Part # 15011196 RevC
more challenging repeat regions. Remarkably, even with more reads aligned in repeatregions, mismatch rates are still very similar.
While CASAVA v1.8 provides the highest percentage of aligned reads, this level ofperformance does require additional computational time (Table 2). For the ELAND step,v1.8 full repeat resolution takes quite a bit longer to run than semi-repeat resolution(520 hours versus 855 hours). Therefore, researchers should consider the trade-offbetween higher performance and slower run time to select the type of analysis bestsuited for their project. .Other algorithms have been updated in CASAVA v1.8 to improve run times. Themodule alignmentResolver (previously called PickBestPair) has been rewritten, whichhas resulted in much faster run times for this step (200 hours for v1.7, versus 15 forv1.8).The best analysis type therefore depends on the project: is a shorter run time moreimportant, or the highest number of aligned reads.

Variant
Detectio
n
CASAVA v1.8.2 User Guide 143
VariantDetection
Post-alignment CASAVA performs variant detection using two modules:} The assembleIndels module (Grouper) detects candidate indels usingsingleton/orphan and anomalous read pairs. The assembleIndels module workswell for detecting larger indels. The candidate indels detected by the assembleIndelsmodule are passed on to the small variant caller for consolidation and genotyping.
} The callSmallVariants module genotypes and provides quality scores for SNPs andindels. Indels can be called from candidate indel evidence provided by bothELAND gapped-read alignments (for smaller indels) and from the assembleIndelsmodule (for larger indels).
For each SNP or indel call the probability of both the called genotype and any non-reference genotype is provided as a quality score (Q-score). Reads are re-aligned aroundcandidate indels to improve the quality of SNP calls and site coverage summaries.The callSmallVariants module also generates files which summarize the depth andgenotype probabilities for every site in the genome. As a final step it produces tablesand html-formatted reports of SNP and indel calls .
assembleIndelsModule ImprovementsThe major changes for the assembleIndels module (Grouper) are:} assembleIndels uses an additional method to identify indels. It finds read pairs thatmap anomalously (for example, with unexpected insert size), and identifiespotential indels.
} assembleIndels merges indel calls detected through anomalous read pairs withthose identified through singleton/orphan reads, and combines clusters that appearto correspond to the same event.

AlgorithmDescriptions
144 Part # 15011196 RevC
Figure 24 Changes to the assembleIndels Workflow
assembleIndels AlgorithmThe assembleIndels module (Grouper) runs only during paired-read DNA CASAVAbuilds. In CASAVA v1.8, it uses orphan reads and anomalous read pairs to detectindels.Grouper detects indels in five stages:
1 Compute clusterings of non-aligned 'orphan reads'.
2 Compute clusterings of anomalous read pairs, with an insert size that isanomalously large (possible deletion) or small (possible insertion).
3 Combine clusters that appear to correspond to the same event.
4 Assemble them into contigs.

Variant
Detectio
n
CASAVA v1.8.2 User Guide 145
5 Align the contigs back to the genome, using the positions of associated 'singleton'reads to narrow the search to a couple of thousand bp or so.
Figure 25 assembleIndels Algorithm
assembleIndels ComponentsThe assembleIndels module contains the following components:} IndelFinder—The IndelFinder component takes a sorted.bam file from a CASAVAbuild and extracts:• Any reads containing gapped alignments

AlgorithmDescriptions
146 Part # 15011196 RevC
• Any reads whose alignment is much worse than expected given its quality• Any 'orphan' reads not thought to be due just to poor base quality• Reads from read pairs mapped anomalously. The expected relative orientationof read partners and the insert size statistics required to detect the anomaliesare read per-lane from the s_?_pair.xml files produced during the alignmentphase by alignmentResolver. An anomalously large insert size is defined as 3standard deviations above the median; an anomalously small one as 5standard deviations below the median.Two types of anomalous mapping areused:— Insert size anomalously large : Possible deletion— Insert size anomalously small : Possible insertion
IndelFinder tries to exclude reads for which the bad or non-existent alignment isjust a consequence of poor base quality
} AlignCandidates—The component AlignCandidates does a dynamic programmingalignment of each orphan read, looking in the interval within which it is expectedto sit. It takes the output of IndelFinder and does a localized alignment of each read.If this procedure finds an alignment for a read where none existed previously, orfinds a better alignment than the existing one, then the previous alignment isreplaced.
} ClusterFinder—This takes the output of AlignCandidates (a list of orphan andbadly aligning reads) and tries to group them in clusters of reads that are thought tohave been caused by the same indel, based on genomic location.ClusterFinder separately clusters each type of anomalous read. The resultingclusters are labeled in the output file as:• Shadow/SemiAligned (orphan/semi aligned)• DeletionPair (insert size anomalously large)• InsertionPair (insert size anomalously small)
} ClusterMerger—This stage combines clusters of different types above that appear tocorrespond to the same event. One anticipated case is that of twoShadow/SemiAligned clusters and a DeletionPair cluster corresponding to the same(medium or larger scale) deletion. The currently supported merging mechanism isthe combination of clusters of different types that share reads. This is possible as aread may be detected as being both SemiAligned as one partner in an anomalouslymapped read pair. Apart from its role in merging related clusters, this step alsoensures that reads are not multiply represented in the subsequent assembleIndelsstages and downstream analysis.
} SmallAssembler—SmallAssembler takes the output of ClusterMerger andassembles clusters of reads into contigs. It uses an approach based on kmer-hashingand a de-Bruijn graph. If a read is successfully assembled into a contig, the read'salignment details are updated to describe its position in the contig.
} AlignContig—AlignContig does a dynamic programming alignment of contig togenome.
Variant Caller MethodsThe callSmallVariants module calls SNPs and small indels from both the sortedalignment files (sorted.bam) and optionally also from the candidate indel contigsproduced by assembleIndels. The procedure is outlined below.

Variant
Detectio
n
CASAVA v1.8.2 User Guide 147
} Read in read alignments and candidate indel contigs. Filter out read alignmentsbased on quality checks, paired-end anomalies, or ELAND alignment score. Filterout contig alignments containing adjacent insertion/deletion events.
} Consolidate indel evidence from read and contig alignments to produce a set ofcandidate indels.
} Perform local read realignment using candidate indels.} Call indels based on the set of alignments for each read which intersect/include acandidate indel.
} Select most likely read realignment for subsequent site counting and genotyping.} Further filter individual basecalls based on mismatch density or ambiguity ('N').} Use all remaining base calls to predict site genotypes and SNPs.} Filter to remove SNP and indel calls near the centromeres and within high-copynumber regions.
Read FilteringThe variant caller performs an initial read filtering to remove reads from both SNP andindel calling based on the following criteria:} Any reads marked as failing primary analysis quality checks (e.g failing the purityfilter) or marked as PCR or optical duplicates are removed from consideration.
} For paired-end reads, any reads which are not marked as being part of a ‘properpair’ are removed from consideration. This is intended to remove any reads fromchimeric pairs, with unmapped mates or with an anomalous pair insert size.
} Reads are filtered on ELAND alignment score. For paired-end reads the variant-caller removes by default any read with a paired-end alignment score less than 90,and for single-end reads, those with a single-end alignment score less than 10 areremoved.
Detecting Indels and RealigningThe variant caller proceeds with candidate indel discovery and generation of alternateread alignments based on these candidate indels.As part of this re-alignment process the variant caller selects a representative alignmentto be used for site genotype calling and depth summarization by the SNP caller. Thisalignment is selected to be within a certain threshold of the most-likely of all alignmentsfor a read, and any leading or trailing portions of the read with ambiguous support for2 or more different alignments are marked as clipped. This representative alignmentdoes not affect the indel caller – the indel calling process considers all alignments foreach read without end-clipping. For diagnostic purposes, the set of reads which havetheir alignments altered during re-alignment may be written out to a separate BAM filefor each chromosome using the --variantsWriteRealigned flag.
Indel CallerThe indel caller finds indels using a two stage process: In the first stage an indel mustbe identified as a candidate indel. In the second stage, after indel candidates have beenidentified, all intersecting reads are aligned to each indel, to the reference and to anyalternate indels at the same site. The relative probabilities of these alignments for eachread are used to call the indel's genotype and calculate the associated quality score.

AlgorithmDescriptions
148 Part # 15011196 RevC
Candidate Indel search
For the first stage of indel calling, candidate indels are identified from two sources ofevidence:} The first of these are from small indels already present in the input reads in theform of gapped alignments.
} The second source are alignments of locally assembled contigs to the referenceprovided by the assembleIndels module.
Every indel present in a conventional read alignment or assembleIndels contig is storedin a pool of potential indels.Support for each one of these potential indels is measured as the number of readalignments which contain the indel. These alignments may be from the primaryalignment or from reads used by Grouper to assemble each contig. If the number ofreads supporting a potential indel is less than 3 or less than 2% of the total depth at theindel site, the indel cannot become a candidate. Additionally for short indels (of length4 or less), if the number of supporting read is less than 10% of the total depth the indelcannot become a candidate. These cases are retained as ‘private’ indels in the readsalignments which support them. All other potential indels become candidate indels,subject to realignment and indel calling.Note that as a consequence of the candidate indel discovery process, indels can becalled using either gapped alignments or Grouper contig alignments as input, and theevidence from these two sources will be combined if both are available. Typicallygapped alignments can be used to efficiently identify relatively small indels (roughly 1-10 bases in length), whereas local contig assembly can efficiently identify much largerindels. The greatest indel sensitivity can be achieved by generating candidate indelsfrom both of these sources.The parameters described for candidate indel filtration above are configurable asdescribed in the CASAVA User Guide. Accepting too many candidate indels increasesruntime and can lead to occasional spurious indel calls or poorly realigned reads innoisy regions of the genome.
Realignment and Indel Calling
For the second stage of indel calling, the variant caller realigns all intersecting reads toeach candidate indel, in addition to aligning the read to the reference and any alternateindel candidates at the same site. It is common for reads which intersect the indellocation to support the indel and reference alignments equally well, so the model isdesigned in such a way that these reads do not affect the genotype call.The relative likelihoods of all alignments for each read are used to assign probabilitiesto each of three possible indel genotypes: homozygous, heterozygous or not present. Theresult of this calculation is reported as two quality scores.} The first of these scores, Q(indel), expresses the probability that the indel is presentin the sample as either a heterozygous or homozygous variant.
} The second score, Q(max_gt), expresses the probability that the most probable indelgenotype, reported as the value max_gt, is correct.
To accommodate diverse applications, the CASAVA variant caller does not filter outlow-confidence calls and thus prints out all indels with a Q(indel) value of 1 or greater.Summary statistics for indels are generated for a subset of higher confidence indels -- bydefault any indel with Q(indel) of 20 or greater is summarized in CASAVA’s reports.Note that for calls with a very low Q(indel) score, it is possible that the most likely

Variant
Detectio
n
CASAVA v1.8.2 User Guide 149
genotype will be ‘ref’, indicating that the indel is not present. This should be interpretedto mean that there is a non-trivial probability of the indel existing as a heterozygousvariant at this site, but that the indel is more likely to be absent from the sample thanpresent.The predicted Q-scores reflect only those error conditions which are represented in thegenotype calling model, which is not comprehensive. The model accounts forbasecalling error, diploid chromosome sampling, a spurious indel rate and anapproximation of read mapping error. However note that artifactual indel signaturescould still arise due to complex overlapping variants, atypical sample preparation,large-scale structural variants or other phenomena not accounted for by the model. TheQ-score provided by the model should be interpreted with respect to these limitations.
HomopolymersThe indel calling model accounts for the probability of a spurious indel error as afunction of homopolymer length and indel type. This spurious indel correction causessimple expansions and contractions of homopolymers to be predicted as less likely ashomopolymer length increases. The spurious indel error probabilities are calculatedfrom empirical observations. There is an option available in the small variant caller toreplace these values with a single constant indel error probability to be used for allhomopolymer lengths and indel types.
Overlapping IndelsNote that the model handles overlapping indels in an approximate fashion, byevaluating the probability of each indel allele compared to either the reference or anyother indel allele at the same site. Thus it does not explicitly enumerate all possiblepairs of alignment paths at the site to calculate the joint probability of the path for bothhaplotypes of a diploid sample—instead the method considers the current indel allelecompared to all other possible alignment paths at the site.This approximation effectively handles most simple overlapping indels, but will tend toundercall indels in regions with very high indel error rates. A consequence of thismodel is that where overlapping indels occur, the model does not strictly report agenotype, but rather the max_gt call reflects the copy number for each of the two indelalleles, and the probability of that copy number. Each indel allele of the twooverlapping indels are reported on separate lines by the model. Due to the approximatenature of this model and the independent evaluation of each overlapping indel allele, itis possible that the most likely copy number for each allele could conflict (e.g. max_gtwill not be het for both indel alleles), in the rare cases where this occurs the associatedQ(max_gt) scores are typically very low.
Calling SNPsOnce the indels are called, and the reads are re-aligned to take into account thediscovered indels, site genotyping and SNP-calling is conducted using the followingsteps:
6 Given the set of filtered and realigned reads, the variant caller next runs certaintypes of filtration on base calls within these reads:• First, any contiguous trailing sequence of ‘N’ base calls are effectively treated astrimmed off of the ends of reads for the purpose of genotyping and depthcalculation.

AlgorithmDescriptions
150 Part # 15011196 RevC
• Next the mismatch density filter is run on all reads to mask out sections of theread having an unexpectedly high number of disagreements with the reference.The current default mismatch density filter behavior is as follows:— Base calls are ignored where more than 2 mismatches to the reference
sequence occur within 20 bases of the call. Note that this filter treats eachinsertion or deletion as a single mismatch.
— If the call occurs within the first or last 20 bases of a read then themismatch limit is applied to the 41 base window at the corresponding endof the read.
— The mismatch limit is applied to the entire read when the read length is 41or shorter.
All bases marked by the mismatch density filter, together with any ‘N’ base callswhich remain after the end-trimming step, are filtered out by the variant caller.These filtered base calls are not used for site-genotyping but appear in the filteredbase call counts in the variant caller’s output for each site.
7 All remaining base calls are used for site-genotyping. The genotyping methodheuristically adjusts the joint error probability calculated from multiple observationsof the same allele on each strand of the genome to account for the possibility oferror dependencies between these observations. The method accomplishes this bytreating the highest quality base call of each allele from each strand as independentobservations, leaving their associated base call quality scores unmodified. However,subsequent base calls for each allele and strand have their qualities adjusted toincrease the joint error probability of that allele above the error expected fromindependent base call observations.After running the site-genotyper on all positions, a set of unfiltered SNP sites isproduced, consisting of all sites with Q(snp) > 0.
8 A final filtration step is taken to remove potentially spurious SNP calls near thecentromeres and within high-copy number regions. This is done by calculating themean used depth for each chromosome, and filtering out all SNP calls which occurat a used depth which is greater than 3 times this chromosomal mean.
Variant Detection Q-Scores
Quality ScoresA quality score (or Q-score) expresses an error probability. In particular, it serves as aconvenient and compact way to communicate very small error probabilities.Given an assertion, A, the probability that A is not true, P(~A), is expressed by a qualityscore, Q(A), according to the relationship:
Q(A) =-10 log10(P(~A))
where P(~A) is the estimated probability of an assertion A being wrong.The relationship between the quality score and error probability is demonstrated withthe following table:
Quality score,Q(A)
Error probability,P(~A)
10 0.120 0.0130 0.001

Variant
Detectio
n
CASAVA v1.8.2 User Guide 151
Variant GenotypesIn the context of resequencing a diploid individual, a genotype for a single site or indelindicates the two alleles that are present.The set of diploid site genotypes considered by the CASAVA v1.8 model for SNPs are{AA,CC,GG,TT,AC,AG,AT,CG,CT,GT}. For example, given a site in the genome with areference base of C, the homozygous reference genotype is CC. A prediction of a SNP atthat site is an assertion that the predicted genotype is not CC.The CASAVA1.8 model for indels comprises three possible indel genotypes:homozygous, heterozygous, or not present.
NOTEIt is possible to have high confidence that the genotype is not the referencewithout having high confidence in exactly what the genotype is at the site. Inthis situation there is strong evidence of a SNP but the exact genotype at thesite is less certain.
Q(snp)The SNP caller’s site-genotyping methods take a set of base calls and associatedqualities for each site, and produce a probability distribution over the 10 diploidgenotype states {AA,CC,GG,TT,AC,AG,AT,CG,CT,GT}. Given this probabilitydistribution, the value Q(snp) is a Q-score expressing the probability that the sitegenotype is not that of the homozygous reference.
NOTEThe diploid genotypes are printed out as two letter codes representing twounphased (single-base) alleles. For each heterozygous genotype the twoalleles are provided in alphabetical order (e.g. CT will be used and not TC).
For example, if the reference base is C, and the probability of the reference genotype CCis 0.001, the value for Q(snp) is 30, reflecting a relatively high confidence that at leastone non-reference allele exists at this site.
Prior Probabilities and Quality ScoresAn important component of the SNP-calling model is the prior probability distributionover diploid genotypes. The prior distribution expresses the information available aboutthe genotype distribution at the site before sequencing.The CASAVA 1.8 SNP-caller expresses this notion of prior expectation based on areference sequence using its 'genomic' prior distribution, which is used to calculateQ(snp) and Q(max_gt). A specialized 'polymorphic' prior distribution is also used tocompute Q(max_gt|poly_site), which is applicable to sites where there is a greater priorexpectation of polymorphism, such as a set of sites from dbSNP.
Genomic PriorWhen resequencing an individual from a given population, there is a strong priorexpectation that a randomly selected site in the sample assembly will be homozygousfor an allele at the same locus in a reference chromosome from the same population.This expectation of similarity to a reference sequence in most portions of the genome isreferred to below as the ‘genomic’ prior for the model. For example, suppose that onaverage 1 in 1000 sites in a sample chromosome are expected to differ from a referencechromosome. If the reference at a particular site is A, then the Q-score for the referencegenotype AA will be approximately 30 in the absence of any sample observations.Because of this prior, the most likely genotype would still be AA even after observing a

AlgorithmDescriptions
152 Part # 15011196 RevC
single non-reference basecall of modest quality. Thus, the genomic prior has the effect ofincreasing the evidence required for a site to be called a SNP, and acts to reduce the rateof any false positive SNP predictions made by the model. For this reason the genomicprior is used to calculate the genotype probability distribution used for Q(snp) andQ(max_gt).
Polymorphic PriorWhen considering a subset of sites from a genome that are known to be polymorphic ina population, there is a much different prior expectation of the genotype distributionthan in the scenario described in the previous section for all sites in the genome. Aprinciple difference in this scenario is that the expectation that each site will behomozygous for the reference allele is much lower. These sites also need to be examinedto distinguish strong evidence for the homozygous reference genotype from a site whereno observations have been made. The polymorphic prior is used to compute thepolymorphic-site genotype quality score: Q(max_gt|poly_site), the probabilbity that thetrue genotype is not the highest scoring, if this site is known to be polymorphic.
New Variant Calling Parameter: ThetaThe parameter theta as used in the variant calling model refers to the expectedproportion of differing sites between two chromosomes sampled from the population.For site-genotyping, it is set by default to 1/1000, a value appropriate for human re-sequencing. Raising this value, to e.g. 1/100, would have the effect of increasing theprior expectation of a non-reference genotype and increase Q(snp) values.The parameter theta for indels is set to a default value of 1/10,000.
Q(Indel)Once the candidate indels are identified, the variant caller realigns all intersecting readsto each candidate indel, in addition to aligning the read to the reference and anyalternate indel candidates at the same site. The relative likelihoods of all alignments foreach read are used to assign probabilities to each of three possible indel genotypes:homozygous, heterozygous or not present.The associated quality score Q(indel) expresses the probability that the non-referenceindel allele referred to in the indel call exists in the sample as either a heterozygous orhomozygous variant, analogous to Q(snp).
SNP Caller ReportingThe SNP caller reports the following files:} snps.txt. SNPs for each chromosome are summarized within each chromosomedirectory in a file called snps.txt. This file contains SNPs which have been called byCASAVA’s callSmallVariants module.
} sites.txt.gz. As part of the SNP calling process, the variant caller also outputsinformation on coverage and consensus genotype for every mapped site in thegenome. These results are found in each chromosome bin directory in a gzipcompressed file called sites.txt.gz.
} snps.removed.txt. As a final noise filtration step, the SNP calls in the snps.txt fileshave been filtered to remove SNP calls in regions close to centromeres and otherhigh copy number regions. The SNP calls filtered out by this procedure can befound in the file snps.removed.txt in each chromosomal bin directory.

Variant
Detectio
n
CASAVA v1.8.2 User Guide 153
The SNP-caller implemented in this module employs a probabilistic model whichultimately produces probability distributions over all diploid genotypes for each site inthe genome. The primary values summarized from these distributions are a set ofquality scores.} Q(snp). The value of Q(snp) expresses the probability that the genotype at this siteis not the homozygous reference state.
} Q(max_gt). The value of Q(max_gt) expresses the probability of the most-likelygenotype state at this site, reported as the value "max_gt". Note that the valueQ(max_gt) corresponds to a value referred to as "consensus quality" in SNP-callingmethods such as samtools pileup.
} Q(max_gt|poly_site).One additional score is provided by the SNP-caller which canbe used to look at sites for which there is a strong expectation that the site ispolymorphic. This value is Q(max_gt|poly_site), which expresses the probability ofthe most-likely genotype state at the site, assuming the site is polymorphic. Thisstate is separately reported as the value "max_gt|poly_site". This genotype valueand quality score provides greater sensitivity when looking at, for example, aparticular set of polymorphic sites from dbSNP. This value should not be used toevaluate the genotype for every position in the genome as this would result in ahigh number of false positive SNP predictions.
To accommodate diverse applications, the CASAVA variant caller does not filter outlow-confidence calls and thus prints all sites where Q(snp) is greater than zero to thesnps.txt file. Summary statistics for SNPs are generated for a subset of higher confidenceSNPs -- by default any SNP with Q(snp) of 20 or greater is summarized in CASAVA’sreports. Note that for calls with a very low Q(snp) score, it is possible that the mostlikely genotype will be that of the homozygous reference, e.g. max_gt will be ‘CC’ for aposition with a reference value of ‘C’. This can be interpreted to mean that there is anon-trivial probability of a heterozygous SNP existing at this site, but that thehomozygous reference genotype is still more likely than that of any non-referencevariant.
Indel Caller ReportingIndels for each chromosome are summarized within each chromosome directory in afile called indels.txt. This file contains indels which have been called in eachchromosomal bin segment using the small variant caller from CASAVA’scallSmallVariants module.These indel calls have been filtered to remove those calls which are found at a depthgreater than a certain multiple of the mean chromosomal depth. By default this multipleis set to 3. The purpose of this filtration is to remove indels calls in regions close tocentromeres and other high copy number regions.Three categories of indels are reported:} Insertions} Deletions} Breakpoints. Breakpoint calls correspond to one of the two "ends" of a large indel orstructural variant, for which the complete variant is either unknown or cannot berepresented by the small variant caller. Breakpoint events are reported as either leftor right breakpoints.A left breakpoint corresponds to a haplotype which can be mapped on the left sideof the breakpoint location but not on the right. A right breakpoint indicates that ahaplotype can be mapped to the right of the breakpoint location but not to the left. If

AlgorithmDescriptions
154 Part # 15011196 RevC
a simple insertion or deletion were represented as two breakpoint calls, then theywould occur on the forward strand as a left breakpoint followed by a rightbreakpoint.The figure below illustrates how two breakpoint calls could potentially be calledcorresponding to a large insertion in the sample relative to a population reference.
Figure 26 Left and Right Breakpoints
Advanced Options for Variant DetectionThis section lists advanced options for variant detection, which will help you fine-tunethe variant calling.
Global Analysis OptionsThe options described below are global options used to specify analysis across differenttargets.
Option Application Description--QVCutoff=NUMBER PE Sets the paired-end alignment score threshold to NUMBER
(default 90).Example: --QVCutoff=60
--QVCutoffSingle=NUMBER SE, PE Sets the single-read alignment score threshold to NUMBER(default 10).Example: --QVCutoffSingle=60
--read=NUMBER PE Limit input to the specified read only. Forces single-endedanalysis on one read of a double-ended data set.Example: --read=1
--singleScoreForPE=VALUE PE Sets the variant caller to filter reads with single score belowQVCutoffSingle in PE mode YES|NO. Default NO.Example: --singleScoreForPE=YES
Table 22 Global Analysis Options for Variant Detection and Counting

Variant
Detectio
n
CASAVA v1.8.2 User Guide 155
Option Application Description--sortKeepAllReads SE, PE Generate an archive BAM file. Keep all purity filtered, duplicate
and unmapped reads in the build. These reads will be ignoredduring variant calling.Example: --sortKeepAllReads
--toNMScore=NUMBER SE, PE Minimum SE alignment score to put a read to NM. Default=-1 (-1 means option is turned off)
--ignoreUnanchored PE Ignore unanchored read pairs in indel assembly and variantcalling. Unanchored read pairs have a single-read alignmentscore of 0 for both reads.Example: --ignoreUnanchored
Options for Target assembleIndelsThe options described below are used to specify analysis for target assembleIndels.
Option Application Description--indelsSpReadThresholdIndels=
NUMBER
PE Spanning read score threshold. The higher thesingle read alignment score before realignment,the more unlikely it is to see this pattern ofmismatches given the read's quality values. Defaultthreshold value is 25. Drop this value to add morereads into the indel finding process, at the possibleexpense of introducing noise. For an alignmentwith no mismatches this option should be set atzero.
--indelsPrasThreshold=NUMBER PE Paired read alignment score threshold. If a readhas a paired read alignment score of at least this,then it is used to update the base quality stats forthat sample prep. Default is calculated based off thedata.
--indelsAlignScoreThresh= NUMBER PE If an alignment score for a read exceeds thisthreshold after realignment then the output file isupdated to incorporate this new alignment.Otherwise the read's entry remains as per the inputfile. Default value is 120. A low value will causesome reads to be wrongly placed (albeit within asmall interval).
--indelsSdFlankWeight=NUMBER PE Number of standard deviations to use whendefining the genomic interval to align the read to(default: 1).
--indelsMinGroupSize=NUMBER PE Only output clusters if they contain at least thismany reads.
--indelsSpReadThresholdClusters=
NUMBER
PE Spanning read score threshold. This is calculated inexactly the same way as --
indelsSpReadThresholdIndels. However it isused in the opposite way. Here the point to findreads with few or no mismatches, which arepresumed to arise from repeats and not fromindels, and exclude them from the clusteringprocess.
--indelsMinCoverage=NUMBER PE Minimum coverage to extend contig (default 3).
Table 23 Options for assembleIndels

AlgorithmDescriptions
156 Part # 15011196 RevC
Option Application Description--indelsMinContext=NUMBER PE Demand at least x exact matching bases either side
of variant (default is 6). The idea here is to ensurethat an indel has a minimum number of exactlymatching bases on either side. Setting this to zeromight be good for finding reads which align tobreakpoints.
--indelsSaveTempFiles PE Add this flag to save intermediate output files fromeach stage of the indel assembly process.
Options for Target callSmallVariantsThe options described below are used to specify analysis for targetcallSmallVariants.
Option Application Description--variantsSkipContigs PE By default information from the assembleIndels
module is used (and required) in paired-end DNASequencing analysis. This option disables use of indelcontigs during variant calling, and only uses gappedalignment to find indels.Example: --variantsSkipContigs
--variantsNoSitesFiles SE, PE Do not write out the sites.txt.gz files.Example: --variantsNoSitesFiles
--variantsNoReadTrim SE, PE By default, the ends of reads can be trimmed if thealignment path through an indel is ambiguous. Thisoption disables read trimming and chooses theungapped sequence alignment for any ambiguousread segment. Note that this can trigger spurious SNPcalls near indels.Example: --variantsNoReadTrim
--variantsWriteRealigned SE, PE Write only those reads which have been realigned tobam file: "sorted.realigned.bam" for each referencesequence.Example: --variantsWriteRealigned
Table 24 Workflow Options for callSmallVariants
Option Application Description--variantsIncludeAnomalous PE Include paired-end reads which have anomalous
insert-size or orientation. Note that "--variantsSEMapScoreRescue" must also be specifiedbecause ELAND gives anomalous reads a PEmapping score of zero.
--variantsIncludeSingleton PE Include paired-end reads which have unmapped matereads. Note that "--variantsSEMapScoreRescue" mustalso be specified because ELAND gives singletonreads a PE mapping score of zero.
--variantsSEMapScoreRescue PE Include reads if they have an SE mapping score equalto or above that set by the "--QVCutoffSingle" option,even if the read pair fails the PE mapping scorethreshold.
Table 25 ReadMapping Options for callSmallVariants

Variant
Detectio
n
CASAVA v1.8.2 User Guide 157
Option Application Description--variantsNoCovCutoff SE, PE Disables the SNP and indel coverage filters detailed
below for the options: --variantsSnpCovCutoffand --variantsIndelCovCutoff. This setting isrecommended for targeted resequencing and RNA-Seq (Note it is already set by default for RNA-Seq).Example: --variantsNoCovCutoff
Table 26 SNP and Indel Options for callSmallVariants
Option Application Description--variantsSnpTheta=FLOAT SE, PE The frequency with which single base differences are
expected between two unrelated haplotypes (defaultis 0.001).Example: --variantsSnpTheta=0.002
--variantsSnpCovCutoffAll SE, PE By default the mean chromosomal depth filter isbased on "used-depth" (the number of basecalls usedby the snp-caller after filtration) calculated from allknown sites (non-N) in the reference sequence. Whenthis option is set, the threshold and the filtration usethe full depth at all known sites in the referencesequence.Example: --variantsSnpCovCutoffAll
--variantsSnpCovCutoff=FLOAT SE, PE SNPs are filtered out of the final output if the depth ofreads used for that site is greater than this value timesthe mean chromosomal used-depth. (default 3.0)The filter may be disabled for targeted resequencingor other applications by setting this value to -1 (orany negative number).Example: --variantsSnpCovCutoff=4
--variantsMDFilterCount=INTEGER SE, PE The mismatch density filter removes all basecallsfrom consideration during SNP calling where greaterthan 'variantsMDFilterCount' mismatches to thereference occur on a read within a window of1+2*'variantsMDFilterFlank' positions encompassingthe current position. The default value for'variantsMDFilterCount' is 2 and for'variantsMDFilterFlank is 20. Set either value to lessthan 0 to disable the filter.Example: --variantsMDFilterCount=3
--variantsMDFilterFlank=INTEGER SE, PE The mismatch density filter removes all basecallsfrom consideration during SNP calling where greaterthan 'variantsMDFilterCount' mismatches to thereference occur on a read within a window of1+2*'variantsMDFilterFlank' positions encompassingthe current position. The default value for'variantsMDFilterCount' is 2 and for'variantsMDFilterFlank is 20. Set either value to lessthan 0 to disable the filter.Example: --variantsMDFilterFlank=25
--variantsIndependentErrorModel SE, PE This switch turns off all error dependency terms inthe SNP calling model, resulting in a simpler modelwhere each basecall at a site is treated as anindependent observation.Example: --variantsIndependentErrorModel
Table 27 SNP Options for callSmallVariants

AlgorithmDescriptions
158 Part # 15011196 RevC
Option Application Description--variantsMinQbasecall=INTEGER SE, PE The minimum basecall quality used for SNP calling.
(default is 0).Example: --variantsMinQbasecall=10
--variantsSummaryMinQsnp=INTEGER SE, PE The snps.txt files contain all positions where Q(snp) >0, however it is expected that only a higher Q(snp)subset of these will be used dependent upon the falsepositive tolerance of a user's workflow. For thisreason summary statistics about the called SNPs arecreated at a higher "average-application" threshold,which can be set using this option (default is 20).Example: --variantsSummaryMinQsnp=25
Option Application Description--variantsIndelTheta=FLOAT SE, PE The frequency with which indels are expected
between two unrelated haplotypes (default is 0.0001).See New Variant Calling Parameter: Theta on page 152for more explanation.Example: --variantsIndelTheta=0.0002
--variantsIndelCovCutoff=FLOAT SE, PE Indels are filtered out of the final output if the localsequence depth is greater than this value times themean chromosomal depth. The sequence depth of theindel is approximated by the depth of the site 5' of theindel. (default 3.0)The filter may be disabled for targeted resequencingor other applications by setting this value to -1 (orany negative number).Example: --variantsIndelCovCutoff=4
--variantsCanIndelMin=INTEGER SE, PE Unless an indel is observed in at least this manygapped or assembleIndels reads, the indel cannotbecome a candidate for realignment and genotypecalling. (default: 3)Example: --variantsCanIndelMin=4
--variantsCanIndelMinFrac=
FLOAT
SE, PE Unless an indel is observed in at least this fraction ofintersecting reads, the indel cannot become acandidate for realignment and genotype calling.(default: 0.02)Example: --variantsCanIndelMinFrac=0.01
--variantsSmallCanIndelMinFrac=
FLOAT
SE, PE In addition to the above filter for all indels, for indelsof size 4 or less, unless the indel is observed in at leastthis fraction of intersecting reads, the indel cannotbecome a candidate for realignment and genotypecalling. (default: 0.1)Example: --
variantsSmallCanIndelMinFrac=0.2
--variantsIndelErrorRate=FLOAT SE, PE Set the indel error rate used in the indel genotypecaller to a constant value of f (0<=f<=1). The defaultindel error rate is taken from an empirical functionaccounting for homopolymer length and indel type(i.e. insertion or deletion). This flag overrides thedefault behavior with a constant error rate for allindels.Example: --variantsIndelErrorRate=0.5
Table 28 Indel Options for callSmallVariants

Variant
Detectio
n
CASAVA v1.8.2 User Guide 159
Option Application Description--variantsSummaryMinQindel=
INTEGER
SE, PE The indels.txt files contain all positions where Q(indel)> 0, however it is expected that only a higher Q(indel)subset of these will be used dependent upon the falsepositive tolerance of a user's workflow. For thisreason summary statistics about the called snps arecreated at a higher "averege-application" threshold,which can be set using this option (default is 20).Example: --variantsSummaryMinQindel=25
--variantsMaxIndelSize= INTEGER SE, PE Sets the maximum indel size for realignment andindel genotype calling. Whenever an indel larger thanthis size is nominated by a de-novo assembly contig itis handled as two independent breakpoints. Note thatincreasing this value should lead to an approximatelylinear increase in variant caller memory consumption.The default value is 300 for paired-end builds and 50for single-end builds.Example: --variantsMaxIndelSize=200

AlgorithmDescriptions
160 Part # 15011196 RevC
readBasesCountingMethod
This method is for exon and gene counts. Before counting CASAVA converts thealignments to splice junction into two shorter genomic alignments. Then CASAVA willcount the number of bases (not the number of reads), that belong to exons, and genes.Bases within both original genomic and shorter genomic reads derived from splicedalignments participate in the exon and gene counts.
NOTEJunction counts (in reads, not bases) are provided for convenience. Becausealignments to the junctions are converted to the genomic reads before thecounting, bases within reads aligned to splice junction are counted only oncefor exon and gene counts.
For splice junctions, counts are provided as the number of reads that cover the junctionpoint. The number of bases that fall into the exonic regions of each gene is summed toobtain gene level counts. The normalized values are calculated as RPKM (Reads PerKiloBase per Million of mapped reads). Since the base counts rather than read countsare used, the RPKM for exons and genes is calculated slightly differently than RPKMfor splice junctions.The normalized values for genes and exons are counted as follows:
Exons/genes RPKM = 109 x Cb / NbLWith:RPKM = Reads Per Kilobase of exon model per Million mapped readsCb= the number of bases that fall on the featureNb= total number of mapped bases in the experimentL= the length of the feature in base pairs
The normalized values for splice junctions are counted as follows:Splice junctions RPKM = 109 x Cr / NrLWith:Cr= the number of reads that cover the junction pointNr= total number of mapped reads in the experimentL= the length of the feature in base pairs.
Only the reads with alignment score >= QVCutoffSingle are considered.Exons that have overlapping exons from other genes on the forward or reverse strandare excluded from counting and are also not included to compute the total gene length.
ReferenceMortazavi A, Williams BA, McCue K, Schaeffer L, Wold (2008) Mapping and quantifyingmammalian transcriptomes by RNA-Seq. Nature Methods. 5:585-7.

AppendixE
CASAVA v1.8.2 User Guide 161
Appendix E Qseq Conversion
QseqConversion
Introduction 162Qseq Converter Input Files 163Running Qseq Converter 165Qseq Converter Parameters 166Qseq Converter Output Data 167

QseqConversion
162 Part # 15011196 RevC
Introduction
As of CASAVA 1.8, configureAlignment uses FASTQ files as input. If you have *_qseq.txt files that you want to analyze using CASAVA 1.8, use the Qseq Converter thatconverts *_qseq.txt files into FASTQ files.The script has the following features:} Creates a makefile to convert a directory of *_qseq.txt files to a directory tree ofcompressed FASTQ files following CASAVA 1.8 filename and directory structureconventions.
} If detected, configuration data used by configureAlignment are also transferred tothe output directory.
} This script will not configure demultiplexing. The input directory must contain *_qseq.txt files which are either non-demultiplexed or already demultiplexed byanother utility.
This appendix provides instructions to run the Qseq Converter.

Qseq
Converter
Input
Files
CASAVA v1.8.2 User Guide 163
QseqConverter Input Files
The Qseq Converter needs the following input files:} A BaseCalls directory with *_qseq.txt files. The Qseq Converter is specificallydesigned to convert *_qseq.txt files produced by OLB. It expects the *_qseq.txt files tofollow the OLB naming conventions:s_<lane>_<read>_<tile>_qseq.txt
With:<lane>: the lane number on the flow cell (1-8)<read>: the read number (1 or 2)<tile>: the tile number, left padded with '0', to 4 digitsFor example: s_1_1_0001_qseq.txt.
These files have the following format:
Field DescriptionMachinename
Identifier of the sequencer.
Runnumber
Number to identify the run on the sequencer.
Lanenumber
Positive integer (currently 1-8).
Tilenumber
Positive integer.
X X coordinate of the spot. Integer.As of RTA 1.6, OLB 1.6, and CASAVA 1.6, the X and Y coordinates for eachclusters are calculated in a way that makes sure the combination will be unique.The new coordinates are the old coordinates times 10, +1000, and then rounded.
Y Y coordinate of the spot. Integer.As of RTA 1.6, OLB 1.6, and CASAVA 1.6, the X and Y coordinates for eachclusters are calculated in a way that makes sure the combination will be unique.The new coordinates are the old coordinates times 10, +1000, and then rounded.
Index Index sequence or 0. For no indexing, or for a file that has not beendemultiplexed yet, this field should have a value of 0.
ReadNumber
1 for single reads; 1 or 2 for paired ends or multiplexed single reads; 1, 2, or 3 formultiplexed paired ends.
Sequence Called sequence of read.Quality The calibrated quality string.Filter: Did the read pass filtering? 0 - No, 1 - Yes.
The Qseq Converter also looks for files that configureAlignment needs, and transfersthem to its output directory. These files are:} Config.xml file in the Basecalls folder.} BustardSummary.xml.
Requirements to Run configureAlignmentTo run CASAVA 1.8 configureAlignment on FASTQ files generated by the QseqConverter, the following is required:} The input *_qseq.txt files must be non-multiplexed or already demultiplexed intoseparate directories. If the converter finds reads 1, 2, and 3 from a multiplexed run,it will convert all three to FASTQ, but configureAlignment cannot run on these files.

QseqConversion
164 Part # 15011196 RevC
} A BustardSummary.xml file must be found in the Qseq Basecalls folder, or the --summary-file argument to the Qseq Converter must point to an equivalent file.
} The BustardSummary.xml file must be copied to the FASTQ root folder andrenamed DemultiplexedBustardSummary.xml. If the script can find theBustardSummary.xml, this will be done automatically.
} A config.xml file must be found in the Qseq Basecalls folder, or the --config-file argument to the Qseq Converter must point to an equivalent file. Theconfig.xml file must be copied to the FASTQ root folder and renamedDemultiplexedBustardConfig.xml.
NOTEconfigureAlignment requires SampleSheet.csv and SampleSheet.xml files butdefault versions of both files are created by the Qseq Converter

Running
Qseq
Converter
CASAVA v1.8.2 User Guide 165
RunningQseqConverter
To convert *_qseq.txt files, you need to run the configureQseqToFastq.pl script.This sets up the run by generating a makefile and metadata. Running make or qmakethen converts the *_qseq.txt files into FASTQ files.
9 Enter the following command to create a makefile for sequence alignment with thedesired compression option./path-to-CASAVA/bin/configureQseqToFastq.pl --input-dir DIR
[options]
10 Move into the newly created output folder. Type the “make” command for basicanalysis:make
NOTEYou may prefer to use the parallelization option as follows:make -j 3 all
The extent of the parallelization depends on the setup of your computer orcomputing cluster.

QseqConversion
166 Part # 15011196 RevC
QseqConverterParameters
The Qseq Converter parameters that can be entered are listed below.
Parameter Description--input-dir
DIRECTORY
Path to *_qseq.txt directoryNo default.
--output-dir
DIRECTORY
Path to root of CASAVA 1.8 unaligned directory structure.Directory will be created if it does not exist.Default: <input-dir>/QseqToFastq/Unaligned
--fastq-cluster-
count INTEGER
Maximum number of fastq records per fastq file.Default: 4 000 .
--config-file
FILENAME
Specify the Bustard config file to be copied to the fastq directory.Default: <input-dir>/config.xml
--summary-file
FILENAME
Specify the Bustard summary file to be copied to the fastqdirectory.Default: <input-dir>/BustardSummary.xml
--flowcell-id
STRING
Use the specified string as the flow cell id.Default value is parsed from the config-file.

Qseq
Converter
Outp
utData
CASAVA v1.8.2 User Guide 167
QseqConverterOutputData
The Qseq Converter generates the following output:} gzipped FASTQ files in the directory structure configureAlignment expects(configureAlignment Input Files on page 50).
} If found, Qseq Converter copies the basecalling config.xml to the root of the FASTQdirectory structure and renames it DemultiplexedBustardConfig.xml, which is thefile expected by configureAlignment.
} If found, Qseq Converter copies the BustardSummary.xml to the root of the FASTQdirectory structure and renames it DemultiplexedBustardSummary.xml, which isthe file expected by configureAlignment.
} Qseq Converter also creates a default sample-sheet in the destination directory.} IVC.htm and corresponding plots are in the same directory where the qseq files are.
NOTEconfigureAlignment in CASAVA 1.8 will fail if you try to run it and theDemultiplexedBustardConfig.xml or theDemultiplexedBustardSummary.xml files are not there.

168 Part # 15011196 RevC

AppendixF
CASAVA v1.8.2 User Guide 169
Appendix F Export to SAM Conversion
Export toSAMConversion
Introduction 170SAM Format 171Usage 175

Exportto
SAMConversion
170 Part # 15011196 RevC
Introduction
CASAVA 1.8 provides two SAM/BAM conversion pathways:} Running the post-alignment 'sort' and 'bam' modules; see Targets on page 98Running the post-alignment sort and bam modules together offers sorting, PCRduplicate removal, indexing, and automatic chromosome renaming options, and bydefault it will write out a reference sequence file with chromosome labels that havebeen synchronized to the labels used in the BAM file. If the sort module is run in"archival" mode, the BAM file created will contain all of the reads provided inexport.txt.gz files given as input.
} The illumina_export2sam.pl script.The illumina_export2sam.pl script provides basic conversion from export to SAMformat without sorting, duplicate removal, conversion to BAM format or indexing.This script is intended to be used as one component in a custom post-alignmentpipeline. Users desiring a 'turn-key' BAM creation method (e.g. to rapidly viewreads in IGV) are encouraged to use the post-alignment sort and bam modulesinstead.
This section describes the usage of the illumina_export2sam.pl script . The script islocated in CASAVA’s bin directory and is an update to the SAMtools scriptexport2sam.pl, redistributed in CASAVA under the MIT license (seehttp://sourceforge.net/projects/samtools/develop).
NOTEUse CASAVA’s illumina_export2sam.pl script instead of the SAMtools script.The illumina_export2sam.pl script has a number of updates that areimportant for proper conversion of ELANDv2e alignments. See the scriptheader for a full list of these updates.

SAMForm
at
CASAVA v1.8.2 User Guide 171
SAMFormat
The Sequence Alignment/Map (SAM) format is a generic format for storing largenucleotide sequence alignments. SAM files have a .sam extension. and consist of oneheader section and one alignment section. The whole header section can be absent, butkeeping the header is recommended.This section provides the information relevant for the SAM files generated by CASAVA;a detailed description of the generic SAM format is available fromsamtools.sourceforge.net.To generate a SAM file, see Introduction on page 170.
Header SectionThe Illumina SAM files start with @PG, which indicates that the first line is a headerline (@) of the program type (PG). The line is TAB-delimited and each data field has anexplicit field tag, which is represented using two ASCII characters, as described below.
Tag DescriptionID Program nameVN Program version used to generate the fileCL The configureBuild.pl command line used to execute or create the workflow for the
SAM target
An example of a header line is shown below:@PG ID:CASAVA VN:CASAVA-1.8.0 CL:/home/user1/CASAVA_
20091209/bin/configureBuild.pl -p testBaseMiniBAM --targets
bam
Alignment SectionThe alignment section consists of multiple TAB-delimited lines with each linedescribing an alignment. Each line is:
<QNAME> <FLAG> <RNAME> <POS> <MAPQ> <CIGAR> <MRNM> <MPOS>
<ISIZE> <SEQ> <QUAL> \ [<TAG>:<VTYPE>:<VALUE> [...]]
An example of a line in an alignment section is shown below:HWI-EAS68_9096:2:15:512:204 99 c22.fa 14483804 29
76M6I18M = 14484254 550
AGAAATGTTCTAAAATTAAATTGTAGTGATGTCTGCACAACTTTGTAAGT
TTATAAAAAATAATTGACTTGTACACTTAATATTAATGAGTTGTATGGCA
HGFGHGHHGHHIHEGHHHEHHHFEECBBFBGFHHHEHHHEHHGHHHDHHD
HEH>EFHH=?CC?C6HHHEED?FFFHHHF=HEHH?HHH;HGHHGBHFBD?
XD:Z:76^6$18 SM:i:1 AS:i:29
The format of each field is explained in the following table.
Field DescriptionQNAME Query pair name if paired; or Query name if unpaired. This consists of the
following sequence:<Machine>_<Run number>:<Lane>:<Tile>:<X coordinate of cluster>:<Y coordinateof cluster>
FLAG Bitwise flag. For a description, see Bitwise Flag Values on page 172.

Exportto
SAMConversion
172 Part # 15011196 RevC
Field DescriptionRNAME Reference sequence name. The contains the export.txt.gz file match chromosome
value, and if the export.txt.gz file "Match contig" field is not empty, the SAMRNAME field will be appended with a "/" character followed by the match contigname. See Export.txt.gz on page 81.
MAPQ Mapping quality (Phred-scaled posterior probability that the mapping position ofthis read is incorrect)
CIGAR Extended CIGAR string. For a description, see Extended CIGAR Format on page172.
MRNM Mate Reference sequence NaMe; “=” if the same as <RNAME>MPOS 1-based leftmost mate position of the clipped sequenceISIZE Inferred insert sizeSEQ query SEQuence; “=” for a match to the reference; n/N/. for ambiguity;
cases are not maintainedQUAL query QUALity; ASCII-33 gives the Phred base qualityTAG TAG for an optional field. For a description, see Optional Fields on page 173.VTYPE Value TYPE for an optional field. For a description, see Optional Fields on page
173.VALUE Match <VTYPE> for an optional field. For a description, see Optional Fields on
page 173.
Bitwise Flag ValuesThe FLAG field in the alignment section is a bitwise flag. The meaning of predefinedbits is shown in the following table:
HexadecimalValue
DecimalValue
Description
0x0001 1 The read is paired in sequencing, no matter whether it is mappedin a pair
0x0002 2 The read is mapped in a proper pair (depends on the protocol,normally inferred during alignment)
0x0004 4 The query sequence itself is unmapped0x0008 8 The mate is unmapped0x0010 16 Strand of the query (0 for forward; 1 for reverse strand)0x0020 32 Strand of the mate0x0040 64 The read is the first read in a pair0x0080 128 The read is the second read in a pair0x0100 256 The alignment is not primary (a read having split hits may have
multiple primary alignment records)0x0200 512 The read fails platform/vendor quality checks0x0400 1024 The read is either a PCR duplicate or an optical duplicate
NOTEThe bitwise flag means that if multiple conditions are true, the values areadded, and only the total value is reported. For example, if a read is paired insequencing (value 1), the mate is unmapped (value 8), and the read is thefirst read in a pair (value 64) a total of 1 + 8 + 64 = 73 is reported).
Extended CIGAR FormatA CIGAR string is comprised of a series of operation lengths plus the operations. Theconventional CIGAR format allows for three types of operations: M for match ormismatch, I for insertion and D for deletion. The extended CIGAR format further allows

SAMForm
at
CASAVA v1.8.2 User Guide 173
four more operations, as is shown in the following table, to describe clipping, paddingand splicing:
Operation DescriptionM Alignment match (can be a sequence match or mismatch)I Insertion to the referenceD Deletion from the referenceN Skipped region from the referenceS Soft clip on the read (clipped sequence present in <seq>)H Hard clip on the read (clipped sequence NOT present in
<seq>)P Padding (silent deletion from the padded reference
sequence)
For example, the CIGAR string 30M1I69M means 30 bases aligning to the reference(30M), 1 base insert (1I), and 69 bases aligning (69M).
Optional FieldsOptional fields are in the format: <TAG>:<VTYPE>:<VALUE>, for example: XD:Z:73T26.Each tag is encoded in two alphanumeric characters and appears only once for analignment. Illumina SAM files may use some or all of the following optional fields:
Tag DescriptionSM ELAND single-read alignment scoreAS ELAND paired-read alignment scoreXD String for mismatching positionsXC Provides information to distinguish different unmapped read
types
The <VTYPE> describes the value type in the optional field. Valid types in SAM aredescribed in the following table.
Type DescriptionA Printable characteri Signed 32-bit integerf Single-precision float
numberZ Printable stringH Hex string (high nybble
first)
The <VALUE> field format is defined by the tag:
Tag Value FieldSM The <VALUE> field contains the ELAND single-read alignment scoreAS The <VALUE> field contains the ELAND paired-read alignment scoreXD The <VALUE> field contains the string for mismatching positions.
• Matching bases are numbered. For example, a value of 100 means that 100consecutive bases match the reference.

Exportto
SAMConversion
174 Part # 15011196 RevC
Tag Value Field•Mismatched bases are indicated by a base (ACGTN), where the letter indicates thereference base.
• Insertions and deletions start with a "^" character and are closed with a "$"character. A number indicates an insertion in the read of that size, a base (ornumber of bases) indicate the sequence of the reference that was deleted in theread.
For example, the string 30^1$28G means the following:• 30: 30 bases matching reference• ^1$: one base insertion in read• 28: 28 bases matching reference• G: reference base G is mismatched in read
XC Provides read status information normally conveyed in the chromosome field of theexport.txt file for unmapped reads. Specificially, "XC:Z:QC" is used to mark anELANDQC failure read, "XC:Z:RM" is used to mark an ELAND repeat mask read,and "XC:Z:CONTROL" is used to mark a control read. No optional field is added toreads which are marked as no match ("NM") in the export file – it is understood thatthis is the default status of an unmapped read

Usag
e
CASAVA v1.8.2 User Guide 175
Usage
For export to SAM conversion, enter the following:path-to-CASAVA/bin/ illumina_export2sam.pl --read1=FILENAME
[options] > outputfile.sam
Make sure to specify an output file, else the output gets written to the screen.The options are described in the table below.
Option Description--read1=FILENAME Read1 export file (mandatory). File may be gzipped with
".gz" extension.--read2=FILENAME Read2 export file. File may be gzipped with ".gz"
extension.--nofilter Include reads that failed the basecaller purity filter.--qlogodds Assume export file(s) use logodds quality values as
reported by Pipeline prior to 1.3.--version Prints version information.--help Prints on screen usage guide.
ExampleAn example of illumina_export2sam.pl use is as follows:
path-to-CASAVA/bin/illumina_export2sam.pl --read1=NA10831_
ATCACG_L001_R1_001_export.txt.gz --read2=NA10831_ATCACG_
L001_R2_001_export.txt.gz > s_2_converted.sam
This will write an output file s_2_converted.sam that contains the paired-end readsfrom s_2_1_export.txt and s_2_2_export.txt.

176 Part # 15011196 RevC

CASAVA v1.8.2 User Guide 177
Glossary
B
Bayesian modelA Bayesian model provides a means to update a prior hypothesis based on
evidence. As an example, in a Bayesian genotype model we may have a
prior hypothesis that our sample genotype matches that from a reference
sample with probability q. After accounting for evidence of the sample gen-
otype in the form of sequencing reads which are inconsistent with the ref-
erence genotype, our hypothesis is updated such that the probability of the
sample genotype matching the reference has been reduced to a value less
than q.
D
De Bruijn graphA De Bruijn graph of m symbols is a graph representing overlaps between
sequences. De Bruijn graphs are used for de novo assembly of short read
sequences into a genome.
deprecatedDeprecated refers to software features that are superseded and should be
avoided. Although deprecated features remain in the current version, their
use may raise warning messages, and deprecated features may be removed
in the future. Features are deprecated—rather than being removed—in
order to provide backward compatibility and give programmers who have
used the feature time to bring their code into compliance with the new
standard.
K
kmer-hashingHashing refers to the use of subfragments of a particular read to find match-
ing pieces of DNA in a hash table. k-mer means the size of the fragment
used for hashing.

Glossary
178 Part # 15011196 RevC
O
orphan readsAn orphan read is the unaligned part of paired reads for which only one
read aligned. Identical to shadow read.
S
shadow readA shadow read is the unaligned part of paired reads for which only one
read aligned. Identical to orphan read.
singletonA singleton is the aligned part of paired reads for which only one read
aligned.
W
wrapper scriptA wrapper script is a script whose main purpose is to call a second func-
tion in a computer program with little or no additional computation.

Index
CASAVA v1.8.2 User Guide 179
Index
Aabundant sequences 72all intensity plots 45All.htm file 45, 79analysis output 6error rates 79file naming 81lane averages 44, 79proportion of reads 80tile-by-tile 45, 79ANALYSIS variables 63
BBARCODE 59base calling 2BaseCalls directory 27bcl files 28BustardSummary.xml 43BustardSummary.xml file 52
CCASAVAbuild 107build directory 104build web page 106installing 118variant detection and counting 90CASAVA software 5, 7, 90chip results summary 43chip summary 43clocs files 29clusters passing filters 17clusters per tile 17Compressed FASTQ 5config.txt file 56, 59, 66config.xml 30configurealignment.pl script 48Configuring GERALD 48configuring multiple runs 102contaminants 72control files 29Count.txt files 112counting 2, 7, 90configuring multiple runs 102examples 103options 99, 101-102, 155-156output files 104running 98customer support 181
Ddemultiplexing 6, 26example 32options 33DNA sequencinglarge genome 90small genome 91documentation 181
EELANDanalysis modes 63eland_extended 63, 70ELAND_MAX_MATCHES 70eland_pair 63, 71eland_rna 64, 72ELAND_SEED_LENGTH1 70ELAND_SEED_LENGTH2 70ELAND_SET_SIZE 65ELAND_standalone.pl script 87ELANDv2 49email reporting 118Error.htm file 79expanded lane summary 43
FFASTQ files 51FASTQ generation 2, 5filter files 29first cycle intensity 17
Ggapped alignment 6, 70-71GERALD 48GERALD.pl script 55
Hhelpreporting problems 10help, technical 181
Iimage analysis 2indexing 6intensity curves 86IVC Plots 44IVC.htm file 44, 79

Index
180 Part # 15011196 RevC
KKAGU_PAIR_PARAMS 67, 71KAGU_PARAMS 67
Llane results summary 43locs files 29
Mmake 122make option 66mitochondrial DNA 72multiplexed sequencing 6multiseed alignment 6, 70-71
Nnetwork requirements 114none 64
OOff-Line Base caller 4OLB 4orphan alignment 7, 140
Ppaired readsanalysis variables 63eland_pair 71parallelizationlimitations 123per-tile statistics 44Perfect.htm file 80phasing 43phasing/prephasing percentage 18pos.txt files 29position files 29prephasing 43PROJECT 59
QQseq Converteroptions 166parameters 166quality scores 40, 150
RRead Segment Quality Control Metric41readBases 94real time analysisBustardSummary.xml 43quality metrics 43REFERENCE 59reference files5S RNA 128, 130abundant sequences 128, 130
CASAVA 129contaminants 128, 130eland_rna 127mitochondrial DNA 128, 130ribosomal repeats 128, 130reference genome 52, 96, 127, 129repeat alignment 70-71repeat masked 72repeat resolution 7, 139ribosomal repeats 72RM 72RNA sequencing 72, 91Run Foldernaming 26run quality 85run.conf.xml file 95RunInfo.xml file 30runReport.pl script 118
SSAM Conversion 170SAM format 170-171SAMPLE 59SamplesDirectories.csv 42SampleSheet.csv file 22, 30, 52sequence alignment 2sequence alignments 48sites.txt files 109snps.txt files 109splice junctions 72standard deviations 18Standard GERALD Analysis 55stats files 28Summary.htm file 85
Ttechnical assistance 181tile variability 86
UUSE_BASES 64
Vvariant analysis 2variant detection 7, 90configuring multiple runs 102examples 103input files 95options 99, 101-102, 155-156output files 104running 98Variant Detection and Counting 7
WWhat’s New 9

TechnicalA
ssistance
CASAVA v1.8.2 User Guide 181
TechnicalAssistanceFor technical assistance, contact Illumina Customer Support.
Illumina Website http://www.illumina.com
Email [email protected]
Table 29 Illumina General Contact Information
Region Contact Number Region Contact NumberNorth America 1.800.809.4566 Italy 800.874909
Austria 0800.296575 Netherlands 0800.0223859
Belgium 0800.81102 Norway 800.16836
Denmark 80882346 Spain 900.812168
Finland 0800.918363 Sweden 020790181
France 0800.911850 Switzerland 0800.563118
Germany 0800.180.8994 United Kingdom 0800.917.0041
Ireland 1.800.812949 Other countries +44.1799.534000
Table 30 Illumina Customer Support Telephone Numbers
MSDSsMaterial safety data sheets (MSDSs) are available on the Illumina website athttp://www.illumina.com/msds.
Product DocumentationIf you require additional product documentation, you can obtain PDFs from theIllumina website if PDFs are available. Go tohttp://www.illumina.com/support/documentation.ilmn. When you click on a link, youwill be asked to log in to iCom. After you log in, you can view or save the PDF. Toregister for an iCom account, please visit https://icom.illumina.com/Account/Register.

Illumina, Inc.9885TowneCentreDriveSanDiego,CA92121-1975+1.800.809.ILMN (4566)+1.858.202.4566 (outsideNorth America) [email protected]