
MUSTARD GAS POISONING, CHRONIC AND LUNG · brit. j. prey. soc. med. (1955) 9, 62-72 mustard gas...
11
Brit. J. prey. soc. Med. (1955) 9, 62-72 MUSTARD GAS POISONING, CHRONIC BRONCHITIS, AND LUNG CANCER AN INVESTIGATION INTO THE POSSIBILITY THAT POISONING BY MUSTARD GAS IN THE 1914-18 WAR MIGHT BE A FACTOR IN THE PRODUCTION OF NEOPLASIA BY R. A. M. CASE Institute of Cancer Research, The Royal Cancer Hospital, London, AND A. J. LEA Ministry of Pensions and National Insurance INTRODUCTION Mustard gas (pfl-dichlor-ethyl-sulphide) and its analogues, the nitrogen mustards, are known to be carcinogenic to experimental animals (Boyland and Horning, 1949, Heston, 1953a, b). It was first used on the Western Front in the 1914-18 war on the night of July 12-13, 1917, and after that date was used so extensively that areas of the country became saturated with it and had to be abandoned by both sides. Because of this persistence it is not possible to assume that any man serving in the front line after July 12, 1917, escaped some exposure to the gas. Between this date and the end of the war the total number of British cases treated for war gas poisoning is recorded as 160,970, and 80 per cent. of these are estimated to be due to mustard gas (Medical Services Diseases of the War, 1923). 124,702 of these cases were admitted to hospitals, and 4,167 died before discharge. These figures must be an underestimate of the total British casualties, since they do not include the unknown number of men who were gassed and taken prisoner. An experience of this sort, where a chemical stimulus of an easily identifiable type is applied to a human population for a short time, at a known date, resembles in some ways a carefully planned animal experiment, and the size of the operation should provide ample material for an investigation into any possible carcinogenic action of the gas. METHODS AND MATERIALS The ideal method of investigation would be to take all or a random sample of the men known to have been gassed and to follow up their histories until the present date. This could not be done since the absence of exten- sive and reliable morbidity data for neoplastic diseases compels the use of mortality data, and the Registrar- General's records cannot answer the questions "Is this person dead or not, and if so when and why?". Before a particular death certificate can be traced, it is necessary to know firstly that death has taken place, and secondly the approximate date and the district where the death was registered. Fortunately, in the present circumstances, an alterna- tive method was available, to follow up the histories of those men who were pensioned for the effects of mustard gas poisoning, since if death had occurred sufficient data would be recorded to enable the death certificates to be traced. The Ministry of Pensions and National Insurance has complete records of all men who were receiving a pension in 1930, but this was the earliest date at which the records were complete. The disability for which the pension was granted, and often the grant of the pension itself, were of course in existence for varying periods before this date. On January 1, 1930, 1,267 men in England and Wales were receiving a pension for the effects of mustard gas poisoning. resulting from the 1914-18 war. A small number of cases in Scotland and Ireland were excluded, since it would otherwise have been necessary to prepare extensive additional analytical tables for these countries. Apart from these cases, the whole of the available data is used, so that no question of further selection arises. The mortality experienced by these 1,267 men was examined from January 1, 1930, until December 31, 1952, this closing date being determined because it was the end of the last year for which the Registrar-General's Annual Reports had become available. This mortality experience (subsequently referred to as the experience "found") was compared with a standard ("expected") mortality experience based on the male population (including non-civilians) of England and Wales, calculated by a 62 copyright. on 6 August 2018 by guest. Protected by http://jech.bmj.com/ Br J Prev Soc Med: first published as 10.1136/jech.9.2.62 on 1 April 1955. Downloaded from
Transcript of MUSTARD GAS POISONING, CHRONIC AND LUNG · brit. j. prey. soc. med. (1955) 9, 62-72 mustard gas...

Brit. J. prey. soc. Med. (1955) 9, 62-72
MUSTARD GAS POISONING, CHRONIC BRONCHITIS,AND LUNG CANCER
AN INVESTIGATION INTO THE POSSIBILITY THAT POISONINGBY MUSTARD GAS IN THE 1914-18 WAR MIGHT BE A FACTOR
IN THE PRODUCTION OF NEOPLASIABY
R. A. M. CASEInstitute of Cancer Research, The Royal Cancer Hospital, London,
AND
A. J. LEAMinistry ofPensions and National Insurance
INTRODUCTIONMustard gas (pfl-dichlor-ethyl-sulphide) and its
analogues, the nitrogen mustards, are known to becarcinogenic to experimental animals (Boyland andHorning, 1949, Heston, 1953a, b). It was first usedon the Western Front in the 1914-18 war on thenight of July 12-13, 1917, and after that date wasused so extensively that areas of the country becamesaturated with it and had to be abandoned by bothsides. Because of this persistence it is not possibleto assume that any man serving in the front lineafter July 12, 1917, escaped some exposure to the gas.Between this date and the end ofthe war the total
number of British cases treated for war gas poisoningis recorded as 160,970, and 80 per cent. of these areestimated to be due to mustard gas (MedicalServices Diseases of the War, 1923). 124,702 ofthese cases were admitted to hospitals, and 4,167died before discharge. These figures must be anunderestimate of the total British casualties, sincethey do not include the unknown number of menwho were gassed and taken prisoner.An experience of this sort, where a chemical
stimulus of an easily identifiable type is applied to ahuman population for a short time, at a known date,resembles in some ways a carefully planned animalexperiment, and the size of the operation shouldprovide ample material for an investigation into anypossible carcinogenic action of the gas.
METHODS AND MATERIALSThe ideal method of investigation would be to take all
or a random sample of the men known to have beengassed and to follow up their histories until the present
date. This could not be done since the absence of exten-sive and reliable morbidity data for neoplastic diseasescompels the use of mortality data, and the Registrar-General's records cannot answer the questions "Is thisperson dead or not, and if so when and why?". Before aparticular death certificate can be traced, it is necessaryto know firstly that death has taken place, and secondlythe approximate date and the district where the deathwas registered.
Fortunately, in the present circumstances, an alterna-tive method was available, to follow up the histories ofthose men who were pensioned for the effects of mustardgas poisoning, since if death had occurred sufficient datawould be recorded to enable the death certificates to betraced.The Ministry of Pensions and National Insurance has
complete records of all men who were receiving a pensionin 1930, but this was the earliest date at which the recordswere complete. The disability for which the pension wasgranted, and often the grant of the pension itself, were ofcourse in existence for varying periods before this date.On January 1, 1930, 1,267 men in England and Waleswere receiving a pension for the effects of mustard gaspoisoning. resulting from the 1914-18 war. A smallnumber of cases in Scotland and Ireland were excluded,since it would otherwise have been necessary to prepareextensive additional analytical tables for these countries.Apart from these cases, the whole of the available datais used, so that no question of further selection arises.The mortality experienced by these 1,267 men wasexamined from January 1, 1930, until December 31, 1952,this closing date being determined because it was the endof the last year for which the Registrar-General's AnnualReports had become available. This mortality experience(subsequently referred to as the experience "found")was compared with a standard ("expected") mortalityexperience based on the male population (includingnon-civilians) of England and Wales, calculated by a
62
copyright. on 6 A
ugust 2018 by guest. Protected by
http://jech.bmj.com
/B
r J Prev S
oc Med: first published as 10.1136/jech.9.2.62 on 1 A
pril 1955. Dow
nloaded from
MUSTARD GAS POISONING, CHRONIC BRONCHITIS, AND LUNG CANCER
method (see statistical appendix) that makes allowancesfor age-specific and secular changes of mortality rates.
Since data for environmental cancer studies on care-fully and completely defined populations are scanty,arrangements are being made to ensure that adequaterecords of the men surviving after the end of 1952 aremaintained. It will then be possible to make periodicalsurveys of the mortality experience, until eventually acomplete mortality study from 1930 until the demise ofall the men concerned can be made. Such a study mightprovide interesting information about any possiblealteration in cancer mortality at more advanced ages, andhelp to elucidate whether the increase of lung cancerfound in two of the series discussed below represents anabsolute increase in the carcinogenic process or merelyan earlier induction in susceptible subjects.
Discussions had indicated that there were two opinionsabout the type of possible carcinogenic effect of mustardgas. One suggested that the effect might be specificallyconfined to the respiratory tract, the other that the effectmight be non-specific and affect the general process ofneoplasia. Since the number of deaths from neoplasticdisease in the series was too small to warrant a completeanalysis by site, analytical tables were selected for thetwo disease classifications "all neoplasms" (includingmalignant tumours, non-malignant or undefined tumours,leukaemia and lymphadenoma) and "cancer of the lungand pleura". By subtraction, a third classification,"neoplasms other than cancer of the lung and pleura",is obtained.The problem of the possible effect of mustard gas was
studied by comparing the mortality expected and thatfound from "cancer of the lung and pleura" and from"neoplasms other than cancer of the lung and pleura".In addition to these, deaths from "all causes" were alsostudied.As will be shown later, the men in the mustard gas
series experienced an excessive mortality from bronchitis,and the case histories were examined to see why a pensionwas being issued in 1930. This investigation revealedthat, although the label in each case was "mustard gaspoisoning" or some similar phrase, the reason forgranting the pension was not that the man had beengassed but that in 1930 there were sufficient clinicalfindings present to warrant the view that permanentdamage had been sustained. In 81 per cent. of the casesthe pension was given because of bronchitis, bron-chiectasis, emphysema, or fibrosis of the lung, and inmost of the remaining 19 per cent. there was clear evidenceof bronchitis. Evidently we were studying not simply apopulation which had at some time been poisoned bymustard gas, but a population poisoned by mustard gasand extensively affected by chronic bronchitis, either as aresult of gassing or for other reasons.
It was, therefore, decided to investigate the mortalityof soldiers from the 1914-18 war who on January 1,1930, were being pensioned, and who were recorded ashaving bronchitis, but who had never been exposed tomustard gas. Ample material was available, but alimitation was imposed so that only individuals who hadnot served as soldiers overseas after the date of the first
use of mustard gas were studied. This was necessary asthere can be little doubt that many men exposed to smalldoses of the gas had no severe symptoms, and such caseswould not be recorded in the Ministry's records as havingbeen gassed.Apart from this limitation, the choice from the available
material relating to bronchitis cases without mustard gasexposure was made at random, and a series of 1,421 caseswas studied.
It is of course possible that a man might be diagnosedas suffering from chronic bronchitis or a chest disabilityresulting from his war service when in fact he wassuffering from an unrecognized lung cancer, which mightlater be correctly diagnosed. Thus a bias might existbecause of the selective admission of lung cancer casesto the series, but this bias would be limited to cases dyingin the first few years of the survey because of the limitedsurvival time of sufferers from untreated cancer of thelung. Furthermore, it has already been stated that,although the survey starts in 1930 because this is the firstyear for which complete records are available, the menwho were pensioned at that date had for the most partbeen pensioned or suffering from their disability forsome time.
In order to gain some idea of how seriously a bias ofthis type might be affecting the findings discussed in thispaper, the medical histories of those men in the mustardgas series or the bronchitis series who died of lung cancerwithin the arbitrary limit of 6 years from the starting date,January 1, 1930, were re-examined. Seven men in themustard gas series and five in the bronchitis series fellinto this category. This scrutiny revealed that in each ofthese cases the diagnosis of chronic bronchitis had beenmade as early as 1918. In fact, it appeared that all thecases of chronic bronchitis in these two series had beenso diagnosed before the end of 1921. We thereforeconsider that the possibility of a bias due to the selectiveadmission of lung cancer sufferers to the series under themistaken diagnosis of chronic bronchitis can be ignoredin assessing the results of these studies.
All the men in the two series so far considered were bydefinition serving soldiers in the 1914-18 war. This initself might mean that the standards used, derived fromthe whole of the male population of England and Wales,might not be applicable to men selected in this way.From the time of their enlistment until they left activeservice, the men were presumably selected for physicalfitness and the absence of any obvious sign of disease, andit might be thought that this would affect their subsequentmortality experience. There is also a widespread beliefthat members of the armed forces in the 1914-18 warsmoked to excess (the colloquial term "gasper" originatedat this time). Any analysis of the incidence of cancerof the lung and pleura might therefore be open to theobjection that there would be a systematic bias in respectof smoking habits.
Whilst it is highly desirable that such a bias should ifpossible be excluded, or at least detected, the compositionof the general population used for forming the standardof comparison must be considered. Of the cases studied,70 per cent. were between the ages of 20 and 35 in 1917.
63
copyright. on 6 A
ugust 2018 by guest. Protected by
http://jech.bmj.com
/B
r J Prev S
oc Med: first published as 10.1136/jech.9.2.62 on 1 A
pril 1955. Dow
nloaded from

R. A. M. CASE AND A. J. LEA
The Registrar-General's (1927) population estimates(Decennial Supplement, 1921) show that 58 per cent. ofmales in these age groups were in the armed forces in1917, and the method used ensures that the mortalityexperience at any given date is the experience of thesemen as they pass through life. Thus the discrepancybetween the armed forces and the general population isnot so extreme as might be imagined.
Nevertheless, we thought it advisable to analyse afurther sample of men drawn from the armed forces in1914-18, who had not been exposed to mustard gas andwho were not selected for bronchitis, although they mightreasonably be assumed to develop it at a rate comparablewith that in the general population. Ideally, such a serieswould consist ofmen who had served in the 1914-18 war,had not been exposed to mustard gas, and had beendischarged from the forces without any obvious medicalabnormality, but the Ministry of Pensions and NationalInsurance obviously do not keep such records.A reasonable approximation to such a series, and one
that was readily available, was found amongst men whohad served in the 1914-18 war, had been wounded ina manner that necessitated a single leg amputation, andleft France before July 12, 1917 (thus excluding unrecordedpoisoning by mustard gas), and were receiving a pensionfor the disability of single-leggedness in 1930. A randomselection of 1,114 such cases was made from the availabledata.The method of statistical analysis adopted, the tech-
nical details of which are discussed in an appendix,allowed us to study both the number of deaths from eachdisease classification that were found (and that would beexpected if the rates of death acting on the generalpopulation were also acting on each series of cases) andalso the age at which these deaths took place. A studyof age-incidence in human cancer is desirable, becausefew data exist to help elucidate how far the biologicalage of the host is important and how far the length andthe subsequent period of exposure to outside inflencesis important. This form of analysis has therefore beenapplied to each disease classification and to each series.
RESULTSThe records of all the men in each series were
examined, and the following information wasextracted:
(a) age;(b) whether alive or dead;(c) if dead, date of death;(d) if dead, cause of death.
In all cases where death had occurred, the deathcertificate was scrutinized, and the category to whichthe Registrar-General had assigned the death wasdetermined. This was done since all the standardrates are based on deaths assigned to the diseaseclassifications named; a death certificate mightmention more than one disease, but be assigned tothe category of only one of these.
Calculations were made from these data and fromthe analytical tables, and the expected numbers ofdeaths from all causes and in each of the disease classi-fications studied were determined. "Expected" in thiscontext means the number that would have occurredhad the mortality that affects the general population,defined as the male population of England andWales, acted with the same severity in the seriesstudied. These expected numbers and the mortalityratio (M.R.), which is defined as the number of"deaths found" expressed as a percentage of thenumber of "deaths expected", are shown in theTable. The mortality ratio for deaths from all causesis here calculated from Tables which allow thepopulation to be depleted at the standard rates forEngland and Wales. Where the mortality ratio for"deaths from all causes" is markedly raised, thecalculation of mortality ratios for individual diseaseswill be biased, since the actual number of years livedat each age period will become progressively lessthan the theoretical number as the population is
TABLEMORTALITY FROM EACH CLASS OF DISEASE FOUND AND EXPECTED IN THREE SERIES STUDIED
Disease Class
Neoplasms otherSource of Data All Causes All Neoplasms Cancer of Lung than Cancer of
and Pleura Lung and Pleura
Mortality Mortality Mortality MortalityDeaths Ratio Deaths Ratio Deaths Ratio Deaths Ratio
547 79 29 50Mustard Gas 153* 130 207 107
357 3 (VHS) 60*8 (S) 14*0 (HS) 46*8 (NS)
932 104 29 75Series Bronchitis 138* 109 201 93
673 8 (VHS) 95*0 (NS) 14-4 (HS) 80-6 (NS)
383 72 13 59Amputation 105* 100 84 104
365 *7 (NS) 72*2 (NS) 15*5 (NS) 56*7 (NS)
STIR_,14;11,. ^:a^^+ D ................. A.tw1I a hAlQonfst P hotwipn A -Al sindi 0-(I
64
VHS = very hignly significant (r < UUUU). l = nsugsy sigumcai roviweunwuv,uaE ,vwx1.S = significant (P between 0 *05 and 0 * 01). NS = not significant (P > 0 - 05).
*Mortality ratios based on theoretical number of years lived.
copyright. on 6 A
ugust 2018 by guest. Protected by
http://jech.bmj.com
/B
r J Prev S
oc Med: first published as 10.1136/jech.9.2.62 on 1 A
pril 1955. Dow
nloaded from

MUSTARD GAS POISONING, CHRONIC BRONCHITIS, AND LUNG CANCER
depleted by the excessive mortality. In the presentstudy a complete statement of mortality has beenmade, and from this the actual number of years livedat each age period can be calculated. The mortalityratios for the classes of neoplastic disease havebeen calculated from this actual life experience.
In the Figure, where the age-distribution of deathsis shown, all the results have been calculated fromthe actual life experience, since the theoreticalattenuation would tend to bias the results where themortality ratios for "deaths from all causes" is high.MUSTARD GAS SERIES.-In the mustard gas
poisoning series, 1,267 men were alive on January 1,1930, and between that date and December 31,1952, 547 deaths had occurred, leaving 720 men stillalive. The total number of deaths expected was 357,so that an excess of 190 deaths was found, themortality ratio being 153. This difference isstatistically very highly significant.*
*See Table for definition of significance levels, and for the ratesfrom which the ratios are calculated, since these rates have been roundedoff to whole numbers in the text.
Deaths from Neoplasm.-79 were found, and 61expected, an excess of eighteen deaths, the mortalityratio being 130. This difference is statisticallysignificant.When these deaths are sub-divided into deaths
from "cancer of the lung and pleura" and deathsfrom "neoplasms other than cancer of the lung andpleura", it is seen that the excess deaths fromneoplasm can be attributed to a large excess ofdeaths from cancer of the lung and pleura. In thisdisease classification, 29 deaths were found andfourteen expected, giving an excess of fifteen and amortality ratio of 207. This difference is statisticallyhighly significant.
Fifty deaths from "neoplasms other than cancerof the lung and pleura" were found, and 47 expected.This is an excess of three deaths and a mortalityratio of 107. This difference is not statisticallysignificant, in fact, the numbers 'expected and foundare in very close agreement.
Finally, deaths from bronchitis were investigated,and it was found that 217 deaths classified as due toBRONCHITIS
Very highly significant
25- 35- 45. 55- 65- 75+
MoUSTARD GASHighly signfficont
40
30
<20-
U 0iAGE (yrs) 25- 35- 45- 55- 65 75+
wccC. - Not significant
60 0w JL<- 20'
U AGE (yrs) 25- 45- 65+
Not sInnificant Not slonifi
2ie'L 4
MO
WE
AMPUTATIONNot significant
25- 35- 45- 55- 65- 75+
icWat
~1
GE (yrs) <55 >55 <55 >55 <55
Expected Found
FIGURE.-Age distribution of deaths found and expected in each disease classification.Not significant, P > 0-05. Highly significant, 0 01 > P > 0-001. Very highly significant, P < 0 0001.
Not significant Not signIficant
65
copyright. on 6 A
ugust 2018 by guest. Protected by
http://jech.bmj.com
/B
r J Prev S
oc Med: first published as 10.1136/jech.9.2.62 on 1 A
pril 1955. Dow
nloaded from

R. A. M. CASE AND A. J. LEA
bronchitis (all types) had occurred as against 21expected. This is a statistically very highly significantexcess of 196, the mortality ratio being 1,033. Thisexcess of 196 deaths could wvholly account for theexcess of 172 deaths left after the excess of neoplasmdeaths had been taken into account. There remain251 deaths from causes other than bronchitis orneoplasm, the expected number being 276. Thisdeficit of 25 deaths is not statistically significant(P 01).
Considering the Figure showing the observed andexpected frequency (as a percentage of the totaldeaths considered), the pattern of the age-specificmortality (i.e. percentage age distribution of deaths)from all causes is seen to have been altered, beingrelatively higher in younger age groups. Thisdifference is statistically highly significant. Deathsfrom neoplasms other than cancer of the lung andpleura do not show this altered pattern, and althoughthere is a suggestion that deaths from cancer of thelung and pleura do show such an effect, the difference,is not statistically significant.
Bronchitis Series. In this series 1,421 men werealive in 1930, and 932 deaths had occurred byDecember 31, 1952, leaving 489 survivors. The totalnumber of deaths expected wdis 674, giving anexcess of 256 deaths with a mortality ratio of 138.This difference is statistically very highly significant.
Deaths from Neoplasm.--104 were found, and95 expected, an excess of nine and a mortality ratioof 109. This difference is not statistically significant.
Splitting these deaths into the two sub-divisions,29 deaths from "cancer of the lung and pleura"were found and fourteen expected, an excess offifteen deaths and a mortality ratio of 201. Thisdifference is statistically highly significant.
Seventy-five deaths from "neoplasms other thancancer of the lung and pleura" were found, and 81expected. This is a deficiency of six deaths and amortality ratio of 93. This difference is not statisti-cally significant.
Since the object of this work was to study therelationship between mustard gas poisoning andneoplasia, no detailed studies on causes of deathother than from neoplasms were made on this series.The Figure shows that, as in the previous series,
there is a tendency for the age-specific mortalityfrom all causes to be disproportionately increasedin the younger age groups, this difference beingstatistically significant. Neither of the two classes ofneoplasms show any significant effect of this sort.
occurred, leaving 731 survivors. 366 deaths wereexpected, and an excess of seventeen deaths werefound, the mortality ratio being 105. This differenceis not statistically significant.
Deaths fro/) Neoplasm. 72 were found and 72were expected. The mortality ratio is therefore 100.Thirteen deaths from "cancer of the lung and
pleura" were found and sixteen expected. Thisdeficiency of three* (mortality ratio 84) is notstatistically significant.
59 deaths from "neoplasms other than cancerof the lung and pleura" were found and 57 expected.This excess of two* (mortality ratio 104) is notstatistically significant.The Figure shows no statistically significant
alteration of the age-specific mortality pattern inany of the disease classes.
DiscUSSIONThe foregoing results show that both the men who
had been poisoned with mustard gas (and whonearly all suffered from bronchitis) and the men whosuffered from bronchitis but were not poisoned withmustard gas, showed a very high general mortality.In the mustard gas series the excessive mortalitycould be completely accounted for by an excessivenumber of deaths from bronchitis and, to a lesserextent, by an excessive number of deaths from cancerof the lung and pleura. The reason for the excessivegeneral mortality was not sought for in the bronchitisseries, but an excessive number of deaths fromcancer of the lung and pleura was found.
In both cases the deaths from cancer of the lungand pleura occurred at twice the rate for the generalpopulation. Deaths from other forms of neoplasiaoccurred at the same rate as in the general population.The amputation series showed no deviation from
the rates for the general population in any of thecriteria studied, and so confirm that the standardsderived from the general population can be used onthese series of men who were by definition servingsoldiers in the 1914-18 war.The finding of a high incidence of cancer of the
lung and pleura in both the mustard gas series andthe bronchitis series does not support the view thatmustard gas has acted as a direct carcinogen, butit does provide evidence that chronic bronchitiscan be associated with an increased number ofdeaths attributed to carcinoma of the lung andpleura. This view has been advanced in the past,and some evidence for it published, especially withreference to bronchitis and the squamous-celledtype of carcinoma of the bronchus (Lea, 1952).
AMPUTATION SERIES. 1,114 men were alive in1930, and by December 31, 1952, 383 deaths had *These figures do not exactly balance owing to rounding-off to1930, ad byDeember 3, 1952,383 deahs had whole numbers (See Table).
66
copyright. on 6 A
ugust 2018 by guest. Protected by
http://jech.bmj.com
/B
r J Prev S
oc Med: first published as 10.1136/jech.9.2.62 on 1 A
pril 1955. Dow
nloaded from

MUSTARD GAS POISONING, CHRONIC BRONCHITIS, AND LUNG CANCER 67Unfortunately the Ministry of Pensions records
do not contain Ristological findings, but it is pro-posed to attempt to obtain the pathological materialfrom the hospitals concerned and to review thehistopathology of the series.
It is of course a matter of common knowledge thatdiagnostic errors affect mortality rates based ondeath certificates. This topic has been discussedextensively by Kennaway and Kennaway (1936)and by Willis (1953). In the present studies most ofthese errors will affect the general population, thecontrol series, and the two bronchitis series equally,and will not affect the conclusions. It only remainsto consider whether there is a common factor in themustard gas series and the bronchitis series whichmight systematically bias the diagnosis of cancer ofthe lung and pleura, and which will not be operatingin the amputation series. A history of chronic chestdisease, present by definition in the mustard gasand bronchitis series, might well be such a factor,but it is not obvious which way any bias from thissource would work.
It might be argued that the pre-existing chestdisease would cause more careful and more frequentexamination of the respiratory system, with aconsequent picking out of cases of malignant diseasewhich would otherwise be missed, or it might beargued that more frequent incorrect diagnoses oflung cancer might be made because of the misinter-pretation of abnormal physical signs due to theunderlying chronic condition. Both these sources oferror would tend to give an increase of the numberofrcases found compared with the number expected,but, if they do operate to any extent, it is somewhatsurprising that a connexion between chronic chestdisease and lung cancer is not well recognized bydiagnosticians, since both would presumably operateamongst the chronic bronchitics in the generalpopulation.On the other hand, it might plausibly be argued
that a chronic chest lesion would lead to a diminishedtendency to diagnose malignant disease of the lung,since it is not commonly thought that lung cancer isassociated with a long history or is compatible witha long survival time in an untreated state; sincesuperimposed physical signs due to the developmentof carcinoma in a chronically diseased lung mighteasily be missed against the pre-existing backgroundof abnormality; and since clinical teaching discour-ages the diagnosis of a double pathology.
These questions cannot be resolved by the presentstudies, but the different possibilities presented shouldbe borne in mind. The authors' opinion inclines to thepossibility of underdiagnosis of lung cancer ratherthan to its overdiagnosis in the two bronchitic series.
If we accept that the excess of cancer of the lungand pleura in the two bronchitic series is real andalso has a common aetiological factor in thebronchitis, the cancer experience of both groups canbe pooled and used to examine a hypothesisadvanced by Cramer (1936):
There appears to be a general law that when in agiven population the incidence of cancer in oneparticular organ is markedly increased as comparedwith another population, then there is a compensatingdecrease in the incidence of cancer in a number of theother organs. As a result, the incidence of cancer indifferent populations, whether of the same sex or not,may be composed of a very different distribution overthe various organs or tissues, but the sum total, thetotal incidence of cancer, remains on an even level.
This hypothesis seems to have been made intothe implicit basis of recent speculation in relation tothe smoking and lung cancer problem (Blond, 1954;Price Thomas, 1955). Possibly by an extension ofthe original intended scope of Cramers' "law", theysuggest that the excess of lung cancer in tobaccosmokers reported by (amongst others) Doll andBradford Hill (1952, 1954) does not mean thatcancer is being induced, but that the site where itbecomes manifest is determined by the effect ofsmoking.
In the two bronchitis series studied, 58 deathsfrom cancer of the lung were found and 28expected. If the increase in this site is beingcompensated for by a decrease in cancer of othersites, as required by the hypothesis extended in thesense required by the speculations about smoking,then there should be a deficit of about thirty casesof death from neoplasm other than cancer of thelung and pleura. In fact 125 are found and 127expected. This close agreement does not supportthe view that Cramer's "law" is valid in thiscase.
SUMMARY AND CONCLUSIONS(1) We have made an examination of the mortality
experience of 1,267 war pensioners who sufferedfrom mustard gas poisoning in the 1914-18 war, andwho were still alive on January 1, 1930. It was foundthat almost all (over 80 per cent.) had chronicbronchitis at that date. In subsequent years a statisti-cally significant excess of deaths attributed to cancerof the lung and pleura has been observed amongstthem (29 deaths found compared with fourteenexpected).
(2) A similar and statistically significant excess ofdeaths attributed to cancer of the lung and pleurawas found amongst a series of 1,421 war pensioners
copyright. on 6 A
ugust 2018 by guest. Protected by
http://jech.bmj.com
/B
r J Prev S
oc Med: first published as 10.1136/jech.9.2.62 on 1 A
pril 1955. Dow
nloaded from
R. A. M. CASE AND A. J. LEA
who served in the 1914-18 war, and suffered fromchronic bronchitis, but had never been exposed tomustard gas (29 deaths found compared withfourteen expected).
(3) No statistically significant difference betweenthe number of deaths from cancer of the lung andpleura found and expected was detected in a seriesof pensioners from the 1914-18 war who were
receiving a pension because of having had one legamputated, who had never been exposed to mustardgas, and whose inclusion in the series was indepen-dent of any selection for chronic bronchitis (thirteendeaths found compared with sixteen expected).
(4) No statistically significant difference betweenthe number of deaths from neoplasms other thancancer of the lung and pleura found and expectedwas detected in any of the three series.
(5) The possibility, that a systematic bias mightarise from analytical tables based on a generalpopulation of all males in England andWales beinginapplicable to a series ofmen who were by definitionserving soldiers in the 1914-18 war has been ex-
cluded, and the possibility of a diagnostic biasconsidered and discussed.
(6) The evidence presented does not support theview that mustard gas has acted as a direct carcino-gen, either in relation to neoplasia in general or inrelation to cancer of the lung and pleura.
(7) The evidence indicates that chronic bronchitismay be associated with the subsequent developmentof cancer of the lung and pleura, unless it is assumedthat the excess of deaths attributed to this diseaseis entirely due to diagnostic bias.
(8) The increased incidence of cancer of the lungand pleura, whether real or apparent, in the pooleddata derived from the cases of mustard gas poisoning,nearly all of whom were also suffering from chronic
bronchitis, and from the cases of chronic bronchitiswho had not been exposed to mustard gas, was notcompensated for by a diminution of mortality fromneoplasms other than cancer of the lung and pleura.
We should like to thank Professor R. V. Christie,Dr. R. Doll, Professor A. B. Hill, F.R.S., and ProfessorSir Ernest Kennaway, F.R.S,, for raising certain questionsfor our consideration and discussion, and the Registrar-General's staff for helping in tracing and checking theallocation of death certificates to the various diseasecategories.
In so far as one author is a member of the staff ofthe Chester Beatty Research Institute, this investigationreceived support from grants to the Chester BeattyResearch Institute, Institute of Cancer Research, RoyalCancer Hospital, from the British Empire Cancer Cam-paign, the Jane Coffin Childs Memorial Fund, and theAnna Fuller Fund.The Chief Medical Officer of the Ministry of Pensions
and National Insurance has given permission for thesefindings to be published.
REFERENCESBlond, K. (1954). Brit. med. J., 2, 303.Boyland, E., and Horning, E. S. (1949). Brit. J. Cancer, 3, 118.Case, R. A. M. (1953a). British Journal of Preventive and Social
Medicine, 7, 14.(1953b). Brit. J. industr. Med., 10, 114.and Hosker, M. E. (1954). British Journal ofPreventive and Social
Medicine, 8, 39.and Pearson, J. T. (In preparation). "Methods and Tables for
Comparative Composite Cohort Analysis: Neoplastic Diseases."Cramer, W. (1936). In "Reports of the Second International Congress
of Scientific and Spcial Campaign against Cancer", vol. 1, p. 441.Ligue national beige contre le cancer, Brussels.
Doll, R., and Hill, A. Bradford (1952). Brit. med. J., 2, 1271.- (1954). Ibid., 1, 1451.Douglas, C. G. (1923). In "History of the Great War. Medical
Services. Diseases of the War", vol. 2, p. 292. H.M.S.O., London.Heston, W. E. (1953a). Proc. Soc. exp. Biol (N. Y.), 82, 457.
(1953b). J. nat. Cancer Inst., 14, 131.Kennaway, N. M., and Kennaway, E. L. (1936). J. Hyg. (Camb.),36, 236.Lea, A. J. (1952). Thorax, 7, 305.Registrar-General (1933). "Decennial Supplement. Census ofEngland and Wales, 1921", Part 3, p. 8. H.M.S.O., London.- (1938). "Decennial Supplement. Census of England and Wales,
1931", Part 2a, Occupational Mortality. H.M.S.O., London.(1949). "Statistical Review of England and Wales, 1940-1945",
Text, vol. 1, p. 23. H.M.S.O., London.Thomas, C. Price (1955). Practitioner, 174, 298.Willis, R. A. (1953). "Pathology of Tumours", 2nd ed., p. 66.
Butterworth, London.
STATISTICAL APPENDIX
METHODS OF ANALYSIS AND DETAD RESULTS
Comparative composite cohort analysis, themethod that has been used in these studies, is a
technique for comparing some or all of the morbidityor mortality experience of a "closed" and definedpopulation with an expected experience calculatedfor that population at some standard rate. A"closed" population is one in which the whole ofthe life experience of each of its members, subsequent
to the entry of that member into the observationalfield, is of relevance to the analysis, regardless ofwhether or not the member has ceased to belong tothe particular defined class (e.g. environmental,occupational, or industrial) which was used incircumscribing the observational field when design-ing the survey. This concept is in contrast to the"open" population, such as is necessarily used in the
68
copyright. on 6 A
ugust 2018 by guest. Protected by
http://jech.bmj.com
/B
r J Prev S
oc Med: first published as 10.1136/jech.9.2.62 on 1 A
pril 1955. Dow
nloaded from

MUSTARD GAS POISONING, CHRONIC BRONCHITIS, AND LUNG CANCER
Registrar-Gener4's studies in occupational mor-tality (e.g. Registrar-General, 1938), where anestimate of the population in a stated environmentin a given year or series of years is used, but wherethe member must be allocated to that environmenton the death or sickness certificate for his experienceto be used. This allows members who enter theobservational field to leave it subsequently bychanging their allocated environment, and onlytheir life experience whilst still allocated to theenvironment which causes them to be classified inthe observational field of the survey is relevant tothe analysis.The essential nature of the technique has been
further discussed by Case and Hosker (1954), and aspecific example of a method of deriving a standardrate for male mortality from bladder, tumour inEngland and Wales is given by Case (1953a, b).From a practical viewpoint, the method requires
a statement of the years of life experienced atdifferent ages, since both morbidity and mortalityare highly age-specific, and these experiences mustbe calculated so that allowance is made for the dateto which the age experience refers, since contem-poraneous conditions also affect morbidity andmortality. Once the statement of the life experiencedifferentiated in this way is made, the morbidity ormortality to be expected under some definedstandard conditions can be calculated by applyingmorbidity or mortality rates calculated for the ageand date from data relating to the standard condi-tions. The sum of the expectation of experience overthe whole array then gives the mortality or morbidityexpected, and this can becompared with that observed.
In order to facilitate the study of environmentalfactors affecting neoplastic disease, Case andPearson (work in progress) are preparing Tables formortality experience in England and Wales from1911 onwards. These will be calculated with respectto 5-year age grouping, e.g. 35- 40- 45- etc., and5-year date grouping, e.g. 1911-, 1916-, 1921-.Thus the rate applicable to members of a cohortof men born in 1866-1869 will be found under 45-and 1911-, 50- and 1916-, and so on. TheseTables, calculated for each sex separately, will coverthe 5qX values of the Life Table, mortality rates fromall causes, and mortality rates for neoplastic diseaseunder 24 site-headings distinguishable since 1911.
In the present study, the mortality Tables formales in England and Wales for death from allcauses, death from "all neoplasms" (as defined inthe text), death from "cancer of the lung andpleura", 5qX Life Table values, and a speciallycomputed Table for deaths from "bronchitis, alltypes" were used.
Since the data to be studied contain a completestatement of mortality, the actual life experiencedifferentiated for age and date can be computedfairly accurately, and is therefore used whereapplicable.The calculation is intricate but of general interest.
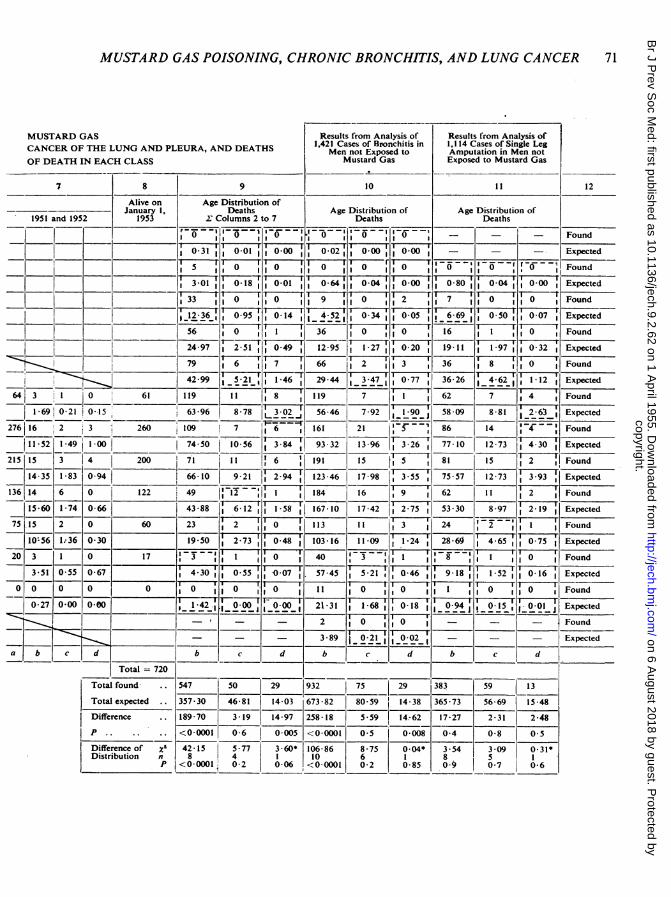
W% therefore give the details for the mustard gasseries in extenso in Columns 1 to 9 of AppendixTable A (overleaf) as a "worked example". Columns10 and 11 show the results of calculations made inthe same way for the bronchitis series and theamputation series respectively.The calculations may conveniently be arranged in
a "staircase" array (see Table A), so that a diagonalline traced from Column 2 to Column 7 will followa cohort of men born in the same quinquennium.This type of array has the advantage that a lateralsummation of Columns 2 to 7 gives the expectedage distribution of the deaths.Two methods may be used to calculate the life
experience in each cell. The first is the theoreticalattenuation, but in this case this is only used whenconsidering the expected mortality for all causes.The calculation is made by taking the figure in thea division of Column 2 and multiplying this by theappropriate, value of the LifeTable. Since Column2 relates only to one year, 1930, the result is dividedby 5, since the 5q- value refers to a 5-year period.This gives the number of deaths expected, and isentered in the b division. This number is subtractedfrom the figure in the a division, and the resulttransferred to the a division of Column 3, in the nexthighest age group. This process is repeated acrossthe whole of Table A, except that in Columns 3 to6 no division by 5 is required, and that in Column 7the division is by 2 5. A cross summation gives theage distribution expected, and the sum of this columngives the number of deaths expected. The observeddeaths are entered in the appropriate cells, andsummated similarly for comparison.The numbers of deaths from all causes, found and
expected, for each series studied, are shown in theb divisions ofTable A. The expected age distributioncalculated on this basis is shown in Column 9, butthe progressive departure of the theoretical attenua-tion from the factual attenuation render themunsuitable for use in the text Figure, although thefinal total is appropriate for consideration in respectof the mortality ratio.
If it were necessary to obtain the theoretical lifeexperience in each cell, this could be done by dividingthe expected number of deaths in each cell by theappropriate age-specific death rate from all causes.In the present studies the actual life experience canbe determined fairly accurately by multiplying the
69
copyright. on 6 A
ugust 2018 by guest. Protected by
http://jech.bmj.com
/B
r J Prev S
oc Med: first published as 10.1136/jech.9.2.62 on 1 A
pril 1955. Dow
nloaded from

70 R. A. M. CASE AND A. J. LEA
APPENDIX TABLE A
1,267 CASES OF MEN OF THE 1914-18 WAR WHO HAD BEEN POISONED BYCOMPARATIVE COMPOSITE COHORT ANALYSIS ARRAY TO ANALYSE FOR DEATHS FROM ALL CAUSES, DEATHS FROM
FROM NEOPLASMS OTHER THAN CANCER OF THE LUNG AND PLEURA, WITH AGE DISTRIBUTIONS
Column 1 2 3 4 5 6
Rank DateAge _ _ _ _
I 1930 1931- 1936- 1941- 1946-
2 25- 89 0 l°] -=^0i---0-- -l
388 1 0 0 89 4 0 03 30-
1-48 0-08 0-00 1-53 0-10 0-01
331 4 0 0 387 22 0 0 851 7 0 0
1-71 0-11 0-01 882 0691 0-10 183 0-15 0-03
2594 00 I 327 24 0 0 365122 0 0 78 9 0 10 __
1 1 82 0 16 0 01 10 08 0 99 0 14 10 81 1 14 0-27 2 26 0 22 0-07
6 150 I 0 0 258 25 I 303 19 3 2 343 29 2 2 69 5 0 2144 0-17 0-01 111-64j 1-44 0 23 13 46 1-58 0-40 13-71 1-66 0 63 2-74 0-36 0-19
46,0 0 _ 0 1149 10 I 0 233130 2 1 284 38 5 314 38 3 2
0-60 0.101 0-01 9-48 1-51 0-19 =,16 08 2-16 0-47 17 64j 2 32 0-79 18-47 2-48 1-414 2 0 0 46 6 0 ,0 139122 2 0 203 32 I 3 24631 2 0
0-08 0-01 0 00 4-191 0 -77 10 07 13-35 2-14 0- 37 221 251 2-81 0- 83 24-111 3 34 1-57
22 0 0 40 6- 0 0 117113 4 171 3 4 1
1 0 531 0 03 0-03 5 891 1-04 0-12 16.631 2- 79 0 57 28 70 3 52 1I 310 0 0 0 34 6 0 0 104129 6 1
10 65- __ _ _ _ _- 0-701 0_00 000 686 1-26 0-15 720-72 3-12 077
2______________________________________________-0-7 000 0-00 8-19 1 37 0-18
13 80- - - - - = = = = = = - _ - __-
14 85+ . - K.____________________
15(a b dd a db c d a b c d h C d a b c d
Total 1,267
a= men surviving to start of date periodb deaths from all causesc = deaths from neoplasms other than cancer of lung and pleurad deaths from cancer of lung and pleura* corrected for continuityDotted lines indicate cells combined for X2 test
copyright. on 6 A
ugust 2018 by guest. Protected by
http://jech.bmj.com
/B
r J Prev S
oc Med: first published as 10.1136/jech.9.2.62 on 1 A
pril 1955. Dow
nloaded from
MUSTARD GAS POISONING, CHRONIC BRONCHITIS, AND LUNG CANCER
MUSTARD GASCANCER OF THE LUNG AND PLEURA, AND DEATHSOF DEATH IN EACH CLASS
8 9
Results from Analysis of1,421 Cases of Bronchitis in
Men not Exposed toMustard Gas
10
Results from Analysis of1,1 14 Cases of Single LegAmputation in Men notExposed to Mustard Gas
I1I
Alive on Age Distribution of- ~~~~~~~~~January 1, Deaths Age Distribution of Age Distribution of
1951 and 1952 1953 2Z Columns 2 to 7 Deaths Deaths
ound
01 0-01 0-00 0-02; 000 - - - Expected
~~~~~50 10 0 '0 Found
________ - ~~~~~~~~3-010-18 0I 0 64 0 04 0-00 0 80 II0-04 0-00 Expected-. ff ~~~~~~~~~~~F1F-.~~~~~~~~~~~ T M--~33 10 10 1I 9 0 2 7 1 10 Found
_I2 0-95 0-14 4-52? 0 34 0-05 *6-69 0-50 0-07 Expected~~~~~~56 o 36'0 16 -0-
____ I.___ ___ _________ 24-97 2-5 3641-9 1'2 0-20 19-11 1-97j10-32gExpected79 6 66~~ 2 3~ 36 8 F7 Found
-I ~~~~~42-99 ~5-21- 1-6 2945 7 0-77 36-26 ,4 ~ 1-12 Epce
643 ~ 0 61 119 111 8 119 7 I 62 7 g4 Found
16 0-21 0-15 260 63-96 8-78 56.46 7-92 iLO9 58 09 8-81 12631 Expected276 116 2 3 20 I109 -~7 6 21___86 __14 :Found
1521-49 1-074-50 10-56 3-84 93-32 13-96 3 26 77-10 12-73 4-30 Expected
-1 15 3 4__ 200 71l it 6 191 15 f5 81 15 2 Found
14 35 1-83 0-94 66-10 9-21 2-94 123 46 17-98 35 7 7 1 3 3-_93 T
Expected-. ___ ______ _________I. 17-,.7-_ _136 14 6 0 122 49 I 184 16 9 62 1 1 12 1Found
15-60 1-74 0-66 j43-88 612 167-10 17-42 T,2 -75 530 8-97 2-19 Expected75 .15 2 0 60 23 27 71113 11 3 24 '2Fun
TI r~I10`56 1:36 0-30 19-50 2-73 0-48 103-16 11-09 1-4 28-69 4-65 0-75 Expected20 3 1 0 17 3 V 7 0 40 I~- Fi 1 1 ound)
I r v,- 1 1~~~~~~~~~~~~~-9 18 m-2 '3-51 0-55 0-67 4-30 0-55 -0-07 57-45 5-21 046 91wI15w01 xetd
0 0 0 0 0 r-i----- 0 '.:o 11 FiFI;2F O7 O Fund0-27 0-00 0-00 I...42 .... i .~ 21-31 1-68 0-1l8 109 q15l0 JExetd-. _ _ - _ _ _ _ _ _ _ -- - -_-. - ~~ ~~~~~~~~20 o j Found
- - - ~~~~~~~~3-89 jO-7l=rI0-02, - - - Expecteda b c d b d b c d b c d
Total 720
Total found 547 50 29 932 I75 2 8 9 1
Total expected --357-30 46-81 14-03 673-82 80-59 14-38 365-73 56-69 15-48
Difference 189-70 3-19 14-97 258-18 5-59 14--62 17-27 2-31 2-48
P - - <0-0001 0-6 0-005* <0-0001 0-5 0-008 0-4 0-8 0-5
Difference of xiDistribution n
P
42-15 15-77
8 4
1<0-0001 0-2
3-60* 106-86 8-75 0-04* 3-54 3-09 0-31*10 6 1 8 5
0-06 <0-0001 0-2 0-85 090 0-7 0-6
71
12
copyright. on 6 A
ugust 2018 by guest. Protected by
http://jech.bmj.com
/B
r J Prev S
oc Med: first published as 10.1136/jech.9.2.62 on 1 A
pril 1955. Dow
nloaded from

R. A. M. CASE AND A. J. LEA
APPENDIX TABLE BNUMBER AND AGE DISTRIBUTION OF DEATHS FROM ALL CAUSES CALCULATED FROM ACTUAL NUMBER OF YEARS
LIVED AT EACH AGE PERIOD
Age Period Mor- DifferenceSource of Data _ tality of
<35 35- 40 45- S0- S5 60- 65- 70 75+ *Total Ratio Distribution
Mustard Found 5 33 56 79 119 109 71 49 23 3 547 x2 = 32-86Gas .I . I -173 n=19
Expected 3-31 12-13 23-87 14027 57-78 64-28| 5516 36-66 17 68 4;28 315-42 P < 0-001
Found 0 9 '_ 36 66 119 161 1191 184 j113 53 932 z2-S3-13Series Bronchitis . l 184 n= 8
Expected :0 67 4.23: 12 47 27-46 5187 81-34'100-45 97 60 68 59 61-92 506-60 P <0*0001
Found O 7 _ 16 36 62 86 |81 |62 24 9 383 Xs = 5-24Amputation l _ _103 n = 8
Expected 0*80 668 1927 36-38 |S8 291 76-881 7586 | 53*291 29-63 13*16 370*26 P =0O7
Dotted line indicates cells combined for X' test.
number of survivors of each column by the numberof years that the column refers to, and then addingthe actual number of years lived in the period bythose who have died on the assumption that eachdeath took place in the middle of the year. Thus aperson dying in 1943 would be regarded as havinglived 2 - 5 years in the period 194144.The number of deaths expected for each disease
classification to be considered can then be deter-mined by multiplying the years of life lived by theappropriate age specific death rate for that diseaseclassification. The expectations for cancer of thelung and pleura and for neoplasms other thancancer of the lung and pleura with the figures actuallyfound, are shown in the d and c divisions of Tables
A and B. The age distributions, being calculatedfrom the factual attenuation, are suitable for use inthe text Figure.The expected age distribution for deaths from all
causes, based on the factual attenuation, has beenseparately calculated for use in that Figure, and isshown in Appendix Table B.The significance of differences of totals has been
assessed by the approximation used by the Registrar-General (1949) of regarding the square root of thenumber of deaths found as the standard error.The P value is then determined from Tables of thenormal curve from the observed difference betweenthe expectation and the number found over thesquare root of the number found.
72
copyright. on 6 A
ugust 2018 by guest. Protected by
http://jech.bmj.com
/B
r J Prev S
oc Med: first published as 10.1136/jech.9.2.62 on 1 A
pril 1955. Dow
nloaded from


![Detecting Carbon Monoxide Poisoning Detecting Carbon ...2].pdf · Detecting Carbon Monoxide Poisoning Detecting Carbon Monoxide Poisoning. Detecting Carbon Monoxide Poisoning C arbon](https://static.fdocuments.in/doc/165x107/5f551747b859172cd56bb119/detecting-carbon-monoxide-poisoning-detecting-carbon-2pdf-detecting-carbon.jpg)