MUNICIPALITY OF SHKODRA - FLAGflag-al.org/Flag-AL_ORG_files/strategic plans/Shkodra Eng... ·...
176
Transcript of MUNICIPALITY OF SHKODRA - FLAGflag-al.org/Flag-AL_ORG_files/strategic plans/Shkodra Eng... ·...
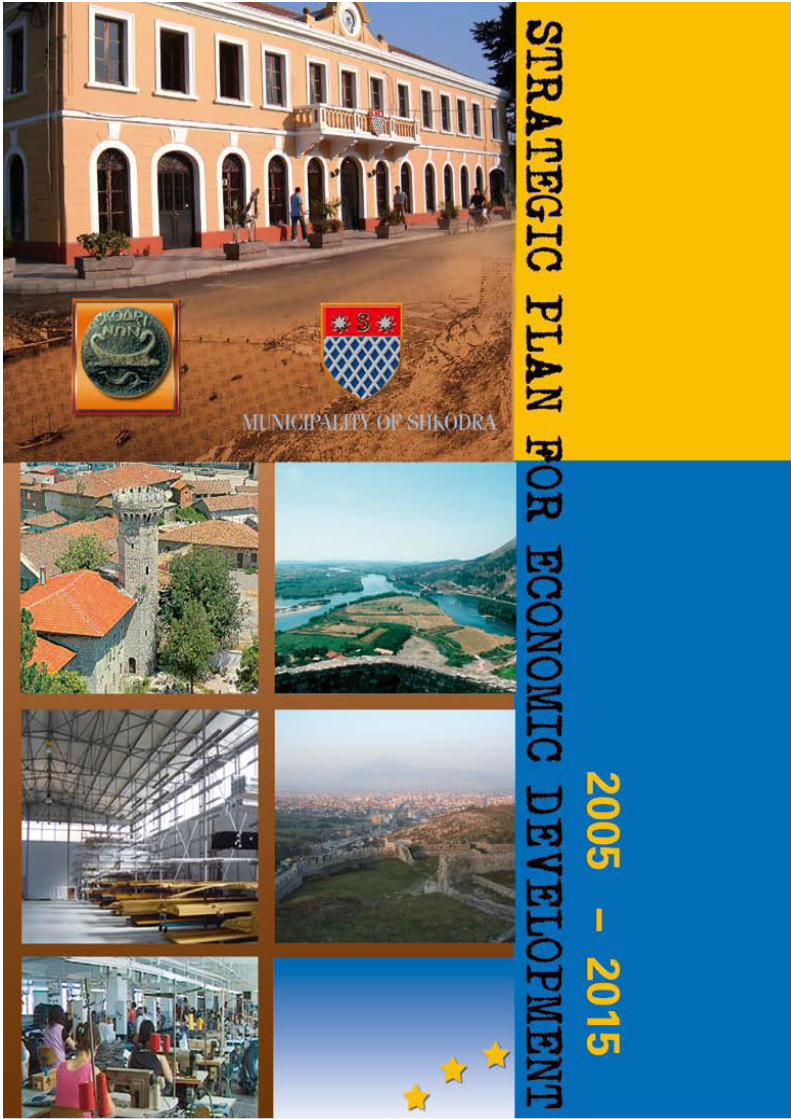


MUNICIPALITY OF SHKODRAStrategic Plan for Economic Development2005 – 2015
SHKODRA
Tirana 2006
2
MU
NIC
IP
AL
IT
Y o
f S
HK
OD
RA
This strategic plan has been written by large stakeholdergroups from the Municipality of Shkodra with advice andguidance from the World Bank Group, the Open SocietyInstitute and FLAG. The World Bank Group, Open SocietyInstitute and FLAG do not accept any liability for theaccuracy or content of the strategy; they do howevercongratulate the Municipality for the quality of their work.
Cover design: Kilica GraphicsEditors: Artan Rroji and Dr Iain WilsonPrinting house: Maluka shpk
Copyright © 2006 Municipality of Shkodra

3
Table of Contents ........................................................................................................page
Acronyms..............................................................................................................................5
I. Introduction ................................................................................................................6
II. Preamble......................................................................................................................7
III. Importance of SPLED for our community...............................................................8
IV. Strategic Plan ..............................................................................................................9
Philosophy behind Strategic Plan...............................................................................10
V. Development of Strategic Plan ................................................................................11
Guiding principles ......................................................................................................11
Methodology...............................................................................................................11
Planning process .........................................................................................................12
Organisational approach to Plan development ...........................................................13
Participation and consultation ....................................................................................13
Summary of assessment of local economy.................................................................17
Perceptions of businesses ...........................................................................................18
Vision and Goals ........................................................................................................19
Expected benefits........................................................................................................20
Implementation...........................................................................................................22
Organisational approach to Plan implementation.......................................................23
Financing of Strategic Plan.........................................................................................24
VI. Overview of Shkodra community ...........................................................................25
Geography and topography ........................................................................................25
Demography ...............................................................................................................25
Municipal government................................................................................................28
VII. Economic profile of Shkodra...................................................................................32
Natural resources of Shkodra region ..........................................................................32
Tourism.......................................................................................................................34
Labour force ...............................................................................................................35
Private businesses in Shkodra.....................................................................................37
Services and infrastructure .........................................................................................44
VIII. Documentation of the Strategic Plan ......................................................................48
a. SWOT, consolidated analysis................................................................................49
b. Matrix of Plan goals, objectives, programmes and projects..................................51

4
MU
NIC
IP
AL
IT
Y o
f S
HK
OD
RA
c. Implementation Matrix of the Strategic Plan........................................................ 58
e. Project fiches......................................................................................................... 76
Annex 1: Acronyms used in the Implementation Matrix............................................ 164
Annex 2: Report on ‘Survey on Locally Enabling Business Environment’............... 165
Annex 3: Methodology used in project prioritisation.................................................. 169
Annex 4: Group projects ................................................................................................ 172

5
Acronyms
DELTA Developing Enterprise Locally through Techniques and Alliances
EDCM Economic Development Commission of the Municipality
EDDM Economic Development Department of the Municipality
FLAG Foundation for Local Autonomy and Governance
LGI Local Government and Public Services Reform Initiative (part of the Open Society
Institute of the SOROS Foundation)
SMEs Small and Medium Enterprises
SPLED Strategic Plan for Local Economic Development
SWOT Strengths, Weaknesses, Opportunities and Threats
WB World Bank
6
MU
NIC
IP
AL
IT
Y o
f S
HK
OD
RA
I. Introduction
A strategy for the Local Economic Development (LED) of various municipalities in Albania has
been developed within the framework of the programme ‘Developing Enterprise Locally through
Techniques and Alliances’ (DELTA). It was implemented during 2004 and 2005 and supported both
financially and technically by the World Bank (WB; Local Economic Development Department) and
the Institute for an Open Society (SOROS), through the Local Government and Public Services
Reform Initiative, LGI, Hungary. A strategy for, and in partnership with, each of the municipalities of
Berat, Durres, Korça, Lezha and Shkodra was prepared with the collaboration of the Albanian
organisation Foundation for Local Autonomy and Governance (FLAG). The goal of the programme
was, and continues to be, to develop strategic action plans that will have an impact in the restructuring
of local economic development policies at the municipal level, especially those relating to the
development of the private sector in Albania.
The methodology employed in DELTA promotes improvement of an environment that supports and
facilitates the development of business and strengthens capacities and collaboration of local authorities
with community groups, in general, and local businesses, in particular, for the development of a
common Vision and a Strategic Plan for Local Economic Development (SPLED).
The Strategic Plan developed by each municipality will serve the purpose of institutionalising private-
public partnerships and developing local programmes and projects that will lead towards the
preparation of an agenda for sustainable development of the municipality. Through strengthening
institutions, infrastructure and policies that support private enterprises, the projects outlined in each
SPLED will help develop and strengthen Small and Medium Enterprises (SMEs) and increase local
employment possibilities while at the same time increase revenues for the municipal budget.
The framework of DELTA enabled local capacities to be developed through a periodic review of the
process of LED planning in order to provide for its sustainable institutionalisation in the respective
local government.

7
II. Preamble
The change of the political system in Albania, the transformation of the country’s economy, from a
highly centralised to a free market version, and the opening up of its markets and resources to those
elsewhere in the world, especially those in Europe, has introduced a new challenge for its communities,
particularly its businesses and local governments, namely the challenge of building a local economy
and business structure capable of adapting to world markets and to competition.
During Albania’s transition, the structure of its businesses changed and continues to change at both
the national and local level. Before transition, large public companies dominated the market, while
now it is dominated by SMEs. The initiation of the decentralisation process, allowing local
governments to have a greater influence in the business environment, has naturally inclined the
interests of SMEs towards local government policies. Every day, more responsibilities regarding
provision of services and creation of regulations related to the business environment are being
transferred from central to local government.
This economic transformation has brought to the table of our Municipality a new role: to lead the
process of stimulating regeneration and growth of the economy and thus provide continuous
improvement in the quality of life of our community, through improving the local business environment
with regard to the economy and the competitiveness of businesses.
Given the current situation, it is becoming more and more clear to our community that great efforts
have to be taken in order to define the most important directions needed for successful development
and marketing of our resources in order to create competitive advantages that will sustain the existing
businesses and attract new ones. This is the only way for our community to use its resources intelligently
in order to make its economic system successful and sustainable.
Of significance in the development of this whole process has been the direct engagement of the
municipality in LED planning, in which it played a leading, coordinative and promotional role. The
process has been supported further through our city’s public institutions, its business community and
civic society, and through other partners, with a common effort that has enabled a common vision to
be reached and the most important directions defined for the creation of a comfortable environment
for LED, and one that promotes businesses and increases employment.
8
MU
NIC
IP
AL
IT
Y o
f S
HK
OD
RA
III. Importance of SPLED for our community
The initiative of our municipality to develop a SPLED was carried out within the framework of
efforts taken in exercising its legal function as a promoter and supporter of economic development
within the jurisdiction of its territory, aiming to use in the most effective and efficient way possible
its human, natural, social, institutional, financial and physical resources, in order to create a friendly
environment for residents, businesses and visitors.
The transition process has forced substantial changes to be made in the way the city adapts to the
trends and requirements of a successful LED. At the same time, the diversification of the local
economy, required for it to fit the demands of the free market, and its development dynamics call for
adjustments and re-evaluation of the relationship that exists between municipality and community,
for building working systems and collaboration structures that will help in the gradual rehabilitation
and continuous consolidation of a sustainable, healthy economy in our city.
In this new situation, in which our municipality is open to international and national competition for
attracting businesses and creating jobs, it is imperative that efforts are made to define future directions,
focusing on and managing well the available resources.
Our city government has previously made efforts to find and convince investors to enter our community,
but these have often been sporadic and not well-coordinated with other local, or sometimes more
distant, factors. In addition, the physical improvement of the local environment, quality of services
and financial incentives required to ensure that existing businesses continue and new businesses
seek to operate in our city, has been inadequate, because of the limited legal authority and financial
capacities of our municipality.
Regardless of these difficulties, the role it is playing has always been increasing in strength, initially
from an observer of local economic development and business performance into an actor actively
involved in creating incentives and spaces in direct support of business and as a main generator of
economic growth and employment. The experience of the Strategic Plan development has shown us
that only local government, as the authority in whom the political and non-political interests of
different groups in society come together, can play the major important role in stimulating economic
development, through adopting a new mentality and work practices and through maintaining
relationships with the actors and organisations that operate in its community.
Our community needs a wise local government, functional partnerships and civic pride, and we
believe that the present strategy has laid the foundations for these.
9
IV. Strategic Plan
This is the first LED Strategic Plan that has been developed for our municipality and it represents an
effort made to change the quality and way of governing and the decision-making process.
Effective use of the economic advantages possessed by our community and attraction of private
investors depend very much on the quality of local governance, the services provided and quality of
the local policies that are developed and implemented. These have an impact upon the infrastructure
of the services available for businesses, such as electricity and water supplies, transportation,
telecommunications, waste management and urban planning. The fact that most businesses operating
in our municipality are micro-, small- or medium-sized, which depend greatly upon the quality of
services offered by the local government, makes even more important the latter’s role in creating a
friendly environment that fosters the development of business.
This Strategic Plan aims to correct the factors that have had up to now a negative impact on the
economic development of the municipality and on the quality of local governance, and by doing so to
reduce the barriers and risks of doing business here. The planning process helped in assessing these
factors, and through this procedure an active review of the economic base and development factors
of the municipality was achieved, leading to a better understanding of the opportunities for and
obstacles to creating economic growth and attracting investors. During this process, our partners
evaluated the local strengths, weaknesses, opportunities and threats (SWOT analysis), the key factors
that need to be addressed in order to coordinate sustainable economic development.
During the formulation of the Strategic Plan, the Planning Commission reviewed the available human
and natural resources, the economic status of the city and its surrounding areas, its cultural and
historical heritage and comparative advantages, and the desires and needs of the community.
The Law on ‘The Organisation and Functioning of Local Governments’, No. 8652, dated 31.07.2000,
Article 10/III, states that ‘… municipalities shall assume responsibilities for the following exclusive
functions of Local Economic development … that of the preparation of programmes for local economic
development’, making the development of a strategic plan a legal obligation for the municipality.
The present plan was prepared over a period of 16 months. We understand that the desired
improvements and changes cannot happen within a short time. However, the leadership of our
municipality, together with the public and private actors, will be devoted to its implementation in the
medium term and the making available of adequate resources for it to happen as quickly as possible,
as this plan is very likely to succeed in achieving its goals.
The Strategic Plan was approved by Municipal Council through Act No. 60 dated 7th July 2005.

10
MU
NIC
IP
AL
IT
Y o
f S
HK
OD
RA
Philosophy behind Strategic Plan
The SPLED of our municipality aims to outline the vision and strategic goals the city has for its
development and to guide and consolidate the efforts made by the municipality and community to
develop an environment that is both supportive and favourable for the development of business here.
Our SPLED has been designed to address the needs of both our leaders and our community to improve
the quality and diversity of jobs that are available and to improve the quality of life for our citizens
and of the environment for the development of business.
The Municipality and all the actors involved in the development process began implementing their
vision by focusing on the primary philosophical goals that lie behind the development of our SPLED:
• Provide for the community and local government a guiding document for determination of
future directions of economic growth;
• Provide an example of a strategic decision-making process that incorporates collaboration
among local politicians and the business community;
• Facilitate the efforts for collaboration among public and private partners, for a coordinated
development of the municipality;
• Establish a decision-making framework for issues such as public services, infrastructure and
collaboration with business;
• Establish a new experience and install a culture of planning economic development;
• Create an environment favourable for development and growth of existing businesses, because
we believe that in a community where businesses are dissatisfied there is little chance that
new businesses will be created;
• Influence the financial and technical support policies of central government and donating
agencies;
• Give our municipality the appropriate leadership authority required for planning economic
development;
• Enable transparent and effective local governance that responds professionally to the needs
and requirements of residents and visitors.
11
V. Development of Strategic Plan
The development of the Strategic Plan was completed using the methodology applied by the World
Bank. In using a holistic strategic planning process it is important to achieve an inclusive agreement
where economic, social and environmental needs are balanced.
Guiding principles
The principles that guided the Municipality and the Planning Commission during the formulation of
the Strategic Plan include the following:
• Economic success is balanced with quality of life;
• Economic growth is balanced with social and environmental requirements;
• The municipality is a key factor in improving the local investment climate;
• Collaboration among municipal government, businesses and civic society is a key element
in sustaining economic progress;
• Strategic planning is a holistic integrated process, institutionalised in the municipality;
• SPLED determines the main directions for economic development, but doesn’t control it;
• Improvement of the entire business environment is targeted, not simply individual businesses;
• Protection and support for existing businesses is as important as attraction of new businesses,
as they act as a very good marketing tool for promoting the business climate;
• Development of employment using internal resources is more important than creating
employment through external factors;
• Establishing Public-Private partnerships in decision-making and in improving the local
economy is important;
• The private sector is the main generator of economic development.
Methodology
Our municipal government considers SPLED as the best and most systematic method available for
management of change, for ensuring consensus of the community and for generating a common
vision for a better economic future. The strategic planning process enabled the coordination of efforts
and resources that will lead towards improvement of the economic situation and, consequently, the
12
MU
NIC
IP
AL
IT
Y o
f S
HK
OD
RA
establishment of a framework that aims to create a healthy well-balanced environment for the economy
and an improved quality of life for the citizens. Although outlined here very simply, this methodology
was found to be very complex given the amount of effort and decision making required.
The strategic planning process was accompanied by capacity building and facilitation activities. For
capacity building purposes, DELTA organised a study tour to Hungary where three workshops were
held on the following topics:
• Stages and techniques for development of SPLED;
• Institutional structure for development, implementation and monitoring of SPLED in
partnership with the community;
• Introduction of regional best practices in SPLED;
• Methodology of development and assigning of priorities to projects.
Planning process
The foundation of an effective strategic planning process rests upon a sound understanding of the
most important issues that face the community. The issue of economic development could be outlined
as one of problems to be solved, needs to be addressed and capabilities to be employed. The process
applied here enabled the unification of the opinions and choices of local government with those of
businesses and other representative agencies.
The planning process was structured to be undertaken in five phases:
1. Organisation of the efforts;
2. Evaluation of the competitiveness of the local economy;
3. Development of the strategy;
4. Implementation of the strategy;
5. Revision of the strategy.
Over the planning process period a number of consultations, evaluations and common decision-
making events relating to the presentation and priority of the key issues for economic development
were considered.
At moment of writing, the municipality has completed the first three phases and has now entered the
fourth.

13
Organisational approach to Plan development
The organisational approach that was applied allowed in the decision-making process the direct and
institutionalised participation of a wide group of people representing the community along with the
mayor, members of city council and the municipal staff.
The participation was institutionalised and structured through the LED Planning Commission
established and headed by the Mayor. The role of the Commission was to draft and review the
Strategic Plan and this responsibility continues with supervision and evaluation of the plan’s
implementation. The structure of the Commission was laid out in such a way as to allow the grouping
of the member base according to field of development and interest.
A crucial element in this structure was and remains the Core Team, headed by the Economic
Development Department of the Municipality (EDDM) and in which the business community had
one representative. The Core Team played a crucial role in coordinating the work of the commission
members with the DELTA partners and other local and central agencies and organisations interested
in and committed to the development of the municipality.
The four people on the Core Team each headed a team established to obtain direct input of the
community in the LED planning process, as follows:
• Civic Society Team, led by Ridvan Sokoli
• Business Team, led by Simon Prendi
• Public Agencies Team, led by Ahmet Omi
• Community Team, led by Frederik Shiroka
Participation and consultation
Formulation of the Strategic Plan document was the main aim of the Municipality, but it aimed to
involve in the planning process other actors who would have a decisive role in developing the strategy.
It would have been impossible for our local government to carry out the whole process alone. Therefore,
it was necessary also to involve the expertise of other people from the community who could bring to
the process a wide range of experiences, ensuring that the most able individuals in the community
had the chance to present their opinions and preferences to address the most critical issues involved
in local growth and economic development.
In all, 143 people were directly involved in the planning process, including representatives of local
government, the business community, banks, educational institutions, including the university, public

14
MU
NIC
IP
AL
IT
Y o
f S
HK
OD
RA
Eco
no
mic
Dev
elo
pm
ent
Co
mm
issi
on
of
the
Mu
nic
ipali
ty (
ED
CM
) of
Sh
ko
dra
Hea
d o
f C
om
mis
sion
Ma
yo
r
Mr
Art
an
Ha
xh
i
Mem
ber
s o
f M
un
icip
al
Co
un
cil
Dep
uty
Mayors
V
olt
ana A
dem
i
Rudolf
Rasha
Co
re T
eam
R
idv
an
So
ko
li
Sim
on
Pre
nd
i
Fre
deri
k S
hir
oka
Ah
met
Om
i
Wo
rkin
g T
eam
s
Eco
no
mic
Dev
elo
pm
ent
Dep
art
men
t
of
Mu
nic
ipa
lity
(ED
DM
)
Bu
sin
ess
Tea
m
Co
mm
un
ity T
eam
C
ivic
So
ciet
y T
eam
P
ub
lic
Agen
cies
Tea
m

15
enterprises, NGOs and other individuals acknowledged in the community for their levels of expertise
and contribution to society.
The municipality made a great effort to keep engaged and focused throughout the process this large
group of actors, who voluntarily gave priceless assistance in formulating the Strategic Plan draft.
As a result of this inclusiveness, the direct involvement of people outside of local government who
participated in the process gave full local ownership to the Strategic Plan.
List of participants:
Public Agencies Team
Ferid Hoti, Parliamentarian
Astrit Bushati, Parliamentarian
Mahir Hoti, Rector of Shkodra University
Tonin Gjuraj, Municipal Council
Myzafer Kraja, Directorate of Food and
Agriculture
Astrit Beci, Directorate of Public Healthcare
Maxhid Cungu, Marubi Museum and
Photograph Exhibition
Elnar Dervishi, Municipality
Teuta Haxhi, Municipality
Vehbi Gruda, Municipality
Afrida Damnori, Regional Council
Bardh Shllaku, Prefecture
Merita Kazazi, Regional Council
Fatmir Tepelia, Regional Council
Engjell Gjondrekaj, City Water Supply
Enterprise
Arben Haveri, Chamber of Commerce
Agron Ramadani, Roads and Drains Enterprise
Ismet Hoxha, Loro Boriçi Football Club
Gëzim Mema, Multi-sports Club
Sadetin Taipi, Marin Barleti Library
Mensur Bushati, Public Enterprises Service
Office
Agron Dizdari, Migjeni Theatre
Surri Rregjimi, Albtelecom
Lindita Shiroka, Post Office
Gjokë Miri, Directorate of Taxes and Charges
Fiqiret Bushati, Directorate of Primary Health
Service
Osman Dashi, Regional Directorate of Stradal,
Public Transportation
Violeta Staka, Directorate of Public Insurance
Bujar Golemi, KESH
Viktor Jubani, Regional Environment Agency
Eqerem Dushi, Directorate of Food and
Agriculture in Shkodra
Munire Mandia, Directorate of Food and
Agriculture in Shkodra
Engjëll Çeka, Shkodra Branch of Customs
Sokol Haliti, Regional Employment Directorate
Suela Mema, Property Registration Office
Nathan Borgford-Parnel, PCV-USA
Florian Borshi, Cleaning Enterprise
Xhelal Smajli, Municipality
Marije Duoda, Municipality
Elena Zorba, Municipality
Nexhat Grezda, Municipality
Alfred Luleta, Municipality
Kujtim Domnori, Municipality
Valbona Qehaja, Municipality
Ludovik Vuka, Municipality
Alket Kadrija, Municipality
Eva Poja, Municipality
Andi Cungeli, Municipality
Behar Fejza, Municipality
Ledia Dushi, Municipality
Ymer Vizi, Municipality

16
MU
NIC
IP
AL
IT
Y o
f S
HK
OD
RA
Bepin Kurti, Municipality
Nazmi Berhani, Albtelekom
Skender Halili, Greening Enterprise
Agron Shima, Radio Shkodra
Berti Stoja, City Water Supply Enterprise
Kujtim Alia, Children’s Culture Centre
Besim Dyca, Municipality
Gjon Nika, Municipality
Hare Bilal, Municipality
Tahir Sadiku, Directorate of Primary Health
Service
Osman Deltina, City Water Supply Enterprise
Reshat Zaganjori, Children’s Culture Centre
Zija Vukaj, Shejnaze Juka School
Xhemal Shqau, City Cleaning Enterprise
Business Team
Sabri Bushati, City Council
Musa Heta, City Council
Edlira Tukaj, University of Shkodra
Olsi Kabashi, Municipality
Pjeter Kakia, Dafinor Ltd
Shkelqim Kopliku, Progres-Metal G.
Gjovalin Guli, G&S Ltd.
Fehmi Golemi, Green Shoe Ltd.
Petrit Stefa, Public Transportation Company
Agron Çuliqi, Cable factory
Fatmir Lishi, Sigal Insurance
Zef Gjini, Gjini Ltd.
Ilir Shurdha, Ilira Ltd.
Sokol Hoxha, Inform Shkodra Travel
Tish Martini, Western Union Ltd.
Hedi Teli, Casual Ltd.
Mehdi Shabani, Construction company
Senida Kruja, Pro-Credit Bank
Lirije Vorfa, Raiffeisen Bank
Artur Luka, Tirana Bank
Qemal Sylja, United Albanian Bank
Anton Leka, Chamber of Commerce
Sadije Bushati, University of Shkodra
Arjeta Troshani, University of Shkodra
Emirjeta Bejleri, University of Shkodra
Brilanda Bushati, University of Shkodra
Julinda Sokoli, University of Shkodra
Drita Kruja, University of Shkodra
Adem Bekteshi, University of Shkodra
Ylber Berhani, Commercial Bank
Civic Society Team
Ardita Boriçi, University of Shkodra
Blerta Spahia, University of Shkodra
Zemaida Mozali, Municipality
Angjelina Shllaku, Municipality
Shpetim Quku, GTZ
Gjon Shllaku, Preng Jakova Association
Filip Guraziu, MESHBUSH
Gjenarin Shantoja, Regional Development
Agency
Terezina Hila, OXFAM
Anila Trebicka, Women in Development
Ridvan Troshani, TEULEDA
Alma Kurti, ASDI
Luigj Mila, Peace and Justice
Kastriot Faci, The Door
Rikard Malaj, The Door
Rasim Suma, Shkodra Association for
Protection of Fishery Resources
Merzuk Hoxha, Association of Shkodra
Hygienists
Filip Vila, European Children’s Trust
Zenepe Dibra, Shkodra Intellectual Women
Diana Bejko, REC Shkodra
Andi Cekaj, Albanian Red Cross, Shkodra
Antoneta Pero, Centre for Handicapped People
Ferid Lluja, Riza Pasha Society
Aldo Ferreti, COOP
Vildan Tufi, Sports for All
Aleks Dushi, AFFD
Maranaj Marku, MALTESER
Xhabir Mehmeti, Hunters’ Association
Shaqir Ramadani, Hunters’ Association
Migena Pengili, REC Shkodra

17
Community Team
Ahmet Bushati, Former Chairman, City Council
Vili Kamzi, Historian
Sherafet Kruja, Economist
Agustin Jubani, Economist
Karlo Kamsi, Hydrologist
Isa Alibali, Culture specialist
Fatos Gjyrezi, City Council
Summary of assessment of local economy
The current condition of the local economy in Shkodra was subject to a SWOT (Strengths, Weaknesses,
Opportunities and Threats) analysis, which considered the basic economic and social data and the
local views expressed in a business survey and those of the Planning Commission.
The data gathered included statistics and information relating to the local natural, human and financial
resources, the structure of the economy and businesses, level and structure of employment and
education and qualifications of the work force.
During the development of the SWOT analysis, the Planning Commission included a sector analysis
carried out by the working teams. SWOT analysis was used as the base platform for the development of
the Strategic Plan. Analysis of the local situation was continued by the Planning Commission members,
which identified the main economic growth advantages and challenges facing our community.
The information database was arranged into five sections: demography, business, culture and sports,
infrastructure and environment, as follows:
DEMOGRAPHY
• Population
• Education
• Employment
• Social care
• Shelter
• Healthcare
BUSINESS
• Business analysis
• Questionnaire database
• Imports
• Tourism
• Business training
projects
INFRASTRUCTURE
• Urban roads
• Water supply
• Construction permits
• Urban studies
• Electricity supply
• Telecommunications
ENVIRONMENT
• Air quality
• Water resources
• Environment conditions
• Shkodra Lake
• Greening of city
• Cleaning of city
CULTURE & SPORTS
• Culture and Sports
institutions
• Infrastructure of
institutions
• Activities
• Projects
Eduard Grishaj, City Council
Qamil Gjyrezi, City Council
Dashamir Dini, City Council
Anton Gurakuqi, Physician
Merita Dibra, Municipality
Anol Dedja, Municipality
Artan Kolnikaj, Lawyer
18
MU
NIC
IP
AL
IT
Y o
f S
HK
OD
RA
Five meetings relating to the SWOT analysis were held in May 2004, one for each of the sections
referred to above, while a further additional meeting was subsequently held to undertake an overall
comprehensive SWOT analysis.
The main findings of the analysis were as follows:
Main advantages
• Geographical position: main administrative and business centre in North Albania, and close
to a national border;
• Easy access into national and international transportation network;
• Existence of unique natural resources and large water resources;
• Continuous demographic growth and a young work force;
• Space for development of business parks.
Main challenges
• Lack of favourable climate and image to attract businesses;
• Low standard of living;
• Lack of diversified economy and existence of outdated technology;
• Local businesses have limited connections to national and international markets;
• Poor urban infrastructure and poor quality public services;
• Economy that provides insufficient quality and diversity of goods and services.
Perceptions of businesses
Local governments have a mandate to promote the development of local SMEs. However, this mandate
is considered by the private sector to be legally restrictive, especially with regard to the provision of
resources to undertake business activities.
To investigate this issue further and to understand the concerns of local businesses in more detail a
survey was carried out in the city. The goal of the survey was to collect information and gather the
views of the business community on the local economic situation, the prospects of doing business
here, the conditions and regulations that affect the growth of local businesses, the policies and practices
that hinder the growth of existing businesses and the demands and needs of the community for an
improvement in the business environment.

19
The Business Environment survey was carried out in March and April 2004 and 79 businesses from
different categories participated.
The main perception of businesses is that local governments do not have the appropriate means or
authority to assist the development of SMEs. This perception is enhanced by lack of communication
and poor dialogue between local government and business.
Businessmen in Shkodra take a softer view on this issue than do businessmen elsewhere in Albania,
though they think discussions with local authorities have often been overly theoretical and not followed
up by concrete action (OECD 2003: Albania – Enterprise Policy Performance Assessment).
During discussions, business people expressed the desire for more financial resources to be made
available for local authorities to increase their capacity and possibilities to promote economic
development in Shkodra.
Inclusion of the opinions of local businesses in the formulation of the Strategic Plan was an important
step in initiating the decision-making process. Through this step the opinions of a group of people
that have the biggest influence on the economic growth of the municipality was considered.
Vision and Goals
Vision
The purpose of generating a vision for our local economic development was to enable our community
to articulate where it wants to be in the future and to choose the path it would like to follow to get
there. The vision will provide for the citizens and local government a clear idea of what has to be
done and how to concentrate their energies and resources.
The vision was developed by the Economic Planning Commission (EDCM), after consulting different
segments of the community and after it had been presented publicly through the local media. The aim
was to generate a vision that could be developed and accepted by as many actors and interest groups as
possible, and which would provide a thorough description of the preferred economic future of our city.
A vision in this context is an ideal, which has its roots in the natural, geographic, economic, historical
and cultural reality of the region. It aims to capture the expectations and aspirations of a community,
and define a clear direction for the development of its city. We believe that in our case the vision
summarises realistically the desires and capacities of our community. We aim to share this vision
continually with various groups from our community, so that it becomes widely known and accepted
and thus becomes a guide in making the ideal a reality.
20
MU
NIC
IP
AL
IT
Y o
f S
HK
OD
RA
Our vision will be re-evaluated by the community, including the decision-makers in local government,
in order for it to reflect on any necessary changes, new desires and circumstances and recent
evaluations.
Goals
Determination of LED goals helps us to take decisions about the ways and means of achieving the
changes we need. Even though some of the goals and actions required are not directly related to
creating jobs or to attracting new businesses, the future of our community is based on sound foundations
such as level of education and quality of life, city infrastructure and municipal services. In our view,
businesses do not develop and flourish in and are not attracted to communities that do not offer
adequate levels and quality of infrastructure and services required by a healthy business environment.
In order to achieve its LED goals, our city is focused on accessing its natural and human resources.
In order to develop the goals, the Planning Commission considered the opportunities and threats
facing the municipality, its history of economical development and that of the region.
LED goals express the main directions in which the development of the municipality will follow, and
are listed on the next page according to importance to LED and to the creation of a favourable
environment. They are developed through careful analysis of the vision and deal with issues crucial
to the development of the city.
Expected benefits
The benefits expected as a result of the implementation of our Strategic Plan are multiple, but the
most important are the following:
• Provision of guidance to the municipal council and administration during the annual and
mid-term budget preparation process, allowing for focus on the implementation of the projects
included the SPLED;
• Focus applied to the human and financial resources available in the areas identified,
maximizing the benefits and making it possible to achieve the goals and objectives of the
SPLED;
• Strengthened sustainable partnership in decision-making, with co-financing provided by local
government and the business community;
• Increase in capacities of the municipal administration, especially of the EDDM;
• Coordination of activities of organisations and agencies responsible for implementation of
different parts of the SPLED;

21
Go
al
1:
Sh
ko
dra
wit
h a
n a
ttra
cti
ve l
ocal
eco
no
my
an
d d
yn
am
ic b
usin
ess e
nv
iro
nm
en
t, w
here
su
pp
ort
an
d e
nco
ura
gem
en
t is
pro
vid
ed
to
the p
rod
ucti
on
, tr
ad
e,
tou
rism
an
d s
erv
ice
bu
sin
esses o
pera
tin
g s
uccessfu
lly
wit
hin
th
e
reg
ion
al
mark
ets
Go
al
2:
Dev
elo
pm
en
t an
d p
reserv
ati
on
of
the c
ult
ura
l, h
isto
rical
an
d a
rtis
tic
trad
itio
ns a
nd
valu
es o
f S
hk
od
ra
an
d t
heir
pro
mo
tio
n t
o t
he b
en
efi
t
of
tou
rism
dev
elo
pm
en
t
Go
al
3:
Th
e c
ity
as a
hig
her
ed
ucati
on
cen
tre f
or
No
rth
Alb
an
ia,
wit
h i
ts u
niv
ers
ity
as a
key
facto
r in
cre
ati
ng
an
ed
ucate
d w
ork
forc
e
thro
ug
h i
ncre
asin
g a
nd
im
pro
vin
g t
he l
ev
el
of
acad
em
ic a
nd
pro
fessio
nal
ed
ucati
on
Go
al
4:
A c
ity
wit
h q
uali
tati
ve c
on
tem
po
rary
sta
nd
ard
s o
f in
frastr
uctu
re a
nd
pu
bli
c
serv
ices t
hat
sti
mu
late
an
d s
up
po
rt
su
sta
inab
le d
ev
elo
pm
en
t o
f th
e l
ocal
eco
no
my
in
harm
on
y w
ith
th
e e
nv
iro
nm
en
t
Go
al
5:
Ach
iev
e f
or
Sh
ko
dra
's r
esid
en
ts a
healt
hie
r li
festy
le w
ith
pro
mo
tio
n o
f
sp
ort
s,
imp
rov
em
en
t o
f th
e c
ity
's
sp
ort
s f
acil
itie
s a
nd
im
pro
ved
access
to h
ealt
h a
nd
so
cia
l serv
ices
VIS
ION
S
hk
od
ra w
ill
be a
n i
mp
ort
an
t eco
no
mic
, ed
ucati
on
al
an
d r
eg
ion
al
ex
ch
an
ge c
en
tre t
hat
wil
l d
ev
elo
p i
n h
arm
on
y w
ith
th
e c
ity
's h
isto
ry,
cu
ltu
re a
nd
peo
ple
, b
eco
min
g,
wit
h i
ts o
uts
tan
din
g n
atu
ral
en
vir
on
men
t, a
n a
ttra
cti
ve p
lace i
n w
hic
h t
o l
ive a
nd
wo
rk a
nd
to
vis
it
22
MU
NIC
IP
AL
IT
Y o
f S
HK
OD
RA
• Provision of a realistic calendar for the implementation of the SPLED;
• Identification of the expected results;
• Development of an efficient system of communication between the Municipality and its
partners;
• Facilitation of marketing of the potential for and the possibilities of doing business here;
• Establishment of a monitoring system in collaboration with the community in order to follow
up on the completion of activities and the evaluation of the results anticipated in the SPLED;
• Improvement in the management system in the Municipality in the function of implementing
programmes included in the Plan matrix;
• Provision of guidance for lobbing and negotiating with local, national and international actors
interested in or being involved in projects in our SPLED;
• Provision of guidance for local government and donors to allocate funds and to focus on
available resources.
Implementation
A SPLED is the official plan for the administration of a local government and the institutions and
enterprises under its control and as such is an on-going evolving plan. The SPLED for our city has
begun and will follow four stages:
1. Activation of the financial resources and allocation of the funds;
2. Realisation of public-private partnerships;
3. Monitoring and evaluation of the Plan;
4. Re-evaluation and improvement of the Plan.
Given that the timeframe for implementation of our SPLED is longer than that of a political mandate,
the success in the implementation of this strategy depends on the continuous engagement of the local
government and civil service in achieving the objectives and implementation of the outlined projects.
The Municipal Council, as the key factor in provision of support for the SPLED, will provide
guarantees for the allocation of municipal funds for financing of the projects. In addition, it will
provide effective advice for the approval of improvements suggested by the Planning Commission
and executive authority of the municipal government.

23
The Mayor and the Head of the EDDM will coordinate the programmes, projects and financing from
central government, donors and local or international organisations, so that they follow and support
the SPLED. In addition, they will initiate and implement adequate improvements in the management
of the process and restructure the staff according to the implementation of the SPLED. The success
of the implementation will depend heavily on how the organisations and agencies involved in the
Strategic Plan will manage the particular elements they are responsible for.
While the community will experience progress with the implementation of the SPLED, the plan
itself will need to be revised, evaluated and improved in order to address new conditions and situations.
The Economic Development Commission of the Municipality (EDCM) will monitor and evaluate
the implementation of the Plan, while keeping in mind that the community should also have access to
the monitoring process.
Organisational approach to Plan implementation
The municipality appointed the EDCM as the main institution to review and evaluate the Strategic
Plan implementation process. Every four months, EDCM will hold a meeting to discuss progress
made in the implementation, based on reports prepared by the EDDM. It will also, once a year, in
August, discuss and approve findings and evaluations, and add suggestions that will be presented to
the Mayor and then to the Municipal Council for discussion and approval.
The composition of this Commission may change. However, the responsibilities will remain the
same: supporting, monitoring and reviewing Plan implementation. Meanwhile, the Mayor, in
consultation with EDCM, may appoint working groups to support implementation of particular parts.
EDCM will develop and approve an annual activity plan for reviewing the Strategic Plan. The funds
for supporting its operations will be approved by Municipal Council, at the request of the Mayor.
The EDDM is the structure that is directly responsible for following up the implementation process,
and it will mainly:
• provide adequate administrative logistical support for the activity of the Planning Commission;
• coordinate the activities of the actors identified in the Plan and of those that will be involved later on;
• provide staff for the working teams that will support the Planning Commission;
• prepare and present for the Mayor and Planning Commission reports on the performance of
the implementation process;
• find data and information required by the Mayor and Planning Commission.

24
MU
NIC
IP
AL
IT
Y o
f S
HK
OD
RA
Financing of Strategic Plan
Financing of the Strategic Plan is a major effort for the Municipality, equal to the effort made in plan
development. The Implementation Matrix (Chapter VIIIc) identifies estimated costs, and gives the
actual and potential partners. The approximate cost of Plan implementation is 7,599,776,896 leke,
equivalent to 60,798,215 euro.
The Municipal Government will finance the Strategic Plan through its own budget, and this began in
2005. The Municipal Council will continually include the implementation of the programmes and
projects of the Plan in the municipality’s annual and mid-term budgets.
The Strategic Plan will be co-financed by central government, the local business community and
other community groups, donors and local and international organisations. Commitment of the business
community through direct investments offers an additional financial guarantee for its implementation
and success.

25
VI. Overview of Shkodra community
Geography and topography
The city of Shkodra is located in Northwest Albania (45.03N, 19.31E), at an altitude above sea level
ranging, in a line running from south-west to north-east, from 9.5 m to 24 m.
The city and its immediate surrounds lie on an alluvial plain in a depression resulting from tectonic
shift during the Pliocene. This depression is partly filled by deposits from the rivers that have flowed
through the depression to the Adriatic Sea. The climate is Mediterranean, with a continental and
maritime mixture.
To the north and west of the city lies Lake Shkodra, from which the River Buna (44 km long) flows
south into the Adriatic. The lower part of the river constitutes a border with Montenegro. Just (two
km) southwest of the city lies the confluence of the Rivers Buna and Drin. The east of the city is
bordered by the River Kir (43 km long), a seasonal river that flows from the northern highlands into
the River Drin just south of the city.
The flat part of Shkodra extends across an area of 1,150 ha, while there are some 350 ha of hills in the
city. Shkodra includes three peripheral neighbourhoods: Bahçallek in the south, and Shirokë and
Zogaj in the west, which occupy an area of 180 ha.
Shkodra is partly encircled by a range of hills that rise to an altitude of 110 m, by the Rrenci Hills to
the east and the Tepe Hills to the south. Immediately southwest of Shkodra lies the rocky outcrop on
which stands Rozafa Castle, some 130 m above sea level and enclosing an area of 3.6 ha.
To the north and northwest lie the fields of Mbishkodra, to the north and east of which the Albanian
Alps begin. In the opposite direction, about 30 km to the southwest of the city, lies Velipoja, a
popular beach resort on the Adriatic coast.
Thus, within 30 km of Shkodra there exist a whole range of natural attractions, from the mountains
of High Albania to the Mediterranean coastline of the Adriatic, from the shores of the largest
lake in the Balkans to the rocky outcrop of Rozafa Castle, which stands majestically above a
city that one hundred years ago had a navigable river bringing merchant and passenger vessels
into its heart.
Demography
The population of the city of Shkodra comprises about 45 per cent of that of the whole region. As a
result of the dramatic changes that have taken place in the country over the last decade and a half, the
26
MU
NIC
IP
AL
IT
Y o
f S
HK
OD
RA
Year No. of inhabitants Year No. of inhabitants
1991 83,086 1998 101,257
1992 85,436 1999 102,937
1993 87,941 2000 104,667
1994 89,587 2001 106,415
1995 92,181 2002 107,924
1996 93,674 2003 108,995
1997 98,979 2004 109,632
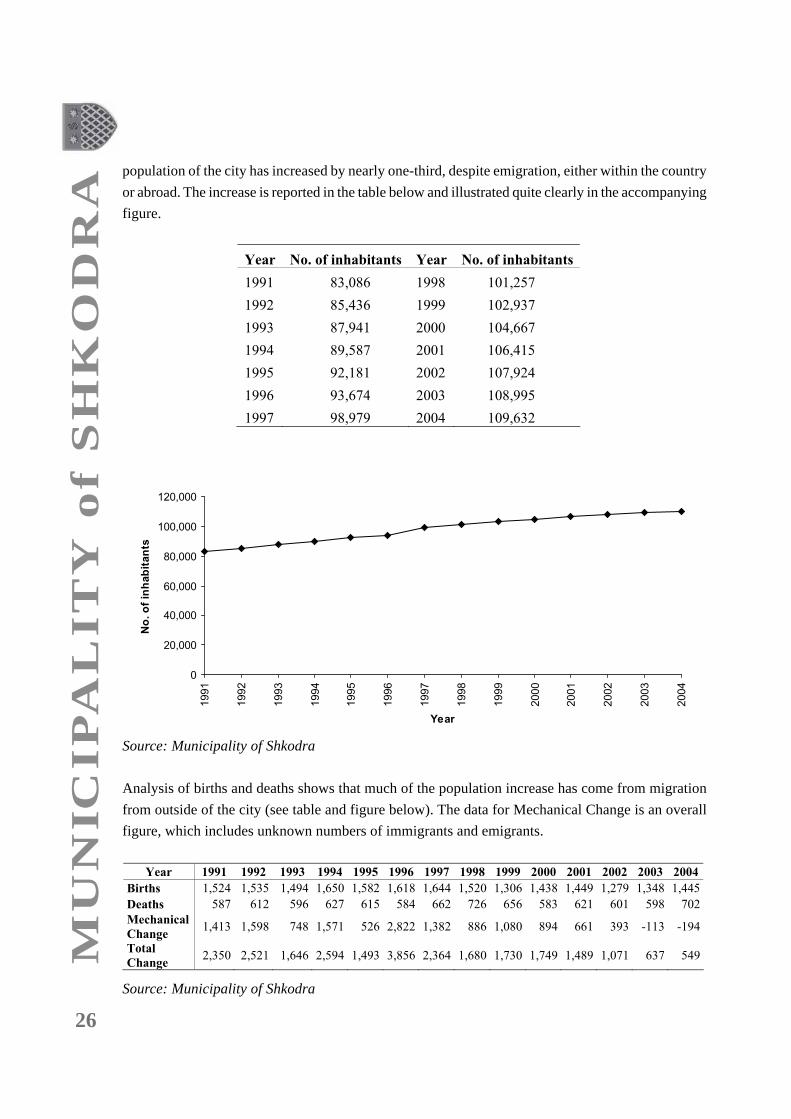
population of the city has increased by nearly one-third, despite emigration, either within the country
or abroad. The increase is reported in the table below and illustrated quite clearly in the accompanying
figure.
0
20,000
40,000
60,000
80,000
100,000
120,000
1991
1992
1993
1994
1995
1996
1997
1998
1999
2000
2001
2002
2003
2004
Year
No
. o
f in
hab
itan
ts
Source: Municipality of Shkodra
Analysis of births and deaths shows that much of the population increase has come from migration
from outside of the city (see table and figure below). The data for Mechanical Change is an overall
figure, which includes unknown numbers of immigrants and emigrants.
Year 1991 1992 1993 1994 1995 1996 1997 1998 1999 2000 2001 2002 2003 2004
Births 1,524 1,535 1,494 1,650 1,582 1,618 1,644 1,520 1,306 1,438 1,449 1,279 1,348 1,445
Deaths 587 612 596 627 615 584 662 726 656 583 621 601 598 702
Mechanical
Change 1,413 1,598 748 1,571 526 2,822 1,382 886 1,080 894 661 393 -113 -194
Total
Change 2,350 2,521 1,646 2,594 1,493 3,856 2,364 1,680 1,730 1,749 1,489 1,071 637 549
Source: Municipality of Shkodra

27
-500
0
500
1,000
1,500
2,000
2,500
3,000
3,500
4,000
4,5001991
1992
1993
1994
1995
1996
1997
1998
1999
2000
2001
2002
2003
2004
Year
Ch
an
ge in
po
pu
lati
on
siz
e
Births
Deaths
Mechanical Change
Total Change
Source: Municipality of Shkodra
The natural change in the size of the population of Shkodra is a positive number, i.e. that the number
of births is greater than the number of deaths.
• The overall coefficient of mortality (number of deaths : number of inhabitants) has varied
very little over the last decade and a half, at 7 deaths per 1,000 inhabitants in 1991, to 6
deaths per 1,000 inhabitants in 2003.
• The overall migration figures, overwhelmingly positive in the 1990s became negative in
2003 and 2004.
Reasons for the latter figures could be many. For example, the number of emigrants going abroad or
to Tirana may have been roughly constant over all this time, while the number of immigrants entering
the city may have gradually decreased, as many areas of the hinterland have become deserted.
Population structure according to age group is reported for year 2004 in the table below.
Age group
(years) < 1 1–4 5–9 10–14 15–19 20–34 35–54 55–64 > 64 Total
Number 1,500 8,675 9,150 9,443 9,377 28,688 25,300 8,022 10,027 110,182
Percentage 1.36 7.87 8.31 8.57 8.51 26.04 22.96 7.28 9.10 100
Source: Municipality of Shkodra
The average age of the population of the city of Shkodra is 27 years (a young population). The ageing
coefficient is 8 per cent (young), while the male : female birth ratio was in favour of males during the
years 1991–2003, the ratio varying between 103 and 118 males per 100 females.
28
MU
NIC
IP
AL
IT
Y o
f S
HK
OD
RA
Municipal government
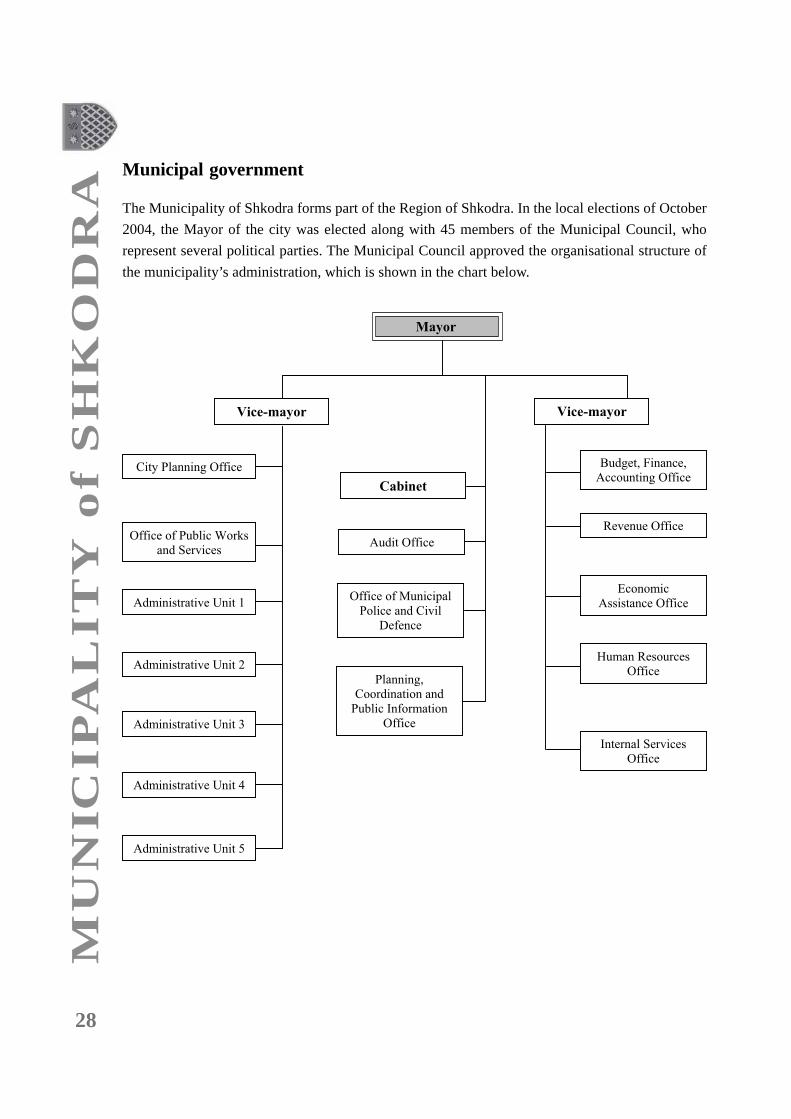
The Municipality of Shkodra forms part of the Region of Shkodra. In the local elections of October
2004, the Mayor of the city was elected along with 45 members of the Municipal Council, who
represent several political parties. The Municipal Council approved the organisational structure of
the municipality’s administration, which is shown in the chart below.
Mayor
Vice-mayor Vice-mayor
Cabinet
Audit Office
Office of Municipal
Police and Civil
Defence
Planning,
Coordination and
Public Information
Office
Budget, Finance,
Accounting Office
Economic
Assistance Office
Human Resources
Office
Internal Services
Office
Revenue Office
City Planning Office
Office of Public Works
and Services
Administrative Unit 1
Administrative Unit 2
Administrative Unit 3
Administrative Unit 4
Administrative Unit 5

29
Revenues and expenses for years 2001 to 2004The revenues (000s leke) and expenses for the Municipality of Shkodra for the years 2001 to 2004
are reported in the table below.
Revenues 2001 2002 2003 2004
Total local revenues: 46,112 87,693 204,178 233,155
from local taxes 17,056 44,428 169,922 178,050
from local tariffs 19,393 26,710 11,069 38,850
from other sources 9,663 16,555 23,187 16,255
Total revenue from National Resources: 1,082,547 1,102,883 1,345,117 1,146,340
grant 140,154 252,891 156,940 127,769
designated transfers (conditioned budget) 942,393 849,992 1,188,177 1,018,571
Total (000 leke) 1,128,659 1,190,576 1,549,295 1,379,495
Percentage
Local revenues: 4 7 13 17
from local taxes 2 4 11 13
from local tariffs 1 2 1 3
from other sources 1 1 1 1
Revenue from National Resources: 96 93 87 83
grant 12 21 10 9
designated transfers (conditioned budget) 84 72 77 74
Total 100 100 100 100
Expenses (%)
Investments from own resources 1 4 3 3
Investments from national resources 9 8 4 3
Operational expenses 90 88 93 94
Total 100 100 100 100
Source: City Department of Finance
It is apparent that the municipality is heavily dependent upon central government for its income, as
the total revenues from National Resources for the period 2001 to 2004 show, accounting for between
83 and 96 per cent of revenue, though the percentage has been steadily falling since 2001.
The budget of the municipality contains a conditioned part and an unconditioned part. The conditioned
part includes funds specifically allocated by central government for common and delegated functions,
which are supervised by the line ministries, while the unconditioned part includes the municipality’s
revenues from local taxes and tariffs applied for the various services it offers, and from sale of its
assets. In addition, since the year 1999, this budget line has included a grant disbursed by central
government.

30
MU
NIC
IP
AL
IT
Y o
f S
HK
OD
RA
The relative percentages of the conditioned and unconditioned budget are shown in the figure below.
Despite the reforms undertaken as part of decentralisation of government, the continued centralisation
of the state is apparent: the conditioned budget comprised 74 per cent of the total budget for the year
2004, though for the year 2001 it was higher still, at 84 per cent.
0
10
20
30
40
50
60
70
80
90
2001 2002 2003 2004
Year
Pe
rce
nta
ge Conditioned budget
Unconditioned budget
Source: City Department of Finance
The policy making capabilities of the municipality, especially with regard to the capital investments
and common functions, are still very centralised with almost all financing coming from central
government through the line ministries.
Furthermore, with regard to the conditioned budget, there are no clear and transparent mechanisms
and criteria on how it is assigned by central government. This is reflected in the low level of investments
realised by the municipality, even though the need for capital investments and capability to absorb
them is very large.
Another important source of financing for the municipality is donors. The Municipality of Shkodra
has positive experiences in this direction, such as the financing by the Austrian Chancellery of a
project to rehabilitate the city’s mains water and sewage systems, and by USAID of a project to
rehabilitate two of the city’s roads.
Nevertheless, despite direct meetings being held between municipal officials and various donors,
when it comes to the financing of supportive programmes, especially through capital investments,
donors prefer, in most cases, to negotiate with central government (the line ministries), and
recommendations are often determined by the political preferences of ministry staff.

31
EducationIn year 2001, the educational level of the adult population of the city of Shkodra was as follows:
Educational level Per cent
Uneducated 1
Know how to read and write only 12
Elementary education attended 15
Middle school and vocational education attended 31
High school education attended 32
University or college attended 9
Source: INSTAT

32
MU
NIC
IP
AL
IT
Y o
f S
HK
OD
RA
VII. Economic profile of Shkodra
In the period 1945–1992, Albania implemented the opposite of a market economy: property ownership
was prohibited and all economic activity was state controlled. The country became unique with
regard to isolation and economic centralisation.
The main activities of the processing industry in Shkodra were the processing of tobacco and
manufacture of cigarettes, production of conserved foods, sugar-based foods, soft and alcoholic drinks,
and pasta, bread, rice and vegetable oil. The main activities of the textile industry were focused on
garments and silk products. The city also had a wood-processing and paper-production plant. The
most important mechanical engineering industries concerned wire manufacturing, elevator
manufacturing, bus assembly and the Drini Plant. Two important hand craft enterprises were the
Artisan Products Enterprise and the Straw and Reed Enterprise.
During this period, Shkodra had the fifth largest economy in Albania. However, in 1992, the Albanian
government undertook a number of reforms and approved a number of laws concerning property
ownership, private activity, competition, bankruptcy, foreign investments, customer protection,
privatisation of small and medium enterprises (SMEs), and many other elements involved in modern
trade.
As a result of these reforms, big changes took place in the economic structure of Shkodra, so that
some nine-tenths of the former state-owned enterprises in the city were privatised. However, the
majority of these privatised businesses did not continue their original production lines, particularly
in the mechanical engineering industry, which had been unique in the country and had a guaranteed
national market.
Food processing, wood processing and the artisan products industry, which were among the largest
producers of the time, were dissolved into a large number of SMEs.
Meanwhile, tobacco processing and the cigarette manufacturing industry were completely destroyed:
incapability to invest in technological renovation and competition from imported products caused its
bankruptcy.
Natural resources of Shkodra region
The Shkodra region is bordered to the North by the region of Malesi e Madhe, to the West by the
Republic of Serbia and Montenegro, and by the Adriatic Sea, to the South by the region of Lezha and
to the East by the region of Puka. The Region of Shkodra occupies an area of 2,049 km2 and has a
population of 243,000 inhabitants.
33
The territory includes three lakes. Lake Shkodra, the largest lake in the Balkans, has a surface area of
369 km2, of which 149 km2 lie in Albania, with the rest in Montenegro. The average depth of the lake
is 10 m and the average water temperature 16.5°C, which helps to moderate the climate of the city.
The lake is very rich in fish, with an annual harvest of 50 kg/ha. The shoreline within the municipality
extends 14.5 km along the lakeshore, of which 10 km are rocky and 4.5 km flat land, mostly bordering
fields.
The two other lakes in the region of Shkodra are artificial: the lake of Vau-Dejes, 20 km east of
Shkodra, occupies an area of 27 km2, while that of Koman, 40 km east of Shkodra, is 17 km2 in size.
Both these lakes are located on the River Drin and were created to supply the two largest hydro-
electricity power stations in Albania: Vau-Dejes has an installed power of 250 mW, while that of
Koman has an installed power of 600 mW.
To the north of Shkodra, in the highlands, reside yet more water resources. The mountain valleys are
on average 800 m above sea level and have potential electricity reserves of 400 mW per hour, allowing
for the construction of small power stations.
The most important local metal mineral resources are to be found at the copper mine of Palaj Karme,
45 km from the city. This mine became effective in 1981 and its reserves are estimated to be more
than 1 million tons, with 2.5 per cent Cu. Other copper ore sources are located in Turrec, 40 km from
Shkodra. In addition, there are reserves of Bauxite (aluminium ore) at Villgar, 13 km from Shkodra.
Non-metal minerals are found at the following places (with distance from Shkodra in parentheses):
• Kaolin (white clay used to make porcelain and some medicines) in Domen-Postribe (13 km)
and in Vig (45 km);
• Silica source at Vilza (21 km);
• Dolomite (limestone) stone resources in Rrasek (11 km);
• Rhyolite stone resources in Guri Zi (6 km).
In the periphery of Shkodra City reside resources of raw materials used for the production of
construction materials, including cement, lime, bricks, tiles, ceramics, marble, decorative stone, etc.
The land around Shkodra comprises approximately 19,220 ha (or 64 per cent) flat land, 7,450 ha (25
per cent) hills and 3,590 (11 per cent) mountain. The land and much of the hills are farmed in one
way or another.

34
MU
NIC
IP
AL
IT
Y o
f S
HK
OD
RA
According to recent agrochemical studies, more than 75 per cent of the land surface is rich or medium
rich in nitrogen, phosphorous and potassium, and the depth of soil under the fields is large. Dominating
types of land are neutral meadow and alluvial meadow types.
According to the land registry, the region of Shkodra has in total 151,427 ha land, of which 30,243 ha
are agricultural, 54,510 forest, 10,454 meadows and pastures, and 56,220 ha other types. Of the
agricultural land, 29,289 ha are fields, 184 ha orchards, 561 ha olive groves and 208 ha vineyards.
According to the Regional Agricultural Office, the dominant cultivated crops are as follows:
• Fodder, 10,321 ha;
• Grain and corn, 6,076 (grain 2,544; corn 3,532) ha;
• Total vegetable, 2,755 ha;
• Kidney bean, 597 ha;
• Potato, 231 ha;
• Tobacco, 213 ha.
Tourism
Tourism in the Shkodra region is an age-old tradition. The products of the region have been much
valued by both foreign and national tourists, but particularly by the local people. Although the produce
has been mostly designed for national or local consumption much of it is attractive to foreign tourists
as well.
The larger region around Shkodra, encompassing Malesia e Madhe (High Albania), has a very
favourable geographical position compared to all other regions of Albania with regard to the
development of four major types of tourism:
• City tourism, based on the attractions offered by Shkodra itself, with its religious artefacts
(from three different main religions practised in the city), cultural monuments, Rozafa Castle
and 40 characteristic traditional houses;
• Mountain tourism, based on the attractions offered by Malesia e Madhe, in the villages of
the Razem, Boge and Theth area, all of which are within 45 km of the city;
• Seaside tourism, based on the attractions offered by Velipoja Beach, only 30 km from the
city;

35
• Lake tourism, based on the attractions of the villages of Shirokë and Zogaj, and the lake
itself.
It must be pointed out that the geographical position of the region of Shkodra is undoubtedly the
most important premise for the development of tourism in the region. In addition, the human, cultural
and historical values and traditions of Shkodra city add more dimensions to such development.
Labour force
1. Employment
Employment in the private sector from years 1994 to 2004 is shown in the table below.
Year 1994 1995 1996 1997 1998 1999 2000 2001 2002 2003 2004
No. of
employees 7,391 8,483 8,190 4,141 4,034 3,802 4,972 5,223 5,496 5,611 6,529
Source: Regional Office for Employment in Shkodra
The fluctuation in the numbers of people employed in the private sector is shown clearly in the figure
below, from which it can be seen that the level of employment has been rising over the past six years,
approaching the levels of a decade earlier. The collapse in the number of people employed in the
private sector in 1996 and 1997 coincides with the collapse of the pyramid schemes in Albania in
those years.
0
1,000
2,000
3,000
4,000
5,000
6,000
7,000
8,000
9,000
1994
1995
1996
1997
1998
1999
2000
2001
2002
2003
2004
Year
No
. o
f em
plo
yees
Further breakdown of the employment figures by sector and economic activity for the year 2004 is
reported in the table on the following page.
36
MU
NIC
IP
AL
IT
Y o
f S
HK
OD
RA
Private sector Public sector Total
Activity No. of
subjects
No. of
employees
No. of
subjects
No. of
employees
No. of
subjects
No. of
employees
Employees
as %
Agriculture, hunting,
silviculture 3 167 3 167 1.10
Mining 2 12 2 12 0.08
Manufacturing:
Food processing 76 267
Garment and clothes 21 1,059
Leather and shoes 4 718
Others 64 313
Total manufacturing 165 2,357 2 55 167 2,412 16.00
Generation and use of
electricity, water, etc. 1 2 10 985 11 987 7.00
Construction 103 970 103 970 6.30
Trade, car repairs and
home products 747 1,690 747 1,690 11.10
Hotels and restaurants 140 262 140 262 2.00
Transportation and
telecommunications 109 167 6 437 115 443 3.00
Financial activities 4 31 3 57 7 88 0.60
Public administration 13 168 58 2,913 71 3,081 20.24
Education 19 243 13 2,407 32 2,650 17.41
Health and social activities 53 70 4 1,287 57 1,357 8.92
Collective and personal
social services 278 565 12 371 290 936 6.20
International institutions 1 4 1 4 0.03
Total 1,633 6,529 113 8,691 1,746 15,220 100.0
Source: Regional Office for Employment in Shkodra
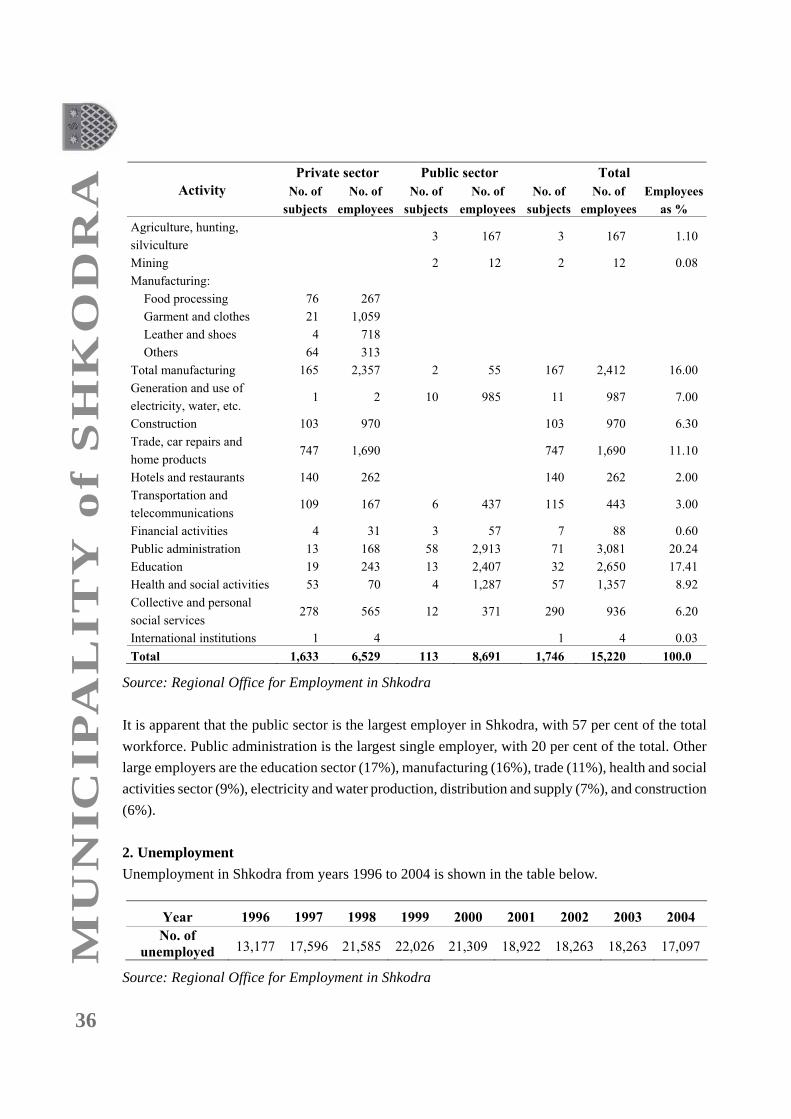
It is apparent that the public sector is the largest employer in Shkodra, with 57 per cent of the total
workforce. Public administration is the largest single employer, with 20 per cent of the total. Other
large employers are the education sector (17%), manufacturing (16%), trade (11%), health and social
activities sector (9%), electricity and water production, distribution and supply (7%), and construction
(6%).
2. Unemployment
Unemployment in Shkodra from years 1996 to 2004 is shown in the table below.
Year 1996 1997 1998 1999 2000 2001 2002 2003 2004
No. of
unemployed 13,177 17,596 21,585 22,026 21,309 18,922 18,263 18,263 17,097
Source: Regional Office for Employment in Shkodra

37
Not surprisingly, the figures fluctuate inversely with respect to those for employment reported above,
but not absolutely so. Thus, in 1996, about one and a half times as many people were unemployed
than were employed, while in 2004, this ratio was two and a half times. The highest level of
unemployment was recorded between 1998 and 2000, as shown clearly in the figure below.
0
5,000
10,000
15,000
20,000
25,000
1996
1997
1998
1999
2000
2001
2002
2003
2004
Year
No
. o
f u
nem
plo
yed
Among unemployed active job seekers more males were registered in 2004 than were females, and
the highest percentage of unemployment was registered for people in their early 20s. The level of
unemployment falls with increased level of education as reported in the table below.
Age group Educational level
Total Female Head of
household 15–19 20–24 25–34 >34 Middle
school
High
school Vocational University
17,097 6,907 7,601 2,919 7,360 1,488 5,330 7,989 6,187 2,408 513
% 40 44 17 43 9 31 47 36 14 3
Source: Regional Office for Employment in Shkodra
From the same information source as above, the ratio of active population to total population size is
reported as 29 per cent, while the level of unemployment itself is about 54 per cent, among the
highest in the country.
Private businesses in Shkodra
The Shkodra region accounts for three per cent of all businesses active in Albania. Tirana has the
largest number of enterprises, with 39 per cent, while more than 60 per cent of all economic activity
takes place in the Tirana–Durres–Fier corridor. In comparison, the whole northern half of Albania,
which includes the regions of Shkodra, Lezha, Kukes and Dibra accounts for only 7 per cent of
businesses, as reported in the table and figure below.

38
MU
NIC
IP
AL
IT
Y o
f S
HK
OD
RA
Prefecture No. of enterprises Percentage
Tirana 20,152 39
Durres 6,308 12
Fier 5,376 10
Korça 4,683 9
Vlora 3,730 7
Elbasan 3,499 7
Berat 2,440 5
Gjirokastra 2,140 4
Shkodra 1,579 3
Lezha 975 2
Dibra 684 1
Kukes 379 1
0
5,000
10,000
15,000
20,000
25,000
Tirana
Durr
es
Fie
r
Korc
a
Vlo
ra
Elb
asan
Bera
t
Gjir
okastr
a
Shkodra
Lezha
Dib
ra
Kukes
Prefecture
No
. o
f en
terp
rises
Source: INSTAT Business Register (2003)
The table below reports the number of businesses in the Shkodra Prefecture for the period 1994–
2004. The largest number of businesses is recorded for years 1994 and 1995, a result of the economic
reforms and privatisation of state-owned enterprises, which became SMEs. There followed however,
a drastic reduction in the number of businesses between years 1996 and 1999, as shown in the
accompanying figure.
Year 1994 1995 1996 1997 1998 1999 2000 2001 2002 2003 2004
No. of
businesses 2,310 2,594 1,792 987 1,037 944 1,431 1,582 1,654 1,652 1,633

39
0
500
1,000
1,500
2,000
2,500
3,000
1994
1995
1996
1997
1998
1999
2000
2001
2002
2003
2004
Year
No
. o
f b
usin
esses
Source: INSTAT Business Register (2003)
During the period 1997 to 1999 the decline resulted partly from the closure of the border with the
former Yugoslavia (Montenegro), which sharply reduced the economic exchange between the two
states, and subsequently the activity on either side of the border. In addition, there was in Albania the
crisis of 1997, mentioned above, during which the businesses of Shkodra were badly damaged, being
forced to close or reduce their activity as much as possible. Furthermore, during this period and ever
since, the situation with regard to the electricity supply (on average just 6 or 7 hours a day) and
infrastructure of the city has been critical. Nevertheless, during 2000, there was an increase in the
number of businesses of 487 compared to the previous year, and the number has increased slightly
since then, stabilising at about 1,600.
The following table and chart show the structure of the types and sizes of businesses active in and
around Shkodra during 2003. Micro, small and medium enterprises comprise 99 per cent, nearly all,
of the businesses, with only 1 per cent of all businesses being large enterprises.
Economic activity Micro Small Medium Large Total
Agriculture 19 2 7 2 30
Industry 197 33 22 15 267
Construction 151 31 12 1 195
Transportation 95 6 2 103
Trade 760 19 4 783
Services 175 17 6 3 201
Total 1,397 108 53 21 1,579
Source: Regional Directorate of Taxes
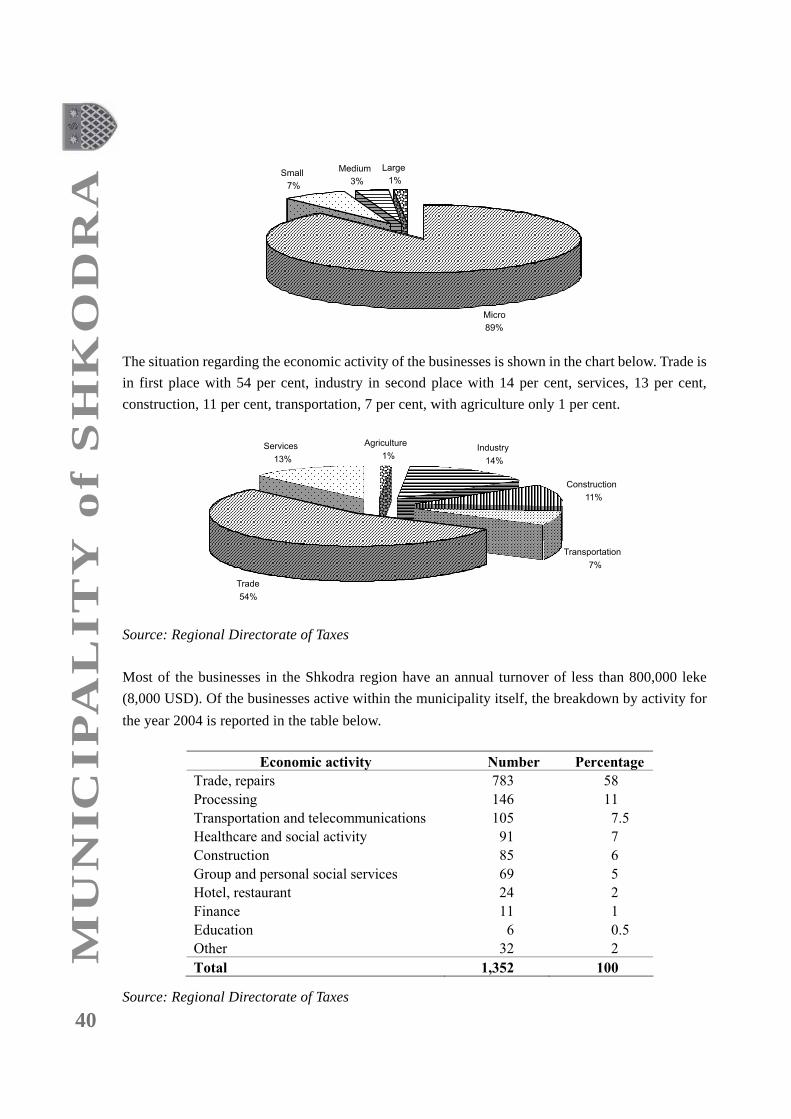
40
MU
NIC
IP
AL
IT
Y o
f S
HK
OD
RA
The situation regarding the economic activity of the businesses is shown in the chart below. Trade is
in first place with 54 per cent, industry in second place with 14 per cent, services, 13 per cent,
construction, 11 per cent, transportation, 7 per cent, with agriculture only 1 per cent.
Source: Regional Directorate of Taxes
Most of the businesses in the Shkodra region have an annual turnover of less than 800,000 leke
(8,000 USD). Of the businesses active within the municipality itself, the breakdown by activity for
the year 2004 is reported in the table below.
Economic activity Number Percentage
Trade, repairs 783 58
Processing 146 11
Transportation and telecommunications 105 7.5
Healthcare and social activity 91 7
Construction 85 6
Group and personal social services 69 5
Hotel, restaurant 24 2
Finance 11 1
Education 6 0.5
Other 32 2
Total 1,352 100
Source: Regional Directorate of Taxes

41
Trade accounts for nearly two-thirds of these businesses, with processing the next largest sector,
with rest each being less than one-tenth.
For businesses in Shkodra with revenues larger than 800,000 leke, called large businesses, the following
structure obtains.
Economic activity Number Percentage
Trade 162 45
Construction 85 24
Production 80 23
Transportation 9 3
Phone service 2 1
Other 14 4
Total 352 100
Source: Regional Directorate of Taxes
Trade still accounts for nearly half of large businesses, but the construction and manufacturing sectors
are larger than for SMEs. In the manufacturing sector, there are a number of specialisations: clothing,
food processing, wood processing, tanning (leather and shoes) and others. The breakdown according
to number of businesses is given in the table and figure below.
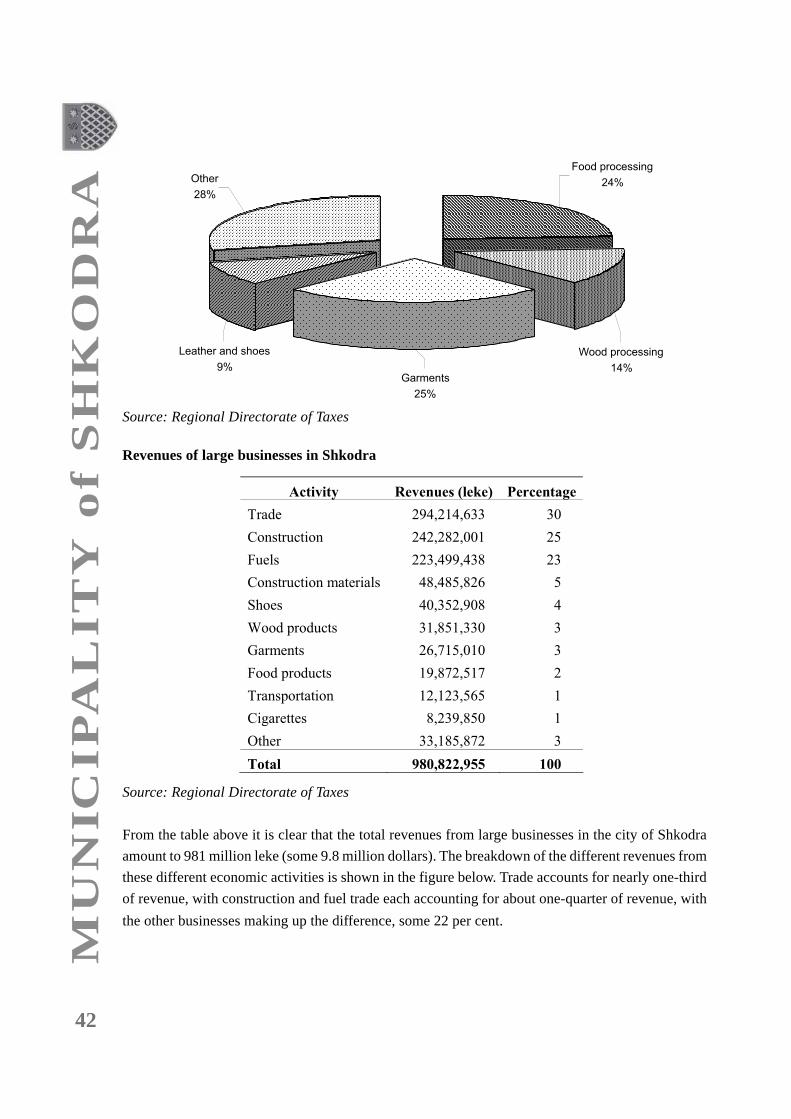
42
MU
NIC
IP
AL
IT
Y o
f S
HK
OD
RA
Source: Regional Directorate of Taxes
Revenues of large businesses in Shkodra
Activity Revenues (leke) Percentage
Trade 294,214,633 30
Construction 242,282,001 25
Fuels 223,499,438 23
Construction materials 48,485,826 5
Shoes 40,352,908 4
Wood products 31,851,330 3
Garments 26,715,010 3
Food products 19,872,517 2
Transportation 12,123,565 1
Cigarettes 8,239,850 1
Other 33,185,872 3
Total 980,822,955 100
Source: Regional Directorate of Taxes
From the table above it is clear that the total revenues from large businesses in the city of Shkodra
amount to 981 million leke (some 9.8 million dollars). The breakdown of the different revenues from
these different economic activities is shown in the figure below. Trade accounts for nearly one-third
of revenue, with construction and fuel trade each accounting for about one-quarter of revenue, with
the other businesses making up the difference, some 22 per cent.

43
Source: Regional Directorate of Taxes
In contrast, revenues from small businesses are, not surprisingly, much smaller than those from large
businesses, as reported in the table below (in thousands of leke). What stands out in these figures is
the remarkable, nearly exponential growth in revenues from small businesses from the years 2000 to
2003, whether this be from genuine increased revenues or larger receipts reported to the relevant
authorities.
Source: Regional Directorate of Taxes

44
MU
NIC
IP
AL
IT
Y o
f S
HK
OD
RA
Services and infrastructure
1. Water supplyThe drinking water supply network falls under the management of the Sewage and Water Supply
Enterprise.
The water supply network in the city of Shkodra was constructed in 1964 and has been functioning
since then. The system comprises the water pump stations in Dobraç, the water reservoirs in the Tepe
Hills and the distribution pipeline network. In all, some 200 km of piping are installed, connected to
a reservoir with storage capacity of 8,000 m3, together with the water pump station with pumping
capacity of 1,000 l/sec.
The source of the city’s drinking water originates from eleven wells, which are sunk in the area of
Dobraç, with a total production capacity of 1,200 l/sec. Water is delivered to the city directly from
the water supply network and from the reservoirs in the Tepe Hills.
2. Sewerage
The sewage system falls under the responsibility of the Sewage and Water Supply Enterprise. The
system was constructed in, and has been functional since, 1978. It includes the mains collector, 10.5 km
long, a secondary network, 138 km long, 6,000 drains and a pumping station with 650 l/sec capacity.
To this system are connected about 70 per cent of the population of the city, with the rest using septic
tanks, or drains flowing directly into Lake Shkodra or the rivers in its vicinity. The water outflow
from industrial sites is piped directly into the River Kir, which as mentioned above is a highly seasonal
river, and would otherwise dry out during the summer.
The sewage system is self-flowing, i.e. it uses the natural incline of the land, and, through the mains
collector, the sewage goes to the pumping station located in the Liria neighbourhood of Shkodra. The
pumping station then pumps the waste directly into the River Drin, near Bahçalleku Bridge. The total
annual amount of waste produced by the city is approximately 9.6 million m3, and currently there is
no sewage treatment system installed. Moreover, most of the time the pumping station is not working
and untreated sewage flows directly into Lake Shkodra, creating a serious health risk
3. Flood protectionNaturally, water collects in depressions, and floods occur following large increases in underground
water levels or heavy rainfall. The collection and drainage points are also influenced by the level of
water in Lake Shkodra, with a maximum recorded increase in level of the lake of 9.7 m, and in the
Buna, Drin and Kir river system.
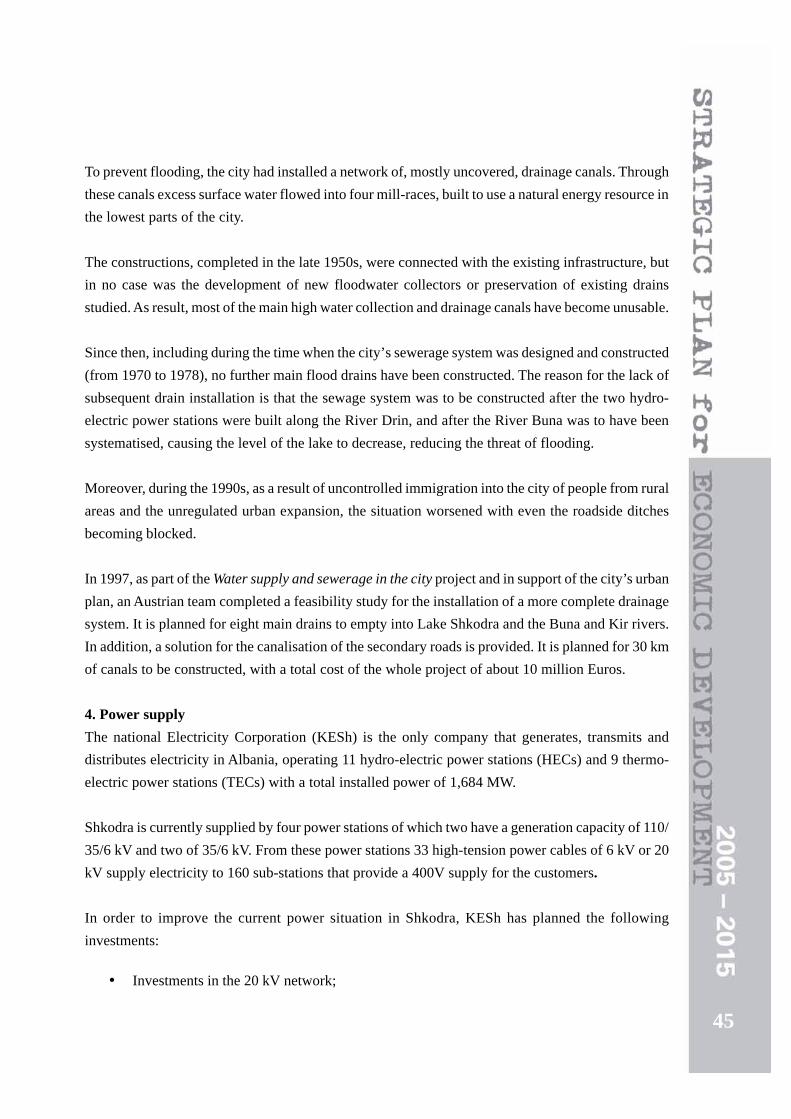
45
To prevent flooding, the city had installed a network of, mostly uncovered, drainage canals. Through
these canals excess surface water flowed into four mill-races, built to use a natural energy resource in
the lowest parts of the city.
The constructions, completed in the late 1950s, were connected with the existing infrastructure, but
in no case was the development of new floodwater collectors or preservation of existing drains
studied. As result, most of the main high water collection and drainage canals have become unusable.
Since then, including during the time when the city’s sewerage system was designed and constructed
(from 1970 to 1978), no further main flood drains have been constructed. The reason for the lack of
subsequent drain installation is that the sewage system was to be constructed after the two hydro-
electric power stations were built along the River Drin, and after the River Buna was to have been
systematised, causing the level of the lake to decrease, reducing the threat of flooding.
Moreover, during the 1990s, as a result of uncontrolled immigration into the city of people from rural
areas and the unregulated urban expansion, the situation worsened with even the roadside ditches
becoming blocked.
In 1997, as part of the Water supply and sewerage in the city project and in support of the city’s urban
plan, an Austrian team completed a feasibility study for the installation of a more complete drainage
system. It is planned for eight main drains to empty into Lake Shkodra and the Buna and Kir rivers.
In addition, a solution for the canalisation of the secondary roads is provided. It is planned for 30 km
of canals to be constructed, with a total cost of the whole project of about 10 million Euros.
4. Power supply
The national Electricity Corporation (KESh) is the only company that generates, transmits and
distributes electricity in Albania, operating 11 hydro-electric power stations (HECs) and 9 thermo-
electric power stations (TECs) with a total installed power of 1,684 MW.
Shkodra is currently supplied by four power stations of which two have a generation capacity of 110/
35/6 kV and two of 35/6 kV. From these power stations 33 high-tension power cables of 6 kV or 20
kV supply electricity to 160 sub-stations that provide a 400V supply for the customers.
In order to improve the current power situation in Shkodra, KESh has planned the following
investments:
• Investments in the 20 kV network;

46
MU
NIC
IP
AL
IT
Y o
f S
HK
OD
RA
• Reconstruction of existing 20/0.4 kV transformer cabins;
• Construction of new 20/0.4 kV transformer cabins;
• Reconstruction of the low voltage network;
• Installation of meters for all customers.
Investment Existing Planned
20 kV network (000 Leke) 105,000 518,000
Length of cable network (km) 8.2 39
Reconstructed cabins 25 66
New cabins 2 30
TU cable network (km) 3.5 39
Meters (000 Leke) 182,000 265,000
Number 18,000 26,000
Group meters 112,000 230,000
Number 250 593
Source: Regional Directorate of KESH
The limitations to the supply of electricity in the city depend also on the quotas planned by the
Distribution Division of KESh.
5. Telecommunications
At the beginning of 1999, the construction of a new central telephone switchboard with a capacity of
30,000 subscribers was completed. The switchboard is managed by the local branch of AlbTelecom,
the Albanian fixed line telecommunications public enterprise. The current number of subscribers is
9,600. Since 2003, this company has also offered an Internet dial-up service. For the year 2005, an
increase of 3,600 residential lines and the introduction of an ADSL service was planned.
6. Road infrastructure
The city of Shkodra has excellent potential transportation resources, with its roads, railway and
access to the sea, and is forecast to be a North-South hub for international traffic, with inclusion in a
corridor parallel to the Adriatic-Ionian coastline.
Unfortunately, the road network in the city is currently in very poor condition, and deteriorating
rapidly. The factors that have brought about this situation are the lack of maintenance, rapid increase
in the volume of traffic and poor, or no, drainage of the roads. Moreover, in many parts of the city,
roads are very often dug up for various reasons and not filled in and repaired properly.

47
Roads in Shkodra City currently fall under three categories, as follows:
Primary roads
These are arterial roads of high capacity or express urban roads that support a medium to high traffic
load and have the following functions:
• Connect the city centre with rural areas around Shkodra and to other cities;
• Bypass the centre of the city;
• Connect directly various institutional, trade and cultural sites.
Secondary roads
These are urban roads of medium to high capacity with the following functions:
• Collect and distribute traffic among primary roads and low capacity roads in the network;
• Connect many important sites of the city.
Tertiary roads
These are roads of low capacity designed for movements among local areas inside the city.
Currently, the network comprises the following:
Primary roads, total length 13.8 km (22%);
Secondary roads, total length 13.4 km (21%);
Tertiary roads, total length 35.8 km (57%).
Thus, the total network comprises 63 km of roads and these are surfaced as reported in the table
below.
Type Length (m) Area (m2) No. of roads
Asphalted 30,708 271,470 57
Not asphalted 32,312 191,175 73
Plazas; alleys 97,000
Total 63,020 559,645 130
Source: Municipal Enterprise of Roads and Storm Water
Of the total area of asphalted roads, only 30 per cent fulfil the conditions of a good quality road.

48
MU
NIC
IP
AL
IT
Y o
f S
HK
OD
RA
VIII. Documentation of the Strategic Plan
The Strategic Plan comprises the following documents:
a. SWOT, consolidated analysis
b. Matrix of Plan goals, objectives, programmes and projects
c. Matrix of Plan implementation
d. Matrix of prioritisation of projects
e. Project fiches

49
a. SWOT, consolidated analysis
Internal External
Po
siti
ve
Strengths
1. Geographic location of Shkodra (sea,
lake, mountains and railway & road
connections with former Yugoslavia)
2. Existence of large natural water resources
3. Existence of tourist potential and
tradition of hospitality
4. Favourable resources for development of
agribusiness and tourism
5. Traditions in handicrafts and trading
6. Qualified human resources and low
labour costs
7. Young average age of population
8. Presence of L. Gurakuqi University
9. Tradition of education, sports and culture
development
10. Presence of professional education
centres
11. Presence of social care and health
institutions
12. Presence of strong social and family
identity
13. Presence of adaptable and flexible
community
Opportunities
1. Process of decentralisation of government
2. Compilation of DELTA LED strategy
3. National strategies that support SMEs
4. Liberalisation of banking system; SME
financing
5. Opening of local bank branches
6. Initiation of projects with foreign
organisations and foundations (e.g. WB,
GTZ, SOROS, USAID, UNDP, REC,
UNOPS, COOPERAZIONE ITALIANA,
COOP, etc)
7. Existence of project to build North-South
corridor along Adriatic-Ionian coastline
8. Existence of foreign investments to improve
drinking water and sewage systems and
prospective of their enlargement
9. Existence of project with European
Investment Bank to install 20 kV electricity
supply lines
10. Implementation of project to enlarge fixed
line telephone network (with additional
2,600 telephones in city)
11. Forthcoming approval of social services
legislation

50
MU
NIC
IP
AL
IT
Y o
f S
HK
OD
RA
Neg
ati
ve
Weaknesses
1. Lack of favourable climate for businesses
2. Low employment potential
3. Discrepancy between requests for
professional qualifications and
availability of local training
4. Lack of implementation of urban
legislation and bylaws by Territory
Regulation Council
5. Lack of regulatory plan and relevant
projects
6. Maladministration and lack of
registration of public property
7. Lack of urban cadastre keeping
documentation orderly
8. Depreciation of engineering works:
water, sewage & electricity systems
9. Low level of project implementation and
checks
10. Lack of control of territory by municipal
administration
11. Illegal interventions in water & electricity
supply networks
12. Low level of local revenues
13. Lack of transparency
14. Absence of digitised civil registry and
statistical databases
15. Poor attendance in pre-school institutions
and excess number of schools for
obligatory education
16. Weak infrastructure and poor financial
support for culture, education,
professional training and sports
institutions
17. Absence of environmental protection
strategy
18. Lack of appropriate infrastructure
Threats
1. Negative impact of central politics
2. Lack of capital investments by central
authorities
3. Lack of public security, law and order
4. Presence of informal trading, fiscal evasion
and creation of monopolies
5. Weaknesses in fiscal legislation
6. Lack of stimuli for local producers
7. Unfavourable economic policies at central
level
8. Presence of endemic corruption
9. Immigration from rural areas and forced
brain drain
10. Slow pace of decentralisation process
11. Impact of unsustainable economic factors
(inflation, high interest rates on loans,
administrative barriers, poor system of
property rights)
12. Unfavourable national strategies for
sheltering
13. Changes in water regime of lake and rivers
Buna, Kir and Drin
14. Lack of provision of social services for all
groups in need (children who do not go to
school, families with problems, etc)

51
b.M
atri
x of
Pla
n go
als,
obj
ecti
ves,
pro
gram
mes
and
pro
ject
s
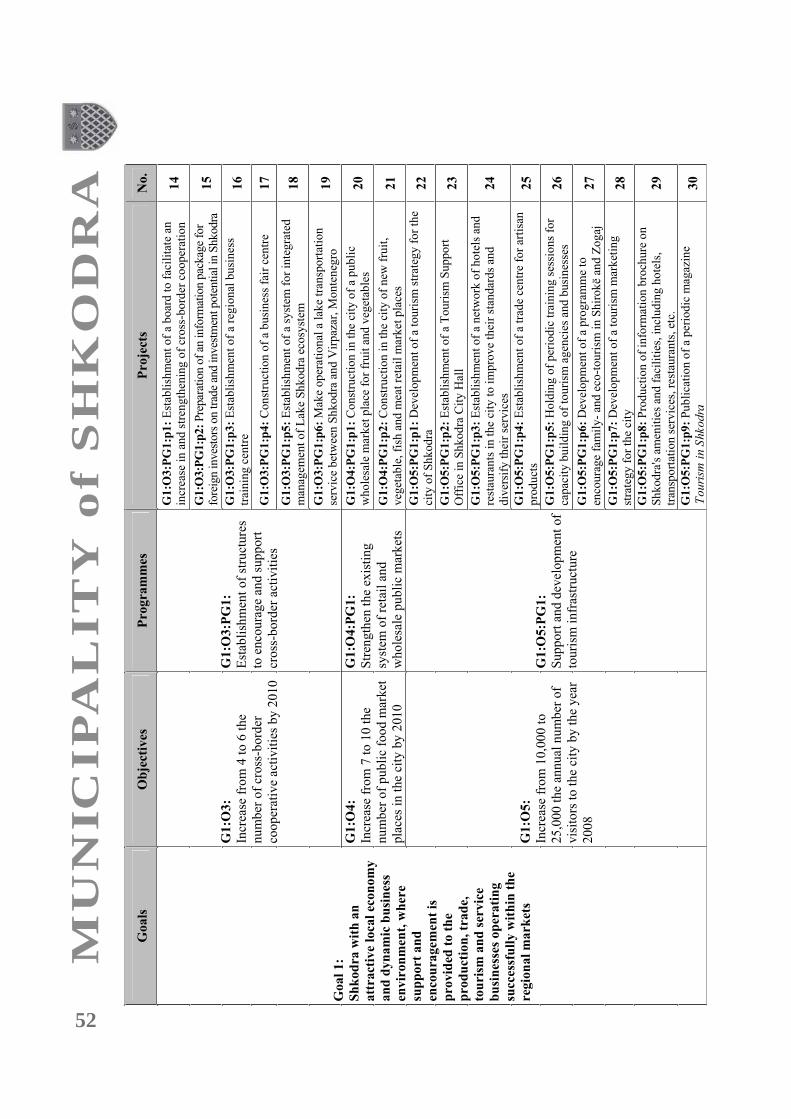
52
MU
NIC
IP
AL
IT
Y o
f S
HK
OD
RA

53
Go
als
O
bje
cti
ves
P
rogram
mes
P
roje
cts
No.
G2:O
1:P
G1:p
1:
Pre
serv
atio
n, re
sto
rati
on
and
dev
elo
pm
ent
of
the
city
's m
use
um
an
d i
ts c
oll
ecti
on
, as
wel
l as
oth
er
his
tori
cal,
cu
ltu
ral
item
s in
the
city
31
G2:O
1:P
G1:p
2:
Cre
atio
n o
f a
syst
em f
or
iden
tifi
cati
on
,
val
uat
ion
and
pu
rch
asin
g o
f m
use
um
art
efac
ts
32
G2:O
1:P
G1:p
3:
Reh
abil
itat
ion
and
per
iod
ic e
xh
ibit
ion
of
the
Muse
um
's h
isto
rica
l ar
chiv
e 33
G2:O
1:P
G1:p
4:
Per
iodic
num
ism
atic
s ex
hib
itio
n o
f
‘Mo
net
ary
cir
cula
tio
n i
n t
he
reg
ion
of
Sh
ko
dra
’ 34
G2
:O1
:PG
1:p
5:
Incr
ease
th
e n
um
ber
of
dis
pla
ys
exh
ibit
ed i
n
the
Arc
hae
olo
gic
al M
use
um
35
G2:O
1:P
G1:p
6:
Imp
rov
emen
t o
f th
e en
vir
on
men
t of
the
Mig
jen
i T
hea
tre
36
G2:O
1:P
G1:p
7:
Reh
abil
itat
ion
of
the
city
's C
ult
ura
l C
entr
e
37
G2:O
1:P
G1:p
8:
Pro
mo
tion
of
the
pho
tog
raph
co
llec
tion
of
the
Mar
ub
i M
use
um
38
G2:O
1:P
G1
:
Go
od a
dm
inis
trat
ion a
nd
dis
pla
y i
n S
hko
dra
of
the
city
's c
ult
ura
l her
itag
e
G2:O
1:P
G1:p
9:
Res
tora
tio
n o
f tr
adit
ion
al h
ou
ses
in t
he
city
39
G2:O
1:P
G2:p
1:
Est
abli
shm
ent
of
a C
om
mis
sio
n f
or
the
Dev
elo
pm
ent
of
Art
an
d C
ult
ure
40
G2:O
1:P
G2:p
2:
Est
abli
shm
ent
of
a ci
ty o
rch
estr
a 41
G2:O
1:P
G2:p
3:
Ho
ldin
g o
f a
Su
mm
er's
Day
fes
tiv
al i
n
Sh
kod
ra
42
G2:O
1:P
G2:p
4:
Ho
ldin
g o
f a
Car
niv
al i
n S
hk
od
ra
43
G2:O
1:P
G2:p
5:
Ho
ldin
g o
f an
an
nu
al s
on
g c
onte
st
44
G2:O
1:P
G2:p
6:
Dev
elo
pm
ent
and
pu
bli
cati
on
of
pro
moti
on
al m
ater
ials
rel
ated
to
th
e cu
ltu
ral
her
itag
e o
f th
e
city
45
Goal
2:
Dev
elop
men
t an
d
pre
serv
ati
on
of
the
cult
ura
l, h
isto
rica
l a
nd
art
isti
c tr
ad
itio
ns
an
d
va
lues
of
Sh
kod
ra a
nd
thei
r p
rom
oti
on
to
th
e
ben
efi
t of
tou
rism
dev
elop
men
t
G2:O
1:
Incr
ease
fro
m 5
0 p
er y
ear
to
70 p
er y
ear
the
nu
mb
er o
f
cult
ura
l an
d a
rtis
tic
acti
vit
ies
hel
d i
n S
hk
od
ra b
y t
he
yea
r
201
0
G2:O
1:P
G2
:
Rei
ntr
odu
ctio
n a
nd
pro
mo
tio
n o
f tr
adit
ion
al
his
tori
cal
and
cult
ura
l
even
ts
G2:O
1:P
G2:p
7:
Pre
par
atio
n a
nd
pub
lica
tion
of
a ca
lend
ar o
f
annu
al c
ult
ura
l ac
tivit
ies
to b
e h
eld
in
Sh
ko
dra
46

54
MU
NIC
IP
AL
IT
Y o
f S
HK
OD
RA
Go
als
O
bje
ctiv
es
P
rog
ram
mes
P
roje
cts
No.
G3:O
1:P
G1:p
1:
Reh
abil
itat
ion
of
exis
tin
g, an
d c
on
stru
ctio
n
of
new
, te
achin
g f
acil
itie
s in
Lu
igj
Gu
rak
uqi
Un
iver
sity
47
G3
:O1
:PG
1:p
2:
Con
stru
ctio
n o
f st
ud
ent
resi
den
ce a
t L
uig
j
Gu
rak
uqi
Un
iver
sity
48
G3:O
1:P
G1:
Impro
vem
ent
of
infr
astr
uct
ure
for
acco
mm
odat
ion,
teac
hin
g
and
oth
er s
tuden
t se
rvic
es a
t
the
univ
ersi
ty
G3:O
1:P
G1:p
3:
Con
stru
ctio
n o
f a
new
lib
rary
in
Luig
j
Gu
rak
uqi
Un
iver
sity
49
G3:O
1:P
G2:p
1:
Est
abli
shm
ent
of
an A
rts
Aca
dem
y a
t L
uig
j
Gu
rak
uqi
Un
iver
sity
50
G3:O
1:P
G2:p
2:
Dev
elopm
ent
by t
he
Eco
nom
ics
and L
aw
Fac
ult
y o
f L
uig
j G
ura
ku
qi
Un
iver
sity
of
curr
icu
la f
or
tou
rism
and
fo
r p
ub
lic
adm
inis
trat
ion
tra
inin
g
51
G3:O
1:P
G2:
Incr
ease
the
qu
alit
y a
nd
sco
pe
of
the
curr
icu
lum
an
d
teac
hin
g a
t th
e univ
ersi
ty
G3:O
1:P
G2:p
3:
Imp
lem
enta
tio
n o
f a
dis
tan
ce l
earn
ing
pro
ject
at
Lu
igj
Gu
rak
uqi
Un
iver
sity
52
G3
:O1
:PG
3:p
1:
Dev
elo
pm
ent
and
im
ple
men
tati
on
of
a
pro
gra
mm
e fo
r ex
chan
ge
of
scie
nti
fic
and
tec
hnic
al
kno
wle
dg
e b
etw
een
Lu
igj
Gu
rak
uq
i U
niv
ersi
ty a
nd
univ
ersi
ties
in
th
e re
gio
n a
nd
els
ewh
ere
53
G3:O
1:P
G3:p
2:
Est
abli
sh a
fundin
g s
yst
em a
t L
uig
j
Gu
rak
uqi
Un
iver
sity
to
su
pport
an
d i
ncr
ease
res
earc
h
cap
acit
ies
and
to
ensu
re k
no
wle
dg
e tr
ansf
er i
n t
he
fiel
d o
f re
gio
nal
eco
nom
ic d
evel
op
men
t
54
G3:O
1:
Incr
ease
fro
m 4
,50
0 t
o 7
,50
0
the
nu
mb
er o
f st
ud
ents
gra
du
atin
g f
rom
Shk
odra
's
Lu
igj
Gura
ku
qi
Un
iver
sity
by
the
yea
r 2
01
2, w
ith
a
qu
alit
ativ
e im
pro
vem
ent
of
univ
ersi
ty f
acil
itie
s an
d
teac
hin
g s
tan
dar
ds
G3:O
1:P
G3:
Est
abli
shm
ent
of
sust
ained
par
tner
ship
s an
d l
ink
s in
the
con
tex
t o
f re
gio
nal
dev
elop
men
t G
3:O
1:P
G3:p
3:
Rec
ruit
men
t an
d d
evel
op
men
t of
qu
alif
ied
acad
emic
sta
ff a
t L
uig
j G
ura
ku
qi
Un
iver
sity
to
a l
evel
allo
win
g f
or
qu
alit
y t
each
ing
an
d t
o t
he
stan
dar
ds
of
the
Bo
log
na
Dec
lara
tio
n
55
G3
:O2
:PG
1:p
1:
Reh
abil
itat
ion
of
Pre
ng
Jak
ov
a M
iddle
Sch
ool
56
G3:O
2:P
G1:p
2:
Reh
abil
itat
ion
of
Sk
end
erbeg
9-Y
ear
Sch
ool
57
Goal
3:
Th
e ci
ty a
s a
hig
her
edu
cati
on
cen
tre
for
No
rth
Alb
an
ia,
wit
h i
ts
un
iver
sity
as
a k
ey f
act
or
in c
reati
ng a
n e
du
cate
d
work
forc
e th
rou
gh
incr
easi
ng a
nd
im
pro
vin
g
the
level
of
aca
dem
ic a
nd
pro
fess
ion
al
edu
cati
on
G3:O
2:
Incr
ease
by
yea
r 20
06 t
he
nu
mb
er o
f p
re-u
niv
ersi
ty
edu
cati
on f
acil
itie
s th
at a
re i
n
qu
alit
ativ
e an
d o
pti
mal
condit
ion
G3:O
2:P
G1:
Rec
on
stru
ctio
n o
f S
hk
odra
's
pre
-univ
ersi
ty e
duca
tion
faci
liti
es
G3:O
2:P
G1:p
3:
Reh
abil
itat
ion
of
Gu
erri
le K
ind
erg
arte
n
58

55
Go
als
O
bje
ctiv
es
Pro
gra
mm
es
Pro
ject
s N
o.
G4
:O1
:PG
1:p
1:
Dev
elop
men
t of
a co
mp
reh
ensi
ve
reg
ula
tory
urb
an p
lan
fo
r th
e ci
ty
59
G4
:O1
:PG
1:p
2:
Dev
elop
men
t of
a p
arti
al u
rban
pla
n f
or
the
Sh
irok
ë –
Zo
gaj
are
a 60
G4
:O1
:PG
1:p
3:
Dev
elop
men
t of
par
tial
urb
an p
lan
s fo
r th
e
area
s o
f M
ark
Lu
laj,
Har
dh
ijat
e E
gra
an
d Z
oo
tek
nik
ë 61
G4
:O1
:
Dev
elo
pm
ent
of
the
legal
and
tech
nic
al t
oo
ls n
eces
sary
for
qu
alit
y u
rban
pla
nnin
g a
nd
man
agem
ent
of
the
city
's
terr
ito
ry b
y t
he
yea
r 2
01
0
G4
:O1
:PG
1:
Impro
vem
ent
of
the
pla
nnin
g t
ools
for
urb
an
dev
elo
pm
ent
and
man
agem
ent
of
the
city
G
4:O
1:P
G1
:p4
: D
evel
op
men
t of
an a
ctio
n p
lan
fo
r
imp
lem
enta
tion
of
the
com
pre
hen
siv
e re
gula
tory
urb
an p
lan
and
par
tial
urb
an p
lan
s 62
G4
:O2
:PG
1:p
1:
Rec
on
stru
ctio
n o
f 15
str
eets
of
the
city
(An
nex
4)
63
G4:O
2:P
G1:p
2:
Rec
onst
ruct
ion o
f pav
emen
ts in 1
2 s
tree
ts
(Annex
4)
64
G4
:O2
:PG
1:
Reh
abil
itat
ion
of
the
city
's
stre
et s
yst
em
G4
:O2
:PG
1:p
3:
Rec
on
stru
ctio
n o
f th
e p
ubli
c li
ghti
ng
of
8
stre
ets
(An
nex
4)
65
G4
:O2
:
Reh
abil
itat
ion
of
40
% o
f th
e
city
's s
tree
ts,
wit
h p
rovis
ion o
f
dra
inag
e, p
avem
ents
and
pu
bli
c li
ghti
ng b
y t
he
yea
r
20
10
G4
:O2
:PG
2:
Reh
abil
itat
ion
of
the
city
's
wat
er d
rain
age
syst
em
G4
:O2
:PG
2:p
1:
Reh
abil
itat
ion
of
5 s
urf
ace
wat
er d
rain
age
outl
ets
fro
m t
he
city
(A
nn
ex 4
) 66
G4
:O3
:PG
1:p
1:
Reh
abil
itat
ion
of
the
city
's s
ewag
e p
um
pin
g
stat
ion
67
G4
:O3
:PG
1:p
2:
Con
stru
ctio
n a
nd
reh
abil
itat
ion
of
sew
age
dis
char
ge
pip
es
68
G4
:O3
:PG
1:p
3:
Imp
rov
emen
t of
sew
age
syst
em
mai
nte
nan
ce t
ech
nolo
gy
69
Go
al
4:
A c
ity w
ith
qu
ali
tati
ve
con
tem
po
rary
sta
nd
ard
s
of
infr
ast
ruct
ure
an
d
pu
bli
c se
rvic
es t
hat
stim
ula
te a
nd
su
pp
ort
sust
ain
ab
le d
evel
op
men
t
of
the
loca
l ec
on
om
y i
n
harm
on
y w
ith
th
e
envir
on
men
t
G4
:O3
:
Incr
ease
fro
m 1
5,0
00 t
o
24
,80
0 t
he
nu
mb
er o
f fa
mil
ies
and
busi
nes
ses
con
nec
ted
to
the
sew
age
syst
em b
y t
he
yea
r
20
10
G4
:O3
:PG
1:
Reh
abil
itat
ion
of
the
city
's
sew
er s
yst
em
G4
:O3
:PG
1:p
4:
Con
stru
ctio
n o
f n
ew p
ipel
ines
fo
r se
wer
sy
stem
70

56
MU
NIC
IP
AL
IT
Y o
f S
HK
OD
RA
Go
als
O
bje
ctiv
es
P
rogra
mm
es
Pro
ject
s N
o.
G4
:O4
:PG
1:p
1:
Co
mp
lete
co
nst
ruct
ion
of
mai
ns
wat
er
sup
ply
res
erv
oir
s in
Tep
e H
ills
71
G4
:O4
:PG
1:p
2:
Inst
alla
tio
n o
f n
ew v
alv
es i
n t
he
mai
ns
wat
er d
istr
ibuti
on
syst
em
72
G4
:O4
:PG
1:p
3:
Reh
abil
itat
ion
of
the
rest
of
the
mai
ns
wat
er
dis
trib
uti
on
net
wo
rk
73
G4:O
4:
Incr
ease
fro
m 2
2,7
00 t
o
24,8
00 t
he
nu
mb
er o
f fa
mil
ies
and b
usi
nes
ses
connec
ted t
o
the
mai
ns
wat
er s
yst
em b
y t
he
yea
r 2010
G4:O
4:P
G1:
Reh
abil
itat
ion
of
the
mai
ns
wat
er s
yst
em
G4
:O4
:PG
1:p
4:
Inst
alla
tio
n o
f au
xil
iary
equ
ipm
ent
for
mai
ns
wat
er m
anag
emen
t 74
G4:O
5:P
G1:
Impro
ved
gre
enin
g o
f th
e
city
's s
tree
ts
G4:O
5:P
G1:p
1:
Reh
abil
itat
ion
of
the
gre
enin
g o
f th
e ci
ty's
mai
n s
tree
ts
75
G4
:O5
:PG
2:p
1:
Reh
abil
itat
ion
of
the
gre
en s
pac
e b
y t
he
Baz
aar
76
G4:O
5:P
G2:
Reh
abil
itat
ion
of
the
mai
n
publi
c par
ks
G4
:O5
:PG
2:p
2:
Reh
abil
itat
ion
of
Luig
j G
ura
ku
qi
Par
k
77
G4
:O5
:PG
3:p
1:
Co
nst
ruct
ion
of
a n
ew g
reen
sp
ace
in t
he
Xh
abij
e re
sid
enti
al a
rea
78
G4
:O5
:PG
3:p
2:
Con
stru
ctio
n o
f a
new
gre
en s
pac
e al
ong
Is
uf
So
ko
li S
tree
t in
th
e B
acja
e C
akaj
ve
resi
den
tial
are
a 79
G4:O
5:
Incr
ease
by
45%
the
tota
l si
ze
of
the
city
's g
reen
are
as b
y t
he
yea
r 2010
G4:O
5:P
G3:
Cre
atio
n o
f n
ew g
reen
sit
es
in r
esid
enti
al a
reas
G
4:O
5:P
G3
:p3
: C
on
stru
ctio
n o
f a
gre
en a
rea
in t
he
Zd
rale
nei
gh
bou
rho
od
80
G4:O
6:P
G1:p
1:
Co
nst
ruct
ion
of
a la
nd
fill
fo
r u
rban
so
lid
was
te d
isp
osa
l
81
G4
:O6
:PG
1:p
2:
Imp
rov
emen
t of
the
tech
no
log
y f
or
coll
ecti
on
, tr
ansp
ort
atio
n a
nd
man
agem
ent
of
mu
nic
ipal
so
lid
was
te
82
Goal
4:
A c
ity w
ith
qu
ali
tati
ve
con
tem
po
rary
sta
nd
ard
s
of
infr
ast
ruct
ure
an
d
pu
bli
c se
rvic
es t
ha
t
stim
ula
te a
nd
su
pp
ort
sust
ain
ab
le d
evel
op
men
t
of
the
loca
l ec
on
om
y i
n
ha
rmo
ny
wit
h t
he
env
iro
nm
ent
G4:O
6:
Incr
ease
fro
m 3
52,5
88 m
² to
559,6
45 m
² th
e ar
ea o
f th
e ci
ty
cover
ed b
y t
he
was
te
coll
ecti
on s
ervic
e by
th
e y
ear
201
0
G4:O
6:P
G1:
Impro
vem
ent
of
the
man
agem
ent
of
munic
ipal
soli
d w
aste
G
4:O
6:P
G1
:p3
: D
evel
op
men
t of
an a
war
enes
s ca
mp
aig
n
‘Kee
p S
hk
od
ra C
lean
’ 83
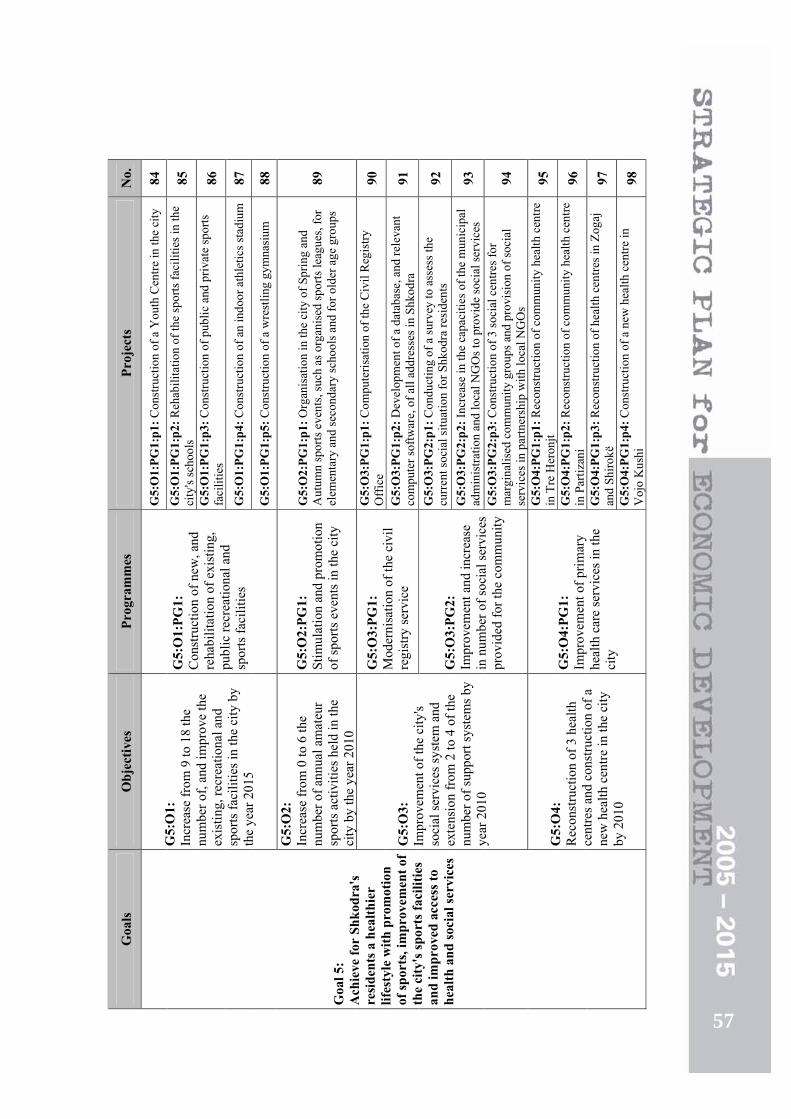
57
Go
als
O
bje
ctiv
es
P
rogra
mm
es
Pro
ject
s N
o.
G5
:O1
:PG
1:p
1:
Co
nst
ruct
ion
of
a Y
ou
th C
entr
e in
th
e ci
ty
84
G5
:O1
:PG
1:p
2:
Reh
abil
itat
ion
of
the
spo
rts
faci
liti
es i
n t
he
city
's s
choo
ls
85
G5
:O1
:PG
1:p
3:
Con
stru
ctio
n o
f pub
lic
and
pri
vat
e sp
ort
s
faci
liti
es
86
G5
:O1
:PG
1:p
4:
Co
nst
ruct
ion
of
an i
nd
oo
r at
hle
tics
sta
diu
m87
G5:O
1:
Incr
ease
fro
m 9
to 1
8 t
he
nu
mber
of,
and i
mpro
ve
the
exis
tin
g, re
crea
tional
an
d
spo
rts
faci
liti
es i
n t
he
city
by
the
yea
r 20
15
G5:O
1:P
G1:
Const
ruct
ion o
f new
, an
d
rehab
ilit
atio
n o
f ex
isti
ng,
pu
bli
c re
crea
tion
al a
nd
spo
rts
faci
liti
es
G5
:O1
:PG
1:p
5:
Co
nst
ruct
ion
of
a w
rest
ling
gy
mn
asiu
m
88
G5:O
2:
Incr
ease
fro
m 0
to
6 t
he
nu
mb
er o
f an
nu
al a
mat
eur
spo
rts
acti
vit
ies
hel
d i
n t
he
city
by
the
yea
r 2
01
0
G5:O
2:P
G1:
Sti
mu
lati
on a
nd
pro
mo
tio
n
of
sport
s ev
ents
in
the
city
G5
:O2
:PG
1:p
1:
Org
anis
atio
n i
n t
he
city
of
Sp
rin
g a
nd
Au
tum
n s
po
rts
even
ts, su
ch a
s o
rgan
ised
sp
ort
s le
agu
es, fo
r
elem
enta
ry a
nd s
eco
nd
ary
sch
ools
and
fo
r old
er a
ge
gro
up
s 89
G5
:O3
:PG
1:p
1:
Co
mpu
teri
sati
on
of
the
Civ
il R
egis
try
Off
ice
90
G5:O
3:P
G1:
Mo
der
nis
atio
n o
f th
e ci
vil
regis
try
ser
vic
e G
5:O
3:P
G1
:p2
: D
evel
op
men
t of
a d
atab
ase,
an
d r
elev
ant
com
pute
r so
ftw
are,
of
all
add
ress
es i
n S
hko
dra
91
G5
:O3
:PG
2:p
1:
Co
nd
uct
ing
of
a su
rvey
to
ass
ess
the
curr
ent
soci
al s
itu
atio
n f
or
Sh
kod
ra r
esid
ents
92
G5
:O3
:PG
2:p
2:
Incr
ease
in
th
e ca
pac
itie
s of
the
mu
nic
ipal
adm
inis
trat
ion
an
d l
oca
l N
GO
s to
pro
vid
e so
cial
ser
vic
es
93
G5:O
3:
Impro
vem
ent
of
the
city
's
soci
al s
erv
ices
sy
stem
an
d
exte
nsi
on f
rom
2 t
o 4
of
the
nu
mber
of
supp
ort
sy
stem
s by
yea
r 2010
G5:O
3:P
G2:
Impro
vem
ent
and i
ncr
ease
in n
um
ber
of
soci
al s
ervic
es
pro
vid
ed f
or
the
com
mu
nit
yG
5:O
3:P
G2
:p3
: C
on
stru
ctio
n o
f 3
so
cial
cen
tres
fo
r
mar
gin
alis
ed c
om
mu
nit
y g
rou
ps
and
pro
vis
ion
of
soci
al
serv
ices
in
par
tner
ship
wit
h l
oca
l N
GO
s 94
G5
:O4
:PG
1:p
1:
Rec
on
stru
ctio
n o
f co
mm
un
ity
hea
lth
cen
tre
in T
re H
ero
njt
95
G5
:O4
:PG
1:p
2:
Rec
on
stru
ctio
n o
f co
mm
unit
y h
ealt
h c
entr
e
in P
arti
zan
i
96
G5
:O4
:PG
1:p
3:
Rec
on
stru
ctio
n o
f h
ealt
h c
entr
es i
n Z
og
aj
and
Sh
iro
kë
97
Goal
5:
Ach
ieve
for
Sh
ko
dra
's
resi
den
ts a
hea
lth
ier
life
style
wit
h p
rom
oti
on
of
spo
rts,
im
pro
vem
ent
of
the
city
's s
po
rts
faci
liti
es
an
d i
mp
roved
acc
ess
to
hea
lth
an
d s
oci
al
serv
ices
G5:O
4:
Rec
on
stru
ctio
n o
f 3 h
ealt
h
centr
es a
nd c
onst
ruct
ion o
f a
new
hea
lth c
entr
e in
the
city
by
2010
G5:O
4:P
G1:
Impro
vem
ent
of
pri
mar
y
hea
lth c
are
serv
ices
in t
he
city
G
5:O
4:P
G1
:p4
: C
on
stru
ctio
n o
f a
new
hea
lth
cen
tre
in
Vo
jo K
ush
i
98

58
MU
NIC
IP
AL
IT
Y o
f S
HK
OD
RA
c.Im
plem
enta
tion
Mat
rix
of t
he S
trat
egic
Pla
n
Acr
onym
s ar
e re
port
ed in
Ann
ex 1
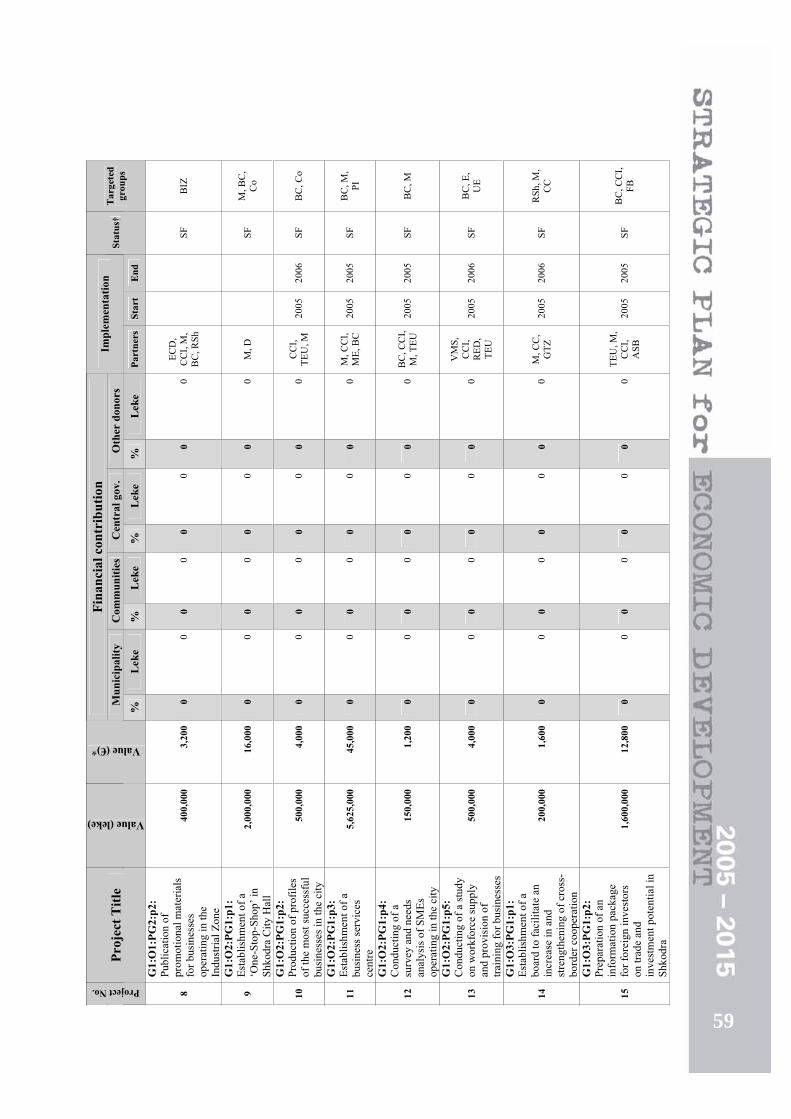
59

60
MU
NIC
IP
AL
IT
Y o
f S
HK
OD
RA

61

62
MU
NIC
IP
AL
IT
Y o
f S
HK
OD
RA

63
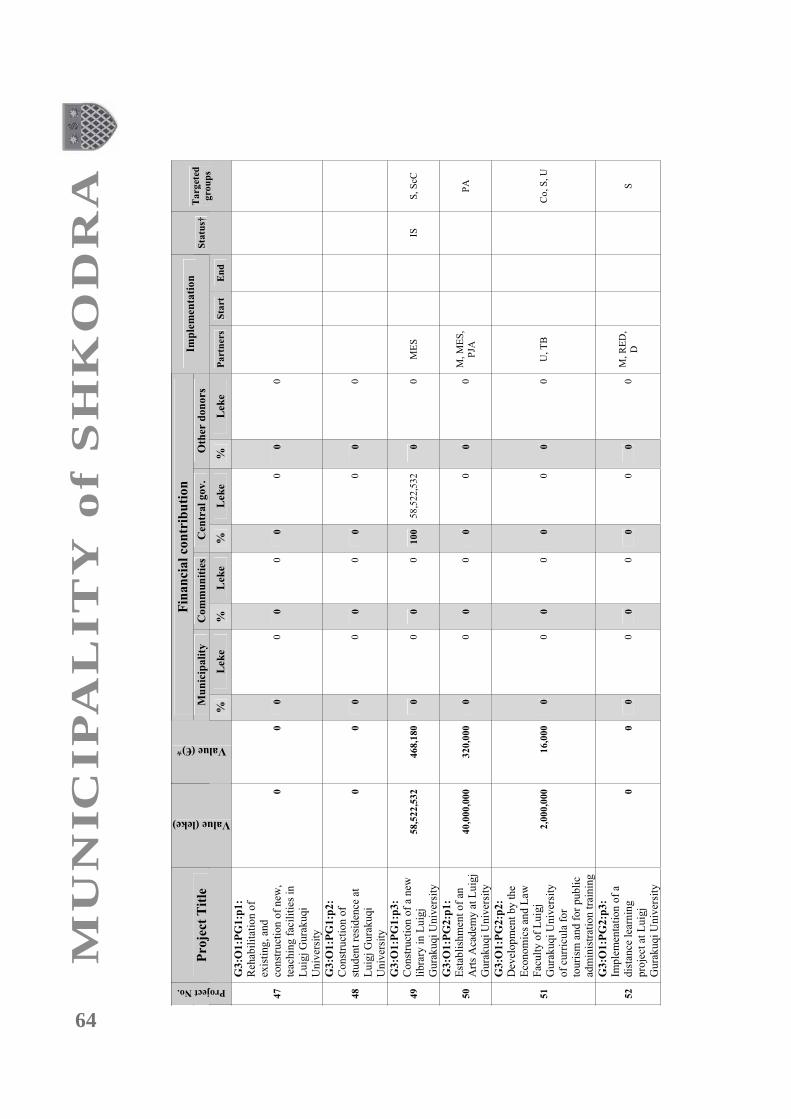
64
MU
NIC
IP
AL
IT
Y o
f S
HK
OD
RA

65
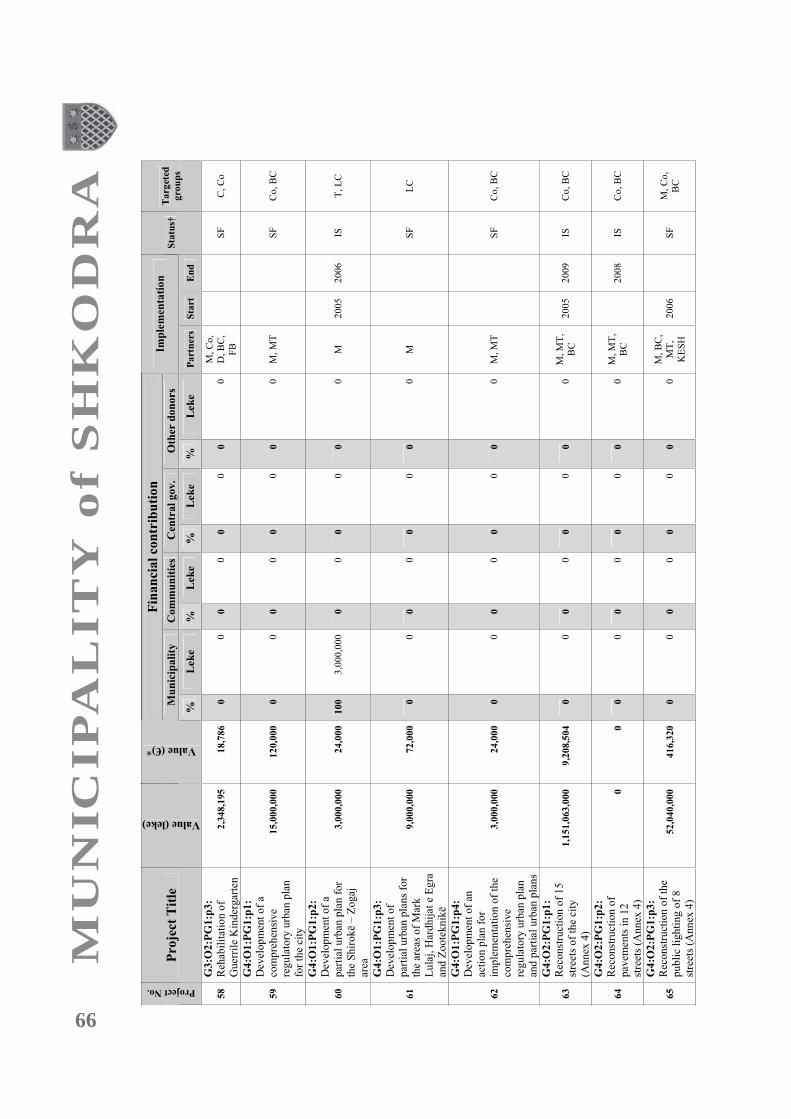
66
MU
NIC
IP
AL
IT
Y o
f S
HK
OD
RA
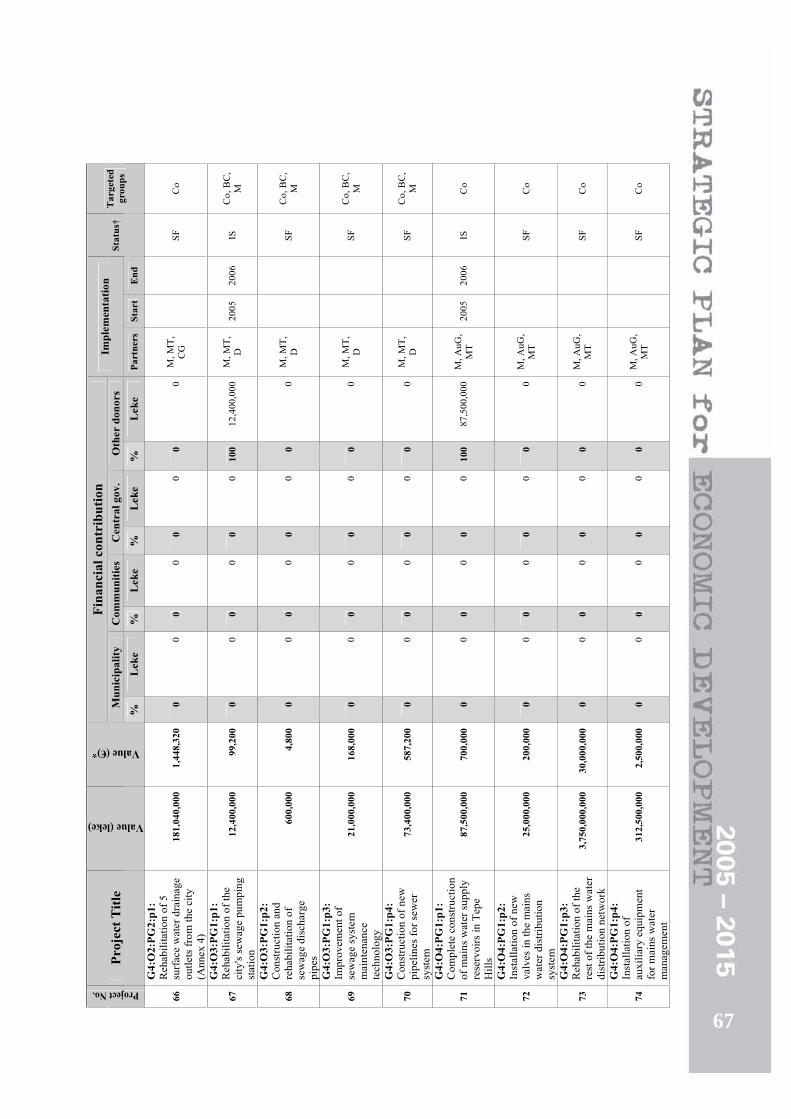
67

68
MU
NIC
IP
AL
IT
Y o
f S
HK
OD
RA

69
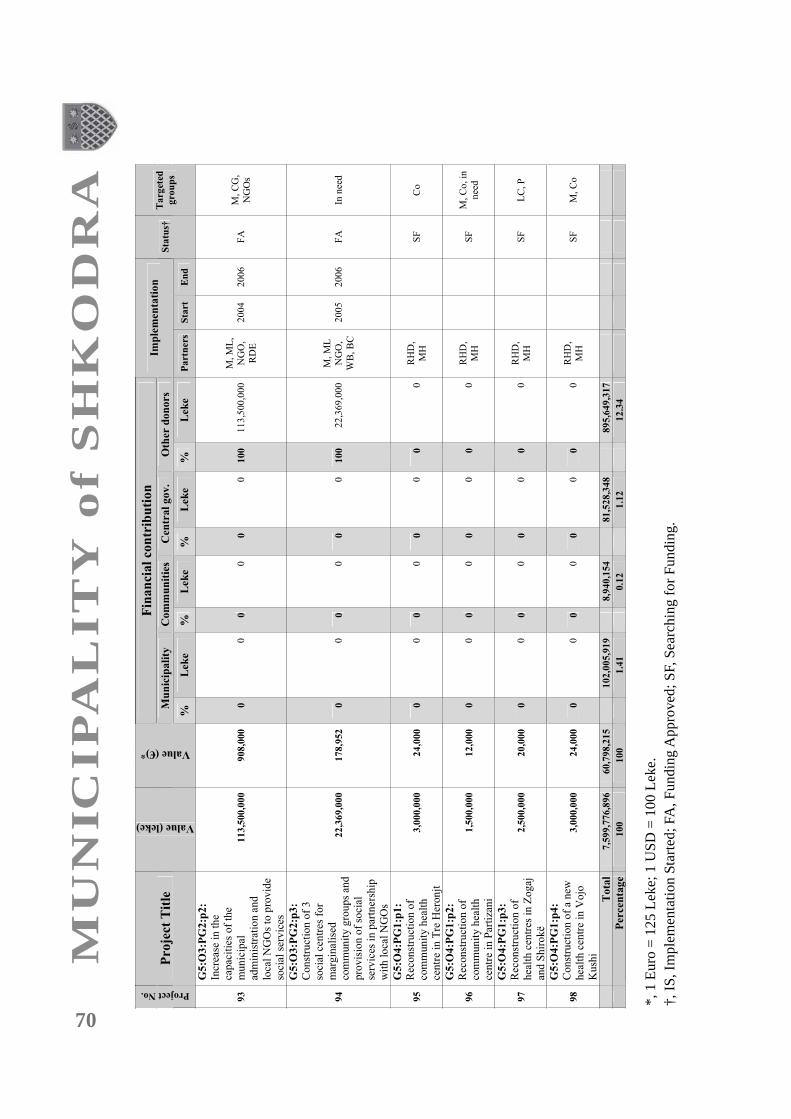
70
MU
NIC
IP
AL
IT
Y o
f S
HK
OD
RA
*, 1
Eur
o =
125
Lek
e; 1
US
D =
100
Lek
e.†,
IS
, Im
plem
enta
tion
Sta
rted
; FA
, Fun
ding
App
rove
d; S
F, S
earc
hing
for
Fun
ding
.

71
pp
j
Project Priority No.
Pro
ject
Cod
e
Project Matrix No.
Pro
ject
Tit
le
Ha
rd
/
Soft
Identified sources found
(High/Medium/Low)
Guarantee found (Yes/No)
Expertise available
(Yes/Possible/No)
Implemented previously
(Yes/No)
Risk level
(High/Medium/Low)
Target group
(General/Specific/Small)
Fulfilment of objectives
1
G1
:O3
:PG
1:p
5
18
E
stab
lish
men
t o
f a
syst
em f
or
inte
gra
ted
man
agem
ent
of
Lak
e S
hkodra
eco
syst
em
H
H
Yes
Y
es
No
L
G
3
2
G5
:O3
:PG
1:p
2
91
D
evel
op
men
t o
f a
dat
abas
e, a
nd
rel
evan
t co
mp
ute
r so
ftw
are,
of
all
add
ress
es i
n S
hk
od
ra
S
M
Yes
Y
es
No
L
G
1
3
G3
:O1
:PG
1:p
3
49
C
on
stru
ctio
n o
f a
new
lib
rary
in
Lu
igj
Gu
rak
uqi
Un
iver
sity
H
H
Y
es
Yes
N
o
L
Sp
2
4
G1
:O1
:PG
1:p
1
1
Imp
rov
emen
t o
f th
e el
ectr
icit
y s
up
ply
wit
hin
In
du
stri
al Z
on
e H
H
Y
es
Yes
Y
es
H
Sp
3
5
G1
:O3
:PG
1:p
6
19
M
ake
op
erat
ion
al a
lak
e tr
ansp
ort
atio
n s
ervic
e b
etw
een
Sh
kod
ra
and
Vir
paz
ar, M
on
ten
egro
H
H
Y
es
P
No
M
S
p
2
6
G1
:O4
:PG
1:p
1
20
C
on
stru
ctio
n i
n t
he
city
of
a p
ub
lic
wh
ole
sale
mar
ket
pla
ce f
or
fru
it a
nd
veg
etab
les
H
H
Yes
Y
es
Yes
L
G
1
7
G4
:O3
:PG
1:p
1
67
R
ehab
ilit
atio
n o
f th
e ci
ty's
sew
age
pu
mp
ing
sta
tio
n
H
M
Yes
Y
es
Yes
M
G
2
8
G1
:O1
:PG
1:p
4
4
Reh
abil
itat
ion
of
road
infr
astr
uct
ure
wit
hin
In
du
stri
al Z
on
e H
H
Y
es
Yes
Y
es
M
Sp
3
9
G4
:O3
:PG
1:p
2
68
C
on
stru
ctio
n a
nd
reh
abil
itat
ion
of
sew
age
dis
char
ge
pip
es
H
M
No
Y
es
Yes
L
G
2
10
G
4:O
6:P
G1
:p1
8
1
Co
nst
ruct
ion
of
a la
ndfi
ll f
or
urb
an s
oli
d w
aste
dis
po
sal
H
H
Yes
P
N
o
M
G
2
11
G
4:O
4:P
G1
:p3
7
3
Reh
abil
itat
ion
of
the
rest
of
the
mai
ns
wat
er d
istr
ibu
tio
n n
etw
ork
H
M
Y
es
Yes
Y
es
L
G
2
12
G
3:O
2:P
G1
:p1
5
6
Reh
abil
itat
ion
of
Pre
ng
Jak
ov
a M
idd
le S
cho
ol
H
M
No
Y
es
Yes
M
S
p
3
13
G
3:O
2:P
G1
:p2
5
7
Reh
abil
itat
ion o
f S
ken
der
beg
9-Y
ear
Sch
oo
l H
M
N
o
Yes
Y
es
M
Sp
3
14
G
3:O
2:P
G1
:p3
5
8
Reh
abil
itat
ion
of
Gu
erri
le K
ind
erg
arte
n
H
M
No
Y
es
Yes
M
S
p
3
15
G
4:O
2:P
G1
:p2
6
4
Rec
on
stru
ctio
n o
f p
avem
ents
in
12
str
eets
(A
nn
ex 4
) H
M
Y
es
Yes
Y
es
M
G
2
16
G
4:O
6:P
G1
:p3
8
3
Dev
elo
pm
ent
of
an a
war
enes
s ca
mp
aig
n ‘
Kee
p S
hk
od
ra C
lean
’ S
H
N
o
Yes
N
o
M
G
3
17
G
5:O
1:P
G1
:p1
8
4
Co
nst
ruct
ion
of
a Y
ou
th C
entr
e in
th
e ci
ty
H
M
No
Y
es
No
M
S
p
3
18
G
2:O
1:P
G1
:p6
3
6
Imp
rov
emen
t o
f th
e en
vir
on
men
t of
the
Mig
jen
i T
hea
tre
H
M
No
Y
es
Yes
L
G
2
19
G
4:O
2:P
G1
:p1
6
3
Rec
on
stru
ctio
n o
f 1
5 s
tree
ts o
f th
e ci
ty (
An
nex
4)
H
M
No
Y
es
Yes
M
G
2
20
G
2:O
1:P
G1
:p5
3
5
Incr
ease
th
e n
um
ber
of
dis
pla
ys
exh
ibit
ed i
n t
he
Arc
hae
olo
gic
al
Mu
seu
m
H
M
No
Y
es
Yes
M
G
1
21
G
4:O
3:P
G1
:p3
6
9
Imp
rov
emen
t o
f se
wag
e sy
stem
mai
nte
nan
ce t
ech
no
log
y
H
M
No
Y
es
Yes
L
G
2
22
G
2:O
1:P
G2
:p5
4
4
Ho
ldin
g o
f an
an
nu
al s
on
g c
on
test
S
H
N
o
Yes
Y
es
L
G
1
23
G
1:O
3:P
G1
:p1
1
4
Est
abli
shm
ent
of
a b
oar
d t
o f
acil
itat
e an
in
crea
se i
n a
nd
st
ren
gth
enin
g o
f cr
oss
-bo
rder
co
op
erat
ion
S
H
Y
es
Yes
N
o
M
G
1
24
G
4:O
3:P
G1
:p4
7
0
Co
nst
ruct
ion
of
new
pip
elin
es f
or
sew
er s
yst
em
H
M
No
Y
es
Yes
L
G
2
d.M
atri
x of
pri
orit
isat
ion
of p
roje
cts
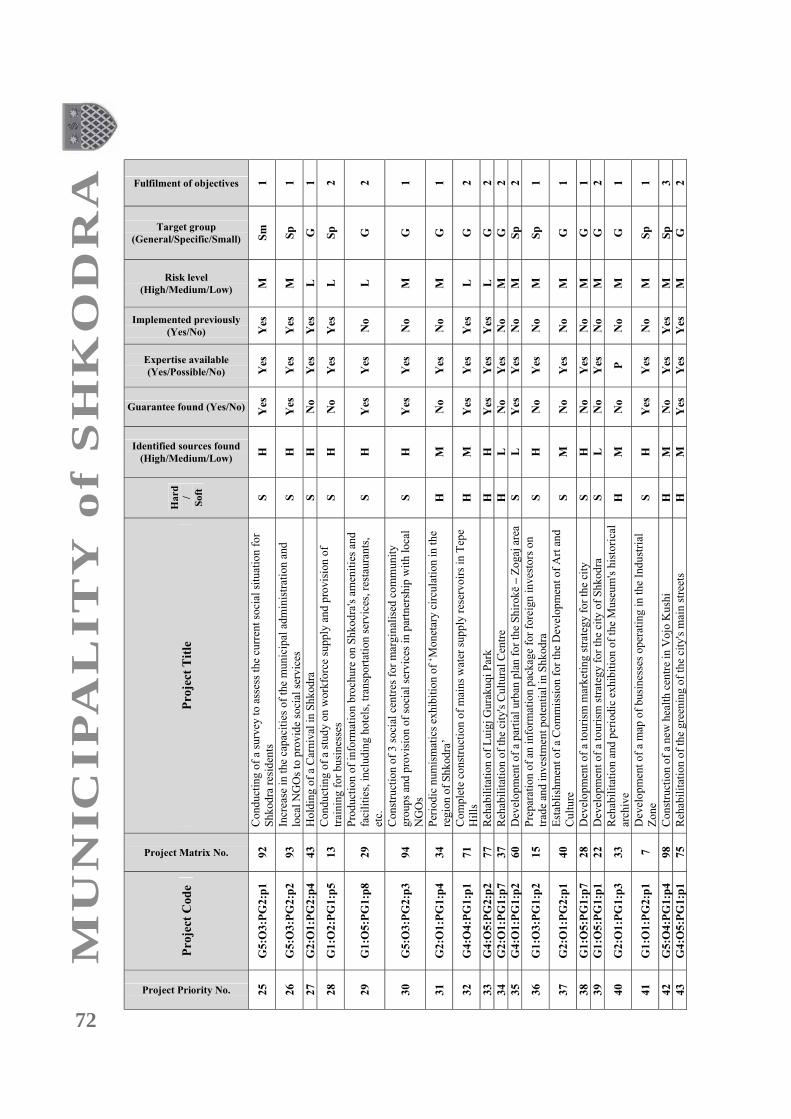
72
MU
NIC
IP
AL
IT
Y o
f S
HK
OD
RA
Project Priority No.
Pro
ject
Cod
e
Project Matrix No.
Pro
ject
Tit
le
Ha
rd
/
Soft
Identified sources found
(High/Medium/Low)
Guarantee found (Yes/No)
Expertise available
(Yes/Possible/No)
Implemented previously
(Yes/No)
Risk level
(High/Medium/Low)
Target group
(General/Specific/Small)
Fulfilment of objectives
25
G
5:O
3:P
G2
:p1
9
2
Conduct
ing o
f a
surv
ey t
o a
sses
s th
e cu
rren
t so
cial
sit
uat
ion f
or
Sh
kod
ra r
esid
ents
S
H
Y
es
Yes
Y
es
M
Sm
1
26
G
5:O
3:P
G2
:p2
9
3
Incr
ease
in
th
e ca
pac
itie
s of
the
mu
nic
ipal
adm
inis
trat
ion
and
loca
l N
GO
s to
pro
vid
e so
cial
ser
vic
es
S
H
Yes
Y
es
Yes
M
S
p
1
27
G
2:O
1:P
G2
:p4
4
3
Ho
ldin
g o
f a
Car
niv
al i
n S
hk
od
ra
S
H
No
Y
es
Yes
L
G
1
28
G
1:O
2:P
G1
:p5
1
3
Co
ndu
ctin
g o
f a
stu
dy
on
wo
rkfo
rce
supply
an
d p
rovis
ion
of
trai
nin
g f
or
busi
nes
ses
S
H
No
Y
es
Yes
L
S
p
2
29
G
1:O
5:P
G1
:p8
2
9
Pro
du
ctio
n o
f in
form
atio
n b
roch
ure
on
Sh
kod
ra's
am
enit
ies
and
faci
liti
es, in
clud
ing
ho
tels
, tr
ansp
ort
atio
n s
erv
ices
, re
stau
ran
ts,
etc.
S
H
Y
es
Yes
N
o
L
G
2
30
G
5:O
3:P
G2
:p3
9
4
Co
nst
ruct
ion
of
3 s
oci
al c
entr
es f
or
mar
gin
alis
ed c
om
mu
nit
y
gro
up
s an
d p
rov
isio
n o
f so
cial
ser
vic
es i
n p
artn
ersh
ip w
ith
lo
cal
NG
Os
S
H
Yes
Y
es
No
M
G
1
31
G
2:O
1:P
G1
:p4
3
4
Per
iod
ic n
um
ism
atic
s ex
hib
itio
n o
f ‘M
on
etar
y c
ircu
lati
on
in
th
e
reg
ion
of
Sh
ko
dra
’ H
M
N
o
Yes
N
o
M
G
1
32
G
4:O
4:P
G1
:p1
7
1
Co
mp
lete
co
nst
ruct
ion
of
mai
ns
wat
er s
up
ply
res
erv
oir
s in
Tep
e
Hil
ls
H
M
Yes
Y
es
Yes
L
G
2
33
G
4:O
5:P
G2
:p2
7
7
Reh
abil
itat
ion
of
Lu
igj
Gu
rak
uq
i P
ark
H
H
Y
es
Yes
Y
es
L
G
2
34
G
2:O
1:P
G1
:p7
3
7
Reh
abil
itat
ion
of
the
city
's C
ult
ura
l C
entr
e
H
L
No
Y
es
No
M
G
2
35
G
4:O
1:P
G1
:p2
6
0
Dev
elo
pm
ent
of
a p
arti
al u
rban
pla
n f
or
the
Sh
irok
ë –
Zo
gaj
are
a S
L
Y
es
Yes
N
o
M
Sp
2
36
G
1:O
3:P
G1
:p2
1
5
Pre
par
atio
n o
f an
info
rmat
ion p
ack
age
for
fore
ign
inv
esto
rs o
n
trad
e an
d i
nv
estm
ent
po
ten
tial
in
Sh
kod
ra
S
H
No
Y
es
No
M
S
p
1
37
G
2:O
1:P
G2
:p1
4
0
Est
abli
shm
ent
of
a C
om
mis
sio
n f
or
the
Dev
elop
men
t o
f A
rt a
nd
Cu
ltu
re
S
M
No
Y
es
No
M
G
1
38
G
1:O
5:P
G1
:p7
2
8
Dev
elo
pm
ent
of
a to
uri
sm m
ark
etin
g s
trat
egy f
or
the
city
S
H
N
o
Yes
N
o
M
G
1
39
G
1:O
5:P
G1
:p1
2
2
Dev
elo
pm
ent
of
a to
uri
sm s
trat
egy
fo
r th
e ci
ty o
f S
hk
od
ra
S
L
No
Y
es
No
M
G
2
40
G
2:O
1:P
G1
:p3
3
3
Reh
abil
itat
ion
an
d p
erio
dic
ex
hib
itio
n o
f th
e M
use
um
's h
isto
rica
l
arch
ive
H
M
No
P
N
o
M
G
1
41
G
1:O
1:P
G2
:p1
7
D
evel
op
men
t o
f a
map
of
bu
sin
esse
s o
per
atin
g i
n t
he
Ind
ust
rial
Zo
ne
S
H
Yes
Y
es
No
M
S
p
1
42
G
5:O
4:P
G1
:p4
9
8
Co
nst
ruct
ion
of
a n
ew h
ealt
h c
entr
e in
Vo
jo K
ush
i H
M
N
o
Yes
Y
es
M
Sp
3
43
G
4:O
5:P
G1
:p1
7
5
Reh
abil
itat
ion
of
the
gre
enin
g o
f th
e ci
ty's
mai
n s
tree
ts
H
M
Yes
Y
es
Yes
M
G
2

73
Project Priority No.
Pro
ject
Cod
e
Project Matrix No.
Pro
ject
Tit
le
Ha
rd
/
Soft
Identified sources found
(High/Medium/Low)
Guarantee found (Yes/No)
Expertise available
(Yes/Possible/No)
Implemented previously
(Yes/No)
Risk level
(High/Medium/Low)
Target group
(General/Specific/Small)
Fulfilment of objectives
44
G
2:O
1:P
G2
:p2
4
1
Est
abli
shm
ent
of
a ci
ty o
rch
estr
a H
M
N
o
Yes
Y
es
M
G
1
45
G
1:O
5:P
G1
:p6
2
7
Dev
elo
pm
ent
of
a p
rog
ram
me
to e
nco
ura
ge
fam
ily
- an
d e
co-
tou
rism
in
Sh
iro
kë
and
Zo
gaj
H
L
N
o
P
No
M
S
p
2
46
G
4:O
1:P
G1
:p1
5
9
Dev
elo
pm
ent
of
a co
mp
reh
ensi
ve
regu
lato
ry u
rban
pla
n f
or
the
city
S
L
N
o
P
No
M
G
1
47
G
2:O
1:P
G2
:p6
4
5
Dev
elo
pm
ent
and
pub
lica
tion
of
pro
moti
on
al m
ater
ials
rel
ated
to
the
cult
ura
l h
erit
age
of
the
city
S
H
N
o
Yes
Y
es
M
Sm
1
48
G
4:O
6:P
G1
:p2
8
2
Imp
rov
emen
t o
f th
e te
chn
olo
gy
fo
r co
llec
tion, tr
ansp
ort
atio
n a
nd
man
agem
ent
of
mu
nic
ipal
so
lid
was
te
H
M
No
Y
es
Yes
M
G
2
49
G
1:O
5:P
G1
:p3
2
4
Est
abli
shm
ent
of
a n
etw
ork
of
ho
tels
and
res
tau
ran
ts i
n t
he
city
to i
mp
rov
e th
eir
stan
dar
ds
and
div
ersi
fy t
hei
r se
rvic
es
S
L
No
Y
es
No
M
G
2
50
G
1:O
1:P
G1
:p3
3
R
ehab
ilit
atio
n o
f su
rfac
e w
ater
dra
inag
e an
d s
ewag
e sy
stem
s in
In
dust
rial
Zone
H
M
No
Y
es
Yes
M
S
p
3
51
G
1:O
1:P
G1
:p5
5
In
stal
lati
on
of
new
tel
eph
on
e li
nes
and
ren
ovat
ion
of
exis
ting
net
wo
rk w
ithin
In
du
stri
al Z
one
H
M
Yes
Y
es
Yes
L
S
p
2
52
G
4:O
5:P
G3
:p1
7
8
Co
nst
ruct
ion
of
a n
ew g
reen
sp
ace
in t
he
Xhab
ije
resi
den
tial
are
a H
M
Y
es
Yes
Y
es
L
G
2
53
G
2:O
1:P
G2
:p3
4
2
Ho
ldin
g o
f a
Su
mm
er's
Day
fes
tiv
al i
n S
hk
od
ra
S
H
No
Y
es
Yes
L
G
1
54
G
1:O
1:P
G1
:p6
6
Im
pro
vem
ent
and
exp
ansi
on
of
gre
en s
pac
es w
ith
in I
ndu
stri
al
Zo
ne
H
M
No
Y
es
Yes
M
S
p
3
55
G
4:O
2:P
G1
:p3
6
5
Rec
on
stru
ctio
n o
f th
e pub
lic
lig
hti
ng
of
8 s
tree
ts (
An
nex
4)
H
M
No
Y
es
Yes
H
G
2
56
G
1:O
3:P
G1
:p4
1
7
Co
nst
ruct
ion
of
a b
usi
nes
s fa
ir c
entr
e H
M
N
o
Yes
N
o
M
G
2
57
G
1:O
3:P
G1
:p3
1
6
Est
abli
shm
ent
of
a re
gio
nal
bu
sin
ess
trai
nin
g c
entr
e H
M
N
o
Yes
N
o
M
Sp
2
58
G
4:O
2:P
G2
:p1
6
6
Reh
abil
itat
ion
of
5 s
urf
ace
wat
er d
rain
age
ou
tlet
s fr
om
th
e ci
ty
(An
nex
4)
H
L
No
Y
es
Yes
M
G
2
59
G
5:O
4:P
G1
:p3
9
7
Rec
on
stru
ctio
n o
f h
ealt
h c
entr
es i
n Z
og
aj a
nd S
hir
ok
ë H
M
N
o
Yes
Y
es
M
Sp
3
60
G
5:O
1:P
G1
:p4
8
7
Co
nst
ruct
ion
of
an i
nd
oo
r at
hle
tics
sta
diu
m
H
M
No
Y
es
Yes
M
S
p
2
61
G
1:O
5:P
G1
:p4
2
5
Est
abli
shm
ent
of
a tr
ade
centr
e fo
r ar
tisa
n p
rodu
cts
H
H
Yes
Y
es
No
M
S
m
2
62
G
4:O
1:P
G1
:p4
6
2
Dev
elo
pm
ent
of
an a
ctio
n p
lan
fo
r im
ple
men
tati
on
of
the
com
pre
hen
siv
e re
gu
lato
ry u
rban
pla
n a
nd
par
tial
urb
an p
lans
H
L
No
Y
es
No
M
G
1
63
G
1:O
1:P
G1
:p2
2
Im
pro
vem
ent
of
stre
et l
igh
tin
g w
ith
in I
nd
ust
rial
Zo
ne
H
M
No
Y
es
Yes
H
S
p
3
64
G
5:O
4:P
G1
:p1
9
5
Rec
on
stru
ctio
n o
f co
mm
un
ity
hea
lth
cen
tre
in T
re H
ero
njt
H
M
N
o
Yes
Y
es
M
Sp
3
65
G
4:O
4:P
G1
:p4
7
4
Inst
alla
tio
n o
f au
xil
iary
eq
uip
men
t fo
r m
ain
s w
ater
man
agem
ent
H
M
No
Y
es
Yes
L
G
2
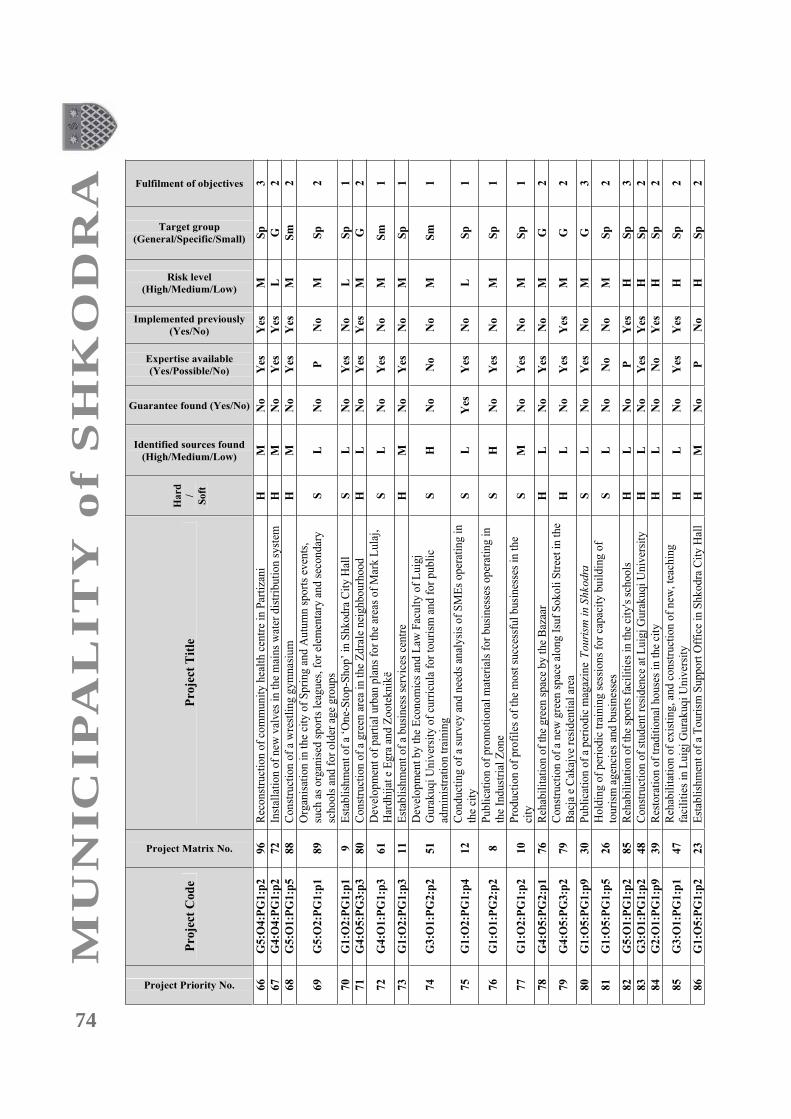
74
MU
NIC
IP
AL
IT
Y o
f S
HK
OD
RA

75
Project Priority No.
Pro
ject
Cod
e
Project Matrix No.
Pro
ject
Tit
le
Ha
rd
/
Soft
Identified sources found
(High/Medium/Low)
Guarantee found (Yes/No)
Expertise available
(Yes/Possible/No)
Implemented previously
(Yes/No)
Risk level
(High/Medium/Low)
Target group
(General/Specific/Small)
Fulfilment of objectives
87
G
5:O
3:P
G1
:p1
9
0
Co
mp
ute
risa
tio
n o
f th
e C
ivil
Reg
istr
y O
ffic
e S
L
N
o
No
N
o
H
G
1
88
G
3:O
1:P
G3
:p3
5
5
Rec
ruit
men
t an
d d
evel
op
men
t o
f q
ual
ifie
d a
cad
emic
sta
ff a
t
Luig
j G
ura
kuqi
Un
iver
sity
to
a l
evel
all
ow
ing
fo
r q
ual
ity
teac
hin
g a
nd
to t
he
stan
dar
ds
of
the
Bo
log
na
Dec
lara
tion
S
L
No
N
o
No
H
S
p
1
89
G
3:O
1:P
G3
:p2
5
4
Est
abli
sh a
fu
nd
ing
sy
stem
at
Luig
j G
ura
ku
qi
Un
iver
sity
to
sup
po
rt a
nd
in
crea
se r
esea
rch
cap
acit
ies
and
to
en
sure
kno
wle
dg
e tr
ansf
er i
n t
he
fiel
d o
f re
gio
nal
eco
no
mic
dev
elo
pm
ent
S
L
No
P
N
o
H
G
1
90
G
2:O
1:P
G1
:p1
3
1
Pre
serv
atio
n, re
sto
rati
on
and
dev
elo
pm
ent
of
the
city
's m
use
um
and
its
coll
ecti
on
, as
wel
l as
oth
er h
isto
rica
l, c
ult
ura
l it
ems
in t
he
city
H
L
N
o
P
Yes
H
S
p
1
91
G
2:O
1:P
G1
:p2
3
2
Cre
atio
n o
f a
syst
em f
or
iden
tifi
cati
on
, v
alu
atio
n a
nd
pu
rchas
ing
of
mu
seu
m a
rtef
acts
S
L
N
o
P
Yes
H
S
p
1
92
G
3:O
1:P
G3
:p1
5
3
Dev
elo
pm
ent
and
im
ple
men
tati
on
of
a p
rog
ram
me
for
exch
ang
e o
f sc
ienti
fic
and
tec
hnic
al k
now
ledg
e b
etw
een
Luig
j G
ura
ku
qi
Un
iver
sity
an
d u
niv
ersi
ties
in
th
e re
gio
n a
nd
els
ewh
ere
S
L
No
P
Y
es
H
Sp
1
93
G
2:O
1:P
G1
:p8
3
8
Pro
mo
tio
n o
f th
e p
hoto
gra
ph
co
llec
tion
of
the
Mar
ub
i M
use
um
S
L
N
o
P
Yes
H
S
p
1
94
G
5:O
1:P
G1
:p3
8
6
Co
nst
ruct
ion
of
publi
c an
d p
riv
ate
spo
rts
faci
liti
es
H
L
No
P
Y
es
H
Sp
1
95
G
2:O
1:P
G2
:p7
4
6
Pre
par
atio
n a
nd
pu
bli
cati
on
of
a ca
len
dar
of
annu
al c
ult
ura
l
acti
vit
ies
to b
e h
eld
in
Sh
ko
dra
S
L
N
o
P
No
H
G
1
96
G
1:O
4:P
G1
:p2
2
1
Co
nst
ruct
ion
in
th
e ci
ty o
f n
ew f
ruit
, v
eget
able
, fi
sh a
nd
mea
t
reta
il m
ark
et p
lace
s H
M
N
o
P
Yes
H
G
1
97
G
3:O
1:P
G2
:p3
5
2
Imp
lem
enta
tio
n o
f a
dis
tan
ce l
earn
ing
pro
ject
at
Luig
j G
ura
kuqi
Un
iver
sity
S
L
N
o
No
N
o
H
Sp
1
98
G
3:O
1:P
G2
:p1
5
0
Est
abli
shm
ent
of
an A
rts
Aca
dem
y a
t L
uig
j G
ura
ku
qi
Un
iver
sity
S
L
N
o
P
No
H
S
p
1

76
MU
NIC
IP
AL
IT
Y o
f S
HK
OD
RA
e. Project fiches
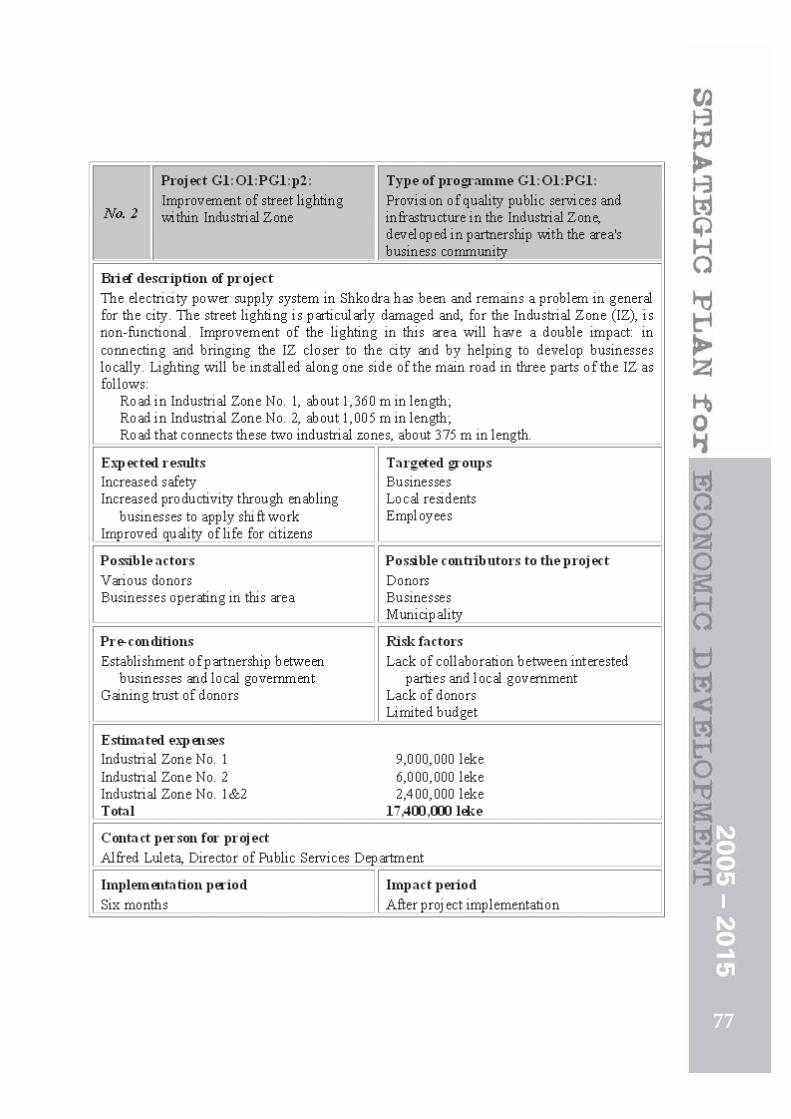
77

78
MU
NIC
IP
AL
IT
Y o
f S
HK
OD
RA
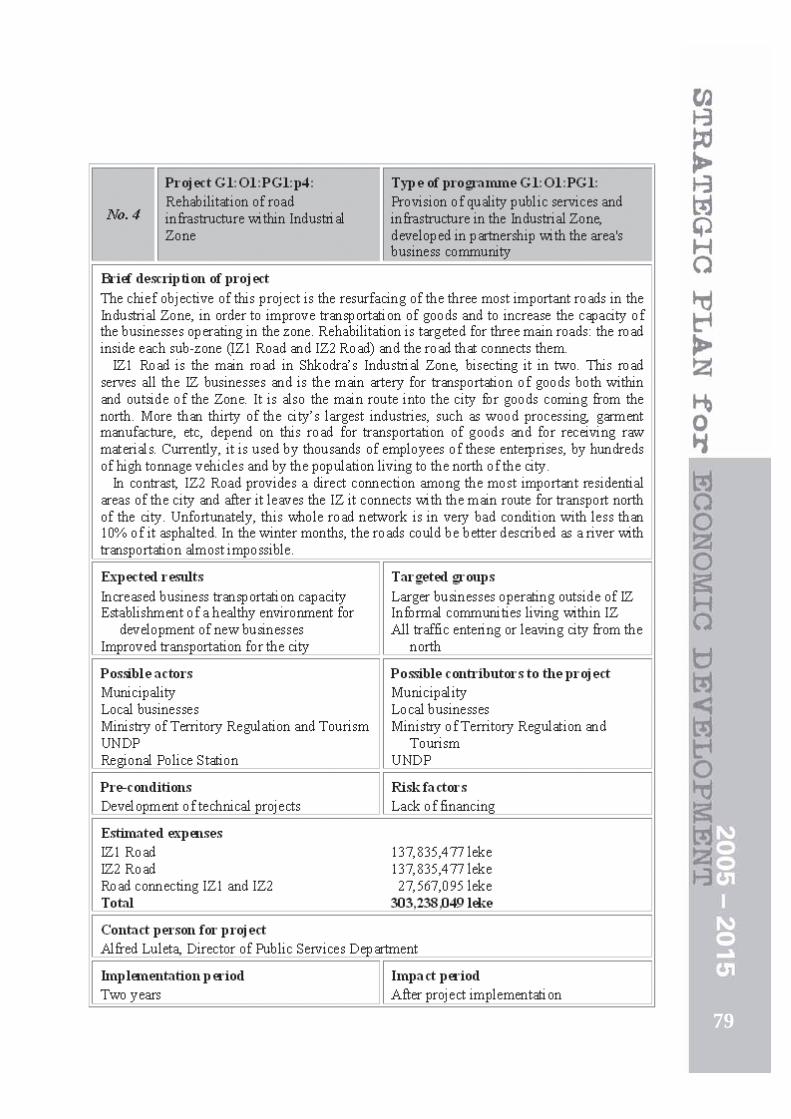
79
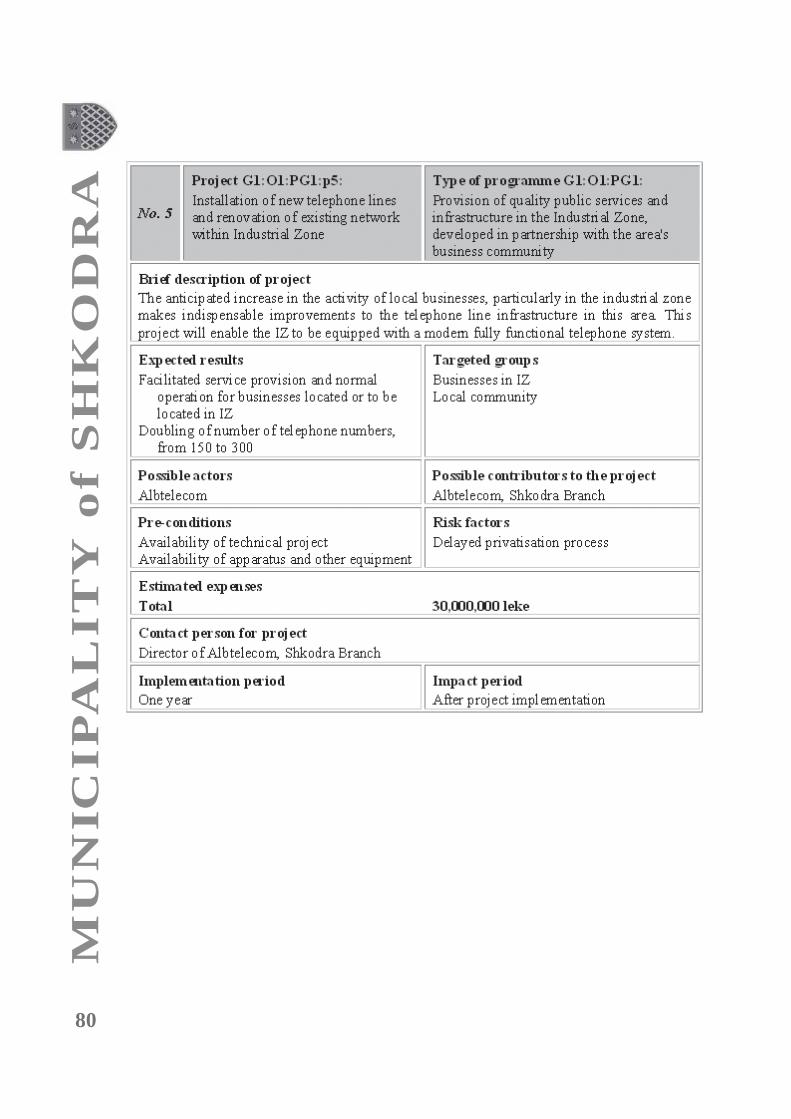
80
MU
NIC
IP
AL
IT
Y o
f S
HK
OD
RA

81
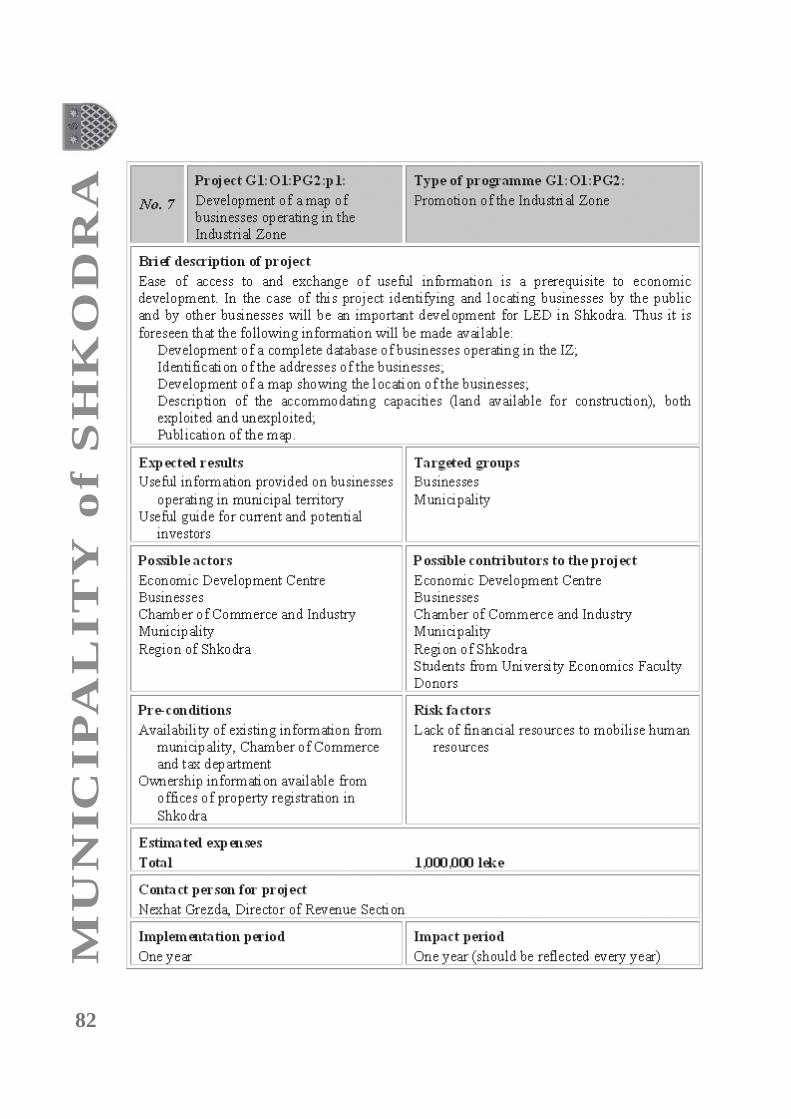
82
MU
NIC
IP
AL
IT
Y o
f S
HK
OD
RA

83
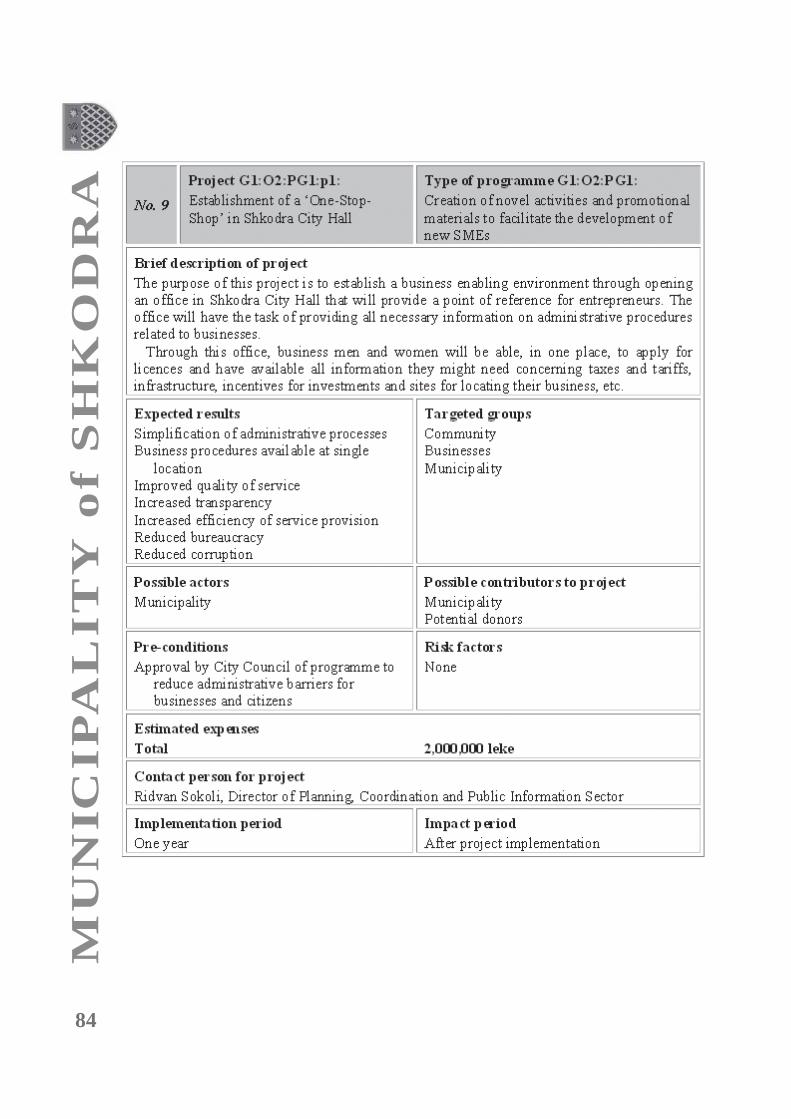
84
MU
NIC
IP
AL
IT
Y o
f S
HK
OD
RA

85

86
MU
NIC
IP
AL
IT
Y o
f S
HK
OD
RA
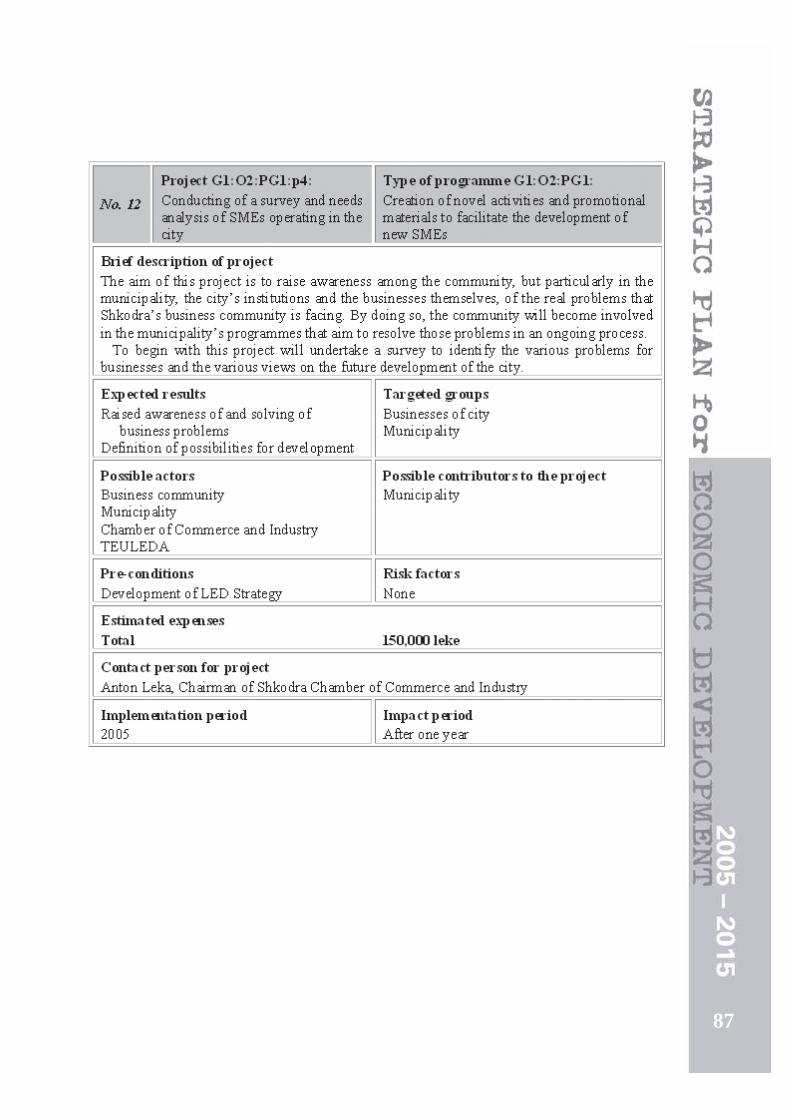
87

88
MU
NIC
IP
AL
IT
Y o
f S
HK
OD
RA
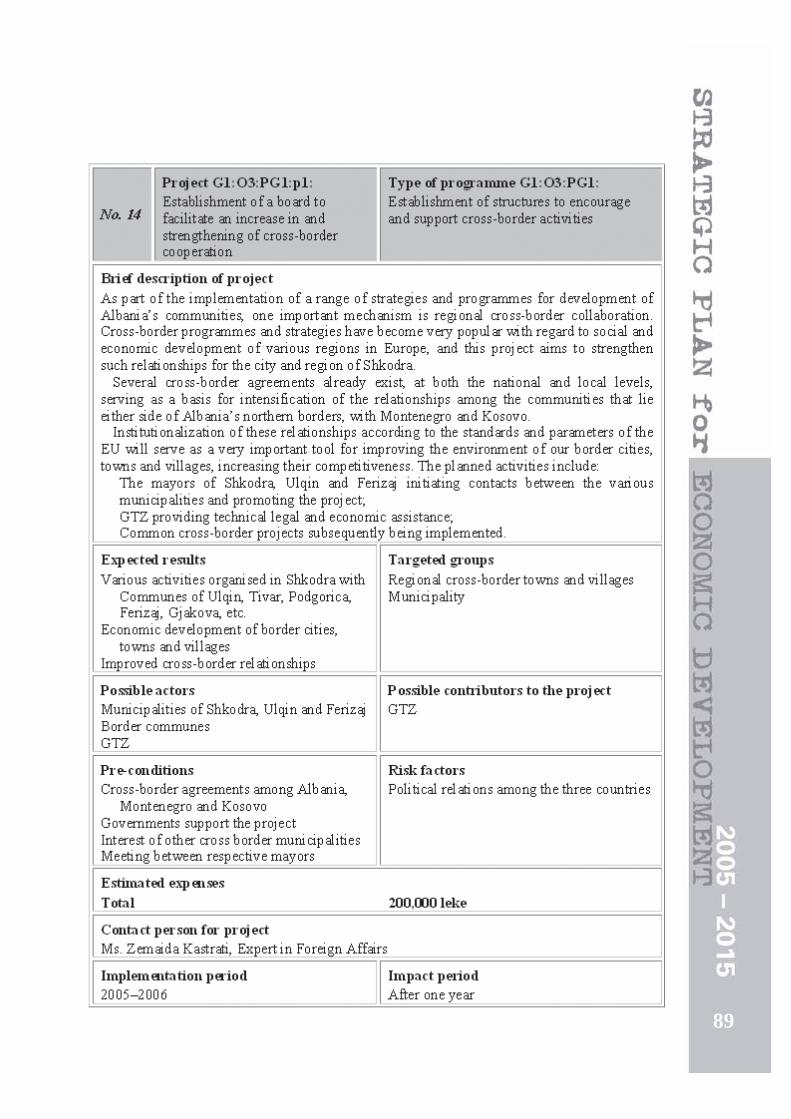
89

90
MU
NIC
IP
AL
IT
Y o
f S
HK
OD
RA
91

92
MU
NIC
IP
AL
IT
Y o
f S
HK
OD
RA
93

94
MU
NIC
IP
AL
IT
Y o
f S
HK
OD
RA

95

96
MU
NIC
IP
AL
IT
Y o
f S
HK
OD
RA

97

98
MU
NIC
IP
AL
IT
Y o
f S
HK
OD
RA

99
100
MU
NIC
IP
AL
IT
Y o
f S
HK
OD
RA

101

102
MU
NIC
IP
AL
IT
Y o
f S
HK
OD
RA
103

104
MU
NIC
IP
AL
IT
Y o
f S
HK
OD
RA

105

106
MU
NIC
IP
AL
IT
Y o
f S
HK
OD
RA
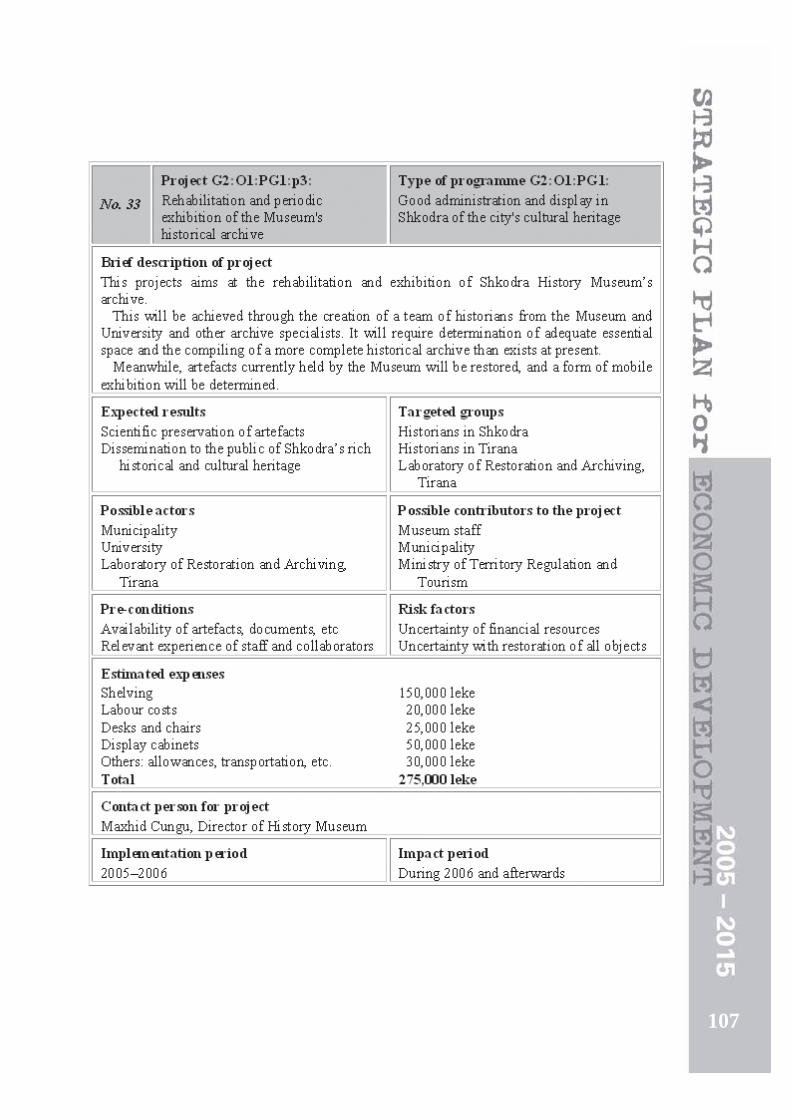
107
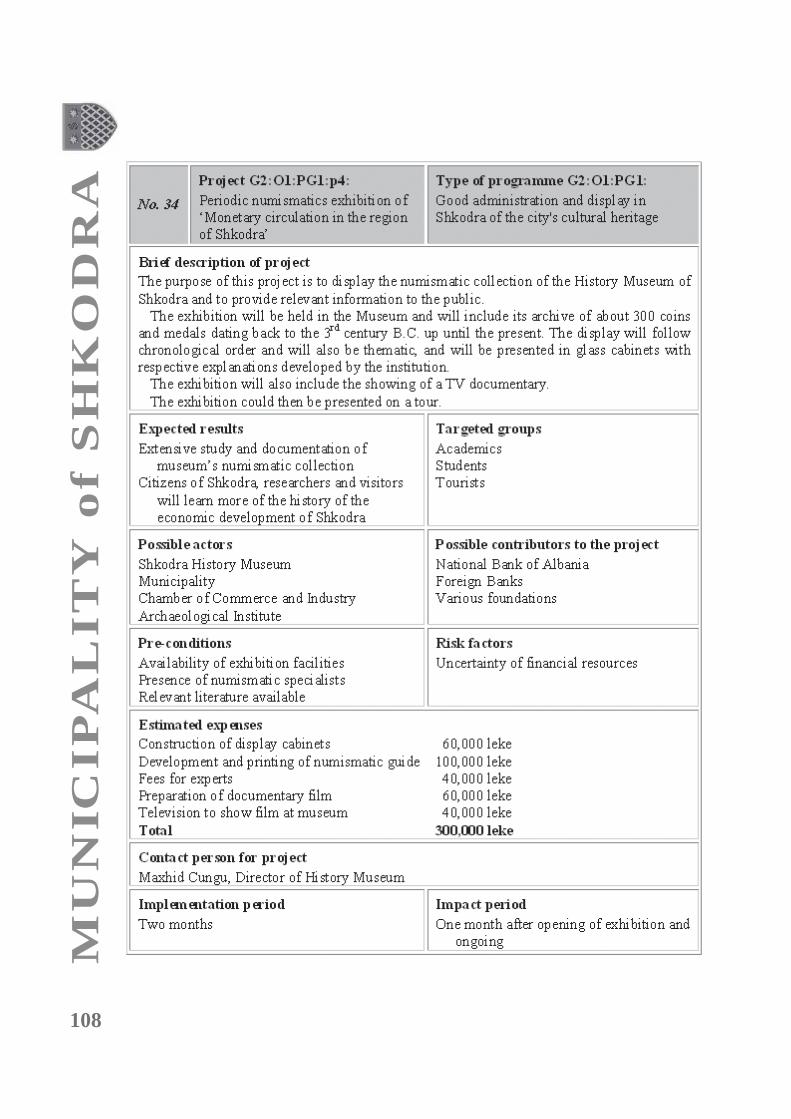
108
MU
NIC
IP
AL
IT
Y o
f S
HK
OD
RA

109

110
MU
NIC
IP
AL
IT
Y o
f S
HK
OD
RA
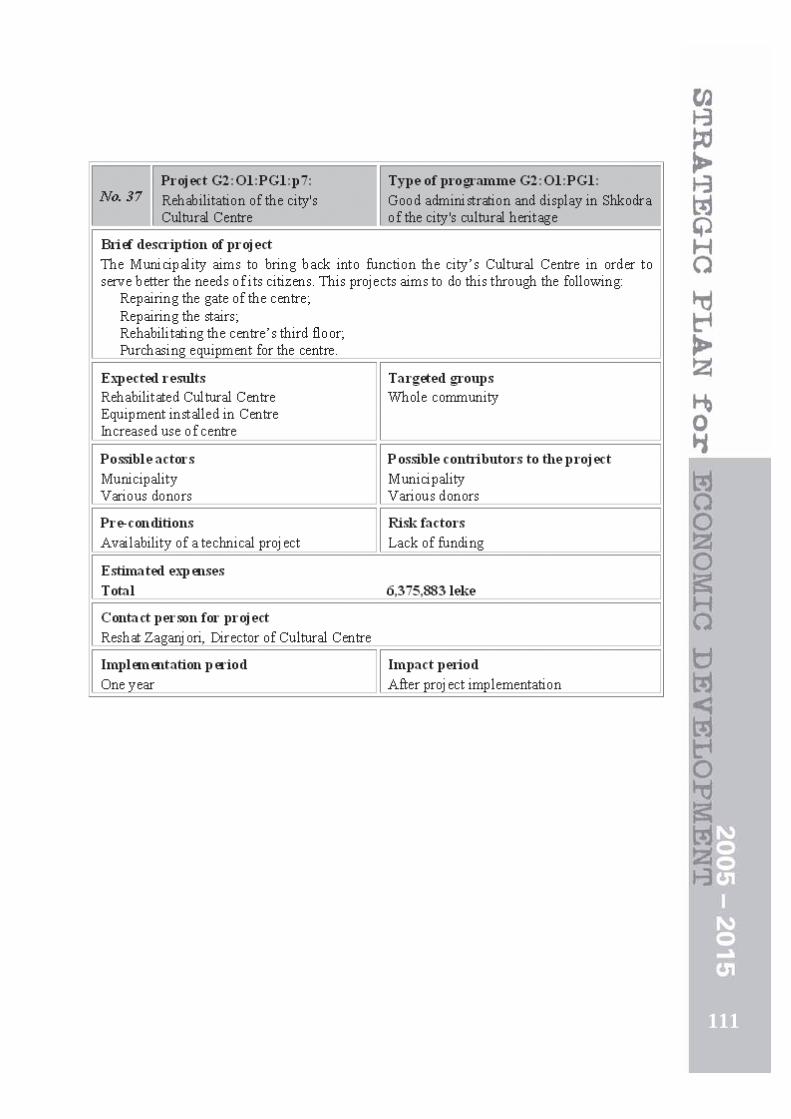
111

112
MU
NIC
IP
AL
IT
Y o
f S
HK
OD
RA

113

114
MU
NIC
IP
AL
IT
Y o
f S
HK
OD
RA

115

116
MU
NIC
IP
AL
IT
Y o
f S
HK
OD
RA

117

118
MU
NIC
IP
AL
IT
Y o
f S
HK
OD
RA

119
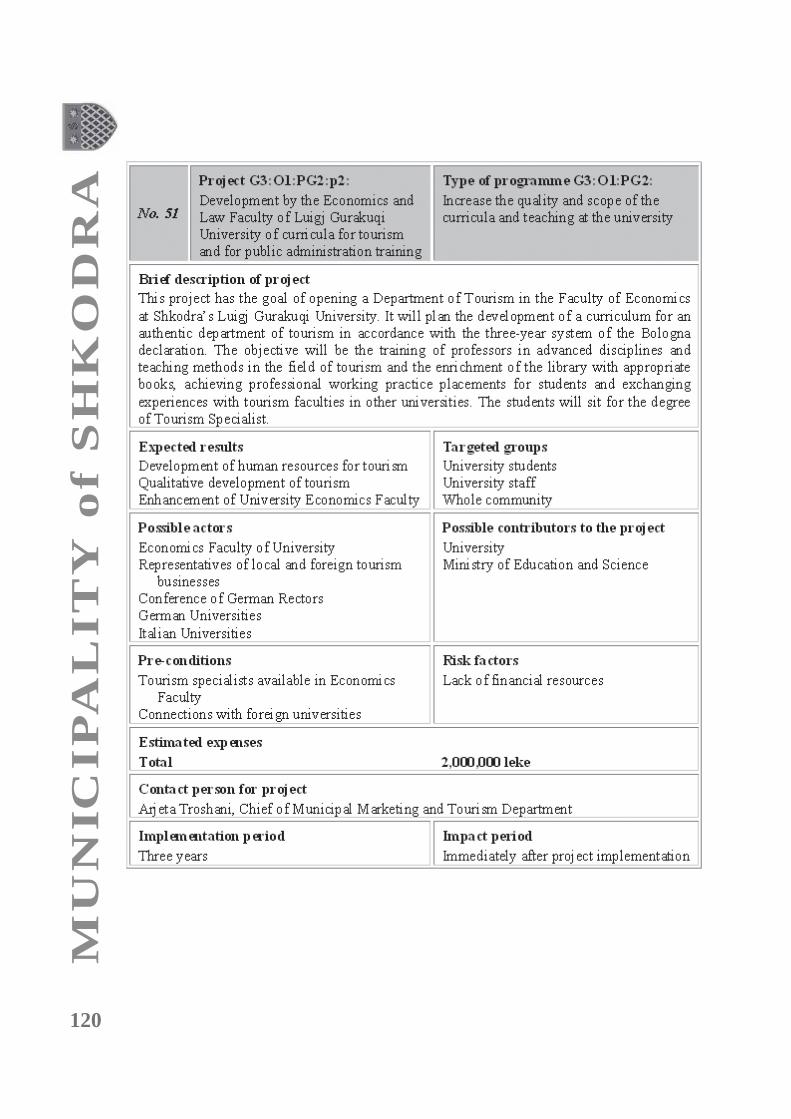
120
MU
NIC
IP
AL
IT
Y o
f S
HK
OD
RA

121

122
MU
NIC
IP
AL
IT
Y o
f S
HK
OD
RA

123

124
MU
NIC
IP
AL
IT
Y o
f S
HK
OD
RA

125

126
MU
NIC
IP
AL
IT
Y o
f S
HK
OD
RA

127

128
MU
NIC
IP
AL
IT
Y o
f S
HK
OD
RA

129
130
MU
NIC
IP
AL
IT
Y o
f S
HK
OD
RA

131

132
MU
NIC
IP
AL
IT
Y o
f S
HK
OD
RA

133

134
MU
NIC
IP
AL
IT
Y o
f S
HK
OD
RA

135

136
MU
NIC
IP
AL
IT
Y o
f S
HK
OD
RA

137

138
MU
NIC
IP
AL
IT
Y o
f S
HK
OD
RA

139

140
MU
NIC
IP
AL
IT
Y o
f S
HK
OD
RA
141

142
MU
NIC
IP
AL
IT
Y o
f S
HK
OD
RA

143
144
MU
NIC
IP
AL
IT
Y o
f S
HK
OD
RA

145

146
MU
NIC
IP
AL
IT
Y o
f S
HK
OD
RA
147

148
MU
NIC
IP
AL
IT
Y o
f S
HK
OD
RA

149

150
MU
NIC
IP
AL
IT
Y o
f S
HK
OD
RA
151

152
MU
NIC
IP
AL
IT
Y o
f S
HK
OD
RA

153

154
MU
NIC
IP
AL
IT
Y o
f S
HK
OD
RA

155

156
MU
NIC
IP
AL
IT
Y o
f S
HK
OD
RA
157

158
MU
NIC
IP
AL
IT
Y o
f S
HK
OD
RA

159

160
MU
NIC
IP
AL
IT
Y o
f S
HK
OD
RA

161
162
MU
NIC
IP
AL
IT
Y o
f S
HK
OD
RA
163
164
MU
NIC
IP
AL
IT
Y o
f S
HK
OD
RA
Annex 1: Acronyms used in the Implementation Matrix
AA Advertising Agencies
AB Artisan Business
AC Artists of the City
AFF Albanian Football Federation
AG Arts Groups
ASB Association of Shkodra Businesses
ASp Amateur Sportspersons
AT Shkodra Branch of Albtelecom
AuG Austrian Government
BC Business Community
BIZ Businesses of Industrial Zone
BR Businesses in the Region
C Children
CA State Central Archive
CC Cross-border Cities
CCI Chamber of Commerce and Industry
CE Cleaning Enterprise
CG Central Government
Co Community
CoV Commune of Venice
D Donors
E Employees
ECD Economic Centre for Development
F Farmers
FB Foreign Businesses
FVM Fruit and Vegetable Merchants
GA Group of Archaeologists
GE Group of Ethnographers
GH Group of Historians
GTZ Deutsche Gesellschaft für Technische
Zusammenarbeit
H Hotels
HM History Museum of Shkodra
IA Art Performing Institutions
IAR Institute of Archaeological Research
IC Institute of Culture
K City of Koplik
KESH Albanian Electricity Corporation
KfW Kreditanstalt für Wiederaufbau
LC Local Community
LRA Laboratory of Restoration and
Archinometry
M Municipality of Shkodra
MA Ministry of Agriculture and Food
MC Ministry of Culture, Youth and Sports
MuC Musical Community of Shkodra
ME Ministry of Economy
MES Ministry of Education and Science
MG Montenegrin Government
MH Ministry of Health
ML Ministry of Labour and Social Affairs
MLGD Ministry of Local Government and
Decentralisation
MT Ministry of Territorial Adjustment
and Tourism
NGO Non-governmental Organisation
P Pupils
PA Performing artists
PI Public Institutions
PrI Processing Industry
PJA Preng Jakova Association
R Bars and Restaurants
REA Regional Environmental Agency
RDE Regional Directorate of Education
RED Regional Employment Directorate
RHD Regional Health Directorate
RPD Regional Police Directorate
RSh Region of Shkodra
S Students
SC Sports Clubs
ScC Scientific Community in the City
SCV Vllaznia Sports Club
T Tourists
TA Tourist Agencies
TB Tourism Businesses
TEU Teuleda, Agency for Local Economic
Development
U University of Shkodra
UE Unemployed
UNDP United Nations Development Program
UNOPS United Nations Office for Project
Services
VMS Vocational Middle School
WB World Bank
WT Wrestling Team
Y Youth
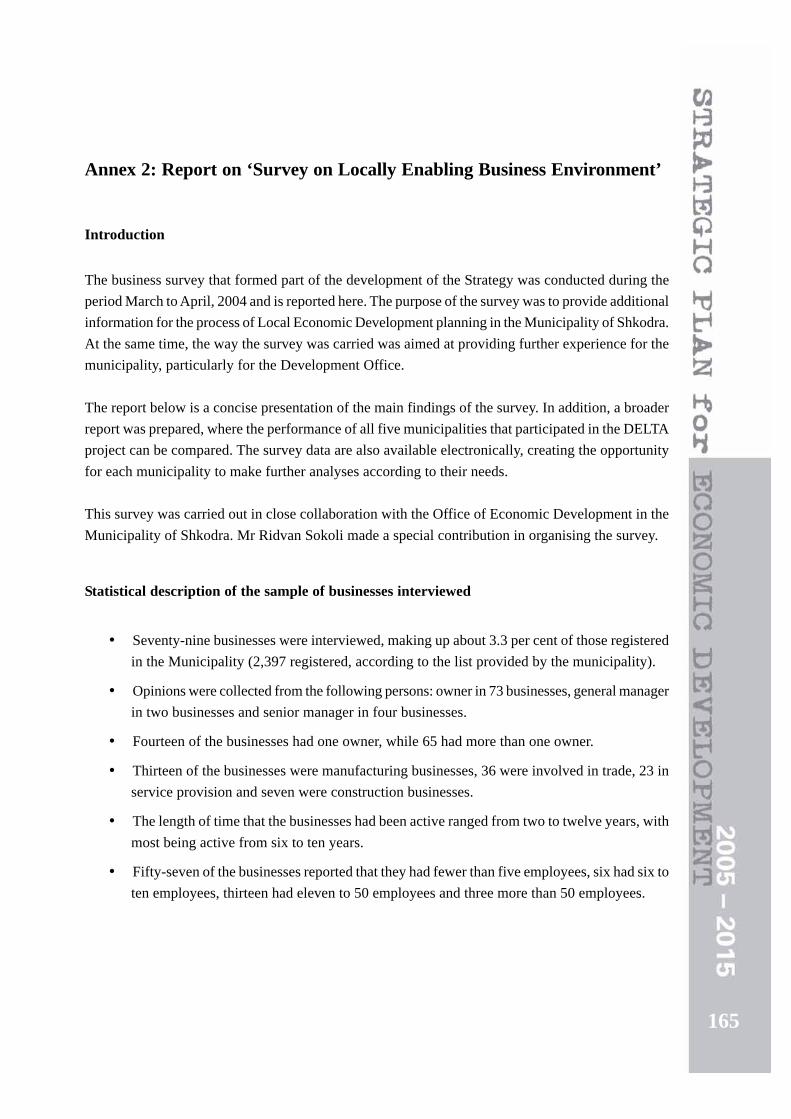
165
Annex 2: Report on ‘Survey on Locally Enabling Business Environment’
Introduction
The business survey that formed part of the development of the Strategy was conducted during the
period March to April, 2004 and is reported here. The purpose of the survey was to provide additional
information for the process of Local Economic Development planning in the Municipality of Shkodra.
At the same time, the way the survey was carried was aimed at providing further experience for the
municipality, particularly for the Development Office.
The report below is a concise presentation of the main findings of the survey. In addition, a broader
report was prepared, where the performance of all five municipalities that participated in the DELTA
project can be compared. The survey data are also available electronically, creating the opportunity
for each municipality to make further analyses according to their needs.
This survey was carried out in close collaboration with the Office of Economic Development in the
Municipality of Shkodra. Mr Ridvan Sokoli made a special contribution in organising the survey.
Statistical description of the sample of businesses interviewed
• Seventy-nine businesses were interviewed, making up about 3.3 per cent of those registered
in the Municipality (2,397 registered, according to the list provided by the municipality).
• Opinions were collected from the following persons: owner in 73 businesses, general manager
in two businesses and senior manager in four businesses.
• Fourteen of the businesses had one owner, while 65 had more than one owner.
• Thirteen of the businesses were manufacturing businesses, 36 were involved in trade, 23 in
service provision and seven were construction businesses.
• The length of time that the businesses had been active ranged from two to twelve years, with
most being active from six to ten years.
• Fifty-seven of the businesses reported that they had fewer than five employees, six had six to
ten employees, thirteen had eleven to 50 employees and three more than 50 employees.

166
MU
NIC
IP
AL
IT
Y o
f S
HK
OD
RA
Main findings
Opinions about the business climate in Shkodra
• 52% of businesses reported difficulties in finding qualified workers, while 42% reported the
opposite. (Question 9.)
• 24% of businesses reported that they were short of staff with sales & marketing skills (taken
together), 22% declared a shortage in technical personnel and 17% reported that they had a
shortage in staff with management skills. (Question 10.)
• 71% of businesses reported that the main source of competition came from local businesses.
(Question 11.)
• There are a number of business associations in the city, but these are not widely known in the
community. (Question 12.) 68% of businesses reported that they didn’t know about the support
that these associations provide for businesses. (Question 22.)
• The three main factors that were hindering business expansion were: electricity (64%),
informal competition and infrastructure (40%). However, other factors were mentioned very
often in the reports. (Question 15.)
• 50% of businesses reported that they needed fewer than 10 days to renew the licences for the
following year. (Question 16.)
• The two biggest problems concerning relationship with local government were: corruption
and illegal practices, and competition from the informal market. (Question 17.)
• More than 70% of businesses reported that had been inspected fewer than five times by the
tax authority. 10% reported that they had paid fines and 4% that they had paid bribes to the
tax authority. (Question 20.)
• 11% of businesses declared that the Tax Department was hindering the expansion of their
business and 1.3% declared the same for the Department of Services. (Question 25.)
• 52% of the businesses reported that the business environment had worsened during the last
three years. (Question 33.)
Expectations of businesses
• 33% of businesses reported that they plan to invest within the municipality. 44% reported
that they do not plan to invest in the future. (Question 8.)
• The three most mentioned expectations were: improved electricity supply, improved
infrastructure and improved cleaning of the city. (Question 18.)
• More than 90% of businesses expected to spend fewer than 10 days renewing their licence
for the following year. (Question 16.)
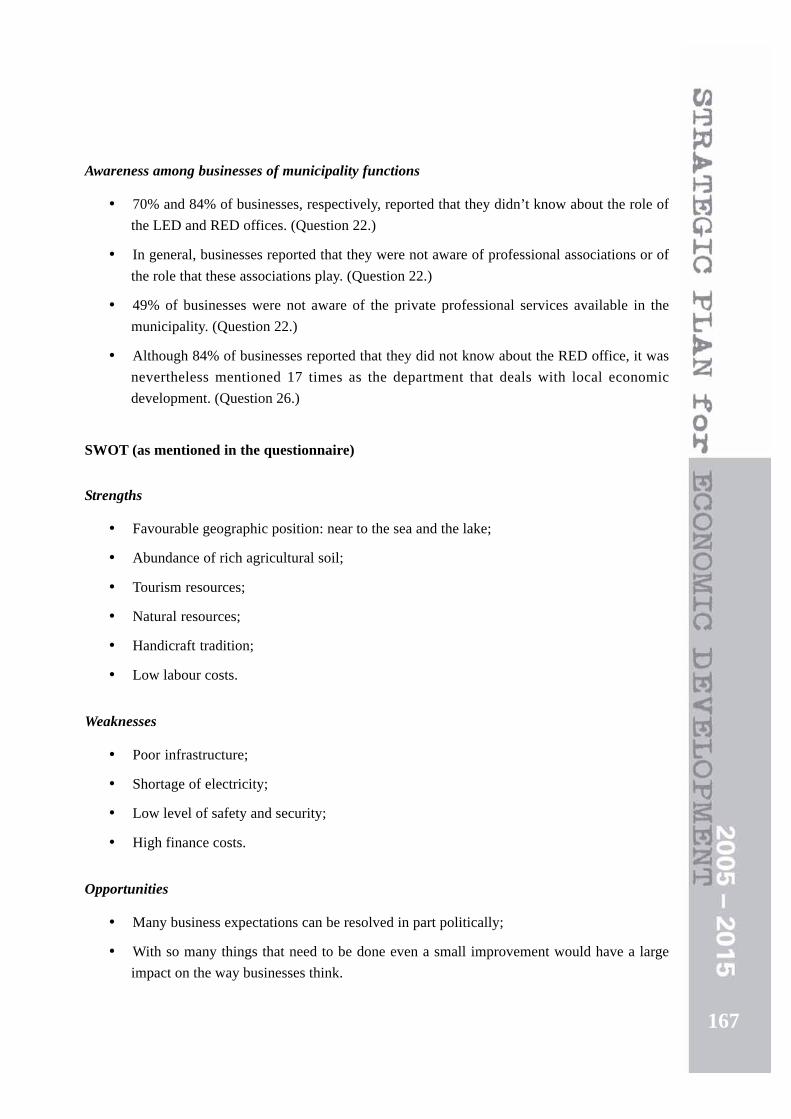
167
Awareness among businesses of municipality functions
• 70% and 84% of businesses, respectively, reported that they didn’t know about the role of
the LED and RED offices. (Question 22.)
• In general, businesses reported that they were not aware of professional associations or of
the role that these associations play. (Question 22.)
• 49% of businesses were not aware of the private professional services available in the
municipality. (Question 22.)
• Although 84% of businesses reported that they did not know about the RED office, it was
nevertheless mentioned 17 times as the department that deals with local economic
development. (Question 26.)
SWOT (as mentioned in the questionnaire)
Strengths
• Favourable geographic position: near to the sea and the lake;
• Abundance of rich agricultural soil;
• Tourism resources;
• Natural resources;
• Handicraft tradition;
• Low labour costs.
Weaknesses
• Poor infrastructure;
• Shortage of electricity;
• Low level of safety and security;
• High finance costs.
Opportunities
• Many business expectations can be resolved in part politically;
• With so many things that need to be done even a small improvement would have a large
impact on the way businesses think.
168
MU
NIC
IP
AL
IT
Y o
f S
HK
OD
RA
Threats
• The informal economy is one of the most important factors reducing the number of registered
businesses;
• A considerable number of businesses are not thinking of expanding their activity;
• Corruption is mentioned many times as a huge constraint;
• Low level of willingness of businesses to collaborate, a result of the poor image of local
government.

169
Annex 3: Methodology used in project prioritisation
The Shkodra Local Economic Development projects were prioritised according to two separate, but
equally important, criteria: perceived necessity for the community, and feasibility of implementation.
Each project was assigned a score based upon these two criteria.
The Necessity Score was developed through a ranking survey filled out by the working group of
stakeholders and community members. The projects were divided within the survey according to
goal heading and then whether they were hard or soft. Responders to the survey were asked to rank
each project against other projects within each grouping, as either most necessary, necessary or least
necessary. Projects rated most necessary were given 3 points, necessary 2 points and least necessary
1 point. It should be noted that some projects were not rated by responders and were given a score of
0. The total sum of scores created the final Necessity Score for each project.
The Feasibility Score was developed by a technical group within the municipality. The group awarded
a score per project according to seven criteria, which were as follows:
1. Whether or not a project had already secured funding;
2. The number of identified potential funding sources;
3. Whether the municipality had the expertise to implement the project;
4. Whether the municipality had successfully implemented a similar project previously;
5. The number of risks involved with implementation;
6. The groups targeted by the project;
7. The number of Goals or Objectives addressed by the project.
In contrast to the Necessity Score, where a higher number represented a higher level of desirability,
a lower Feasibility score meant the project had a higher level of feasibility. Each criterion was rated
with a different score (see instructions below), and the total calculated, plus 1, to create an overall
Feasibility Score for each project.
The final Prioritised list of projects was developed by dividing the Necessity Score by the Feasibility
Score and ranking the projects. The list was further refined by splitting the projects into three separate
categories: active projects, inactive projects and projects without summaries.
170
MU
NIC
IP
AL
IT
Y o
f S
HK
OD
RA
The prioritisation methodology utilised by the Municipality of Shkodra was developed by the local
Community Development Peace Corps Volunteer, Nathan Borgford-Parnell, in conjunction with the
Shkodra Development Office and under the care of the SOROS Open Society Foundation and World
Bank. Special thanks go to Peace Corps Volunteers, Jon Owen and Peter Gambil for their contributions
to the process.
Project Prioritisation Methodology Instructions
Necessity Quotient
Step 1: Group project according to goal;
Step 2: Categorise project within each goal group as (H)ard or (S)oft;
Step 3: List all projects on the Stakeholder Form according to group number and H or S category
(list Goal 1 projects first, followed by Goal 2, and so on);
Step 4: Provide each stakeholder with a separate Stakeholder Form;
Step 5: Ask stakeholders to mark projects within the groups as being most necessary, necessary or
least necessary. Stakeholders can only rank three projects within each grouping as most
desirable/necessary (for the H and S projects). If there are very few projects in one grouping
the maximum number allowed for ‘most desirable/necessary’ can be decreased to 2 or 1.
Step 6: Add up points for each project from each stakeholder form to obtain the Necessity Quotient
and enter this into the Project Prioritisation Sheet.
Feasibility Quotient
Step 1: List projects by group in the Feasibility Form;
Step 2: Discuss and rate each project according to the criteria set out in the form (note that this is the
opposite of the ranking format used in the Stakeholder Form);
Criterion 1: Funding secured? (yes, 0; no, 0.1);
Criterion 2: Number of potential funding sources identified (≥2, 0; one, 0.1; zero, 0.2).
Criterion 3: Does municipality have expertise to implement project and are experts readily
available? (yes, 0; maybe, 0.1; no, 0.2);
Criterion 4: Has municipality successfully implemented a project like this previously?
(yes, 0; no, 0.2);

171
Criterion 5: Number of risks (0, 0; 1 or 2, 0.1; >2, 0.2);
Criterion 6: Population groups targeted by project (whole population, 0; under-served,
specifically targeted population, 0.1; single non-priority population, 0.2);
Criterion 7: Number of Goals/Objectives addressed by project (≥3, 0; <3, 0.1).
Step 3: Add scores in each row to create Feasibility Quotient for each project;
Step 4: Enter Feasibility Quotient onto Project Prioritisation Sheet.
Project Prioritisation
Step 1: Designate each project as (S)oft or (H)ard;
Step 2: Designate each project as (L)ong-, (M)edium- or (S)hort-term based upon implementation
time (S, <1 year; M, 1–3 years; L, >3 years);
Step 3: For each project, divide the Necessity Quotient by the Feasibility Quotient to get the Priority
Score;
Step 4: Reorder projects from highest to lowest according to Priority Score;
Step 5: List projects in new prioritised order including letter designations for hard and soft and
implementation time category.
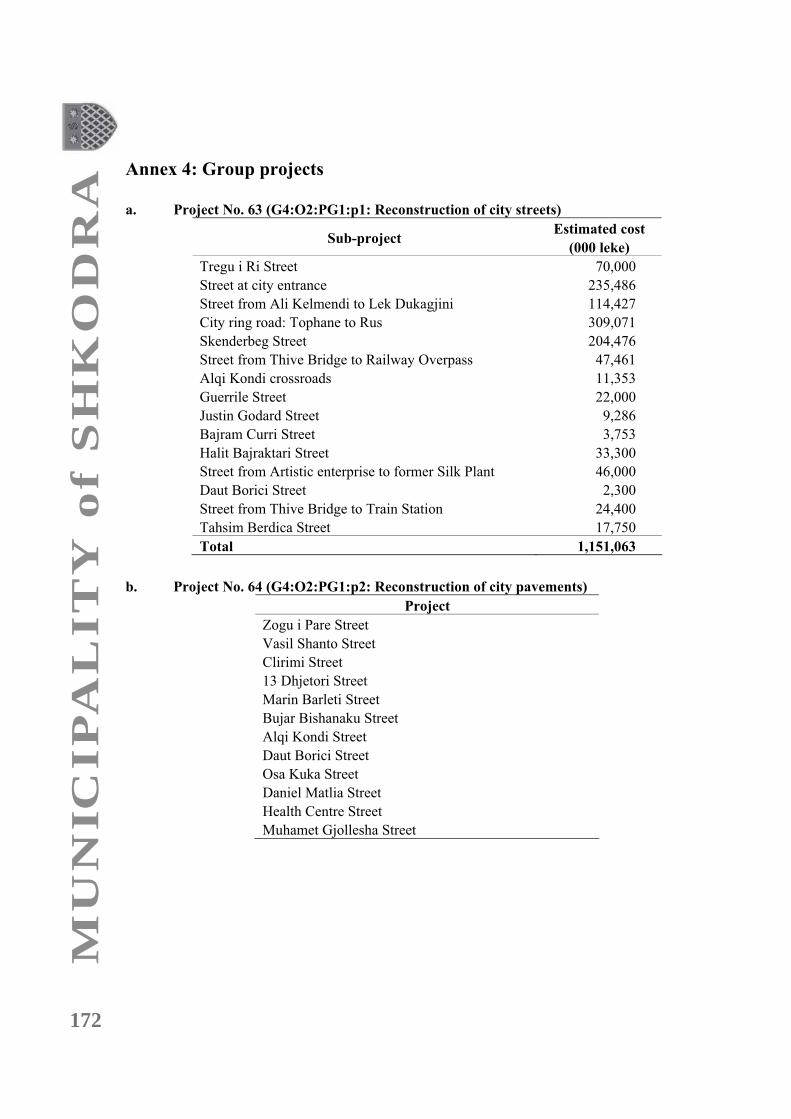
172
MU
NIC
IP
AL
IT
Y o
f S
HK
OD
RA
Annex 4: Group projects
a. Project No. 63 (G4:O2:PG1:p1: Reconstruction of city streets)
Sub-project Estimated cost
(000 leke)
Tregu i Ri Street 70,000
Street at city entrance 235,486
Street from Ali Kelmendi to Lek Dukagjini 114,427
City ring road: Tophane to Rus 309,071
Skenderbeg Street 204,476
Street from Thive Bridge to Railway Overpass 47,461
Alqi Kondi crossroads 11,353
Guerrile Street 22,000
Justin Godard Street 9,286
Bajram Curri Street 3,753
Halit Bajraktari Street 33,300
Street from Artistic enterprise to former Silk Plant 46,000
Daut Borici Street 2,300
Street from Thive Bridge to Train Station 24,400
Tahsim Berdica Street 17,750
Total 1,151,063
b. Project No. 64 (G4:O2:PG1:p2: Reconstruction of city pavements)
Project
Zogu i Pare Street
Vasil Shanto Street
Clirimi Street
13 Dhjetori Street
Marin Barleti Street
Bujar Bishanaku Street
Alqi Kondi Street
Daut Borici Street
Osa Kuka Street
Daniel Matlia Street
Health Centre Street
Muhamet Gjollesha Street

173
c. Project No. 65 (G4:O2:PG1:p3: Reconstruction of city street lighting)
Project Estimated cost
(000 leke)
Zogu i Pare Street 17,000
Clirimi Street 14,520
13 Dhjetori Street 5,820
Marin Barleti Street 6,500
Daniel Matlia Street 3,000
Health Centre Street 2,000
Osa Kuka Street 2,000
Road in front of University campus 1,200
Total 52,040
d. Project No. 66 (G4:O2:PG2:p1: Rehabilitation of city drains)
Project
Lake Exit I, Ring Road to Myfit Kopliku Street
Lake Exit II, Ring Road to Selim Golemi Street
River Kir Exit, Fusha e Druve, OUT 2
River Kir Exit, Tepe, OUT 3
River Buna Exit, Former Farm, OUT 3
Lake Exit, Zooteknikes (farmers’ house), OUT 8

sh.p
.k