
Municipal Borrowing – Bonds or Bank Loans. Recent Experiences from Hungary Charles Jókay, Ph.D....
23
Municipal Borrowing – Bonds or Bank Loans. Recent Experiences from Hungary Charles Jókay, Ph.D. Visiting Professor of Public Policy, CEU, and Executive Director, IGE Consulting Limited, Budapest
Transcript of Municipal Borrowing – Bonds or Bank Loans. Recent Experiences from Hungary Charles Jókay, Ph.D....

Municipal Borrowing – Bonds or Bank Loans. Recent Experiences
from Hungary
Charles Jókay, Ph.D.
Visiting Professor of Public Policy, CEU, and Executive Director, IGE Consulting
Limited, Budapest

Elsewhere in Europe….
Most OECD and Council of Europe member states allow municipalities and other sub-national levels (provinces, counties etc.) to borrow for capital investment purposes
Some allow borrowing for liquidity purposes, but these loans have to be paid back by the end of a budget year
The definition of a legitimate „capital investment” varies by country. Some are strict in connecting „organic tasks” to investment, others give a free hand to municipal and other sub-national levels to „invest” as they see fit

DEBT CONTROL MECHANISMS USED ELSEWHERE IN EUROPE
The Policy Tools: Restrictions on volume of borrowing and/or debt
service ratios Restrictions on municipal guarantees Restrictions on collateral Restrictions on the legal sources of repayment Restrictions on the purposes for which borrowing is
allowed Administrative/review approval by higher levels Individual borrowing ceilings/purposes determined
by higher levels Legitimate lending sources, currencies can also be
regulated

Regulation of municipal borrowing in Hungary
Securities Law (2001) Law on Financial
Institutions (2006) Finance Ministry Decree on
Bonds (under review) Hungarian Financial
Supervisory Authority regulations (public offerings only)
Law on Local Self-Government (1990)
Law on State Budget System
Other laws re. Accounting, records etc.

“Buy side” regulations
Budapest Stock Exchange listing standards
Basel II
Prudency regulations regarding mandatory and voluntary private pension funds, insurance companies, investment funds and other investment vehicles
EU accession, cross-border finance, representation offices

Combined Debt Service and Source of Repayment Formula: Example of Hungary
Municipalilties may borrow for any capital investment purpose approved by the Local Council (no MOF involvement)
No restriction on currency or type of bank
Only property categorized as „non-essential” for performing public services may be used as collateral (the City Hall, school, main square, museum etc., are „protected” and may not be mortgaged)
Only 70% of „non budget revenue” (called own-source revenue in Hu) may be used in any given year to cover debt service.
Debt is defined as: bank loans, vendor loans, leasing, bond issues, guarantees, promissory notes and other long term commitments of public funds such as PPP arrangements

Long-term municipal debt in Hungary: 2003-2006
Type Amount HUF Amount HUF Amount HUF Amount HUF
2003 2004 2005 2006 2006/2003 index
Budapest City 80 472 412 000 90 301 023 000 97 926 574 000 136 805 067 000 170,00%
Budapest districts 10 431 030 000 10 406 940 000 15 834 371 000 22 407 583 000 214,82%
Cities w/county status 38 316 728 000 45 839 634 000 64 852 520 000 103 067 902 000 268,99%
Cities 40 412 857 000 50 643 258 000 64 004 648 000 86 123 196 000 213,11%
Villages 26 866 885 000 31 070 857 000 36 558 914 000 48 754 088 000 181,47%
Total 196 499 912 000 228 261 715 000 279 177 027 000 397 157 836 000 202,12%
End of year HUF/€ 262 HUF/€ 245 HUF/€ 252 HUF/€ 252 HUF/€
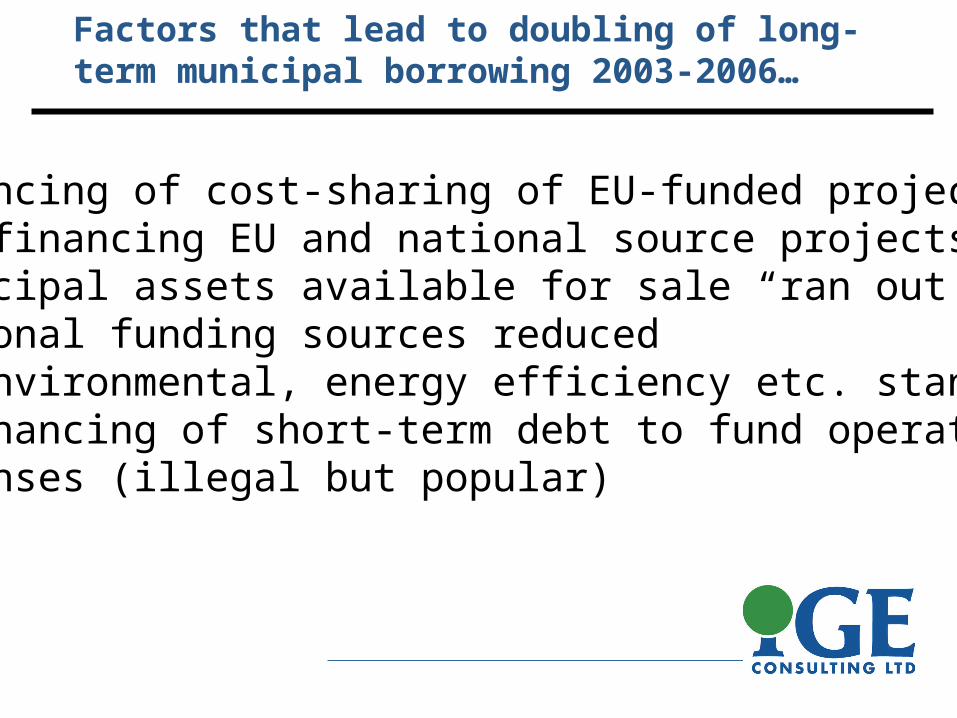
Factors that lead to doubling of long-term municipal borrowing 2003-2006…
•financing of cost-sharing of EU-funded projects•pre-financing EU and national source projects•municipal assets available for sale “ran out”•national funding sources reduced•EU environmental, energy efficiency etc. standards•Refinancing of short-term debt to fund operational expenses (illegal but popular)
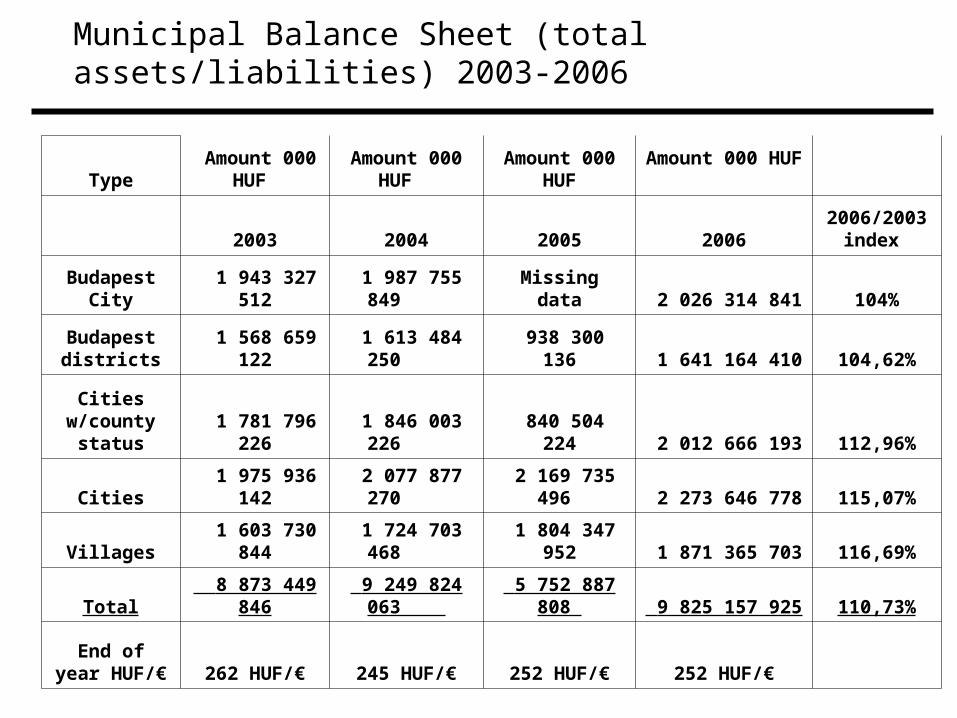
Municipal Balance Sheet (total assets/liabilities) 2003-2006
Type Amount 000
HUF Amount 000
HUF Amount 000
HUF Amount 000 HUF
2003 2004 2005 20062006/2003
index
Budapest City 1 943 327 512
1 987 755 849 Missing data 2 026 314 841 104%
Budapest districts 1 568 659 122
1 613 484 250 938 300 136 1 641 164 410 104,62%
Cities w/county
status 1 781 796 226 1 846 003 226
840 504 224 2 012 666 193 112,96%
Cities 1 975 936 142 2 077 877 270
2 169 735 496 2 273 646 778 115,07%
Villages 1 603 730 844 1 724 703 468
1 804 347 952 1 871 365 703 116,69%
Total 8 873 449 846 9 249 824 063
5 752 887 808 9 825 157 925 110,73%
End of year HUF/€ 262 HUF/€ 245 HUF/€ 252 HUF/€ 252 HUF/€

Municipal financial assets vs. Total debt (long term, short term, bank
loans and bonds issued) quarterly 2000 -2006 (thousand million HUF)
0
200
400
600
800
1 000
1 200
1 2 3 4 1 2 3 4 1 2 3 4 1 2 3 4 1 2 3 4 1 2 3 4 1 2
2000 2001 2002 2003 2004 2005 2006
Pénzügyi eszközök
Kötelezettségek

Bank Loans made..stock figures, Financial Supervision data (2006-2007)
2006 End 9/2007 Change
€ % € %
businesses 22 000 000 000 41%24 000 000
000 39% 9,09%
households 16 800 000 000 31%20 000 000
000 33% 19,05%
municipalities 1 600 000 000 3% 1 648 000 000 3% 3,00%
other 13 448 000 000 25%15 080 000
000 25% 12,14%
Total Loans Made 53 848 000 000 100%61 000 000
000 100% 13,28%
Total Securities Held 9 940 000 000
14 950 000 000 50,40%
Total Bank Fin. Assets 63 788 000 000
75 950 000 000 19,07%

Minimal Exposure of Banking Sector....
Municipal Bank deposits and loans made to municipalties vs. Total deposits and total loans made to all sectors
2001 2002 2003 2004 2005 2006 2007.
June Municipal loans as a percentage of
total banking assets 0,08 1,12 1,12 1,22 1,37 1,66 1,68
Municipal Loans as a percentage of net loans made by banks
1,5 1,89 1,77 1,92 2,1 2,57 2,58
Municipal Deposits as percentage of all deposits
3,25 3,28 2,9 3,18 2,8 2,54 2,18
National Bank of Hungary, Financial Markets Supervision (András Vigvári’s calculations)

The shift towards bonds began in 2005 and continues
National Bank financial
accounts in €
Municipal Debt
Composition
Long term
bonds Long term loanstotal long
term debt% of LT in
bonds
end of 2003 22 800 000 730 000 000 752 800 000 3,03%
June, 2007 180 000
000 1 680 000 000 1 860 000 000 9,68%
author estimate Nov, 2007
260 000 000 2 000 000 000 2 260 000 000 11,50%

What caused the shift towards bonds?
longer maturities (15-20 years) longer grace periods (5 years!) “callable” bonds (at no cost) debt refinancing (active debt management) exemption from public procurement (EU Directive) debt limit measurement difficult to use in cash-
based accounting and budgeting system bonds in bank portfolios are liquid, do not have
reserve requirements

Municipality 2005 2006 2007*
Budapest XII. district 1.944
Budapest XXII. district 2.500
Cegléd 3.000
Debrecen 2.500 1.184
Edelény 300 300
Esztergom 700 1.000
Fejér County 700 1.600
Fonyód 900
Gárdony 1.100
Gödöllő 802
Gyöngyös 676
Gyömrő 445
Gyula 4 2.000
Hódmezővásárhely 10.862
Karcag 4.100
Kiskunfélegyháza 1.968
Marcali 1.000
Mohács 4.000
Ócsa 1.300
Oroszlány 150 150
Sopron 2.555
Somogy County 1.200
Székesfehérvár 1.345
Szerencs 1.000
Szolnok 8.700
Tolna 1.000
Total 3.657 22.119 34.713

Hindrances to public issues of bonds
•relatively small deal size
•banks (group members) buy entire issues and do not want to “securitize” their well-performing portfolios
•expense of disclosure, registration, advertising, market-making, stock market listing
•privately-placed bonds are essentially substitutes for bank loans
•Bank lending dominates corporate finance, few listed issues

Who are the key players?
Universal Banking services (accounts management) and lending dominated by:
OTP Bank and Raiffeisen Bank
Second tier: Erste, CIB (Intesa Gruppo), K & H (KBC Bank), Commerzbank, savings cooperatives, UniCredit
Rumors of Raiffeisen-Erste merger in Austria?

More key players…
Boutique players: NÖ Hypobank (cross-border), Dexia Kommunalkredit (portfolio, syndication)
Not active in municipal account management or lending: MKB (Bayerische Landesbank), Budapest Bank (GE
Moneybank), Citibank, Dresdner, Calyon, Oberbank, Sopron Bank, Deutsche Bank, Allianz Bank, BNP Paribas, ING Bank, Volksbank, WestLB etc.

Risks: Creditworthiness, default and debt adjustment
•very low default rate on municipal loans (few loans in higher risk category)
•Businesses are not „tough” on municipal clients
•Basel II treats municipal debt and debt of municipal companies favorably (statistics will soon show
exposure to corporatized municipal companies)
•-Act on Municipal Debt Adjustment (1996)
•PUCs („JKP”) were corporatized in 1991 and appear as commercial loans, i.e. are hidden

Lessons learned…
Municipalities are considered low risk despite slow and inaccurate information flow
Foreign currency lending now close to 40%
Competition is intense for accounts management and lending services
Lending has started to shift to private bond issues for reasons unrelated to cost
Accounts management and collateralized lending now not prerequisites (information monopoly)
Public procurement law distorts market

More...
Secondary regulations are critical
Banks prefer to retain municipal portfolios
Bond market developed 10 years after regulatory framework was in place
Non-bank financial institutions tend to ignore municipal lending market and do not buy municipal securities for their portfolios
If bonds are issued in great numbers for the wrong reason, regulators will overreact

Information Sources
National Bank of Hungary statistics:
http://english.mnb.hu
Hungarian Financial Markets Supervision:
http://english.pszaf.hu
Municipal bankruptcy case studies:
www.igeconsulting.com
EU Directives: 92/50/EEC listed financial services in Annex 1A; 2004/18/EC exempted bond issues and other securities from public procurement. Banking services, such as loans, are not exempt.
http://ec.europa.eu/internal_market/publicprocurement/legislation_en.htmstandard