Munehiko Yamaguchi, Sharanya S. Majumdar (RSMAS/U. Miami) and multiple collaborators 3 rd THORPEX...
73
Munehiko Yamaguchi, Sharanya S. Majumdar (RSMAS/U. Miami) and multiple collaborators 3 rd THORPEX International Science Symposium 14 Sep. 2009 Coordinated use of targeted observations during TCS-08/T- PARC
-
Upload
grant-harvey-taylor -
Category
Documents
-
view
247 -
download
7
Transcript of Munehiko Yamaguchi, Sharanya S. Majumdar (RSMAS/U. Miami) and multiple collaborators 3 rd THORPEX...
Munehiko Yamaguchi, Sharanya S. Majumdar (RSMAS/U. Miami) and multiple collaborators
3rd THORPEX International Science Symposium
14 Sep. 2009
Coordinated use of targeted observations during TCS-08/T-PARC

Outline of the talk
1. What we did before TCS-08/T-PARC
2. What we did during TCS-08/T-PARC
3. What we learned from TCS-08/T-PARC
I would talk the above 3 from a perspective
of targeted observations
Pretty Simple…

Guideline on targeting products and timelinesAfter the Hawaii meeting in December 2007 (8 months before TCS-08/T-PARC), our targeting group created a guideline on targeting products and timelines because it was found that many institutes could provide the sensitivity analysis guidance and the availability time of each guidance varied from one center to another. (Final version of the guideline was completed in July…)
Singular vectors
•ECMWF
•NRL (based on NOGAPS)
•JMA
•U Yonsei (based on MM5)
Adjoint based SAG
•NTU (ADSSV)
•NRL (based on COAMPS)
EKF
•UKMO (ETKF based on MOGREPS)
•U Miami/NCEP (ETKF based on NCEP + ECMWF ensembles)
•U Washington (EKF based on WRF)
Ensemble variance
•NOAA (based on NCEP ensembles)
10 kinds of SAG in total (many talks and posters about
SAG and targeting during TTISS)

Website providing sensitivity analysis guidance
1. UCAR/EOL T-PARC/TCS-08 website
2. JMA T-PARC website
3. PREVIE system developed by ECMWF in partnership with UK Met Office.
UCAR/EOL JMA ECMWF PREVIEW
We mainly used the PREVIEW system for the comparison of the sensitivity analysis guidance

PREVIEW System
Sensitive Area Predictions (SAPs)
• Automatic submission of 5 fixed areas
• Up to 5 additional areas chosen
interactively
• Flexible choice of targeting time
(t + 18 to 102 h)
and verification time
(t + 36 to 120 h)
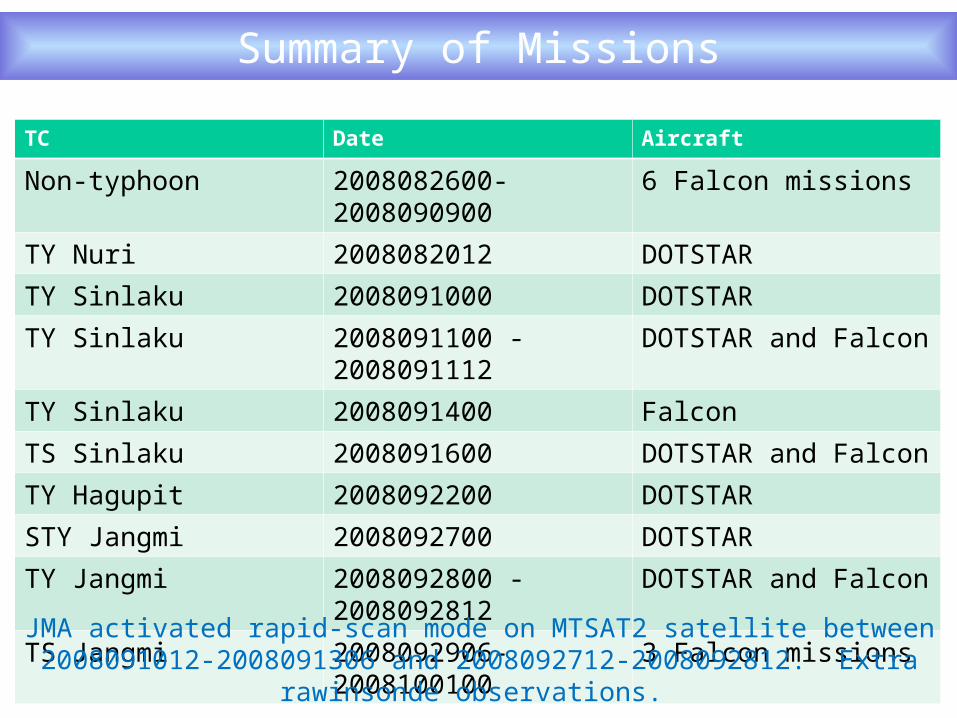
TC Date Aircraft
Non-typhoon 2008082600-2008090900 6 Falcon missions
TY Nuri 2008082012 DOTSTAR
TY Sinlaku 2008091000 DOTSTAR
TY Sinlaku 2008091100 - 2008091112
DOTSTAR and Falcon
TY Sinlaku 2008091400 Falcon
TS Sinlaku 2008091600 DOTSTAR and Falcon
TY Hagupit 2008092200 DOTSTAR
STY Jangmi 2008092700 DOTSTAR
TY Jangmi 2008092800 - 2008092812
DOTSTAR and Falcon
TS Jangmi 2008092906-2008100100 3 Falcon missionsJMA activated rapid-scan mode on MTSAT2 satellite between 2008091012-2008091306 and 2008092712-2008092812. Extra rawinsonde observations.
Summary of Missions

Targeting Elluminate Session
The targeting group hold an 1-hour Targeting Elluminate Session before the Daily Planning Meeting when targeting missions might be expected and mainly discussed about
1.Synopsis based on satellite images and analysis fields by global models such as ECMWF, UKMO, GFS and NOGAPS.
2.Available observation resources
3.Forecast uncertainty using ensemble products such as tracks and spread of Z500.
4.Sensitivity analysis guidance
5.Tentative flight plan

Following 3 slides are the slides we really used in the Targeting Elluminate Session starting from 21UTC 9th September 2008 for a flight mission for Typhoon Sinlaku at 00 UTC 11th September 2008.

JMA Typhoon EPS JMA Typhoon EPS
2008.09.09 06UTC ini +132h2008.09.09 06UTC ini +132h
JMA Medium-Range EPS JMA Medium-Range EPS
2008.09.08 012UTC ini +216h2008.09.08 012UTC ini +216h
EPS track forecasts
ECMWF EPS ECMWF EPS
2008.09.08 12UTC ini +120h2008.09.08 12UTC ini +120h
GFS EPS GFS EPS
2008.09.09 12UTC ini +???h2008.09.09 12UTC ini +???h

Sensitivity Guidance: Obs. Time 09/11 00Z
ECMWF NOGAPS JMA
UM ETKF UK ETKF COAMPS
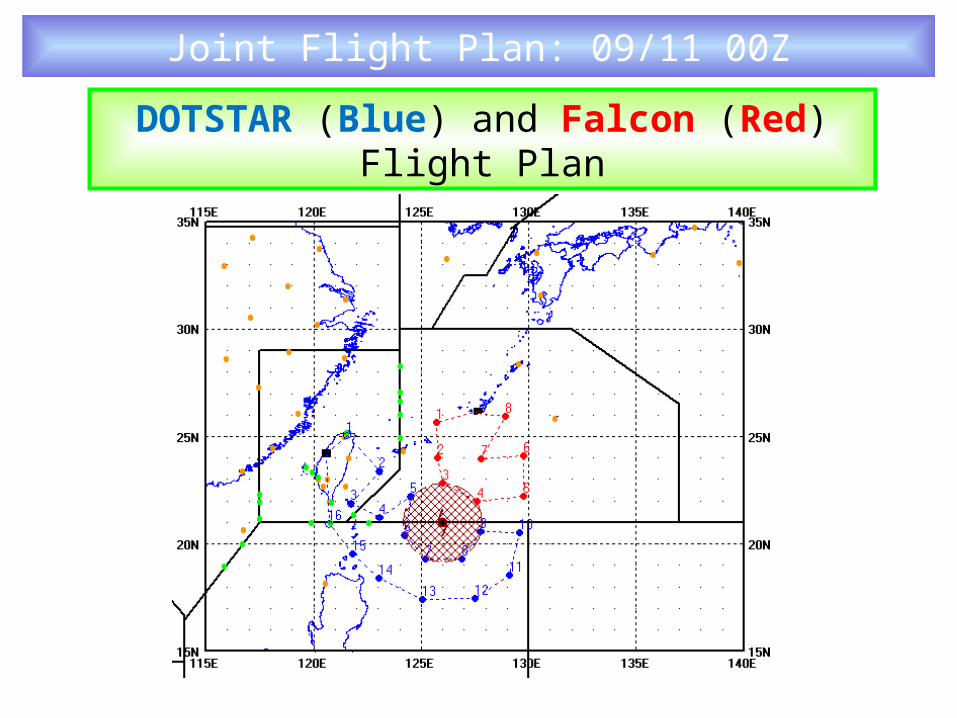
Joint Flight Plan: 09/11 00Z
DOTSTAR (Blue) and Falcon (Red) Flight Plan

Canceled Flight: Mission at 09/12 00Z
DOTSTAR
!!! Canceled !!!
The latest email from Wu-san said, “Concerning the weather condition not suitable for a feasible targeting flight, the DOTSTAR mission for 00UTC 12 Sept. has just been called off.”
Due to the weather condition, the planned DOTSTAR mission at 00UTC 12th Sept. was canceled.

Sensitivity region not fully covered: Mission at 09/10 00Z
ECMWF NOGAPS
Obs. Points cover sensitive regions proposed by guidance
Area surrounded by black line is also sensitive
DOTSTAR Flight Plan
JMA Due to the limited aircraft resources, the sensitivity area was not fully covered.

Summary
1. The Guideline on targeting products and timelines were helpful in understanding when and what products were available at each meeting help in Monterey, Tokyo, Taiwan, etc.
2. The Websites were useful to compare the various kinds of sensitivity analysis guidance.
3. The targeting group hold the 1-hour Targeting Elluminate Session when targeting mission was expected.
4. We conducted targeting missions for 4 typhoons.
5. Due to the weather condition and limited aircraft resources, we had to be very flexible in the decision-making process.
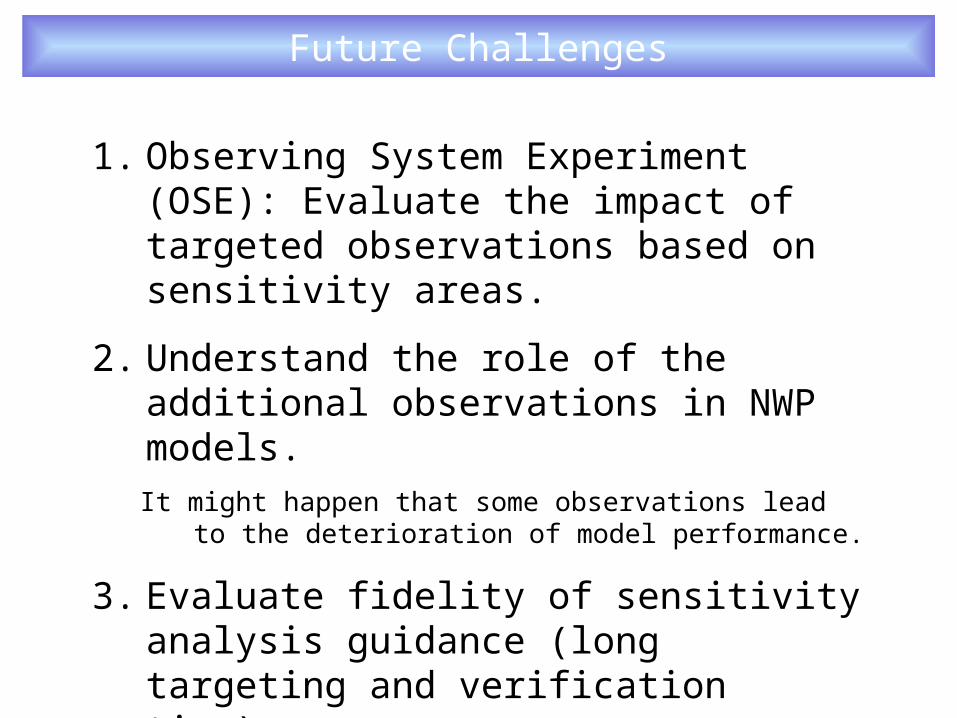
Future Challenges
1. Observing System Experiment (OSE): Evaluate the impact of targeted observations based on sensitivity areas.
2. Understand the role of the additional observations in NWP models.It might happen that some observations lead to the deterioration of
model performance.
3. Evaluate fidelity of sensitivity analysis guidance (long targeting and verification time).
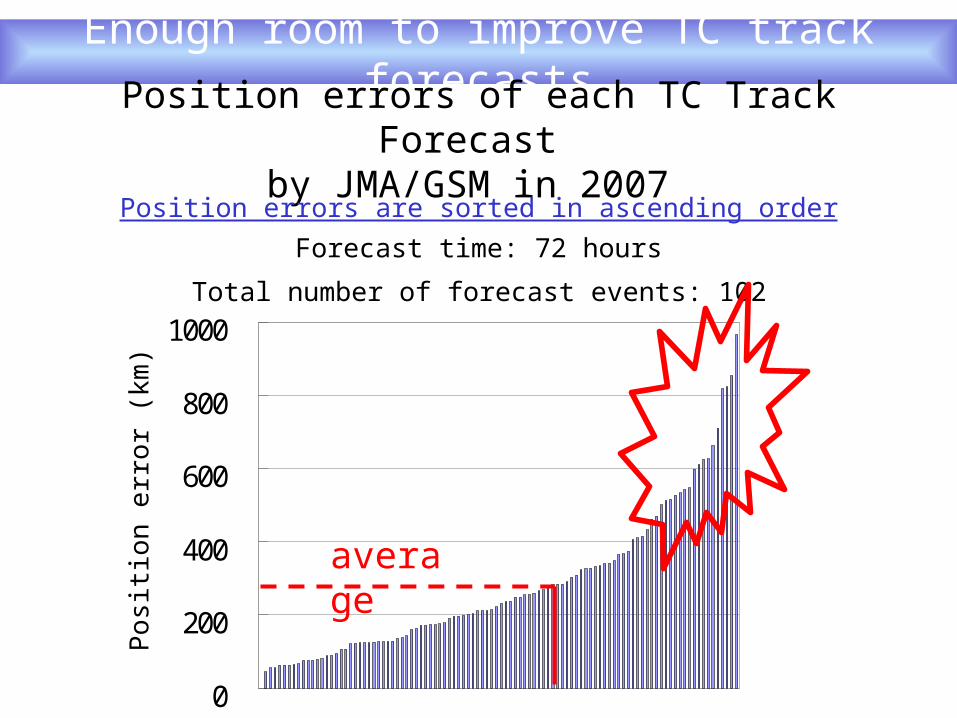
Enough room to improve TC track forecasts
0
200
400
600
800
1000
Pos
ition
err
or (
km)
average
Position errors of each TC Track Forecast by JMA/GSM in 2007
Forecast time: 72 hours
Total number of forecast events: 102
Position errors are sorted in ascending order

Various approach to improve forecasts
ObservationData
assimilation
Numerical weather
predictionUser
Current system
•Reducing the errors of deterministic track forecasts is not only the approach.
•Providing confidence information based on ensemble forecasts is also one way to improve TC track forecasts.
•Yamaguchi et. al (2009) developed the Typhoon Ensemble Prediction System (EPS) at the Japan Meteorological Agency and demonstrated that the ensemble spread is an indicator of confidence of TC track forecasts.

0
500
1000
1500
2000
2500
3000
0 4000 8000 12000Ensemble spread of TC positions2 (ensemble spread accumulated from 0 to 120 hour
forecasts every 6 hours)
Pos
itio
n E
rror
s of
Ens
embl
e M
ean
at 5
-day
for
ecas
ts (
km)
Number of sample1 : 149
Strong relationship between ensemble spread and position error of ensemble mean track forecasts
1.The TC strength of L is included in this verification
2. Ensemble mean tracks are defined using more than 1 ensemble member
Confidence information provided by ensemble forecasts

How to bring out forecast uncertainties
T=t0 T=t1
Analysis field
Deterministic forecast
Ensemble member
Uncertainty of Analysis field
Forecast Uncertainty
Dramatis PersonaeDramatis Personae
Ensemble spread is a variability (standard deviation) between the members in the ensemble forecast.
Ensemble spread can be used as an indicator of confidence of forecast.
Ensemble spread is a variability (standard deviation) between the members in the ensemble forecast.
Ensemble spread can be used as an indicator of confidence of forecast.

ECMWF NCEP
Sinl
aku
init
iate
d at
12
UT
C 1
0 Se
p. 2
008
Dol
phin
init
iate
d at
00
UT
C 1
3 D
ec. 2
008
Some contradictions as seen among various EPSs
The grey lines are ensemble track predictions.
The black line is the best track.
The black triangles are the forecast positions at 120-h.
Japan
Philippines
Taiwan
The recently established The Observing System Research and Predictability Experiment (THORPEX) Interactive Grand Global Ensemble (TIGGE) database makes it possible to conduct a systematic inter-comparison of global model ensembles and investigate the reason why the ensemble spread changes from one EPS to another.

Specifications of ECMWF, NCEP and JMA EPS
Note thatThe verifications in this study are based on initial time 0000 UTC unless otherwise noted because the most of the airborne observations were conducted centered on 0000 UTC.
Verification results of JMA are based on 1200 UTC because JMA’s EPS is initiated only at 1200 UTC.
JMA’s EPS is the Medium-range EPS, not the Typhoon EPS.

What I did
Calculation procedures:1.Download u and v of initial ensemble fields at 1000, 925, 850, 700, 500, 300, 250 and 200 hPa through ECMWF’s TIGGE site.2.Convert the latitude-longitude coordinate into the x-y coordinate centered on the central position of Sinlaku.3.Calculate ensemble perturbations (u’ and v’) of all ensemble members at each vertical level.4.Calculate kinetic energy defined as u’^2+v’^2 from the results of 3.5.Calculate grid- and ensemble-averaged kinetic energy at each vertical level over the 2000km x 2000km domain and draw the vertical profile.6.Calculate vertically- and ensemble-averaged kinetic energy over the 2000km x 2000km domain and draw the horizontal distribution.
I compared the kinetic energy of ensemble initial perturbations for Typhoon Sinlaku, using TIGGE data from ECMWF, NCEP and JMA* (Medium range EPS, not Typhoon EPS).
I calculated the following two elements through 10th to 19th of September 2008.
1. Vertical profile of the kinetic energy
2. Horizontal distribution of the kinetic energy

Best track and intensity of Typhoon Sinlaku

Synopsis in a before-recurvature stage
500 hPa 250 hPa
Geopotential height (solid line) and stream function (dash line)
Sinlaku was located west of the Pacific High. The High is not strong enough to interact with the typhoon, so the steering caused by the Pacific High is weak. Sinlaku moved very slowly at that time; less than 10 km h-1.

Synopsis in a during-recurvature stage
500 hPa 250 hPa
Geopotential height (solid line) and stream function (dash line)
Sinlaku was located in a confluent area induced by the westerly jet and the southerly flow at the west edge of the Pacific

Synopsis in a after-recurvature stage
500 hPa 250 hPa
Geopotential height (solid line) and stream function (dash line)
Sinlaku was sandwiched by both features; it was located north of the Pacific High and south of the westerly jet, being advected by the confluent westerlies.
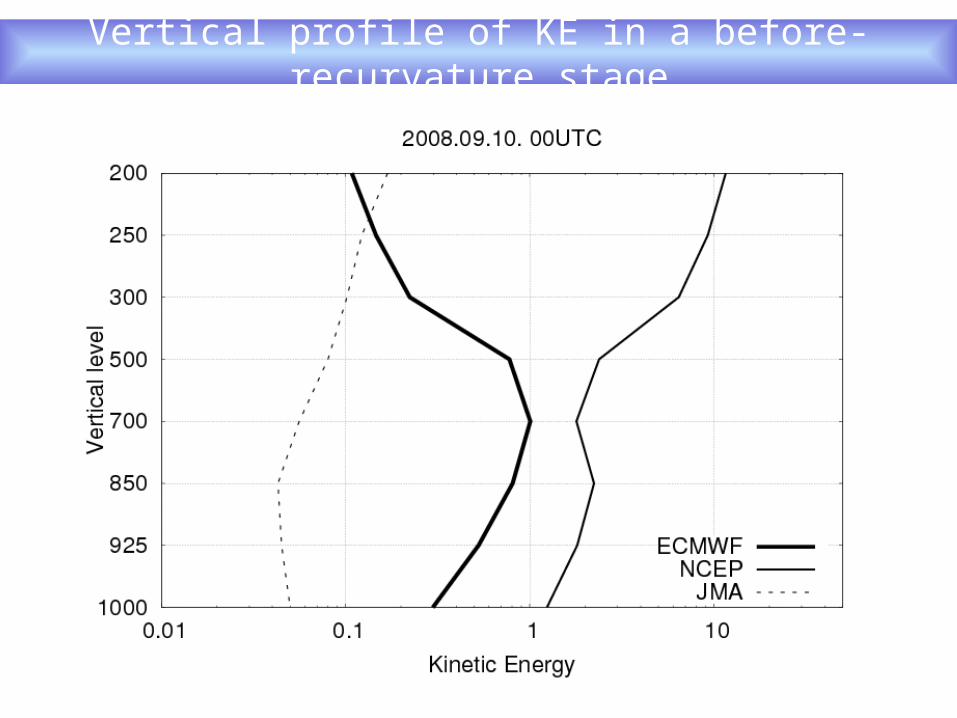
Vertical profile of KE in a before-recurvature stage

Note that the scale of NCEP is 10 times as large as that for ECMWF and JMA
Vertically averaged horizontal distribution of KE in a before-recurvature stage
ECMWF NCEP JMA
Storm-relative coordinate with the domain of 2000 km x 2000kmStorm-relative coordinate with the domain of 2000 km x 2000km
2000km
2000km

ECMWF NCEP JMA
Vertically averaged kinetic energy of ensemble initial perturbationsVertical profile of
kinetic energy of ensemble initial
perturbations
2000km
JMA
ECMWF
NCEP
Comparison of kinetic energy of ensemble initial perturbations for Typhoon Sinlaku (2008)
Storm-relative coordinateStorm-relative coordinate
2000km 1
0 S
ep. 0
0Z
(bef
ore-
recu
rv.)
15 S
ep. 0
0Z
(du
rin
g-re
curv
.)18
Sep
. 00Z
(a
fter
-rec
urv
.)

Temperature and specific humidity perturbation
I did the same verifications for temperature and specific humidity perturbations.
Total energy = ½ {(u’2 + v’2)
+ cpT’T’/Tr
+ Lc Lc q’ q’/cp/Tr}
cp is the specific heat of dry air at constant pressure, T’ is a temperature perturbation about the control analysis, and Tr = 300 K is a reference temperature. Similarly, Lc is the latent heat of condensation and q’ is a specific humidity perturbation.
! Kinetic energy
! Available Potential energy
! Specific humidity energy
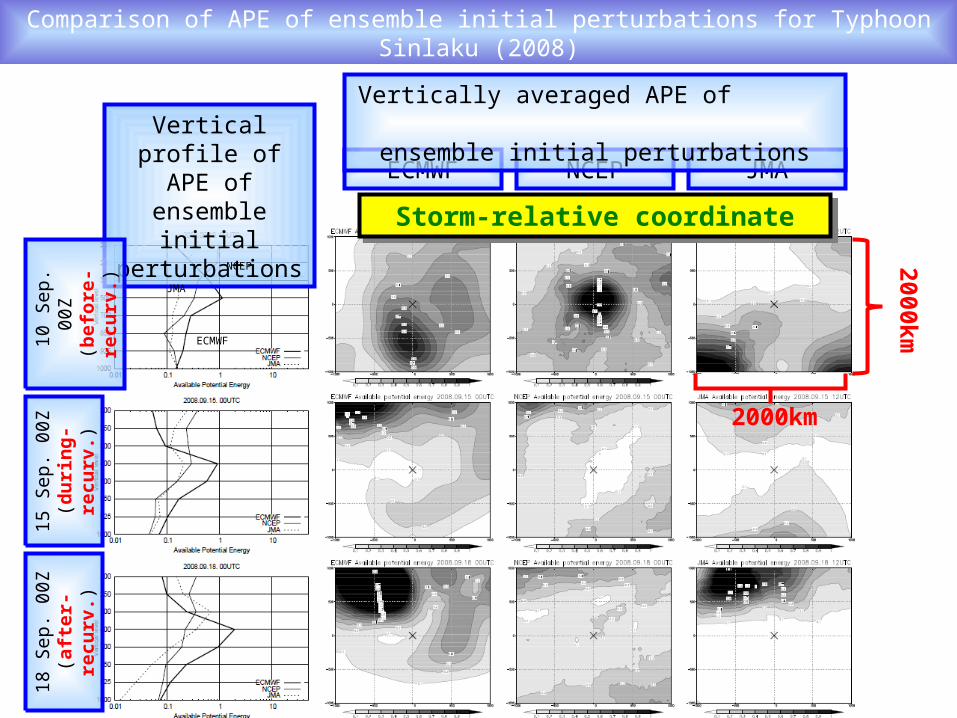
ECMWF NCEP JMA
Vertically averaged APE of ensemble initial perturbationsVertical profile of
APE of ensemble initial perturbations
2000km
JMA
ECMWF
NCEP
Comparison of APE of ensemble initial perturbations for Typhoon Sinlaku (2008)
Storm-relative coordinateStorm-relative coordinate
2000km 1
0 S
ep. 0
0Z
(bef
ore-
recu
rv.)
15 S
ep. 0
0Z
(du
rin
g-re
curv
.)18
Sep
. 00Z
(a
fter
-rec
urv
.)
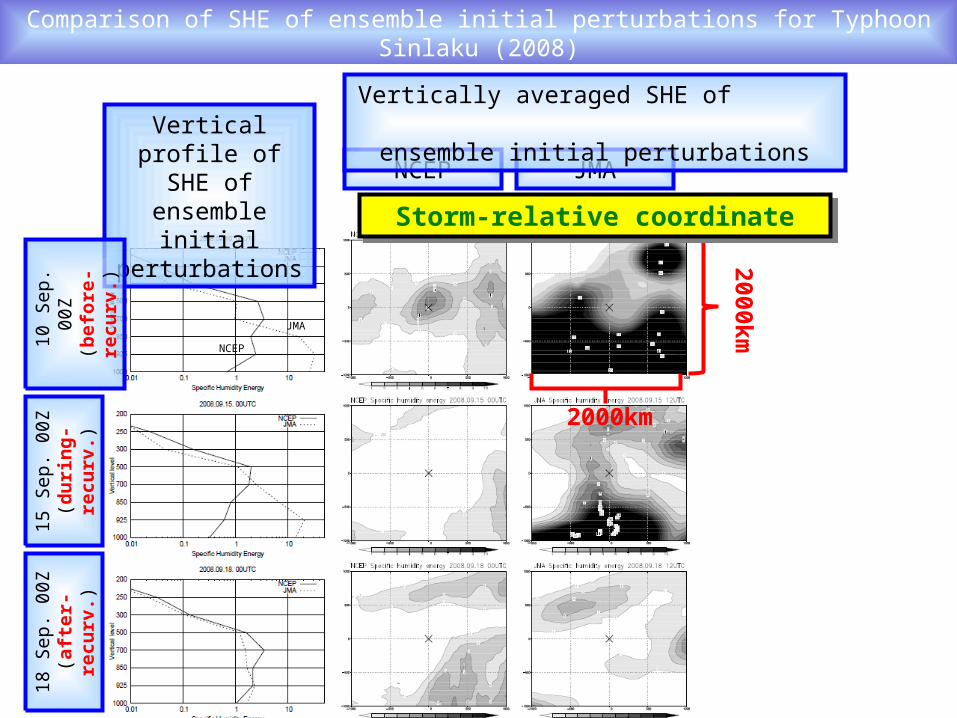
NCEP JMA
Vertically averaged SHE of ensemble initial perturbationsVertical profile of
SHE of ensemble initial perturbations
2000km
JMA
NCEP
Comparison of SHE of ensemble initial perturbations for Typhoon Sinlaku (2008)
Storm-relative coordinateStorm-relative coordinate2000km
10
Sep
. 00Z
(b
efor
e-re
curv
.)15
Sep
. 00Z
(d
uri
ng-
recu
rv.)
18 S
ep. 0
0Z
(aft
er-r
ecu
rv.)

ECMWF’s perturbations
1. ECMWF perturbs wind and temperature and does not perturb specific humidity.
2. In the before-recurvature stage, the ECMWF wind perturbation has a peak at 700-hPa on average and is largest in the near environment of the typhoon. Looking at each ensemble member, the maximum amplitude is found to be 4.4 m s−1, appearing about 700 km away from the typhoon center while the amplitude within 100 km from the typhoon center is only 1.6 m s−1 at most.
3. As the typhoon moves northward, the amplitude above 500-hPa becomes larger, corresponding to the change in the area of highest amplitude from the typhoon surroundings to the synoptic features north of the typhoon.
4. As with the wind perturbation, the temperature perturbation also has a peak in the mid-troposphere (e.g., the maximum amplitude in the before-recurvature stage is 2.6 K at 500-hPa and about 500 km away from the typhoon center, implying that the perturbation has little influence on the warm core structure in the inner region).
5. The vertical profiles of the wind and temperature perturbations are quite similar to those of perturbations seen in TEPS at JMA, that also uses singular vectors targeted for TCs (Yamaguchi et al 2009).
NCEP’s perturbations
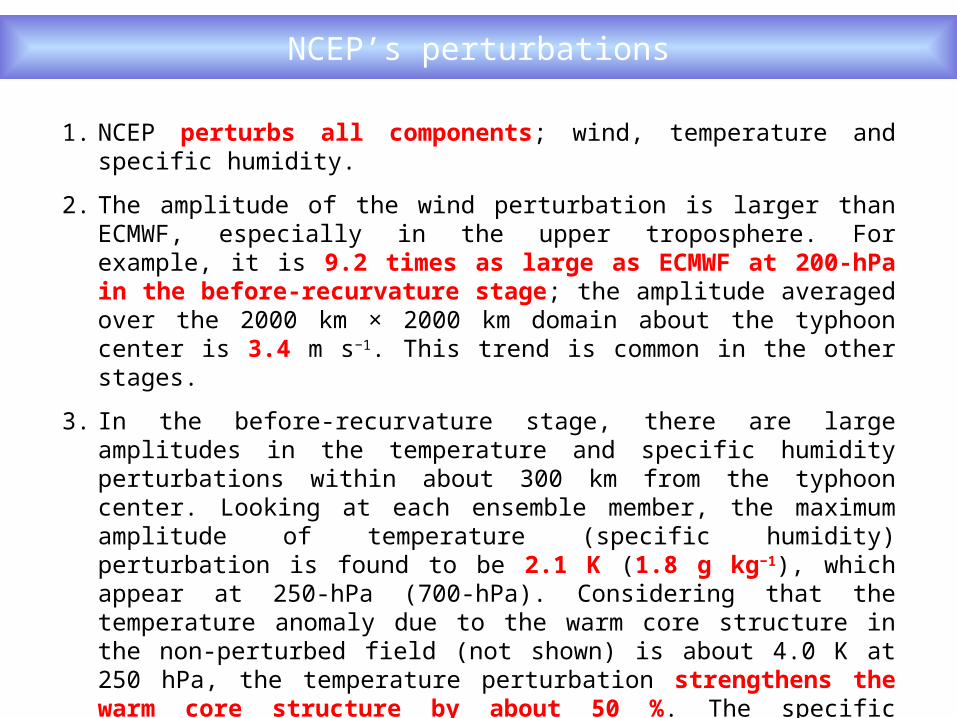
1. NCEP perturbs all components; wind, temperature and specific humidity.
2. The amplitude of the wind perturbation is larger than ECMWF, especially in the upper troposphere. For example, it is 9.2 times as large as ECMWF at 200-hPa in the before-recurvature stage; the amplitude averaged over the 2000 km × 2000 km domain about the typhoon center is 3.4 m s−1. This trend is common in the other stages.
3. In the before-recurvature stage, there are large amplitudes in the temperature and specific humidity perturbations within about 300 km from the typhoon center. Looking at each ensemble member, the maximum amplitude of temperature (specific humidity) perturbation is found to be 2.1 K (1.8 g kg−1), which appear at 250-hPa (700-hPa). Considering that the temperature anomaly due to the warm core structure in the non-perturbed field (not shown) is about 4.0 K at 250 hPa, the temperature perturbation strengthens the warm core structure by about 50 %. The specific humidity perturbation increases the moisture by 16 % at 700-hPa with respect to the non-perturbed field.

JMA’s perturbations
1. JMA also perturbs all components; wind, temperature and specific humidity.
2. JMA’s perturbations are characterized by the large amplitude of the specific humidity perturbation. For example, it is 3.7 times as large as NCEP at 925-hPa in the before-recurvature stage; the amplitude averaged over the 2000 km × 2000 km domain about the typhoon center is 1.25 g kg−1.
3. The perturbation area is not in the typhoon surroundings but mainly south of the typhoon. This is because JMA uses moist singular vectors for creating the perturbations and they are not targeted for each TC, but for the entire tropics. That is why the amplitude south of the typhoon becomes smaller as the typhoon moves north.
4. On the other hand, the amplitude of the wind perturbation is small. For example, it is a quarter of ECMWF at 700-hPa in the before-recurvature stage; the amplitude averaged over 2000 km × 2000 km domain about the typhoon center is 0.24 m s−1. This trend is common in the other stages.

How do the perturbations modify the symmetric and asymmetric wind field of Typhoon?

Symmetric wind field
ECMWF NCEP
Tangential wind at 850-hPa (before recurvature stage)Tangential wind at 850-hPa (before recurvature stage)
Black: CTL
Grey: Ensemble member
1. The size of the typhoon (radial profile of the symmetric component of tangential wind) is similar among the ensemble members in each EPS;
2. The range of maximum tangential wind is less than 1 m s−1
3. The radius of the maximum tangential wind does not change significantly;
4. The differences between ECMWF and NCEP are much larger than the differences caused by the initial perturbations in each ensemble.
5. These trends are common in other stages.

Asymmetric wind field
Steering flow at 500-hPa (before recurvature stage)Steering flow at 500-hPa (before recurvature stage)
Black: CTL
Grey: Ensemble member
ECMWF NCEP
The steering flow is defined here as the asymmetric flow at 500-hPa averaged over 300 km from the typhoon center.
1. The ensemble members are dispersed around the non-perturbed member in both EPSs.
2. The change in the steering flow of NCEP is larger than ECMWF; In the before-recurvature stage, it is 0.67 m s −1 for NCEP and 0.49 m s−1 for ECMWF on average.
3. These trend are common in other stages, probably due to the relatively large amplitude of initial perturbations

Perturbation evolution for Sinlaku

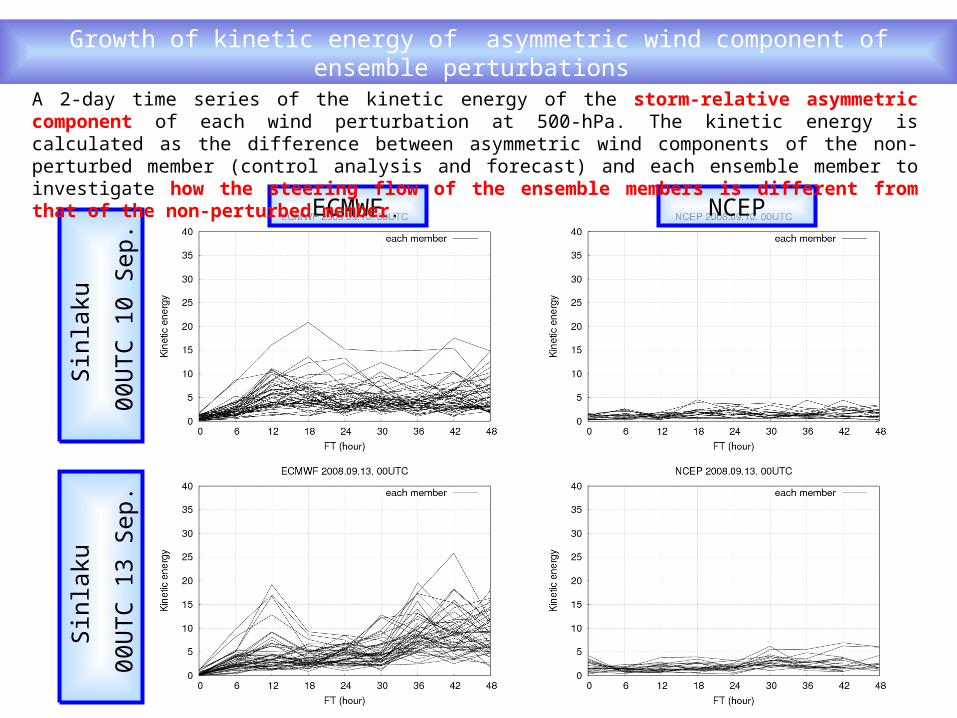
Growth of kinetic energy of asymmetric wind component of ensemble perturbations
A 2-day time series of the kinetic energy of the storm-relative asymmetric component of each wind perturbation at 500-hPa. The kinetic energy is calculated as the difference between asymmetric wind components of the non-perturbed member (control analysis and forecast) and each ensemble member to investigate how the steering flow of the ensemble members is different from that of the non-perturbed member.
ECMWF NCEP
Before recurvature stage (00Z 10th Sep. 2008)Before recurvature stage (00Z 10th Sep. 2008)

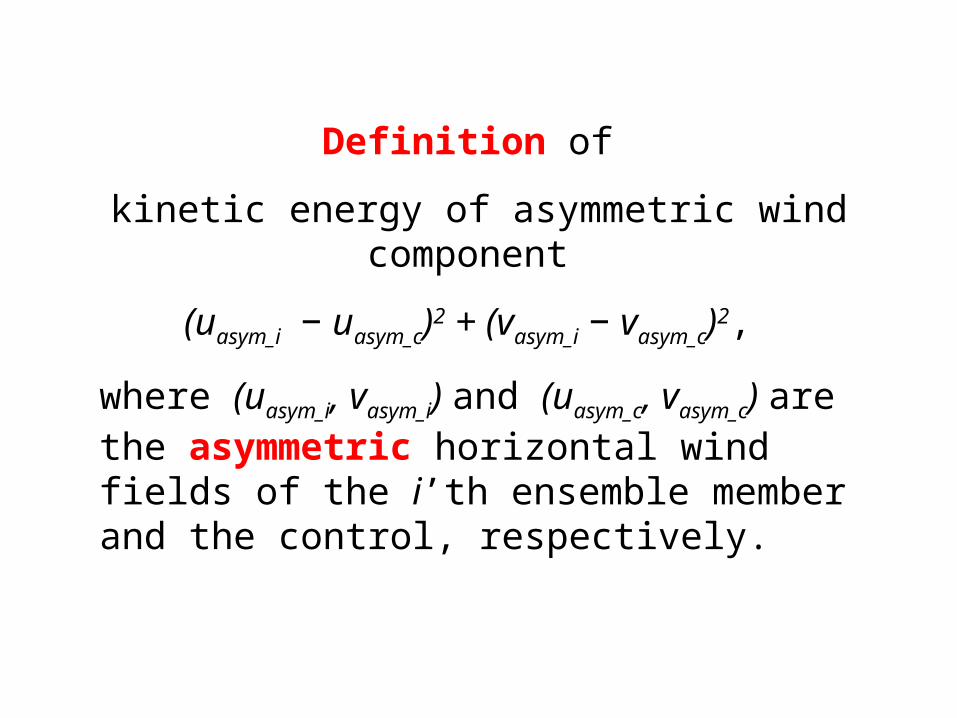
Definition of
kinetic energy of asymmetric wind component
(uasym_i − uasym_c)2 + (vasym_i − vasym_c)2,
where (uasym_i, vasym_i) and (uasym_c, vasym_c) are the asymmetric horizontal wind fields of the i’th ensemble member and the control, respectively.
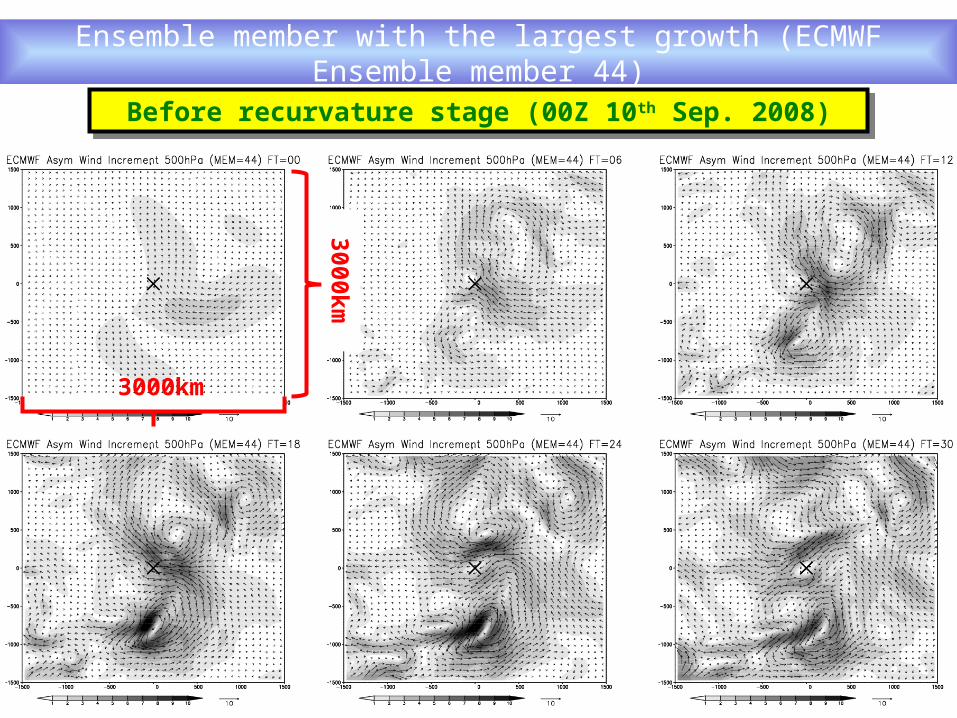
Ensemble member with the largest growth (ECMWF Ensemble member 44)
Before recurvature stage (00Z 10th Sep. 2008)Before recurvature stage (00Z 10th Sep. 2008)
3000km
3000km

Track of EPS member with the largest growth (ECMWF)
Ensemble member 43Ensemble member 44
Westernmost (left) and easternmost (right) course among all EPS members


Definition of
kinetic energy of ensemble initial perturbations
(ui − uc)2 + (vi − vc)2,
where (ui, vi) and (uc, vc) are the horizontal wind fields of the i’th ensemble member and the control analysis about which the ensemble is constructed, respectively.
ECMWF NCEP
Sinl
aku
00U
TC
13
Sep.
Sinl
aku
00U
TC
10
Sep.
Growth of kinetic energy of asymmetric wind component of ensemble perturbations
A 2-day time series of the kinetic energy of the storm-relative asymmetric component of each wind perturbation at 500-hPa. The kinetic energy is calculated as the difference between asymmetric wind components of the non-perturbed member (control analysis and forecast) and each ensemble member to investigate how the steering flow of the ensemble members is different from that of the non-perturbed member.
Definition of
kinetic energy of asymmetric wind component
(uasym_i − uasym_c)2 + (vasym_i − vasym_c)2,
where (uasym_i, vasym_i) and (uasym_c, vasym_c) are the asymmetric horizontal wind fields of the i’th ensemble member and the control, respectively.
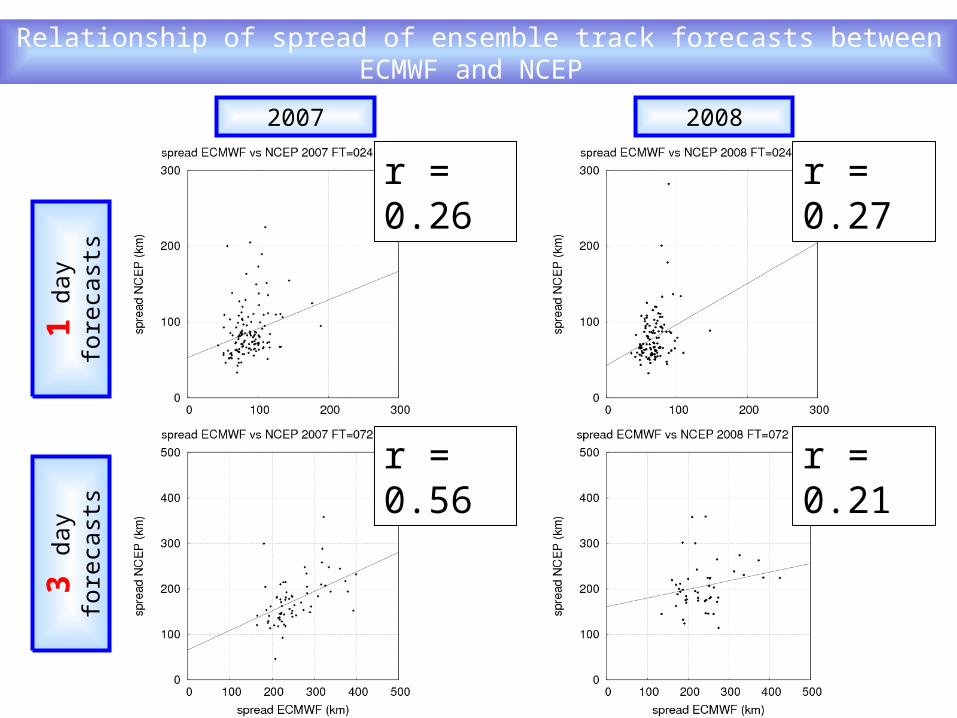
2007 2008
1 da
y fo
reca
sts
3 da
y fo
reca
sts
Relationship of spread of ensemble track forecasts between ECMWF and NCEP
r = 0.27
r = 0.21r = 0.56
r = 0.26

Summary
1. Ensemble perturbations and their growth around a tropical cyclone are investigated using the THORPEX Interactive Grand Global Ensemble (TIGGE).
2. Vertical and horizontal distributions of initial perturbations produced by the European Centre for Medium-Range Weather Forecasts (ECMWF), the National Centers for Environmental Prediction (NCEP) and the Japan Meteorological Agency (JMA) are compared for Typhoon Sinlaku
3. The amplitudes and distributions of the perturbations are found to be different among the 3 centers: before, during and after recurvature.
4. The growth rate of the asymmetric component of wind perturbations (that control the steering flow) is much higher in the ECMWF ensemble than that of NCEP, usually leading to a relatively large ensemble spread of tracks in ECMWF for forecasts beyond 3 days. Due to the relatively large amplitudes of their initial perturbations, NCEP generally possesses a larger ensemble spread at forecast times of order 1 day.

Interactive forecast system
ObservationData
assimilation
Numerical weather
predictionUser
Current system
Interactive forecast system
adaptive observations
sensitivity analysis
ObservationData
assimilationUser
A sensitive analysis technique is needed to maximize the effect on a numerical prediction and to minimize the cost of the observations.
sensitive area
Adaptive observations©Vaisala
©JAXA
© NASA
Numerical weather
prediction

2nd year in RSMAS
On singular vector based sensitivity analysis for tropical cyclones in a non-divergent barotropic framework
Title:
Motivation:How sensitive are the fast-growing perturbations to the intensity, size and asymmetry of the initial TC-like vortex?
How does the perturbations (sensitivity region) affect track forecasts?
Methodology:Using the SPECTRAL ELEMENT OCEAN MODEL (M. Iskandarani et al. 1995), singular vectors are computed for various initial conditions.

Sharanya S. Majumdar1
Melinda S. Peng2
Carolyn A. Reynolds2
David S. Nolan1
1. Rosenstiel School of Marine and Atmospheric Science, University of Miami
2. Marine Meteorology Division, Naval Research Laboratory
Acknowledgments
Thank you for listening

Present status of tropical cyclone track forecasts
The Japan Meteorological Agency (JMA) provides tropical cyclone track forecasts in the form of a probability circle, which is a circular range into which a tropical cyclone is expected to move with a 70% probability at each valid time. The radius is determined statistically from the recent verification results of track forecasts.
Forecast time (hours)
Direction of movement (deg.) Speed of movement (V)
V = < 15 kt 15kt < V = < 30 kt
V > 30 kt
12 60 NM 60 NM 100 NM
24
Before recurvature (180-310) 80 NM
100 NM 150 NM During recurvature (320-000) 90 NM
After recurvature (010-170) 100 NM
48
Before recurvature (180-310) 150 NM
170 NM 190 NM During recurvature (320-000) 150 NM
After recurvature (010-170) 160 NM
72
Before recurvature (180-310) 220 NM
270 NM 400 NM During recurvature (320-000) 220 NM
After recurvature (010-170) 290 NM
Probability circle
Radius of Probability Circle

Best track
Best track
Typhoon CHABA
Initial: 2004.08.28 12 UTC
Typhoon CHABA
Initial: 2004.08.28 12 UTCTyphoon MARIA
Initial: 2006.08.06 12 UTC
Typhoon MARIA
Initial: 2006.08.06 12 UTC
Deterministic forecasting is as good a guess as anyAnother day,
the deterministic forecast by JMA/GSM is wrong…
One day, the deterministic forecast by
JMA/GSM is perfect!
Red line: JMA/GSM Black line: Best track

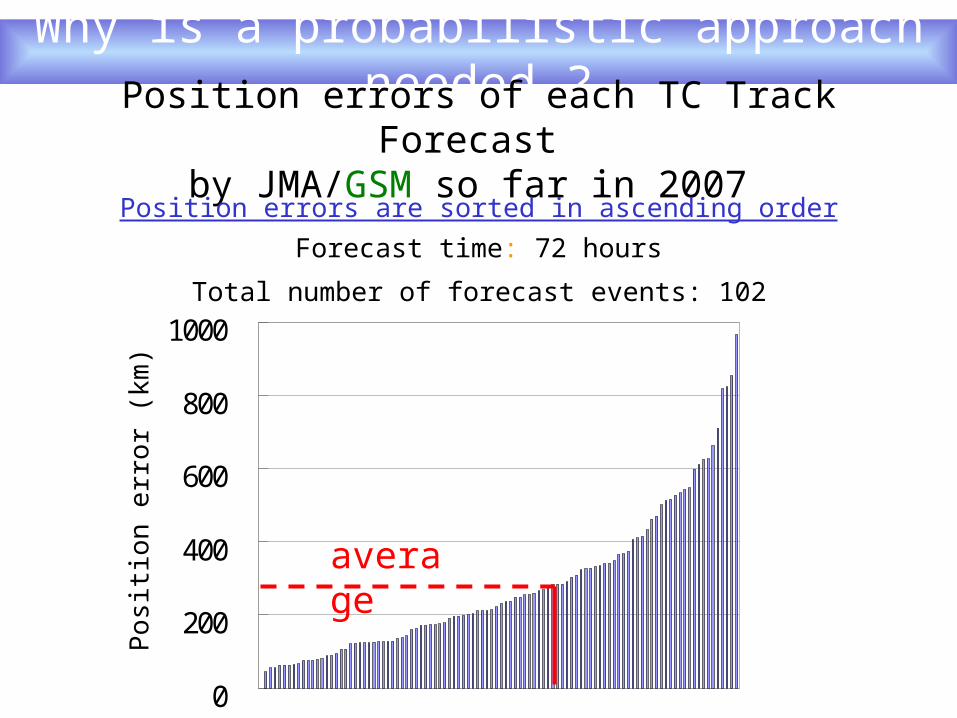
Why is a probabilistic approach needed ?
0
200
400
600
800
1000
Pos
ition
err
or (
km)
average
Position errors of each TC Track Forecast by JMA/GSM so far in 2007
Forecast time: 72 hours
Total number of forecast events: 102
Position errors are sorted in ascending order

JMA begins operation of the Typhoon EPS
The 20 km GSM, which will become operational from 21st Nov, will support both TC track and intensity forecasting.
The Japan Meteorological Agency (JMA) has developed a new ensemble prediction system (EPS) known as the Typhoon EPS, aiming to further improve both deterministic and probabilistic forecasting of TC movements. We will start operation of the Typhoon EPS no later than the beginning of the typhoon season in 2008 following preliminary operation since May 2007.

Pos
ition
err
or (
km)
Num
ber
of S
ampl
es
Forecast time (hours)
Compared with control forecasts, ensemble mean forecasts statistically have smaller errors, especially after four-day forecasts.
Black: Control Run
Red: Ensemble Mean
Black: Control Run
Red: Ensemble Mean
The Typhoon EPS provides better deterministic forecasts

Forecast uncertainty changes day by day (1)
Best track
Example of probabilistic forecast.
There is only one conceivable scenario!
Example of probabilistic forecast.
There is only one conceivable scenario!
Each ensemble member having a common track scenario means that the scenario is highly likely. People can act accordingly, e.g. those in areas where predictions show no possibility of the typhoon striking can avoid taking unnecessary action against it.
Deterministic forecast (red line)
Initial: 2004.08.28 12 UTC
Deterministic forecast (red line)
Initial: 2004.08.28 12 UTC
Typhoon EPS(11 members: red to orange)
(blue: control forecast)
Deterministic forecast

Forecast uncertainty changes day by day (2)
Each ensemble member having a common track scenario means that the scenario is highly likely. People can act accordingly with full confidence, e.g. they can prepare for possible damage well in advance.
Deterministic forecast (red line)
Initial: 2006.12.02 12 UTC
Deterministic forecast (red line)
Initial: 2006.12.02 12 UTC
Medium-range EPS(51 members: red to orange)
(green: ensemble mean forecast)
Deterministic forecast
Example of probabilistic forecast.
There is only one conceivable scenario!
Example of probabilistic forecast.
There is only one conceivable scenario!
Best track
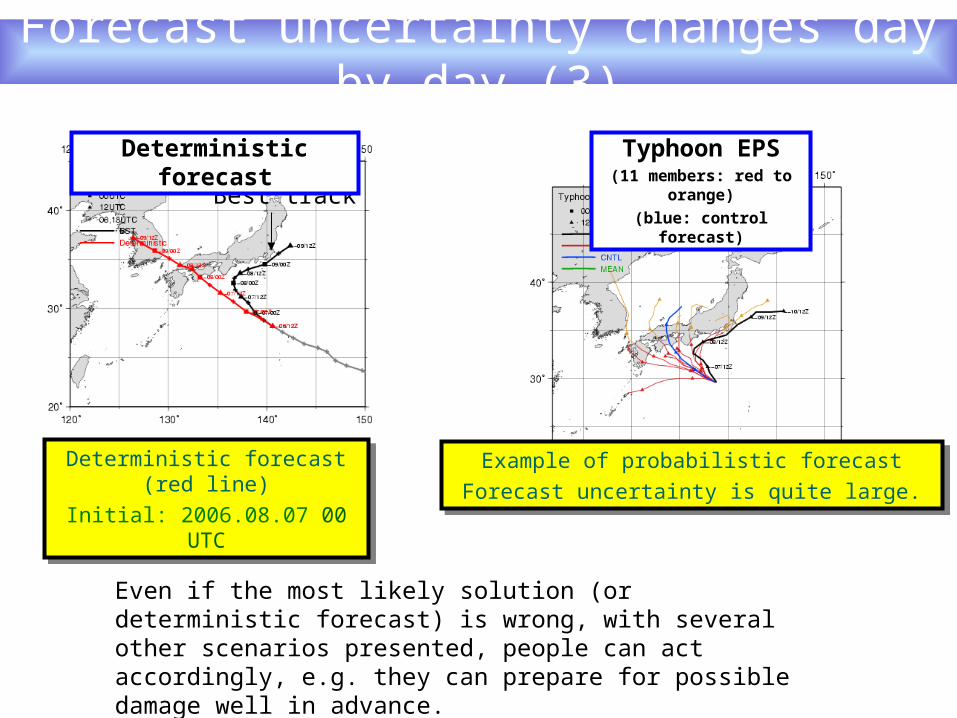
Forecast uncertainty changes day by day (3)
Deterministic forecast (red line)
Initial: 2006.08.07 00 UTC
Deterministic forecast (red line)
Initial: 2006.08.07 00 UTCExample of probabilistic forecast
Forecast uncertainty is quite large.
Example of probabilistic forecast
Forecast uncertainty is quite large.
Even if the most likely solution (or deterministic forecast) is wrong, with several other scenarios presented, people can act accordingly, e.g. they can prepare for possible damage well in advance.
Best track
Deterministic forecast Typhoon EPS(11 members: red to orange)
(blue: control forecast)

1. Reliability index
0
200
400
600
800
1000po
sitio
n er
ror
(km
)
average
?
Current Application
A
Based on ensemble spread or a cluster analysis technique, we can optimize the size of the probability circle.
In addition, a reliability index such as A, B and C, where A is the highest reliability, might be easy to understand even for the general public.
Future Application

7 9 09月 日 時10 09日 時
11 09日 時
12 09日 時
13 09日 時
14 09日 時
15 09日 時
16 09日 時
17 09日 時
12 21日 時13 21日 時
14 21日 時
台 風 経 路 図2007 7 17 9年 月 日 時
Current Application
In the stage where a typhoon is going along with a subtropical jet, forecast uncertainty is relatively large in the direction of movement compared with that in the crosswise direction.
How good an indicator are circles?
Uncertainty in a forecast track is represented with a round shape, whose radius is decided based on a statistical method.
Orange: JMA Typhoon EPS, Green: JMA Medium-range EPS
Pink: ECMWF Medium-range EPS, Blue: JMA TYM

8 30 09月 日 時
31 09日 時
01 09日 時
02 09日 時
03 09日 時
04 09日 時
05 09日 時
06 09日 時
07 09日 時
08 09日 時08 15日 時
05 09日 時
05 21日 時
06 21日 時
07 21日 時
台 風 経 路 図2005 9 8 15年 月 日 時
Current Application Future Application
The area representing forecast uncertainty could be optimized by using ensemble spread, which changes day by day and typhoon by typhoon.
2. Practical representation of TC-threatened areas
Uncertainty in a forecast track is represented with a round shape, whose radius is decided based on a statistical method.

3. Typhoon Strike Probability Map
%
The figure represents the probability that typhoon DURIAN will pass within a 120-km radius during a given 24-hour period.
Black line: Best track during the given 24-hour period
Grey line: Best track from the initial time to the starting time of the given 24-hour period.
Sun Mon Tue Wed Thu Fri Sat Sun
26 27 28 29 30 1 2 3
Typhoon DURIAN
Initial: 2006.11.28 12 UTC
Typhoon DURIAN
Initial: 2006.11.28 12 UTC

JMA plans to start five-day forecasts
TC track forecasts covering five days will be introduced thanks to both the development of NWP systems and implementation of the Typhoon EPS.

Future Issues
2. Further understanding as to what causes forecast uncertainties in TC track forecasts
T-PARC
1. Further discussion on how to use uncertainty information associated with TC track forecasts
Future issues to be addressed include the following two points:
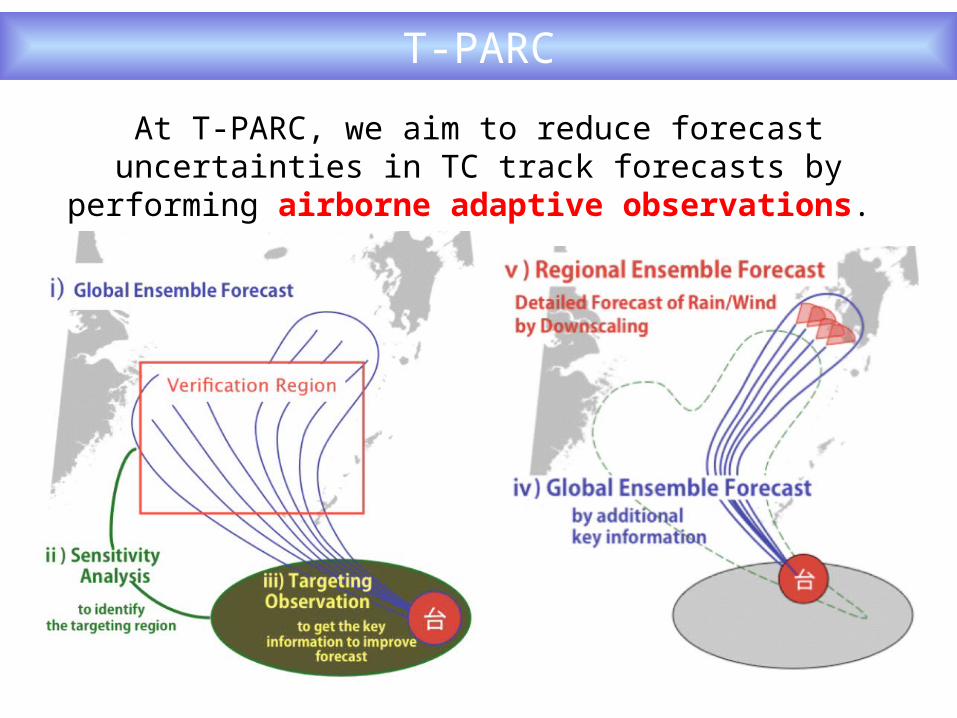
At T-PARC, we aim to reduce forecast uncertainties in TC track forecasts by performing airborne adaptive observations.
T-PARC

Summary
JMA will start the Typhoon EPS no later than the beginning of the typhoon season in 2008.
TC track forecasts covering five days will be introduced thanks to both the development of NWP systems and implementation of the Typhoon EPS.
Uncertainty information associated with TC track forecasts will be provided using the Typhoon EPS.
T-PARC will help us to further address TC predictability and improve NWP systems.
We would like to enhance our relationships more in order to consider more beneficial use of probabilistic TC forecasts.

Reference
申し訳ありません。
適当な参考文献がありません。

謝謝
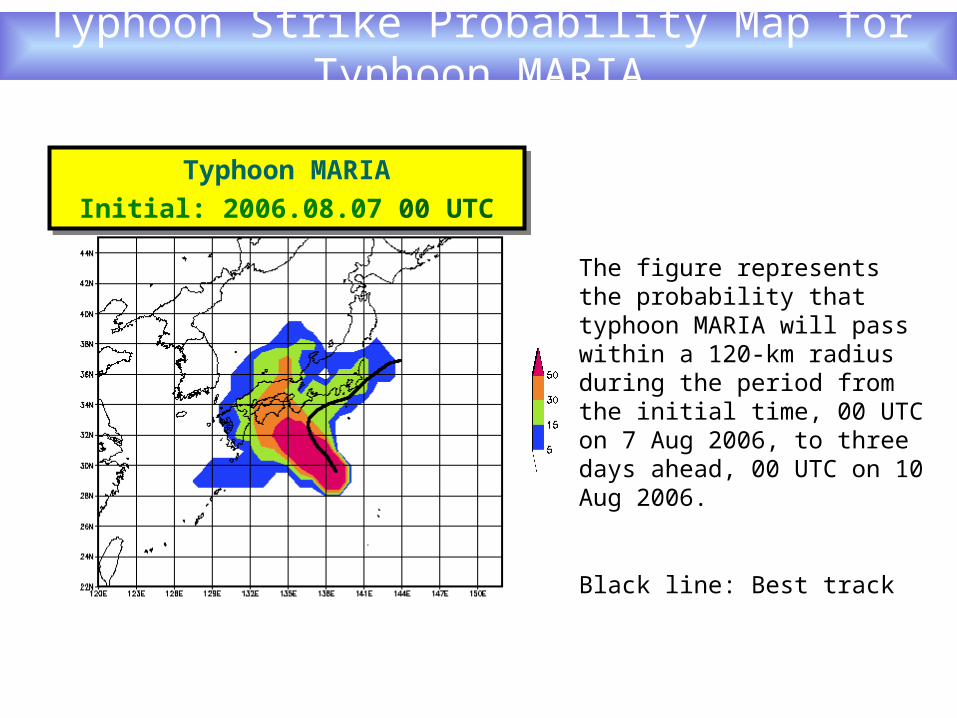
Typhoon Strike Probability Map for Typhoon MARIA
The figure represents the probability that typhoon MARIA will pass within a 120-km radius during the period from the initial time, 00 UTC on 7 Aug 2006, to three days ahead, 00 UTC on 10 Aug 2006.
Black line: Best track
Typhoon MARIA
Initial: 2006.08.07 00 UTC
Typhoon MARIA
Initial: 2006.08.07 00 UTC
Why is a probabilistic approach needed ?
0
200
400
600
800
1000
Pos
ition
err
or (
km)
average
Position errors of each TC Track Forecast by JMA/GSM so far in 2007
Forecast time: 72 hours
Total number of forecast events: 102
Position errors are sorted in ascending order

Various approach to improve TC track forecasts
ObservationData
assimilation
Numerical weather
predictionUser
Current system
Interactive forecast system
adaptive observations
sensitivity analysis
observationData
assimilationUser
A sensitive analysis technique is needed to maximize the effect on a numerical prediction and to minimize the cost of the observations.
sensitive area
Adaptive observations©Vaisala
©JAXA
© NASA
Numerical weather
prediction