Multiplexing Techniques in Quantitative Proteomics to...
204
Multiplexing Techniques in Quantitative Proteomics to Study Disease by Adam Richard Evans Bachelor of Science, Thiel College, 2009 Submitted to the Graduate Faculty of The Kenneth P. Dietrich School of Arts and Sciences in partial fulfillment of the requirements for the degree of Doctor of Philosophy University of Pittsburgh 2014
Transcript of Multiplexing Techniques in Quantitative Proteomics to...

Multiplexing Techniques in Quantitative Proteomics to Study Disease
by
Adam Richard Evans
Bachelor of Science, Thiel College, 2009
Submitted to the Graduate Faculty of
The Kenneth P. Dietrich School of Arts and Sciences in partial fulfillment
of the requirements for the degree of
Doctor of Philosophy
University of Pittsburgh
2014

UNIVERSITY OF PITTSBURGH
The Kenneth P. Dietrich School of Arts and Sciences
This dissertation was presented
by
Adam Richard Evans
It was defended on
December 1st, 2014
and approved by
Dr. Renã A. S. Robinson, Assistant Professor, Department of Chemistry
Dr. Adrian Michael, Professor, Department of Chemistry
Dr. Steve Weber, Professor, Department of Chemistry
Dr. Bruce A. Freeman, Professor, Department of Pharmacology and Chemical Biology
Dissertation Advisor: Dr. Renã A. S. Robinson, Assistant Professor, Department of Chemistry
ii

Copyright © by Adam Richard Evans
2014
iii

Committee Chair: Dr. Renã A. S. Robinson
Multiplexing Techniques in Quantitative Proteomics to Study Disease
Adam Richard Evans, Ph.D.
University of Pittsburgh, 2014
Proteomics is the large scale study of a set of proteins from a biological species to understand
protein expression, post translation modifications, and protein-protein interactions. Mass spectrometry
(MS)-based proteomics allows large scale protein identification and quantitation in the same experiment.
Quantitative proteomics reports abundance changes between multiple protein samples, which principally
reflect a biological process or disease state. Relative quantitation can be achieved using stable isotope
chemical labeling of proteins or peptides using MS or tandem mass spectrometry (MS/MS). Sample
throughput is limited by the chemical tag and technique. MS-based protein quantitation employs methods
which generate a mass shift in MS to compare abundance changes between two to three samples. An
example of precursor quantitation is described using acetylation to study the spleen proteome of mice
treated with Adriamycin. Isobaric tags, such as tandem mass tags (TMT), achieve relative quantitation of
up to ten samples in MS/MS. In order to analyze additional biological samples beyond ten, multiple
experiments must be performed separately, which leads to increased instrument time, higher cost, and
variation due to additional preparation steps, sample handling, and MS injections.
Herein, novel methods which enhance multiplexing in quantitative proteomics beyond the current
limitations are presented. Enhanced multiplexing is achieved by combining precursor MS labeling with
isobaric tags, which is termed “combined precursor isotopic labeling and isobaric tagging” (cPILOT).
Initially, cPILOT is used to identify and quantify 3-nitrotyrosine (3NT) containing proteins. The
biological significance and proteomic techniques employed to study 3NT are reviewed. cPILOT is
expanded to a global strategy by coupling low pH dimethylation with TMT. Global cPILOT was applied
iv

to study the liver proteome of an Alzheimer’s disease mouse model, which revealed alterations in
metabolism. Finally, the versatility of cPILOT is demonstrated by incorporating N,N-dimethyl Leucine
isobaric tags. Overall, the work presented throughout the dissertation highlights novel strategies to
enhance multiplexing in quantitative proteomics which are applied to study various diseases.
v

TABLE OF CONTENTS
TABLE OF CONTENTS ............................................................................................................................. vi
LIST OF TABLES ..................................................................................................................................... xiii
LIST OF FIGURES ................................................................................................................................... xiv
ACKNOWLEDGEMENTS ...................................................................................................................... xvii
1.0. INTRODUCTION ................................................................................................................................. 1
1.1. PROTEOMICS ......................................................................................................................... 1
1.1.1. Post-Translation Modifications .............................................................................. 2
1.1.2. Shotgun Proteomics ............................................................................................... 3
1.1.3. MS Instrumentation in Proteomics ........................................................................ 5
1.1.4. Peptide Fragmentation ........................................................................................... 6
1.1.5. Database Searching and Protein Identification ...................................................... 9
1.2. MS-BASED QUANTITATIVE PROTEOMICS .................................................................... 10
1.2.1. Precursor Isotopic Labeling ................................................................................. 10
1.2.2. Isobaric Tags ........................................................................................................ 12
1.2.3. Multiplexing ........................................................................................................ 15
1.3. OVERVIEW OF DISSERTATION ........................................................................................ 18
2.0. GLOBAL EFFECTS OF ADRIAMYCIN TREATMENT ON MOUSE SPLENIC PROTEIN
LEVELS ............................................................................................................................................... 19
vi
2.1. INTRODUCTION ................................................................................................................... 19
2.2. EXPERIMENTAL .................................................................................................................. 20
2.2.1. Animal Housing and Treatment ........................................................................... 20
2.2.2. Spleen Homogenization ....................................................................................... 21
2.2.3. Protein Digestion ................................................................................................. 21
2.2.4. Synthesis of N-acetyoxy-H3-succinimide and N-acetoxy-2H3-succinimide ........ 21
2.2.5. Isotopic Labeling of Peptides .............................................................................. 22
2.2.6. LC-MS/MS .......................................................................................................... 22
2.2.7. Database Searching and Analysis ........................................................................ 23
2.2.8. Statistics for Differentially-Expressed Proteins ................................................... 23
2.2.9. Western Blot Verification .................................................................................... 23
2.3. RESULTS ................................................................................................................................ 24
2.3.1. Effects of ADR Treatment on Spleen Tissue ....................................................... 24
2.3.2. GIST Proteomics Workflow ................................................................................ 24
2.3.3. Internal Standard Normalization .......................................................................... 27
2.3.4. Differentially-Expressed Proteins in ADR-Treated Mice .................................... 27
2.3.5. MS/MS and Western Blot Analysis of Annexin A2 ............................................ 34
2.4. DISCUSSION ......................................................................................................................... 34
2.4.1. Ca2+ Binding/Apoptosis Proteins ......................................................................... 37
2.4.2. Transcription and Translation .............................................................................. 39
2.4.3. Cytoskeletal/Structural Proteins .......................................................................... 39
vii

2.4.4. Chaperone/Immune and Defense Response/Antioxidant .................................... 40
2.4.5. Metabolism .......................................................................................................... 42
2.4.6. Redox/Cellular Signaling/Transport .................................................................... 42
2.5. CONCLUSIONS ..................................................................................................................... 43
3.0. PROTEOMICS QUANTIFICATION OF PROTEIN NITRATION ................................................... 44
3.1. INTRODUCTION ................................................................................................................... 44
3.2. PROTEOMICS ........................................................................................................................ 47
3.2.1. Enrichment ........................................................................................................... 48
3.3. QUANTITATIVE PROTEOMICS ......................................................................................... 50
3.3.1. Antibodies and Gel Electrophoresis-Based Methods........................................... 50
3.3.2. Label-Free Methods ............................................................................................. 53
3.3.3. Precursor Labeling ............................................................................................... 54
3.3.4. Isobaric Tags ........................................................................................................ 57
3.4. CONCLUSIONS AND FUTURE OUTLOOK ....................................................................... 58
4.0. ENHANCED SAMPLE MULTIPLEXING FOR NITROTYROSINE-MODIFIED PROTEINS
USING COMBINED PRECURSOR ISOTOPIC LABELING AND ISOBARIC TAGGING ........... 60
4.1. INTRODUCTION ................................................................................................................... 60
4.2. EXPERIMENTAL .................................................................................................................. 61
4.2.1. In Vitro Nitration of BSA .................................................................................... 61
4.2.2. Spleen Homogenization ....................................................................................... 61
viii

4.2.3. Immunochemical Measurement of 3NT-BSA Level ........................................... 62
4.2.4. BSA Trypsin Digestion ........................................................................................ 62
4.2.5. Synthesis of N-acetyoxy-H3-succinimide and N-acetoxy-2H3-succinimide ........ 63
4.2.6. 3NT Reduction and Isobaric Tagging of Peptides ............................................... 63
4.2.7. LC-MS/MS .......................................................................................................... 64
4.2.8. Database Searching and Data Analysis................................................................ 64
4.3. RESULTS AND DISCUSSION ............................................................................................. 65
4.3.1. Combined Precursor Isotopic Labeling and Isobaric Tagging (cPILOT) ............ 65
4.3.2. Validation of In Vitro Nitration and Isotopic Acetylation of BSA ...................... 67
4.3.3. 3AT-BSA Isotopic Labeling & TMT0 ................................................................. 69
4.3.4. Twelve Sample Multiplexing with TMT6 Reagents ............................................ 71
4.3.5. 3AT-BSA Isotopic Labeling & iTRAQ ............................................................... 74
4.3.6. Multiplexing with iTRAQ Reagents .................................................................... 74
4.3.7. Improved cPILOT Quantitative Accuracy using 13C2,2H3-Acetylation ............... 80
4.4. CONCLUSIONS .................................................................................................................... 82
5.0. GLOBAL COMBINED PRECURSOR ISOTOPIC LABELING AND ISOBARIC TAGGING
(cPILOT) APPROACH WITH SELECTIVE MS3 ACQUISITION .................................................... 83
5.1. INTRODUCTION ................................................................................................................... 83
5.2. EXPERIMENTAL .................................................................................................................. 84
5.3. RESULTS AND DISCUSSION ............................................................................................. 85
5.4. CONCLUSIONS ..................................................................................................................... 94
ix

6.0. GLOBAL cPILOT ANALYSIS OF THE APP/PS-1 MOUSE LIVER PROTEOME ......................... 95
6.1. INTRODUCTION ................................................................................................................... 95
6.2. EXPERIMENTAL .................................................................................................................. 97
6.2.1. Animal Housing and Tissue Harvesting .............................................................. 97
6.2.2. Protein Extraction and Digestion ......................................................................... 97
6.2.3. cPILOT Chemical Tagging .................................................................................. 98
6.2.4. Strong Cation Exchange ...................................................................................... 98
6.2.5. RPLC-MS3 Data Acquisition ............................................................................... 99
6.2.6. Database Searching and Processing ................................................................... 100
6.2.7. Precursor Dimethyl Labeling ............................................................................. 101
6.3. RESULTS .............................................................................................................................. 101
6.3.1. Global cPILOT Approach .................................................................................. 101
6.3.2. Global cPILOT Accuracy and Dynamic Range ................................................. 104
6.3.3. cPILOT Analysis of the APP/PS-1 Liver Proteome .......................................... 104
6.3.4. Precursor Dimethyl Labeling ............................................................................. 106
6.4. DISCUSSION ....................................................................................................................... 111
6.4.1. Global cPILOT Methodology ............................................................................ 111
6.4.2. Differentially-Expressed Proteins in APP/PS-1 Liver ....................................... 112
6.4.3. Fatty Acid Metabolism ...................................................................................... 113
6.4.4. Pyruvate Metabolism ......................................................................................... 115
6.4.5. Other Metabolic Processes ................................................................................. 115
x
6.4.6. Redox Signaling ................................................................................................. 116
6.4.7. Transcription and Translation ............................................................................ 117
6.5. CONCLUSIONS ................................................................................................................... 117
7.0. EXPANDING VERSITILITY OF cPILOT USING N,N-DIMETHYL LEUCINE ISOBARIC TAGS
............................................................................................................................................................ 119
7.1. INTRODUCTION ................................................................................................................. 119
7.2. EXPERIMENTAL ................................................................................................................ 120
7.2.1. BSA Digestion ................................................................................................... 120
7.2.2. Activation of Dimethyl Leucine Tag 118 .......................................................... 120
7.2.3. BSA Peptide Labeling ....................................................................................... 121
7.2.4. LC-MS/MS ........................................................................................................ 121
7.2.5. Database Searching ............................................................................................ 122
7.3. RESULTS AND DISCUSSION ........................................................................................... 123
7.3.1. cPILOT with N,N-Dimethyl Leucine Isobaric Tags .......................................... 123
7.3.2. BSA with DiLeu cPILOT .................................................................................. 123
7.3.3. Cost Analysis ..................................................................................................... 128
7.4. CONCLUSIONS ................................................................................................................... 130
8.0. CONCLUDING REMARKS AND FUTURE DIRECTIONS ........................................................ 131
8.1. SUMMARY .......................................................................................................................... 131
8.2. FUTURE DIRECTIONS ....................................................................................................... 133
xi

8.2.1. Improving cPILOT Sample Preparation Techniques ......................................... 133
8.2.2. Enhanced Multiplexing ...................................................................................... 137
8.2.3. cPILOT Data Collection and Processing ........................................................... 142
8.2.4. Alzheimer’s Disease and the Liver .................................................................... 143
APPENDIX A ........................................................................................................................................... 147
APPENDIX B ........................................................................................................................................... 148
APPENDIX C ........................................................................................................................................... 149
REFERENCES ......................................................................................................................................... 153
xii

LIST OF TABLES
Table 1.1. Common Stable Isotope Tags for Relative Quantitation ........................................................... 11
Table 2.1. Masses of Spleen Tissue Collected from Control and ADR-Treated Mice ............................. 25
Table 2.2. List of Differentially-Expressed Proteins in ADR-Treated Mice ............................................. 30
Table 5.1. Peptide and Spectra Evaluation ................................................................................................ 92
Table 7.1. Multiplexing Cost ................................................................................................................... 129
Table 8.1. Predicted Number of MS/MS Scans with Increasing Precursor Peaks for cPILOT Expansion
.................................................................................................................................................................. 141
APPENDIX C Table 6.1. Peptide Identification Using Multi-Tier Data Dependent Acquisition .......... 150
xiii

LIST OF FIGURES
Figure 1.1. Procedure for MS-based bottom-up proteomics ....................................................................... 4
Figure 1.2. Schematic of the LTQ-Orbitrap Velos ...................................................................................... 7
Figure 1.3. Peptide fragmentation in MS/MS showing cleavage sites for a/x, b/y, and c/z ion pairs ......... 8
Figure 1.4. Chemical structure and schematic for 6-plex tandem mass tags (TMT) ................................. 13
Figure 1.5. Illustration showing the need for enhanced multiplexing in quantitative proteomics ............ 16
Figure 1.6. Strategy for enhanced multiplexing using combined precursor isotopic labeling and isobaric
tagging ....................................................................................................................................................... 17
Figure 2.1. Schematic of the proteomics workflow .................................................................................. 26
Figure 2.2 Example mass spectra of a peak pair [L(acetyl)IVTQTMK(acetyl)+2H]2+ ............................ 28
Figure 2.3. Bar graph of the total number of proteins identified in individual LC-MS/MS analyses and the
total number ............................................................................................................................................... 29
Figure 2.4. Example mass spectra of a peak pair [(Acetyl)GVDEVTIVNILNR+2H]2+ .......................... 35
Figure 2.5. Example Western blot image of annexin A2 and actin (loading control) protein expression 36
Figure 2.6. Illustrative depiction of differentially-expressed splenic proteins (pathways) that are affected
from ADR-treatment. .................................................................................................................................. 38
Figure 3.1. Chemical reactions describing the formation of 3-nitrotyrosine ............................................ 46
Figure 3.2. Example reactions demonstrating the reduction of 3-nitrotyrosine to 3-aminotyrosine ......... 49
Figure 3.3. Schematic of general workflows for quantitative proteomic studies of nitrated proteins ...... 52
Figure 3.4. Example precursor quantification tags ................................................................................... 56
xiv

Figure 4.1. Schematic representation of the chemical derivatization steps performed in the cPILOT
strategy ....................................................................................................................................................... 66
Figure 4.2. Validation of in vitro nitration ................................................................................................ 68
Figure 4.3. Demonstration of chemical derivatization using TMT0 reagents ........................................... 70
Figure 4.4. Multiplexing of twelve independent samples using TMT6 reagents ....................................... 72
Figure 4.5. Demonstration of chemical derivatization using a single iTRAQ8 reagent ............................ 75
Figure 4.6. Quantitative demonstration of four multiplexed samples using iTRAQ8 reagents .................. 76
Figure 4.7. Application of cPILOT to mouse spleen tissue using iTRAQ8 reagents ................................. 79
Figure 4.8. Chemical reaction of peptide primary amines with acetic anhydride ..................................... 81
Figure 5.1. Schematic of the workflow for a global cPILOT approach .................................................... 86
Figure 5.2. Precursor MS spectra for the peptide D(dimethyl)SYVGDEAQSK(TMT0) with
corresponding CID-MS/MS ....................................................................................................................... 88
Figure 5.3. MS spectrum for the peptide D(dimethyl)FTPAAQAAFQK(TMT0) with CID-MS/MS ...... 90
Figure 5.4. HCD-MS3 fragmentation spectra for light and heavy peptide Q(dimethyl)TALAELVK(TMT-
6plex) ......................................................................................................................................................... 93
Figure 6.1. Schematic diagram of global cPILOT workflow .................................................................. 102
Figure 6.2. Data-dependent acquisition (DDA) method employed for AD mouse liver experiments .... 103
Figure 6.3. Box and whisker plot of experimental log2(TMT ratios) ..................................................... 105
Figure 6.4. Mass spectrum for the peptide [T(dimethyl)ITVSQDEGVRPSTTMQGLAK(TMT6)+3H]3+
.................................................................................................................................................................. 107
Figure 6.5. AD/WT protein ratios (log2 scale) as a function of reporter ion signal (log scale). ............ 108
Figure 6.6. Schematic diagram of workflows used for cPILOT and precursor dimethylation experiments.
xv

.................................................................................................................................................................. 109
Figure 6.7. Bar graph comparing the AD/WT ratios ............................................................................... 110
Figure 6.8. Metabolic pathways of selected differentially-expressed proteins in AD liver .................... 114
Figure 7.1. Chemical structure of the DiLeu118 isobaric tag. ................................................................. 124
Figure 7.2 MS spectra for the peptide D(dimethyl)LGEEHFK(TMT0) .................................................. 125
Figure 7.3. MS spectra for the peptide D(dimethyl)LGEEHFK(DiLeu118) .......................................... 127
Figure 8.1. Sketch of cPILOT implementation on a 96-well plate ......................................................... 135
Figure 8.2. Precursor spectra for the protein labeled cPILOT peptide A(TMT6)LK(Dimethyl)AWSVAR
.................................................................................................................................................................. 136
Figure 8.3. Increases in sample throughput using cPILOT ..................................................................... 138
Figure 8.4. Scan event process and timing for cPILOT experiments ...................................................... 140
Figure 8.5. Chemical derivatization of L-carnitine using light or heavy isotopic butanol in HCl .......... 145
APPENDIX C Figure 6.9. Box plot of reporter ion signal (log scale) for top-ion-HCD-MS3 (black) and
selective-y1-HCD-MS3 ............................................................................................................................. 151
APPENDIX C Figure 6.10. Venn Diagrams illustrating overlap between cPILOT and precursor
dimethylation experiments ....................................................................................................................... 155
xvi

ACKNOWLEDGMENTS
There are many people I would like to thank and express my gratitude for assisting me through
the process. First and foremost, I would like to thank my family for the support, specifically my parents
Richard and Kimberly Evans, my brother Christopher Evans, and my sister Jackie Evans. You have been
very supportive and patient these last five years as I have worked to complete my degree. In addition to
my family, I would like to thank Shannon Irwin, who has helped me get through the long work hours and
missed vacations. Shannon has been incredibly motivating and helpful and I would not have completed
this without her everyday support.
I would also like to thank my advisor, Dr. Renã Robinson, who has been a wonderful mentor
these past five years. Being one of her first graduate students, I had the opportunity to work with her
directly in the lab, which is something I truly appreciate. I enjoyed our scientific discussions and sharing
new project ideas. Most of all, I would like to thank Dr. Robinson for her encouragement, support,
motivation, and inspiration throughout graduate school. She has been a true role model as a scientist, a
professional, and a person. I will always remember the valuable life-lessons I was taught. Thank you
very much for all the help! In addition to my advisor, I want to thank my committee members Dr. Adrian
Michael, Dr. Steve Weber, and Dr. Bruce Freeman for the time, advice, and suggestions in preparation for
my dissertation defense.
I would also like to thank current and former group members who have assisted me in the
process. Dr. Judy Cao and I entered the group at the same time and I worked closely with her to solve
problems, troubleshoot methods and instrumentation, and provide assistance with projects. Liqing Gu
and Christina King provided endless help in instrumental maintenance, scientific discussions, and data
processing. I also had the pleasure to work with Wentao Jiang and Dr. Tasneem Howard. Rudy Guerrero
Jr. specifically provided early insight to the Alzheimer’s disease work. I would also like to thank Dan
xvii

Siroky and Amy Ehrenworth for assistance in developing the nitration cPILOT project. Additionally, I
would like to acknowledge Josh Casto for working with the DiLeu tags.
I also acknowledge Dr. Sumitra Miriyala, Dr. Daret St. Clair, and Dr. David Allan Butterfield
from the University of Kentucky for supplying the spleen tissue used in the Adriamycin chapter.
Additionally, Dr. Lingjun Li and Dustin Frost from the University of Wisconsin provided the DiLeu
materials. I would also like to thank Dustin for his assistance in developing cPILOT experiments using
the DiLeu technology and assisting in data analysis.
I would also like to thank the members of the Proteomics Core Facility at the University of
Pittsburgh, specifically Dr. Nathan Yates and Dr. Guy Uechi for assistance in proteomic data analysis,
input in experimental design, use of their instrumentation, and personal advice. Finally, I would like to
thank Dr. Michelle Ward, Dr. Michael Golde, and Stan Paul who played a significant role in my
professional development as a scientific communicator and educator through my multiple semesters of
teaching. It was truly an enjoyable experience to share with everyone involved. The continuous student
interaction added new perspectives on graduate school and was a rewarding experience.
xviii
1.0. INTRODUCTION
1.1. PROTEOMICS
Proteomics is the study and characterization of expressed proteins from biological fluids, tissue
homogenates, cell lysates, and dried blood spots [1, 2]. Proteomics provides key information about
protein abundance, post-translational modifications (PTM), protein-protein interactions, and differences
in expression [3, 4]. Clinically, proteomics is applied to discover potential drug targets and identify
disease biomarkers [5]. Traditional analysis of proteins employs two-dimensional polyacrylamide gel
electrophoresis (2D-PAGE) [6]. Proteins migrate through a gel based on mobility in the first dimension
followed by isoelectric point separation in the second dimension. Separated proteins are detected using
fluorescence [7], chemiluminescence [8], and Coomassie blue or silver staining [9], however only protein
abundance information is obtained with these methods. Primary antibodies can be coupled with 2D-
PAGE for targeted protein identification, but this method is low throughput and impractical for large scale
proteomic studies [6]. Gel-based proteomics offer several advantages in robustness, reproducibility, and
straight-forward analysis of whole proteins, but limitations include the missed detection of hydrophobic
and low abundant proteins (< 1-10 ng), low resolution, and a limited dynamic range. Mass spectrometry
(MS) provides in-depth protein identification, quantitation and sequencing information and has become a
principal tool in proteomics [10]. 2D-PAGE can be coupled with MS, where proteins are separated
through gels, excised, then analyzed using MS [6, 11].
Advances in proteomics are driven by the continuous developments in analytical techniques and
MS instrumentation. It is estimated that over 100,000 unique protein sequences, isoforms, and post-
translation modifications are encoded by the human genome, resulting in protein concentrations spanning
several orders of magnitude [12]. MS-based proteomics and tandem mass spectrometry (MS/MS)
provides the ability to detect thousands of proteins in a single experiment. Multiple separation techniques
are frequently coupled with MS to enhance proteome coverage, which includes liquid chromatography
(LC) and capillary electrophoresis (CE) [13, 14]. Additionally, mass spectrometers routinely used in
1
proteomics offer high resolution, high mass accuracy and fast MS/MS scan rates, allowing for high
throughput protein identification. For example, the most advanced MS instrumentation can identify
approximately 90% of the yeast proteome in one hour of LC-MS/MS analysis time [15] and over 10,000
proteins in C. elegans [16]. While these numbers are impressive and were not possible with past
technology, there is no standard experiment in proteomics and results vary depending on project goals and
experimental conditions. Choices in sample preparation, chromatographic separation, instrumentation,
MS/MS fragmentation, data collection, and data processing must be considered when designing a
proteomics experiment. The following sections in Chapter 1 discuss options available for key
experimental parameters used in proteomics. Emphasis is placed on techniques employed throughout this
dissertation.
1.1.1. Post-Translation Modifications
Post-translation modifications (PTM) result from the covalent attachment of a chemical species to
amino acid functional groups. Proteins expressed in nature are rarely pure, but instead exist in various
combinations of isoforms and PTMs. Mapping protein PTM sites is critical to understand biological
processes. Approximately 300 PTMs are known in eukaryote proteins [17], however the most common
PTMs studied in proteomics are phosphorylation [18], cysteine oxidation [19] and nitrosylation [20],
acetylation [21], glycosylation [22], and ubiquitination [23]. PTMs are involved in cellular signaling,
communication, and regulation of biological processes. For example, protein phosphorylation can occur
as O-phosphorylation on Ser, Thr, and Tyr residues and N- phosphorylation on Arg, Lys, and His residues
[18]. Biologically, phosphorylation is a PTM controlled by protein kinases and phosphatase enzymes to
regulate metabolism, proliferation, cell differentiation and cell survival [24]. MS and MS/MS are
powerful tools in protein characterization to provide further insight to relationships between function and
PTM location [25].
Redox proteomics involves the study and characterization of PTMs caused by reactive oxygen
species (ROS) and reactive nitrogen species (RNS) under conditions of oxidative stress [26]. Examples
2

of ROS and RNS include the superoxide anion (O2.-), hydrogen peroxide (H2O2), hydroxide (OH-), and
peroxynitrite (ONOO-). Due to the high reactivity of ROS and RNS, these species cause oxidative
damage by creating unnatural modifications on protein sites, which can alter function and biological
pathways [27, 28]. Oxidative damage includes the formation of protein carbonyls [29, 30] and nitration
[31, 32] and is observed Alzheimer’s and Parkinson’s diseases, cardiovascular diseases, diabetes, and
aging [33]. Chapter 3 reviews the proteomic techniques and analytical challenges in studying 3-
nitrotyrosine and Chapter 4 presents a novel proteomics method to selectively identify and quantify
protein nitration.
1.1.2. Shotgun Proteomics
MS-based proteomics can be performed on intact proteins (top-down) or peptides resulting from
enzymatic digestion of proteins (bottom-up). Top-down methods provide PTM and protein isoform
characterization, however limitations exist due to difficulties in reproducible protein ionization,
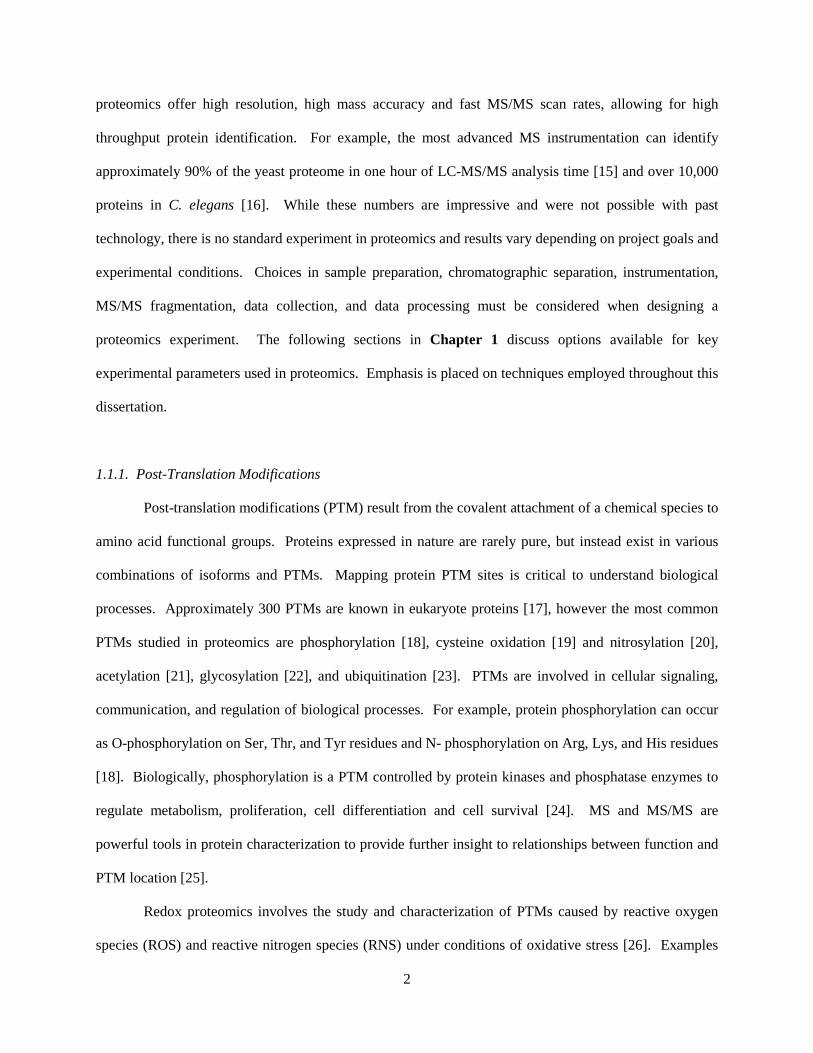
fragmentation, and separation techniques [34]. Bottom-up (“shotgun”) proteomics performs liquid
chromatography tandem mass spectrometry (LC-MS/MS) analysis on peptides, which exhibit more
efficient ionization, gas phase fragmentation, and versatility in quantitative experiments compared to top-
down methods [12]. The general procedure for bottom-up proteomics is illustrated in Figure 1.1.
Proteins are extracted from cell cultures or tissue homogenates and digested into peptides using a
protease. Trypsin is the most common protease, which cleaves proteins at lysine or arginine residues
[35], however other proteases such as LysC and chymotrypsin can be used if alternative cleavage sites are
required [36]. Proteins are digested into a pool of peptides and separated using a chromatographic
technique in order to collect MS spectra free of background interfering species. LC [6], capillary
electrophoresis (CE) [37] and isoelectric focusing [38] can be used to separate peptide mixtures in one or
more dimensions to increase identification in large scale experiments. For example, Chapter 6 presents a
2D-separation of liver protein digests using strong cation exchange (SCX) coupled with RPLC [7].
Peptides are separated according to charge state on a Polysulfethyl A column to collect multiple fractions
3
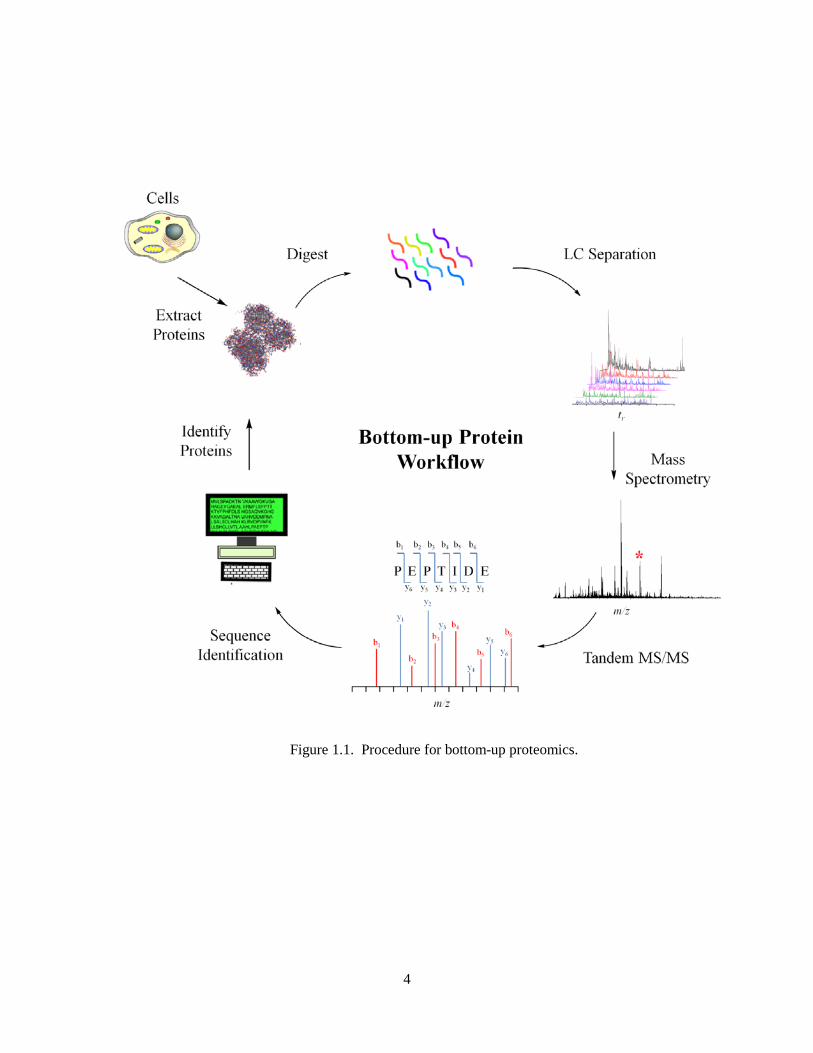
Figure 1.1. Procedure for bottom-up proteomics.
4

of equal concentration. Elution is performed by increasing a KCl salt gradient. Each fraction is collected,
desalted, and subject to reversed phase liquid chromatography (RPLC), which exploits the differences in
peptide hydrophobicity for separation. Eluted peptides are ionized and introduced into MS, where ions
are separated according to their mass to charge ratios (m/z) and abundances recorded by a detector.
Tandem mass spectrometry (MS/MS) is routinely incorporated in MS-based proteomics to provide
sequence information, which is discussed in Section 1.1.4. Database search algorithms, such as
SEQUEST (Section 1.1.5) [39], match experimental and theoretical MS/MS spectra to identify peptide
sequences. This strategy is used throughout the dissertation to identify proteins. Quantitation can be built
into the bottom-up proteomics procedure and will be discussed in Section 1.2.
1.1.3. MS Instrumentation in Proteomics
Eluted peptides from RPLC separations must be ionized prior to MS and MS/MS analysis.
Electrospray ionization (ESI) [40] and matrix assisted laser desorption ionization (MALDI) [41] are two
popular ionization sources in shotgun proteomics due to their ability to ionize large molecules at
atmospheric pressure. In ESI (used throughout the dissertation), LC eluted peptides form charged
droplets resulting from an applied potential and travel towards the MS inlet. Solvent evaporates from the
droplet, which increases the charge density until a coulombic explosion creates smaller droplets and ions.
ESI typically results in peptide ions of multiple charge states and couples well with mass analyzers with a
limited m/z range. Recently, other ionization techniques have emerged in proteomics and include
desorption ESI (DESI) [42], laserspray ionization (LSI) [43], and solvent assisted inlet ionization (SAII)
[44], which results in enhanced sensitivity while generating ESI-like ions.
New developments in mass spectrometry have driven the progress in proteomics in recent years.
Quadrupoles, ion traps, time of flight, and high resolution mass spectrometers [45], such as the Orbitrap
[46] and FT-ion cyclotron resonance (FTICR), [47] have been employed in proteomic analysis [10].
Hybrid mass spectrometers utilize multiple mass analyzers in one instrument, which provide the most
potential in proteomics due to their versatility and multi-dimensional analysis. Orbitrap-ion trap hybrid
5
instruments couple high resolution (> 100,000) and high mass accuracy (< 2ppm) with fast, sensitive
MS/MS scans creating an instrument suited for large scale discovery-based proteomics. The principal
instrument used throughout this dissertation is the LTQ-Orbirtap Velos shown in Figure 1.2 [48]. High
resolution MS scans are performed in the Orbitrap to detect intact peptides. Scan rates occur at
approximately 700 ms per scan (R = 60,000), which can impact the duty cycle of LC-MS/MS
experiments. However, simultaneous MS/MS scans are performed in the dual ion trap, which performs
four to five MS/MS scans during the high resolution Orbitrap analysis. Additional MS/MS scan events
can be performed resulting in an enhanced identification, but with a longer duty cycle. Together, this
creates an efficient method capable of collecting tens of thousands of peptide fragmentation spectra in a
single LC-MS/MS experiment.
When work for this dissertation began, the LTQ-Orbitrap Velos was the state-of-the-art mass
spectrometer in proteomics. Orbitrap hybrids have rapidly evolved in the last five years with the release
of the Orbitrap-Elite [49] and the Q-Exactive [50]. Additionally, Orbitrap resolution has reached up to R
= 1,000,000 using reduced mass analyzer dimensions and enhanced Fourier transform algorithms [51].
The current-state-of-the-art is the Orbitrap Fusion, which is a tribred mass spectrometer containing a high
resolution Orbitrap, a quadrupole mass analyzer, and a dual ion trap capable of performing 20 MS/MS
scan events per second [52]. Emphasis with each new hybrid model is placed on increasing the scan
speeds so that more spectra are collected in real time resulting in enhanced protein identification. While
newer Orbitrap instrumentation is impressive, the Orbitrap Velos is capable of identifying thousands of
unique proteins in an experiment.
1.1.4. Peptide Fragmentation
Large scale proteomic experiments typically operate using data dependent acquisition (DDA)
[53], which results in isolation and MS/MS fragmentation of the most intense ions detected in MS.
Peptides cleave at specific sites along the backbone into a series of a/x, b/y, and c/z type ions shown in
Figure 1.3. Different fragmentation techniques can affect the appearance of peptide MS/MS spectra [54].
6

Figure 1.2. Schematic of the LTQ-Orbitrap Velos [52] (Thermo Scientific).
7

Figure 1.3. Peptide fragmentation in MS/MS showing cleavage sites for a/x, b/y, and c/z ion pairs.
8
Collision induced dissociation (CID) occurs in the ion trap of the LTQ-Orbitrap Velos. Selected ions of
interest are isolated and exposed to an RF excitation to increase the kinetic energy. Excited ions collide
with helium gas causing fragmentation favored between the amide bond of peptides resulting in b-type
and y-type ions. CID-MS/MS is the principal fragmentation technique used throughout the dissertation to
generate MS/MS spectra due to its robustness, reproducibility and fragmentation efficiency. One
disadvantage of CID in ion traps is a low mass cutoff of approximately one-third of the selected m/z in
MS/MS spectra (due to the RF increase required for excitation) [55]. In order to detect low m/z ions in
MS/MS, higher energy collisional dissociation (HCD) is employed where ions are fragmented in an
octopole HCD collision cell (Figure 1.2) and detected using the Orbitrap [48, 56]. Ions are isolated in the
linear ion trap and transferred to the HCD cell, where a DC offset is applied in the presence of nitrogen
gas to cause fragmentation. Quantitative proteomic experiments using isobaric tags (Section 1.2) require
HCD fragmentation to detect ions from 100-150 m/z for quantitation. HCD also provides reproducible
and efficient fragmentation, however peptide coverage (i.e. b- and y-type ions) is impaired. As a result,
MS experiments use a combination of CID- and HCD-MS/MS scan events during data collection for
peptide identification and quantitation, respectively [57].
1.1.5. Database Searching and Protein Identification
Proteomic data files can contain > 50,000 total MS and MS/MS spectra from a single LC
separation. Database search algorithms and data processing software tools have been developed to
streamline spectral interpretation in large scale studies. Data files (.RAW) are searched with algorithms
such as SEQUEST [39, 58] to generate a list of detected peptides and proteins in a shotgun proteomic
experiment. First, a FASTA file is uploaded from an online protein database such as Uniprot or
SwissProt, which contain a list of protein sequences and accession numbers for a given species [59].
SEQUEST performs in silico digestion of the protein database matching the user’s experimental criteria,
which results in a list of theoretical peptides and corresponding MS/MS spectra. Experimental and
theoretical MS/MS spectra are compared, matched, and scored to identify peptide sequences [60, 61]. A
9
single SEQUEST search result contains a mix of correctly identified peptides and false positive
identifications. Misidentified peptides are filtered by searching the RAW data against a decoy database to
measure the frequency of peptide identifications due to random matching [62]. False discovery rates
(FDR) for peptide identification are set to 0.05 and 0.01 for 95% and 99% confidence, respectively.
SEQUEST is built into the software package Proteome Discoverer (PD, Thermo Scientfic), which assists
in processing data for protein identification and quantitation.
1.2. MS-BASED QUANTITATIVE PROTEOMICS
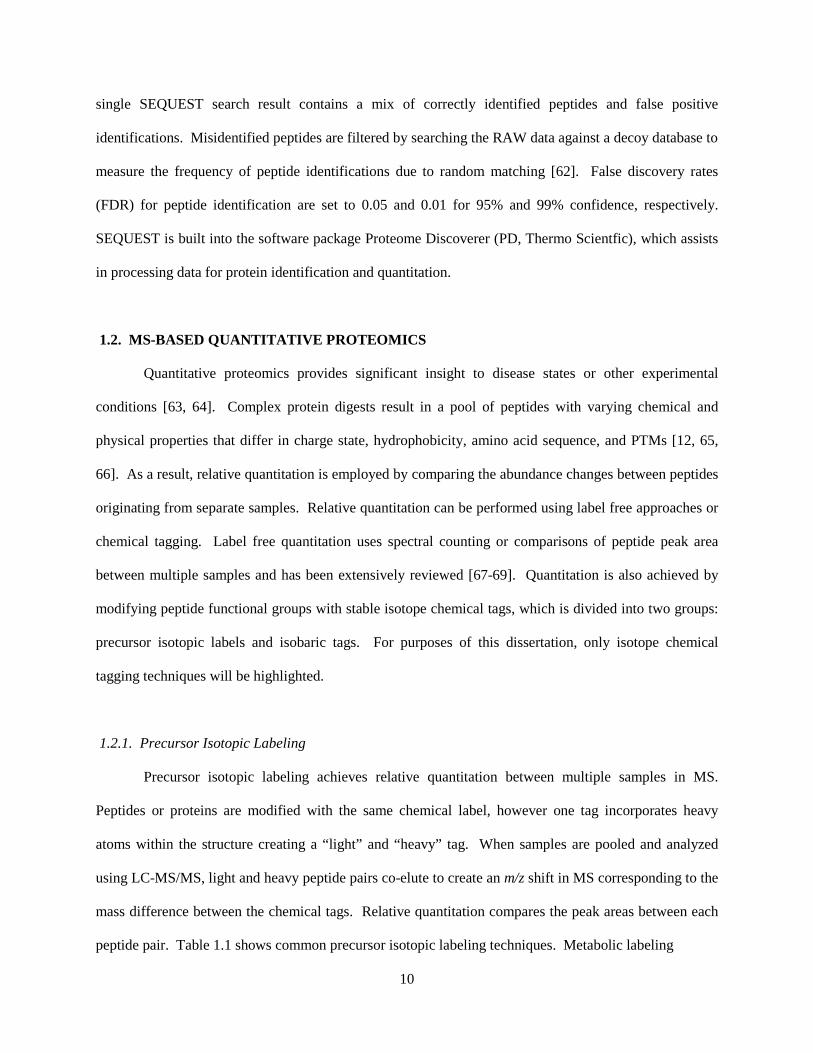
Quantitative proteomics provides significant insight to disease states or other experimental
conditions [63, 64]. Complex protein digests result in a pool of peptides with varying chemical and
physical properties that differ in charge state, hydrophobicity, amino acid sequence, and PTMs [12, 65,
66]. As a result, relative quantitation is employed by comparing the abundance changes between peptides
originating from separate samples. Relative quantitation can be performed using label free approaches or
chemical tagging. Label free quantitation uses spectral counting or comparisons of peptide peak area
between multiple samples and has been extensively reviewed [67-69]. Quantitation is also achieved by
modifying peptide functional groups with stable isotope chemical tags, which is divided into two groups:
precursor isotopic labels and isobaric tags. For purposes of this dissertation, only isotope chemical
tagging techniques will be highlighted.
1.2.1. Precursor Isotopic Labeling
Precursor isotopic labeling achieves relative quantitation between multiple samples in MS.
Peptides or proteins are modified with the same chemical label, however one tag incorporates heavy
atoms within the structure creating a “light” and “heavy” tag. When samples are pooled and analyzed
using LC-MS/MS, light and heavy peptide pairs co-elute to create an m/z shift in MS corresponding to the
mass difference between the chemical tags. Relative quantitation compares the peak areas between each
peptide pair. Table 1.1 shows common precursor isotopic labeling techniques. Metabolic labeling
10

Table 1.1. Common Stable Isotope Tags for Relative QuantitationTag Multiplex Reactive Site MS Order Mass Shift (Da) Reporter Ions (m/z)
SILACa 3 Arg, Lys MS 0, +6, +8, +10 n/aSILAMb 2 All AA MS > 10 n/a
Acetylation 2 N-term, Lys MS 0, +3 n/aDimethylation 5 N-term, Lys MS 0, +2, +4, +6, +8 n/a
ICATc 2 Cys MS 0, +8 n/aICPLd 2 Lys MS 0, +6 n/a
Oxygen 18 2 C-term MS 0, +2, +4 n/aiTRAQe 8 N-term, Lys MS/MS n/a 113-119, 121
TMTf 6 N-term, Lys MS/MS n/a 126-131DiLeug 8 N-term, Lys MS/MS n/a 114-119, 121-122
DIARTh 6 N-term, Lys MS/MS n/a 114-119aStable isotopic labeling of amino acids in cell culturesbStable isotopic labeling of amino acids in mammalscIsotope coded affinity tagsdIsotope coded protein labelseIsobaric tags for relative and absolute quantitationfTandem mass tagsgDimethyl leucine tagshDeuterium isobaric anime reactive tags
11
incorporates stable isotopes at the earliest point in sample preparation [65]. For example, stable isotopic
labeling of amino acids in cell cultures (SILAC) [70] employs a cell medium rich in heavy arginine or
lysine, which incorporates heavy amino acids on the protein primary structure during expression. Since
the chemical labeling occurs at the earliest point in the experiment, variation is minimal [64], however
SILAC techniques are limited to cell cultures. Metabolic labeling can be achieved in vivo by feeding
animals fortified heavy lysine food pellets [71, 72], however this technique is highly expensive, requires
multiple animal generations to achieve >95% labeling efficiency, and is not compatible with all species.
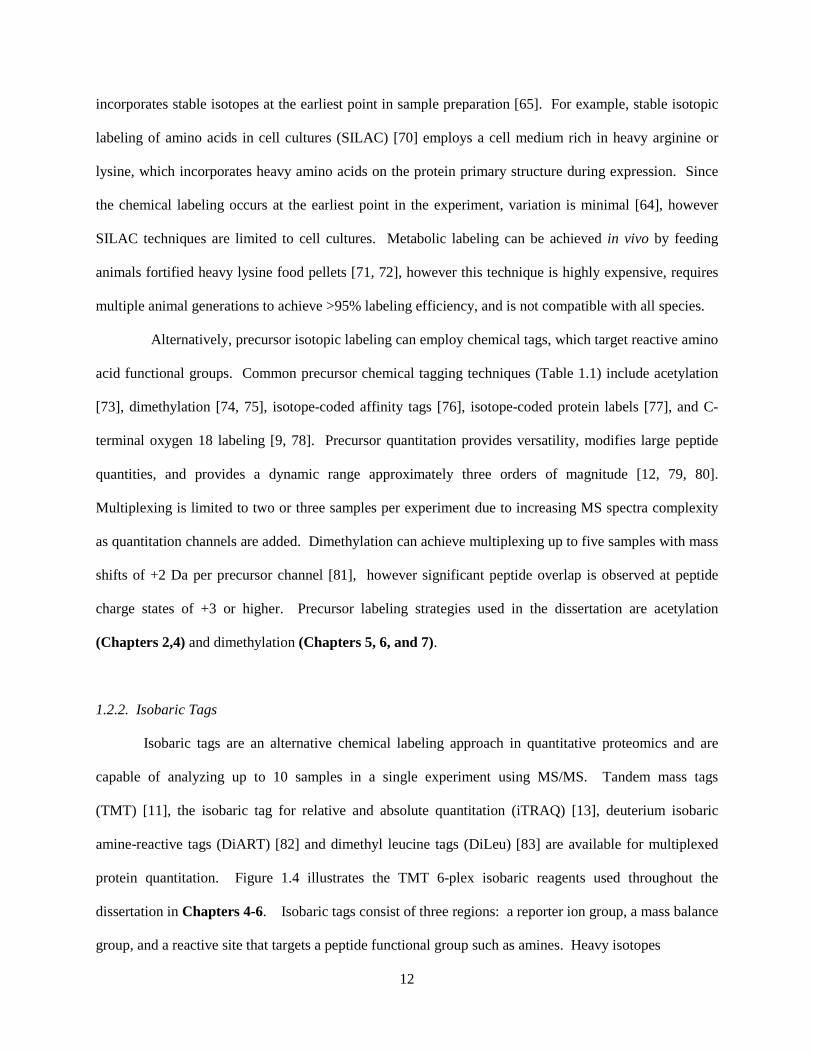
Alternatively, precursor isotopic labeling can employ chemical tags, which target reactive amino
acid functional groups. Common precursor chemical tagging techniques (Table 1.1) include acetylation
[73], dimethylation [74, 75], isotope-coded affinity tags [76], isotope-coded protein labels [77], and C-
terminal oxygen 18 labeling [9, 78]. Precursor quantitation provides versatility, modifies large peptide
quantities, and provides a dynamic range approximately three orders of magnitude [12, 79, 80].
Multiplexing is limited to two or three samples per experiment due to increasing MS spectra complexity
as quantitation channels are added. Dimethylation can achieve multiplexing up to five samples with mass
shifts of +2 Da per precursor channel [81], however significant peptide overlap is observed at peptide
charge states of +3 or higher. Precursor labeling strategies used in the dissertation are acetylation
(Chapters 2,4) and dimethylation (Chapters 5, 6, and 7).
1.2.2. Isobaric Tags
Isobaric tags are an alternative chemical labeling approach in quantitative proteomics and are
capable of analyzing up to 10 samples in a single experiment using MS/MS. Tandem mass tags
(TMT) [11], the isobaric tag for relative and absolute quantitation (iTRAQ) [13], deuterium isobaric
amine-reactive tags (DiART) [82] and dimethyl leucine tags (DiLeu) [83] are available for multiplexed
protein quantitation. Figure 1.4 illustrates the TMT 6-plex isobaric reagents used throughout the
dissertation in Chapters 4-6. Isobaric tags consist of three regions: a reporter ion group, a mass balance
group, and a reactive site that targets a peptide functional group such as amines. Heavy isotopes
12

Figure 1.4. Chemical structure for 6-plex tandem mass tags (TMT) showing reporter ion, mass balance, and peptide reactive groups. Samples are pooled for LC-MS analysis resulting in a single peak in MS. Isolation and fragmentation generates six reporter ion signals in MS/MS corresponding to the mass of each reporter ion.
13
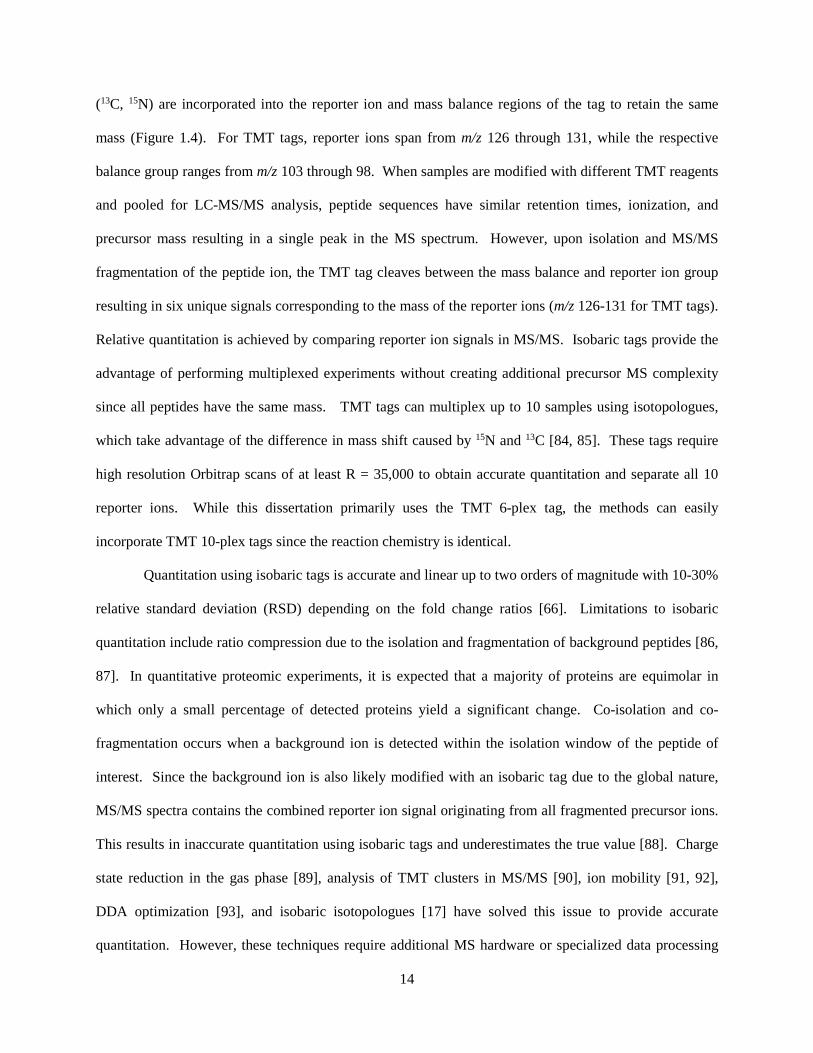
(13C, 15N) are incorporated into the reporter ion and mass balance regions of the tag to retain the same
mass (Figure 1.4). For TMT tags, reporter ions span from m/z 126 through 131, while the respective
balance group ranges from m/z 103 through 98. When samples are modified with different TMT reagents
and pooled for LC-MS/MS analysis, peptide sequences have similar retention times, ionization, and
precursor mass resulting in a single peak in the MS spectrum. However, upon isolation and MS/MS
fragmentation of the peptide ion, the TMT tag cleaves between the mass balance and reporter ion group
resulting in six unique signals corresponding to the mass of the reporter ions (m/z 126-131 for TMT tags).
Relative quantitation is achieved by comparing reporter ion signals in MS/MS. Isobaric tags provide the
advantage of performing multiplexed experiments without creating additional precursor MS complexity
since all peptides have the same mass. TMT tags can multiplex up to 10 samples using isotopologues,
which take advantage of the difference in mass shift caused by 15N and 13C [84, 85]. These tags require
high resolution Orbitrap scans of at least R = 35,000 to obtain accurate quantitation and separate all 10
reporter ions. While this dissertation primarily uses the TMT 6-plex tag, the methods can easily
incorporate TMT 10-plex tags since the reaction chemistry is identical.
Quantitation using isobaric tags is accurate and linear up to two orders of magnitude with 10-30%
relative standard deviation (RSD) depending on the fold change ratios [66]. Limitations to isobaric
quantitation include ratio compression due to the isolation and fragmentation of background peptides [86,
87]. In quantitative proteomic experiments, it is expected that a majority of proteins are equimolar in
which only a small percentage of detected proteins yield a significant change. Co-isolation and co-
fragmentation occurs when a background ion is detected within the isolation window of the peptide of
interest. Since the background ion is also likely modified with an isobaric tag due to the global nature,
MS/MS spectra contains the combined reporter ion signal originating from all fragmented precursor ions.
This results in inaccurate quantitation using isobaric tags and underestimates the true value [88]. Charge
state reduction in the gas phase [89], analysis of TMT clusters in MS/MS [90], ion mobility [91, 92],
DDA optimization [93], and isobaric isotopologues [17] have solved this issue to provide accurate
quantitation. However, these techniques require additional MS hardware or specialized data processing
14
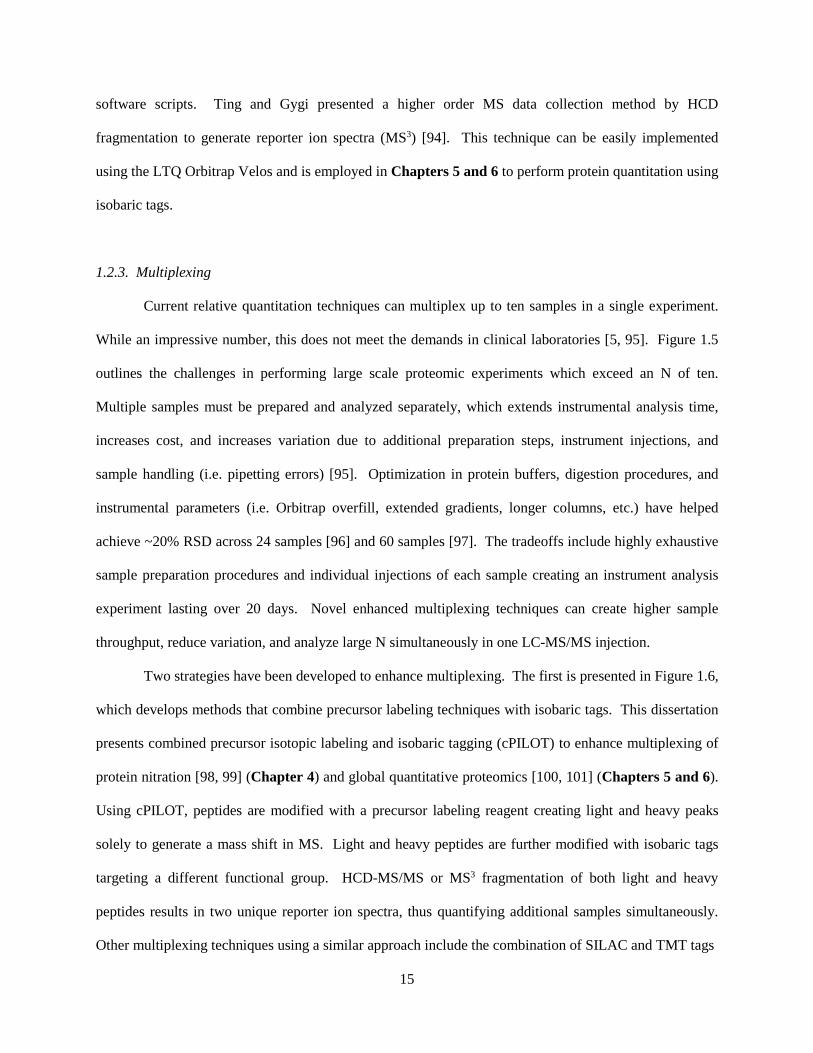
software scripts. Ting and Gygi presented a higher order MS data collection method by HCD
fragmentation to generate reporter ion spectra (MS3) [94]. This technique can be easily implemented
using the LTQ Orbitrap Velos and is employed in Chapters 5 and 6 to perform protein quantitation using
isobaric tags.
1.2.3. Multiplexing
Current relative quantitation techniques can multiplex up to ten samples in a single experiment.
While an impressive number, this does not meet the demands in clinical laboratories [5, 95]. Figure 1.5
outlines the challenges in performing large scale proteomic experiments which exceed an N of ten.
Multiple samples must be prepared and analyzed separately, which extends instrumental analysis time,
increases cost, and increases variation due to additional preparation steps, instrument injections, and
sample handling (i.e. pipetting errors) [95]. Optimization in protein buffers, digestion procedures, and
instrumental parameters (i.e. Orbitrap overfill, extended gradients, longer columns, etc.) have helped
achieve ~20% RSD across 24 samples [96] and 60 samples [97]. The tradeoffs include highly exhaustive
sample preparation procedures and individual injections of each sample creating an instrument analysis
experiment lasting over 20 days. Novel enhanced multiplexing techniques can create higher sample
throughput, reduce variation, and analyze large N simultaneously in one LC-MS/MS injection.
Two strategies have been developed to enhance multiplexing. The first is presented in Figure 1.6,
which develops methods that combine precursor labeling techniques with isobaric tags. This dissertation
presents combined precursor isotopic labeling and isobaric tagging (cPILOT) to enhance multiplexing of
protein nitration [98, 99] (Chapter 4) and global quantitative proteomics [100, 101] (Chapters 5 and 6).
Using cPILOT, peptides are modified with a precursor labeling reagent creating light and heavy peaks
solely to generate a mass shift in MS. Light and heavy peptides are further modified with isobaric tags
targeting a different functional group. HCD-MS/MS or MS3 fragmentation of both light and heavy
peptides results in two unique reporter ion spectra, thus quantifying additional samples simultaneously.
Other multiplexing techniques using a similar approach include the combination of SILAC and TMT tags
15
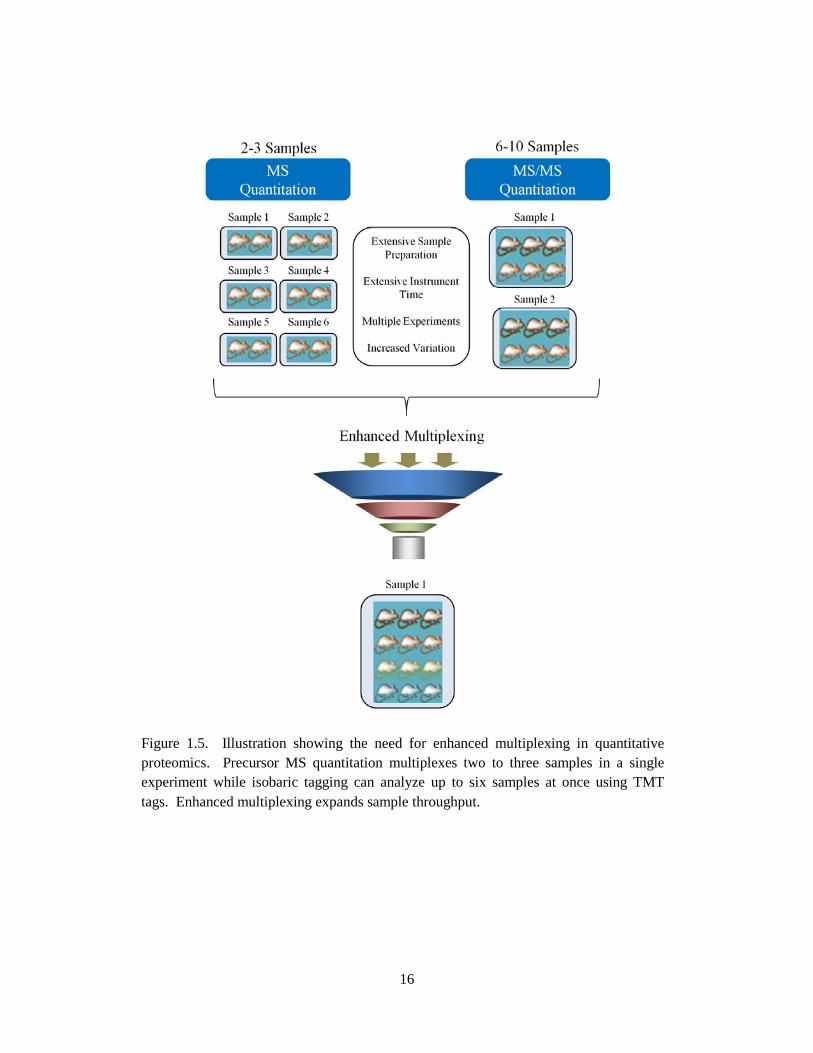
Figure 1.5. Illustration showing the need for enhanced multiplexing in quantitative proteomics. Precursor MS quantitation multiplexes two to three samples in a single experiment while isobaric tagging can analyze up to six samples at once using TMT tags. Enhanced multiplexing expands sample throughput.
16

Figure 1.6. Strategy for combined precursor isotopic labeling and isobaric tagging.
17
[102] and the synthesis of novel TMT tags [103]. An alternative strategy to enhance multiplexing takes
advantage of isotopologues that expands 6-plex TMT isobaric tags to 8-plex [104] and 10-plex [85].
NeuCode labeling can multiplex 12 samples in precursor MS, but requires ultra-high resolution Orbitrap
mass analyzers (R = 480k) to distinguish 6 mDa mass shifts for relative quantitation at higher m/z ratios
[105]. Recently, TMT tags were combined with iTRAQ in a single experiment since both sets of tags
result in unique m/z reporter ions offering further potential in multiplexing [106]. Chapters 4-7 discuss
the development of various cPILOT strategies to expand multiplexing in quantitative proteomics.
1.3. OVERVIEW OF DISSERTATION
This dissertation focuses on the method development of novel multiplexing strategies in
quantitative proteomics to study disease. First, an acetylation precursor labeling technique is applied in
Chapter 2 to study the effects of an anti-cancer drug, Adriamycin, on the spleen proteome to uncover
changes in the immune system of healthy mice. Chapter 3 reviews proteomic techniques to quantify 3-
nitrotyrosine (3NT). Chapter 4 introduces combined precursor isotopic labeling and isobaric tagging
(cPILOT), which selectively quantifies 3NT peptides and enhances multiplexing in protein quantitation.
Chapter 5 extends cPILOT from a PTM selective approach to a global approach and also experiments
with alternative data collection techniques to acquire more efficient multiplexed data in real time.
Twelve-plex global cPILOT is analytically characterized in Chapter 6 and applied to study the effects of
Alzheimer’s disease in the liver of a mouse model. Chapter 7 demonstrates the versatility of cPILOT by
incorporating N,N-dimethyl leucine tags to provide a more cost effective cPILOT method. Finally,
Chapter 8 summarizes the dissertation and presents the future outlook, goals, and current challenges in
multiplexing. Chapters 2-6 are primarily written from published papers or submitted manuscripts.
18

2.0. GLOBAL EFFECTS OF ADRIAMYCIN TREATMENT ON MOUSE SPLENIC PROTEIN
LEVELS*
(*Reprinted with permission from Evans, A. R.; Miriyala, S.; St. Clair, D. K.; Butterfield, D. A.;
Robinson, R. A. S. Journal of Proteome Research. 2012. 11, 1054-1064. Copyright 2014.
American Chemical Society.) [107]
2.1. INTRODUCTION
Adriamycin [(ADR), also known as doxorubicin] is an anthracycline drug used to treat
hemopoietic and a wide range of solid tumors in lung, breast, ovarian, prostate, and bladder cancers,
amongst others [108, 109]. Although the mechanisms of ADR drug action in non-cancerous tissues are
not completely understood, there are two widely supported phenomena. The first primary action involves
the intercalation of DNA and inhibition of topoisomerase II enzymatic activity, which results in the
termination of DNA replication and transcription [110, 111]. Clinically, ADR is very effective as an
anticancer treatment, however some patients can suffer from major side effects such as cardiomyopathy
and heart failure [112], dizziness, lack of concentration, and cognitive deficits characterized as
“chemobrain” [113, 114]. In other cases, patients develop a resistance to ADR and treatment fails [115].
The second primary action of ADR involves the generation of toxic free radical species such as
the superoxide anion. The structure of ADR contains a quinone, which is converted to a semi-quinone
through a one electron reduction. In the presence of oxygen, the semi-quinone is converted back to the
quinone resulting in the formation of reactive oxygen species causing oxidative stress [116], which
become detrimental to nontargeted cells, in addition to cancerous cells [117]. Oxidative stress can result
in protein oxidation, DNA damage, and lipid peroxidation which disrupt cellular functions. Several
reports have demonstrated that ADR leads to elevated oxidative stress in plasma [118], brain [119], heart
[120], cardiomyocytes [121], liver [122], testes [123], and kidney [124]. The cytotoxicity of ADR also
19

causes alterations to apoptotic pathways, lipid membrane structure and function [125], Ca2+ homeostasis
[126], and cellular arrest and differentiation [127].
Proteomic methods have been employed to study the effects of ADR treatment in different cell
lines and tissues, including brain [119, 128, 129], plasma [130], heart [131], MCF-7 human breast cancer
cells [132], hepatoma cells [133], Jurkat T cells [134], Raji cells [135], and thymus [136]. Proteomic
studies of ADR-resistant cells lines [137] have been performed on K562/ADM cells [138, 139],
K562/ADR cells [140], DLKP cell lines [141], and MCF-7/ADR cells [142-144]. It has been shown that
cellular populations in spleen tissue undergo substantial changes after ADR treatment, which may have
global effects on immunity in ADR-treated patients [145]. To-date no quantitative proteomics studies of
spleen tissue from ADR-treated mice has been reported. Herein is the first report that has examined the
effects of ADR treatment on protein expression in spleen. The proteomics method employs global
internal standard technology (GIST), which is a post-digestion precursor isotopic labeling approach
(Chapter 1) [73]. Nanoflow reversed phase liquid chromatography (RPLC)-tandem MS (MS/MS) was
used to detect relative changes in splenic protein expression in control and ADR-treated mice.
2.2. EXPERIMENTAL
2.2.1. Animal Housing and Treatment
Approximately three month old male B6C3 mice were housed at the University of Kentucky
Central Animal Facility with 12 hour light/12 hour dark cycle. Animals were fed standard Purina rodent
chow ad libitum. The animal protocol was approved by the University of Kentucky Animal Care and Use
Committee. Animals used in these studies were the same as those previously reported [136]. Mice were
divided into two groups and injected with either saline (hereafter referred to as control mice) or
adriamycin (25mg/kg body weight; hereafter referred to as ADR-treated mice). Spleen tissue was
harvested 72 hours post injection from saline-perfused mice. For these studies, an N = 5 was used for
each treatment group.
20

2.2.2. Spleen Homogenization
Spleen tissues were homogenized in an ice-cold phosphate buffer saline (PBS) solution
containing 8 M urea with 100 passes of a Wheaton homogenizer. Homogenate solution was collected,
sonicated, and centrifuged at 13000 RPM for 10 minutes (4 °C). Supernatants were collected and protein
concentrations determined using the BCA assay according to the manufacturer’s instructions (Pierce
Thermo; Rockford, IL). Samples were stored at -80 °C until further use.
2.2.3. Protein Digestion
For individual samples, 100 µg of spleen protein was spiked with 1 µg of bovine β-lactoglobulin
(Sigma Aldrich; St. Louis, MO) and subject to tryptic digestion as follows. 0.25 M dithiothreitol
(Thermo Fisher; Pittsburgh, PA) was added in a 1:40 protein:reagent molar excess and incubated at 37 °C
for two hours. 0.25 M iodoacetamine (Acros Organics; Morris Plains, NJ) was added in a 1:80
protein:reagent molar excess and incubated at 0 °C for two hours in the dark followed by the addition of
0.25 M L-cysteine in a 1:40 protein:reagent molar excess at room temperature for 30 minutes. Tris buffer
solution (0.2 M Tris, 10 mM CaCl2, pH 8.0) was added to reduce the urea concentration to 2 M. TPCK-
treated trypsin from bovine pancreas (Sigma Aldrich) was added to each sample in a 2% w:w
enzyme:protein ratio and incubated at 37 °C for 24 hours. Samples were flash-frozen with liquid nitrogen
and cleaned using Waters Oasis HLB C18 cartridges.
2.2.4. Synthesis of N-acetoxy-H3-succinimide and N-acetoxy-2H3-succinimide
The procedure for synthesis of N-acetoxy-H3-succinimide and N-acetoxy-2H3-succinimide is
described elsewhere [146]. Briefly, 1.9478 g of N-hydroxysuccinimide (NHS, Sigma Aldrich) was added
to 4.8 mL of >99% acetic anhydride (Sigma Aldrich) or 1.9451 g of NHS was added to 4.4 mL of 99%
atom 2H6-acetic anhydride (Sigma Aldrich). Both reactions occurred at room temperature for 15 hours
under nitrogen. White crystals products were collected, washed thoroughly with hexane, and dried under
vacuum. Product purity was confirmed with NMR analysis (>95% purity).
21
2.2.5. Isotopic Labeling of Peptides
Stock solutions (0.25 M) of N-acetoxy-H3-succinimide and N-acetoxy-2H3-succinimide were
prepared in 50 mM phosphate buffer (pH = 7.5). Tryptic peptide samples (1 mg⋅mL-1) were reconstituted
in 50 mM phosphate buffer and reacted with 100 molar excess of the N-acetoxy-H3-succinimide (light)
and N-acetoxy-2H3-succinimide (heavy) for control and ADR-treated mice, respectively. Reactions
occurred at room temperature for 5 hours under constant stirring. Control and ADR-treated samples were
pooled and treated with excess 0.25 M hydroxylamine hydrochloride (Sigma Aldrich) and adjusted to pH
10. After 20 minutes at room temperature the samples were adjusted to pH 7 and were cleaned, dried, and
stored at -80°C.
2.2.6. LC-MS/MS
Isotopically labeled peptide samples were reconstituted in formic acid solution (0.1% in water) to
a concentration of 0.5 µg⋅µL-1 and injected onto a trapping column (2 cm × 100 µm i.d.) packed with 200
Å C18 material (Michrom Bioresources Inc.; Auburn, Ca) using an autosampler on a nanoflow Eksigent
2D LC system. Buffers A and B were composed of water:acetonitrile (97:3) and acetonitrile,
respectively, each with 0.1% formic acid. Samples were washed with buffer A and eluted onto an
analytical column (13.2 cm × 75 µm i.d.) packed with 100 Å C18 material (Michrom Bioresources Inc.).
Gradient elution was performed as follows (%A/%B): 90:10 for 2 minutes, ramp to 85:15 over 4 minutes,
hold for 4 minutes, ramp to 70:30 over 120 minutes, ramp to 40:60 over 30 minutes, ramp to 20:80 over
five minutes, hold for 10 minutes followed by column re-equilibration. Eluted peptides were detected on
an LTQ-Orbitrap Velos MS using data-dependent acquisition with the following parameters: full FT
parent scan at 60,000 resolution over the m/z range of 300-1800, positive ion mode, the top 6 most intense
ions were selected for CID fragmentation (35% collision energy, 10 ms activation time, 5000 minimum
ion count threshold) and mass analyzed using the LTQ. Each pooled isotopically labeled sample (N = 5)
was analyzed with three technical LC-MS/MS replicates.
22

2.2.7. Database Searching and Analysis
.RAW files were searched against the mouse International Protein Index (IPI) database (56957
total sequences on 4/26/2010) using the SEQUEST algorithm embedded in Proteome Discoverer 1.2
software (Thermo). The FASTA sequence for bovine β-Lactoglobulin (National Center for
Biotechnology Information Accession Number: gi4388846) was manually added to the database. Search
parameters included: precursor mass tolerance of 15 ppm, fragmentation tolerance of 1.0 Da, dynamic
modifications of light and heavy acetyl groups on lysine residues and the N-terminus and oxidation of
methionine, and a static modification of carbamidomethyl on cysteine. All files were searched against a
decoy database with false discovery rates set at p<0.05 and p<0.01 so that only medium and high
confidence peptides, respectively, were used for further analysis. Proteome Discoverer 1.2 provided peak
intensity and area information for light and heavy labeled peptides and protein ratio calculations.
2.2.8. Statistics for Differentially-Expressed Proteins
The search results were treated as follows in order to generate a confident and conservative list of
differentially-expressed proteins. After calculation of protein ratios, the protein list was filtered to include
only proteins that were detected in a minimum of any six LC-MS/MS analyses. One-way ANOVA (p <
0.05) was carried out in Origin 8.0 to assess statistical differences in the ADR/control (CTR) ratios across
biological (N = 5) and technical (N=3) replicates for each protein. Proteins were considered
differentially-expressed if the following two criteria were met: 1) a calculated F score < the tabulated F
score (α = 0.05) and, 2) a ADR/CTR or CTR/ADR ratio > 1.5.
2.2.9. Western Blot Verification
Protein samples (50 µg) were denatured in an appropriate sample buffer and electrophoretically
separated on a Criterion TGX gel (Biorad Laboratories; Hercules, CA) at 250 V. Protein from the gel was
transferred onto a nitrocellulose membrane paper using a Fast-Transfer Blot System (Biorad). Blots were
washed three times in Wash blot. BSA blocking solution was added to the membrane and incubated on a
23

rocker for one hour. A 1:1000 dilution of rabbit polyclonal anti-annexin A2 primary antibody (Sigma
Aldrich) and 1:2000 dilution of rabbit polyclonal anti-actin primary antibody (Sigma Aldrich) was added
and incubated at 4 °C overnight. The blot was rinsed and incubated with a 1:8000 dilution of anti-rabbit
IgG alkaline phosphatase secondary antibody (Sigma Aldrich) for one hour on a rocker. The blot was
rinsed and colorometrically developed as described above for protein carbonyls. The dried blot was
scanned using a Canon scanner, saved as a .TIFF file, and densitometry analyses carried out with Scion
Image Software.
2.3. RESULTS
2.3.1. Effects of ADR Treatment on Spleen Tissue
In order to better understand the effects that ADR treatment has on spleen tissue we initially
began by measuring spleen weights. The ADR-treated mice used in these studies exhibited an ~11%
decrease in body weight and an ~68% decrease in thymus weight [136]. Additionally, this work reports
an ~66% loss in spleen weight of ADR-treated mice relative to controls (Table 2.1). Because lower body
weight and thymus size are correlated with lower numbers of lymphocytes [136], we hypothesize that
there is also a lower number of splenic lymphocytes based on smaller spleen sizes in ADR-treated mice.
2.3.2. GIST Proteomics Workflow
The quantitative proteomics workflow, shown in Figure 2.1, was used to determine differences in
protein expression after ADR treatment as follows. Protein samples extracted from homogenized spleen
tissue of control and ADR-treated mice were spiked with an internal protein standard (i.e., bovine β-
lactoglobulin) prior to trypsin digestion. Tryptic peptide samples from control and ADR-treated mice
were isotopically labeled with either a light or heavy GIST reagent, respectively, and pooled in a 1:1 ratio.
Isotopically labeled peptide mixtures (N = 5 for biological replicates) were analyzed with triplicate
nanoflow LC-MS/MS experiments using a LTQ-Orbitrap Velos MS. Identified proteins were filtered (as
discussed above) in order to generate a list of differentially-expressed proteins.
24

Table 2.1. Masses of Spleen Tissues Collected from Control and ADR-treated Mice.
Animal Control (g) ADR (g) 1 0.0814 0.0297 2 0.0909 0.0346 3 0.0859 0.0378 4 0.115 0.0269 5 0.0840 0.0278
Ave. ± SD .0914 ± .0135 .0314 ± .0047
25
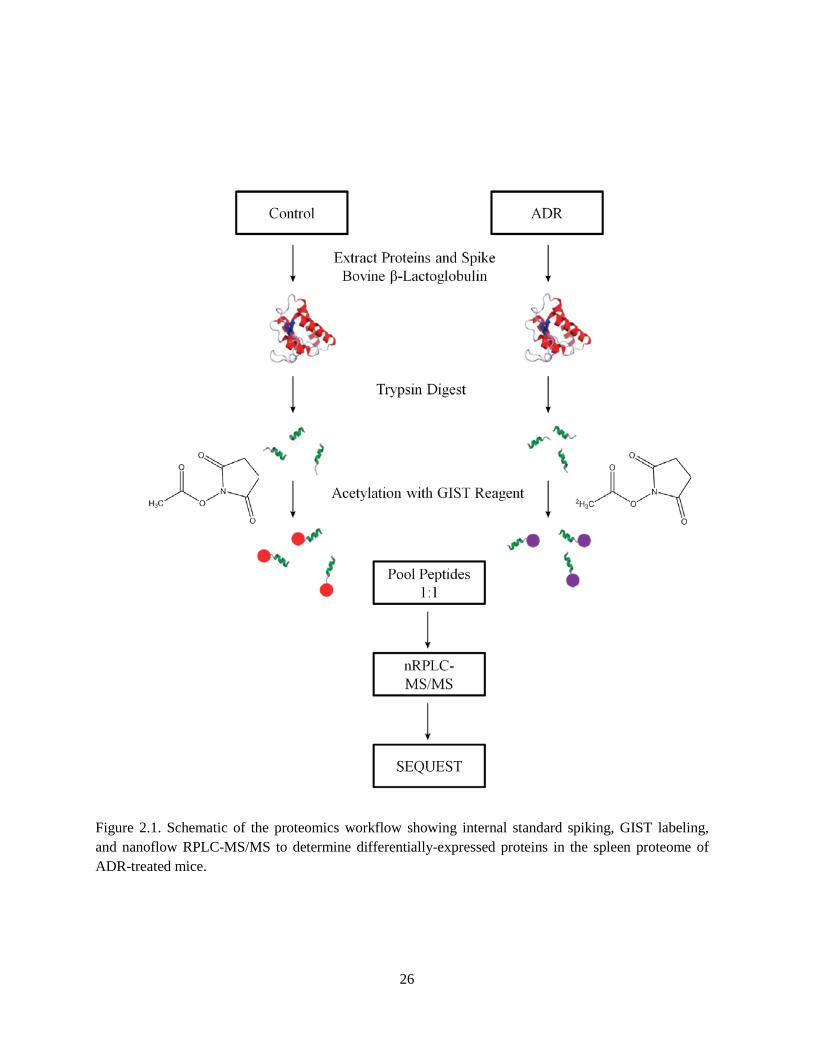
Figure 2.1. Schematic of the proteomics workflow showing internal standard spiking, GIST labeling, and nanoflow RPLC-MS/MS to determine differentially-expressed proteins in the spleen proteome of ADR-treated mice.
26

2.3.3. Internal Standard Normalization
Figure 2.2a shows an example parent mass spectrum obtained for a doubly-charged peptide pair
at m/z 509.289 and 512.308 that eluted from the column at tr = 80.8 minutes. The observed mass shift of
6 Da between the light and heavy labeled peptide peaks indicates that the peptide contains the addition of
two acetylations to the peptide sequence. The CID-MS/MS spectrum for the light labeled peptide is
shown in Figure 2.2b displaying a consecutive series of b- and y-type fragment ions. The CID-MS/MS
spectrum for the heavy labeled peptide is similar (data not shown). This peptide pair has been assigned as
the [(Acetyl)LIVQTMK(Acetyl)+2H]2+ peptide of β-lactoglobulin. The ratio of heavy/light labeled
peptides for the internal standard should be unity as 1 µg of β-lactoglobulin was spiked into protein
extracts of both control and ADR-treated spleen samples. The measured ratio for heavy/light labeled
peaks shown in Figure 2a is 1.0 based on peak areas, which agree with the expected values. The ratio
values for other tryptic peptides of β-lactoglobulin are similar and an average protein ratio value of
0.98±0.10 is observed across all 15 injected samples. β-lactoglobuin ratio values within each technical
replicate were used to normalize ratio values of mouse splenic proteins.
As previously discussed, isotopically labeled peptide mixtures were subject to triplicate LC-
MS/MS analyses. Figure 2.3 shows a bar graph of the total number of proteins identified in each
individual analysis. The average number of proteins detected in a single injection is 189± 29. The total
number of proteins identified increases with each new sample injection such that, after accounting for
redundant entries, we identified a total of 388 unique proteins across the 15 injections. This accounts for
a total of 70,033 spectral peptide counts.
2.3.4. Differentially-Expressed Proteins in ADR-Treated Mice
Using a conservative set of criteria (see section 2.2.8), 59 proteins were assessed as differentially-
expressed in ADR-treated mice (Table 2.2). These proteins are involved in processes such as cell
signaling, protein translation, defense response, metabolism, Ca2+ binding and apoptosis, and structural
27

Figure 2.2. Example mass spectra a) of a peak pair [L(acetyl)IVTQTMK(acetyl)+2H]2+ that eluted at tr 80.8 minutes with m/z 509.289 and 512.308 for the light and heavy labeled peaks, respectively, and b) of the CID generated fragments obtained upon isolation of the light labeled peak at m/z 509.289. The peptide assigned belongs to β-lactoglobulin
28

Figure 2.3. Bar graph of the total number of proteins identified in individual LC-MS/MS analyses and the total number of newly assigned proteins identified with each consecutive experiment (diamonds). The values shown include redundant protein assignments that arise due to isoforms.
29

Prot
ein
Nam
e
Supe
roxi
de d
ismut
ase
[Cu-
Zn]
Ann
exin
A5
Ann
exin
A2
Cal
mod
ulin
Cal
retic
ulin
78 k
Da
gluc
ose-
regu
late
d pr
otei
nH
emop
exin
Com
plem
ent C
3A
lpha
-1-a
ntitr
ypsin
1-1
Thro
mbo
spon
din
1Se
rine
prot
ease
inhi
bito
r A3K
Phos
phol
ipas
e D
4Su
lfate
d gl
ycop
rote
in 1
pre
prop
rote
in6-
phos
phog
luco
nate
deh
ydro
gena
se,
deca
rbox
ylat
ing
Fruc
tose
-bisp
hosp
hate
ald
olas
e A
Nuc
leos
ide
diph
osph
ate
kina
seA
ldeh
yde
dehy
drog
enas
e, m
itoch
ondr
ial
Pept
idyl
-pro
lyl c
is-tra
ns is
omer
ase
BPa
rkin
son
dise
ase
(Aut
osom
al re
cess
ive,
ear
ly
onse
t) 7
Alp
ha-a
ctin
in-4
Alp
ha-a
ctin
in-1
Upr
egul
ated
Tabl
e 2.
2. L
ist o
f Diff
eren
tially
-Exp
ress
ed P
rote
ins
in A
dria
myc
in-T
reat
ed M
ice.
Acc
essio
naA
DR
/CTR
± S
EbIn
ject
ion
Num
berc
Func
tion
0013
0589
.81.
5 ±
.314
antio
xida
nt00
3173
09.5
2.0
± .3
15C
a+2
bind
ing
/ apo
ptos
is00
8852
92.1
*2.
5 ±
.411
Ca2
+ bi
ndin
g00
7616
96.2
3.5
± 2.
16
Ca2
+ bi
ndin
g / a
popt
osis
0012
3639
.11.
9 ±
.711
Ca2
+ bi
ndin
g/ch
aper
one
0031
9992
.11.
6 ±
.312
Ca2
+ ch
aper
one
0012
8484
.118
± 7
.66
imm
une
resp
onse
0032
3624
.35.
5 ±
1.3
10im
mun
e re
spon
se00
4063
02.2
*2.
3 ±
.411
imm
une
resp
onse
0011
8413
.2*
1.8
± .4
10im
mun
e re
spon
se00
1318
30.1
3.8
± 1.
26
met
abol
ism00
8310
33.1
3.1
± 1.
26
met
abol
ism00
9282
04.1
*3.
1 ±
.711
met
abol
ism
0046
6919
.72.
8 ±
1.8
12m
etab
olism
0022
1402
.72.
5 ±
1.5
13m
etab
olism
0064
9586
.1*
1.8
± .6
8m
etab
olism
0011
1218
.11.
6 ±
.111
met
abol
ism00
1356
86.2
6.2
± 3.
18
signa
ling
0089
4769
.11.
7 ±
.710
signa
ling
0011
8899
.13.
3 ±
1.3
15st
ruct
ure
0038
0436
.12.
2 ±
.615
stru
ctur
e
30

Tabl
e 2.
2. (
cont
inue
d)Pr
otei
n N
ame
Dih
ydro
pyrim
idin
ase-
rela
ted
prot
ein
2Is
ofor
m 2
of t
ropo
myo
sin b
eta
chai
nTr
opom
yosin
alp
ha-4
cha
inV
incu
lin37
kD
a pr
otei
nTu
bulin
, bet
a 1
Spec
trin
beta
cha
in, e
ryth
rocy
teTa
lin-1
Vim
entin
Des
min
Tran
sgel
inTr
ansg
elin
-2Fi
lam
in, a
lpha
Het
erog
eneo
us n
ucle
ar ri
bonu
cleo
prot
ein
FM
yosin
Myo
sin-1
1 iso
form
100
9385
30.1
1.6
± .3
14tra
nspo
rt
0012
3181
.4M
yosin
-91.
6 ±
.215
trans
port
0022
6073
.2*
1.6
± .7
6tra
nsla
tion
0010
9044
.8*
3.1
± 1.
511
trans
port
0012
5778
.41.
9 ±
.314
stru
ctur
e00
6646
43.2
*1.
8 ±
.215
stru
ctur
e
0013
0102
.42.
4 ±
.311
stru
ctur
e00
2265
15.5
2.3
± .3
11st
ruct
ure
0046
5786
.31.
9 ±
.215
stru
ctur
e00
2272
99.6
1.8
± .2
15st
ruct
ure
0034
8094
.42.
1 ±
.76
stru
ctur
e00
1313
76*
1.9
± .7
7st
ruct
ure
0040
5227
.33.
2 ±
.515
stru
ctur
e00
8307
01.1
3.0
± .6
6st
ruct
ure
0087
4728
.15.
9 ±
2.5
9st
ruct
ure
0042
1223
.33.
6 ±
1.0
14st
ruct
ure
0011
4375
.22.
3 ±
.310
stru
ctur
eA
cces
siona
AD
R/C
TR ±
SEb
Inje
ctio
n N
umbe
rcFu
nctio
n
31

Tabl
e 2.
2. (
cont
inue
d)Pr
otei
n N
ame
T-co
mpl
ex p
rote
in 1
sub
unit
beta
SET
trans
loca
tion
Mac
roph
age-
capp
ing
prot
ein
Del
ta-a
min
olev
ulin
ic a
cid
dehy
drat
ase
Prob
able
ATP
-dep
ende
nt R
NA
hel
icas
e D
DX
5Pu
tativ
e un
char
acte
rized
pro
tein
Gm
6636
GTP
ase
IMA
P fa
mily
mem
ber 4
Ald
ose
redu
ctas
eFl
avin
redu
ctas
eSH
3 do
mai
n-bi
ndin
g gl
utam
ic a
cid-
rich-
like
prot
ein
3
Dow
nreg
ulat
ed
0011
3996
.7.3
7 ±
.17
7re
dox
0012
7358
.1.6
5 ±
.11
7re
dox
0075
4464
.1*
.58
± .3
36
met
abol
ism00
2237
57.4
.52
± .1
66
met
abol
ism
0042
0363
.2.5
0 ±
.09
7m
etab
olism
0066
5513
.3.4
9 ±
.19
6m
etab
olism
0013
6906
.1.4
3 ±
.10
9im
mun
e re
spon
se/s
truct
ure
0011
2719
.1.4
4 ±
.19
9m
etab
olism
0032
0217
.9.6
4 ±
.06
9ch
aper
one
0075
5843
.1*
.50
± .1
16
chap
eron
e
Acc
essio
naA
DR
/CTR
± S
EbIn
ject
ion
Num
berc
Func
tion
32

Tabl
e 2.
2. (
cont
inue
d)Pr
otei
n N
ame
Hig
h m
obilit
y gr
oup
prot
ein
B2
14-3
-3 p
rote
in th
eta
F-ac
tin-c
appi
ng p
rote
in s
ubun
it al
pha
Nuc
leol
inH
iston
e H
1.5
Hist
one
H3.
2Po
lyad
enyl
ate-
bind
ing
prot
ein
140
S rib
osom
al p
rote
in S
A40
S rib
osom
al p
rote
in S
340
S rib
osom
al p
rote
in S
14H
eter
ogen
eous
nuc
lear
ribo
nucl
eopr
otei
n A
1*I
ndic
ates
a p
rote
in s
eque
nce
that
was
retu
rned
in th
e se
arch
resu
lts w
ith re
dund
ant i
dent
ifica
tions
due
to p
rote
in is
ofor
ms
that
cou
ld
not b
e di
stin
guish
ed b
ased
on
pept
ides
obs
erve
da A
cces
sion
num
bers
repo
rted
are
take
n fr
om th
e In
tern
atio
nal P
rote
in In
dex
mou
se d
atab
ase
b Val
ues
repr
esen
t the
ave
rage
AD
R/C
TR v
alue
± s
tand
ard
erro
r, w
here
by 6
<N<1
5 (s
ee E
xper
imen
tal o
f det
ails)
dep
endi
ng o
n th
e nu
mbe
r of b
iolo
gica
l and
tech
nica
l rep
licat
es in
whi
ch th
e pr
otei
n (p
eptid
es) w
ere
obse
rved
c Tota
l cou
nt o
f pro
tein
s id
entif
icat
ions
acr
oss
all e
xper
imen
ts (i
njec
tions
). 6
<N<1
5
0012
4287
.1.5
9 ±
.10
6tra
nsla
tion
0023
0133
.5.4
1 ±
.05
10tra
nscr
iptio
n
AD
R/C
TR ±
SEb
Inje
ctio
n N
umbe
rcFu
nctio
n
0081
7004
.1.5
3 ±
.11
6tra
nsla
tion
Acc
essio
na
0013
4599
.1.2
5 ±
.08
8tra
nsla
tion
0032
2562
.5.6
2 ±
.13
6tra
nsla
tion
0012
3604
.4.6
2 ±
.32
7tra
nsla
tion
0028
2848
.1.6
6 ±
.08
10tra
nscr
iptio
n
0033
0063
.6*
.65
± .0
96
stru
ctur
e00
3177
94.5
.39
± .0
68
trans
crip
tion
0046
2291
.5.2
6 ±
.05
6sig
nalin
g00
6562
69.1
.66
± .1
78
signa
ling
33
stability. In total, 37 proteins are upregulated (ADR/CTR > 1.5) and 21 proteins are downregulated
(CTR/ADR > 1.5). Most of the upregulated proteins and all of the down-regulated proteins change by a
factor of 1.5-4.0. Four upregulated proteins (i.e., complement C3 protein, tropomyosin 2, peptidyl-
cis/trans-isomerase, and hemopexin) were expressed by a factor of >4 in spleen tissue as a result of ADR
treatment.
2.3.5. MS/MS and Western Blot Analysis of Annexin A2
Figure 2.4a shows an example MS/MS spectrum for a doubly-charged peptide pair at m/z 792.934
and 794.445. The isotopically labeled peaks have a ADR/CTR ratio of 2.0, indicating the upregulation of
this species in ADR-treated mice. The MS/MS spectrum in Figure 2.4b shows fragment ions that
correspond to the peptide sequence [(Acetyl)GVDEVTIVNILTNR+2H]2+ that belongs to the protein,
annexin A2. Annexin A2 has an average ADR/CTR ratio of 2.5 ± 0.4 as measured across 11 injections
(Table 2.2). Western validation was carried out in order to confirm protein changes measured with our
proteomics workflow for annexin A2. Figure 2.5 shows an example Western blot obtained for control
and ADR-treated splenic proteins for annexin A2 and actin (loading control). A 50% increase in annexin
A2 levels is observed in ADR-treated mice supporting upregulation of this protein, which is consistent
with proteomics results (Figure 2.5).
2.4. DISCUSSION
This work reports the first investigation of the effects of ADR treatment on splenic protein levels
in mice. The spleen is involved in innate and adaptive immunity and helps to regulate immune
homeostasis [147]. The spleen consists of lymphocytes such as T-cells, B-cells, and macrophages with
functions that include blood filtering, iron recycling, pathogen response, and immune induction,
activation, and proliferation [147]. These functions are critical for normal conditions and even more so in
diseased states, such as cancer. The smaller spleen weight measured in this work (Table 2.1) is consistent
with other reports of reduced body weight and spleen size in ADR-treated mice [136, 148-150] and
34

Figure 2.4. Example mass spectra a) of a peak pair [(Acetyl)GVDEVTIVNILNR+2H]2+ that eluted at tr 117.5 minutes with m/z 792.934 and 794.445 for the light and heavy labeled peaks, respectively, and b) of the CID generated fragments obtained upon isolation of the light labeled peak at m/z 792.934. The peptide belongs to the annexin A2 protein.
35

Figure 2.5. Example Western blot image of annexin A2 and actin (loading control) protein expression. The percent annexin A2 in control and ADR-treated mice obtained after normalization of annexin A2 levels to actin levels are listed underneath the image, N = 3.
36
supports the notion that altered cell differentiation [127] as well as decreased lymphocyte proliferation
[148, 151] persist with ADR treatment. Reduced spleen size is also reflective of lower numbers of
lymphocytes, which occurs with aging [152] and could result in a weakened immune response in ADR-
treated patients.
Following acute ADR treatment in mice, 59 splenic proteins were differentially-expressed (Table
2.2). Figure 2.6 shows a graphical illustration of the major pathways affected by ADR treatment, which
we discuss below. These proteins are involved in a number of biological processes such as Ca2+ binding
and apoptosis, DNA transcription and repair, cellular signaling, redox maintenance, metabolism,
immune/defense response, and structural maintenance.
2.4.1. Ca2+Binding/Apoptosis Proteins
Proteins involved in Ca2+-binding, apoptosis, and chaperone activity were upregulated in ADR-treated
mice. Annexins 2 and 5 belong to a class of Ca2+-dependent membrane binding proteins. Annexin binds
to both free Ca2+ and the phospholipids of the membrane structure [153] and may be a key moderator of
apoptosis. Annexin A2 has been reported as upregulated in ADR resistant cells [138, 154] suggesting its
importance for chemoresistance. Annexin A5 has been found to inhibit apoptosis of phagocytes [155].
Upregulation of annexin A5 in ADR-treated mice is consistent with upregulation in the thymus [136],
ADR-treated HepG2 cells [133], and in MCF-7/ADR resistant cells [143, 156].
Calreticulin, is a Ca2+-binding chaperone protein that is localized to the endoplasmic reticulum.
Although calreticulin has a number of biological functions its primary roles involve modulation of Ca2+
homeostasis and molecular chaperone activity. Upregulation of calreticulin can lead to elevated levels of
free Ca2+ that is housed in intracellular stores [157]. Additionally this protein is localized to the cell
surface and is critical for initiating immune response [158]. In ADR-treated cells calreticulin migrates
from the ER and localizes to the surface of pre-apoptotic and cancerous cells, which will undergo
clearance by lymphocytes [159]. Calmodulin is another Ca2+-binding protein, which is involved in Ca2+
homeostasis, cellular growth, proliferation, and transport processes and has been implicated in
37

Figure 2.6. Illustrative depiction of differentially-expressed splenic proteins (pathways) that are affected from ADR-treatment.
38
chemoresistance of cancer therapies [160]. Ca2+ ion flux is important in modulating cell death in the
immune system [161], thus overexpression of Ca2+-binding proteins observed in ADR-treated mice could
alter free Ca2+ levels and lead to irreversible cell injury and death.
2.4.2. Transcription and Translation
Several transcriptional and translational-related proteins were downregulated in ADR-treated
mice. Histone proteins oligomerize to form the nucleosome, which is the core component of chromatin,
and help to recruit proteins to DNA. Nucleolin is a histone chaperone protein that is found on the surface
of cancerous cells [162]. Downregulation of nucleolin and histones H1.5 and H3.2 may be directly
related with ADR’s mechanistic action of DNA intercalation and inhibition of topoisomerase II, which
results in disrupted transcription. Other histone proteins have been reported as upregulated in human
Jurkat T-cells treated with ADR [134]. It is not clear why there are differences in histone expression
between these studies but it may be because transcription is affected by ADR treatment.
The 40S ribosomal proteins SA, S3, and S14 were downregulated in ADR-treated mice, which is
consistent with studies in ADR-treated Jurkat T-cells [134]. Heterogeneous nuclear ribonucleoproteins
(HNRP) in this work differed in expression levels. For example, HNRP A1 is downregulated, whereas
HNRP F is upregulated (Table 2.2) in ADR-treated mice. In Raji cells treated with ADR, HNRP C1/C2
was downregulated, whereas in ADR resistant cells HNRP D is upregulated [138]. Polyadenylate-
binding protein 1, another protein involved in protein translation, is downregulated in these studies.
Overall, it appears that ADR treatment reduces protein translational activity which may be related with
oxidative damage and altered transcription.
2.4.3. Cytoskeletal/Structural Proteins
Proteins involved in integrity of the cytoskeleton or other structures represent the largest group of
differentially-expressed proteins in ADR-treated mice. Cytoskeletal proteins have been implicated as
potential targets for chemotherapeutic treatments in cancer [163]. Cytoskeletal and structural related
39

proteins in these studies were all found to be upregulated, with the exception of F-acting-capping protein,
which is downregulated in ADR-treated mice. Upregulation of filamin, tropomyosin, spectrin, and
tubulin is consistent with studies in ADR-treated HepG2 cells [133]. Vimentin is upregulated in these
studies and in ADR-treated human Jurkat T cells [134] but has also been reported as downregulated in
ADR-treated Raji cells [135].
Tubulin proteins are the base unit of microtubules in the cell, which are needed for cellular
transport and structural integrity. Both α- and β-tubulin were upregulated in the thymus of ADR-treated
mice [136], which is consistent with these results. However, β-tubulin has also been observed to be
downregulated following ADR treatment [133]. α-actinin is a ubiquitously expressed cytoskeletal protein
that is comprised of an actin-binding domain, a calmodulin-like domain, and a calponin-homology
domain [164]. Actinin belongs to a family of F-actin cross linking proteins that also includes spectrin. α-
actinin-1 and -4 are found in nonmuscle tissues and are necessary for T-cell migration and activation
[164].
The proteins described above as well as transgelin, transgelin-2, and dihydropyrimidinase-related
protein 2 detected in these studies, each has a key role for normal maintenance of the cytoskeletal
structure. Upregulation of cytoskeletal proteins following ADR treatment could occur due to a
compensatory mechanism to maintain structural stability. In addition to detrimental effects caused by
cancerous cells, chemotherapeutic compounds (e.g., ADR) have been suggested to be a major cause of
disruption of cytoskeletal proteins [165]. Consequences of disrupted cytoskeletal integrity include
alterations to cell shape, growth, and transport which may lead to cell destruction and failure.
2.4.4. Chaperone/Immune and Defense Response/Antioxidant
Differential regulation of proteins involved in cellular defense processes indicates that cells are
under attack or there is cellular dyshomeostasis, particularly in these studies as a result of ADR treatment.
Glucose-regulated 78 kDa (GRP78) protein belongs to the class of heat shock 70 proteins, which serve as
40

molecular chaperones. GRP78 is endoplasmic reticulum resident and involved in misfolded protein
response. Other functions of GRP78 include Ca2+ homeostasis, apopotosis, and cellular signaling related
with cancer cell proliferation and survival [166]. GRP78 overexpression is associated with a number of
cancers and may be indicative of cellular stress or favorable survival outcomes due to the removal of
cancerous cells [166]. Upregulation of GRP78 in these studies may suggest that ADR treatment provides
cells with additional defenses against misfolded proteins that are likely to occur in cancer patients.
Downregulation of T-complex protein 1-a cytosolic chaperone protein[167] suggests that there is an
imbalance in the overall cellular chaperone machinery in the presence of ADR.
Immune response proteins: complement C3, α-1-antitrypsin 1-1, and thrombospondin 1 were
upregulated in ADR-treated mice. Thrombospondin 1 inhibits tumor cell progression and angiogenesis
and has been investigated as a potential target for cancer therapy [168]. Due to the multifunctional roles
of thrombospondin 1, it is possible that upregulation of this protein following ADR treatment results in
reduced tumor growth in normal and cancerous cells. Complement C3 is directly involved in the
complement system that is a part of the innate immune response. α-1 antitrypsin 1, a proteinase inhibitor,
is also involved in immune response by protecting cells in inflammatory conditions. Hemopexin, is a
scavenger of free heme that is used to transport molecular oxygen. It belongs to the acute-phase proteins,
which can be activated in the immune system under inflammatory conditions and is sometimes localized
to the surface of macrophages in spleen for receptor binding [169]. ADR treatment, based on
upregulation of these splenic proteins, may help to increase immune response by initiating compensatory
inflammation mechanisms.
Superoxide dismutase (SOD) is an endogenous antioxidant defense enzyme that eliminates
superoxide anion through catalyzing the dismutation of superoxide anion to oxygen and hydrogen
peroxide. Manganese SOD has been heavily implicated in cancer [170], however we detected
upregulation of Cu-Zn SOD (or SOD1) in ADR-treated mice. St. Clair et al. demonstrated that an
overexpression of SOD2 in heart tissue helps protect the heart from oxidative damage and ADR
41

cardiotoxicity [171]. Due to the antioxidant nature of SOD, upregulation of this enzyme may be in result
to the free radicals generated from ADR redox recycling and thus serves to protect cells from oxidative
damage.
2.4.5. Metabolism
Metabolic proteins in these studies had varying expression in response to ADR treatment (Table
2.2). Serine protease inhibitor A3K, isoform 2 of phospholipase D4, sulfated glycoprotein 1 preprotein, 6
–phosphogluconate dehydrogenase, fructose-bisphosphate aldolase A, nucleoside diphosphate kinase, and
aldehyde dehydrogenase were upregulated in ADR-treated mice, whereas δ-aminolevulinic acid
dehydratase, probable ATP-dependent RNA helicase DDX5, GTPase IMAP family member 4, aldose
reductase, and flavin reductase were downregulated. Alterations to metabolic proteins were also observed
in thymus from ADR-treated mice [136]. Alterations to metabolism in peripheral immune organs (i.e.,
spleen, and thymus) can be compared with reports describing changes to myocardial energy metabolism
[172]. Differential-expression of metabolic splenic proteins shows that ADR treatment has downstream
effects in glycolysis, glucogenesis, and other metabolic pathways. For example, aldose reductase, which
converts glucose to fructose during impaired glycolysis, also functions to reduce toxicity of lipid
peroxidation products, such as 4-hydroxy-trans-nonenal. Downregulation of this particular enzyme may
be detrimental to spleen in ADR-treated mice. Normal energy production is critical to help cells have a
better defense response against cellular toxicity and cancer and to maintain normal cellular homeostasis.
2.4.6. Redox/Cellular Signaling/Transport
The redox system in the cell is crucial to maintaining a balance between reactive oxygen species
and antioxidants, which keeps cells free from oxidative stress and damage. Redox processes are altered
following ADR treatment in cancer cells [137]. Splenic proteins involved in cellular signaling and
transport processes were differentially-expressed in ADR-treated mice (Table 2.2) and have been
implicated in other proteomic studies investigating effects of ADR treatment [128, 133-135]. Peptidyl-
42
prolyl cis-trans isomerase B belongs to the family of PPIase enzymes that isomerize proline residues in
target proteins and assist in protein folding. This particular PPIase is upregulated in spleen whereas Pin 1
is downregulated in the brains of ADR-treated mice [128]. Myosin proteins (i.e., Myosin, Myosin-11,
Myosin-9) are ATP-dependent proteins which regulate actin-based cell motility and were detected as
upregulated in these studies. Myosin-9 and Myosin-11 were downregulated in mitochondrial Raji cells
after ADR treatment [135]. The differences observed in expression of myosin, Pin1, and 14-3-3 may be
tissue specific. Upregulation of these proteins following ADR treatment could be related to upregulation
of cytoskeletal proteins, which would be necessary for maintenance of cellular structure and hence
cellular transport.
2.5. CONCLUSIONS
ADR treatment is reported to have detrimental effects on a number of tissues in animal models
and in cell cultures. Downstream effects of ADR-treatment on mouse spleen tissue include reduced
spleen size and alterations to the global splenic proteome for proteins involved in cellular processes such
as cytoskeletal structural integrity, Ca2+ binding, immune response and others. It is possible that ADR
treatment through alterations to protein expression leads to weakened immunity. Insights gained from
these studies will be useful for understanding toxic mechanisms of ADR treatment, which is necessary to
minimize drug side effects and improve quality of life in cancer patients undergoing ADR treatment. In
this work, we perform differential analysis of ADR-treated mice using the precursor quantitation
technique global internal standard technology. Control and ADR-treated mice were treated with light and
heavy acetyl groups, respectively creating a mass shift of 3 Da. While effective at providing accurate
quantitation and determination of differentially-expressed proteins, five samples were prepared and
analyzed individually.
43

3.0. PROTEOMICS QUANTIFICATION OF PROTEIN NITRATION*
(*De Gruyter Proteomics Quantification of Protein Nitration, Walter De Gruyter GmbH Berlin
Boston, 2013. Copyright and all rights reserved. Material from this publication has been used with
the permission of Walter De Gruyter GmbH.) [99]
3.1. INTRODUCTION
Protein nitration is a post-translational modification (PTM) that can occur under oxidative stress
(Section 1.1.1) [33]. Nitration is mediated by an increased concentration of reactive oxygen and nitrogen
species (ROS and RNS, respectively) such as O2.-, ONOO-, and NO2
.. An overabundance of cellular RNS
levels can result in the formation of 3-nitrotyrosine (3NT) and 3NT-modified proteins [173]. Protein
nitration may result in altered enzymatic activity [174, 175], reduced cellular signaling, disruption of
phosphorylation pathways [176], and protein degradation [177]. In addition, this PTM has been linked to
various diseases such as cancer, cardiovascular disease [178], arthritis [179], and neurodegenerative
disorders such as Alzheimer’s (AD) disease [180] and Parkinson disease (PD) [181, 182].
Elevated protein nitration has been observed in the brains of AD patients and is correlated with
disease hallmarks such as amyloid-β peptide levels, senile plaque deposition, and neurofibrillary tangles
(composed of tau proteins) as well as physiological symptoms such as memory loss, decreased motor and
language skills, and other behavioral changes [26]. Furthermore, protein nitration is linked to AD disease
progression and is detected in mild cognitive impairment (MCI), early AD, and advanced stages of AD
[183-186]. The primary effects of protein nitration in AD are manifested in energy metabolism. For
example, glyceraldehyde 3-phosphate dehydrogenase and α-enolase, proteins involved in the glycolytic
pathway are nitrated [180, 187] leading to reduced enzymatic function [188] potentially limiting ATP
production [189]. Nitration of tau proteins has been observed in MCI and may influence the early onset
of AD [190]. Other pathways such as cytoskeletal integrity [191], pH buffering [192], mitochondrial
44
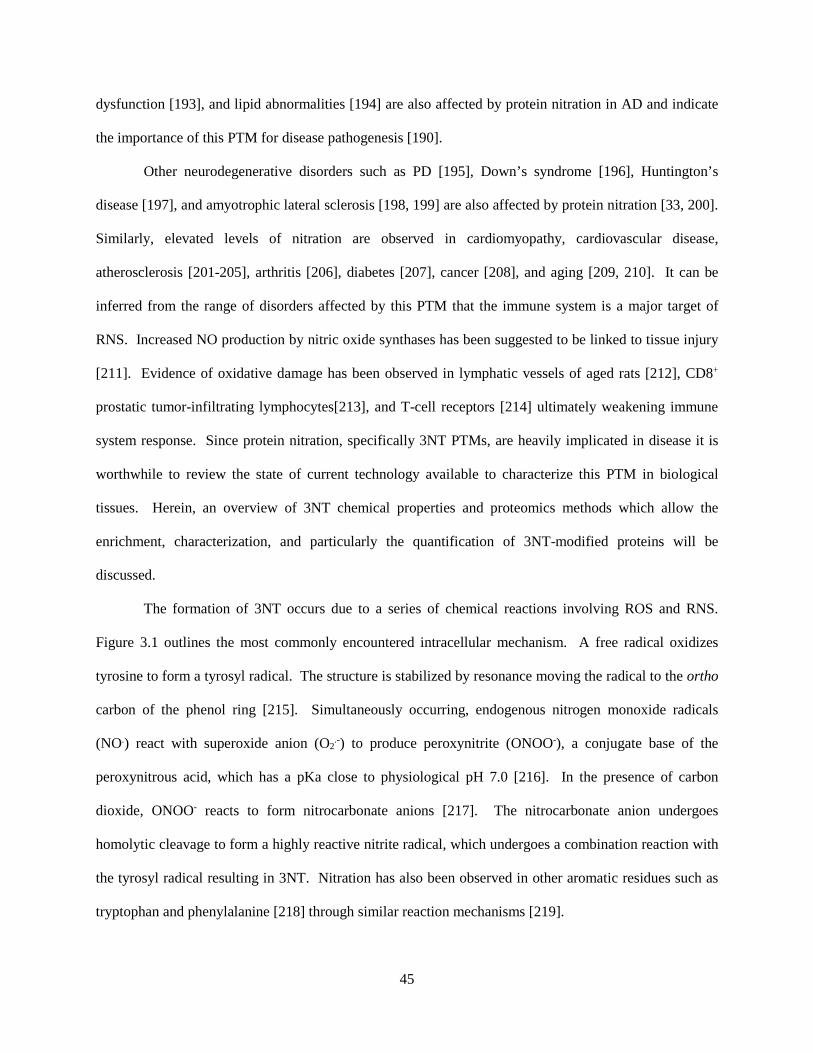
dysfunction [193], and lipid abnormalities [194] are also affected by protein nitration in AD and indicate
the importance of this PTM for disease pathogenesis [190].
Other neurodegenerative disorders such as PD [195], Down’s syndrome [196], Huntington’s
disease [197], and amyotrophic lateral sclerosis [198, 199] are also affected by protein nitration [33, 200].
Similarly, elevated levels of nitration are observed in cardiomyopathy, cardiovascular disease,
atherosclerosis [201-205], arthritis [206], diabetes [207], cancer [208], and aging [209, 210]. It can be
inferred from the range of disorders affected by this PTM that the immune system is a major target of
RNS. Increased NO production by nitric oxide synthases has been suggested to be linked to tissue injury
[211]. Evidence of oxidative damage has been observed in lymphatic vessels of aged rats [212], CD8+
prostatic tumor-infiltrating lymphocytes[213], and T-cell receptors [214] ultimately weakening immune
system response. Since protein nitration, specifically 3NT PTMs, are heavily implicated in disease it is
worthwhile to review the state of current technology available to characterize this PTM in biological
tissues. Herein, an overview of 3NT chemical properties and proteomics methods which allow the
enrichment, characterization, and particularly the quantification of 3NT-modified proteins will be
discussed.
The formation of 3NT occurs due to a series of chemical reactions involving ROS and RNS.
Figure 3.1 outlines the most commonly encountered intracellular mechanism. A free radical oxidizes
tyrosine to form a tyrosyl radical. The structure is stabilized by resonance moving the radical to the ortho
carbon of the phenol ring [215]. Simultaneously occurring, endogenous nitrogen monoxide radicals
(NO.) react with superoxide anion (O2.-) to produce peroxynitrite (ONOO-), a conjugate base of the
peroxynitrous acid, which has a pKa close to physiological pH 7.0 [216]. In the presence of carbon
dioxide, ONOO- reacts to form nitrocarbonate anions [217]. The nitrocarbonate anion undergoes
homolytic cleavage to form a highly reactive nitrite radical, which undergoes a combination reaction with
the tyrosyl radical resulting in 3NT. Nitration has also been observed in other aromatic residues such as
tryptophan and phenylalanine [218] through similar reaction mechanisms [219].
45
Figure 3.1. Chemical reactions describing the formation of 3-nitrotyrosine.
46

Aside from oxidative stress mechanisms, signaling pathways may rely on 3NT [218, 220].
Evidence of protein denitration in biological tissues has been observed suggesting that 3NT may be
initiated and controlled by ROS and RNS leading to redox signaling in cellular processes [221]. Though
tyrosine nitration is considered to be a stable PTM, and therefore a suitable marker for oxidative damage,
there has been increasing evidence of a redox signaling pathway involving protein nitration. 3NT has
been shown to interfere with kinase and phosphatase enzymes, which may have a regulatory effect on
tyrosine phosphorylation pathways [217]. In addition, Mn superoxide dismutase has reduced function
due to 3NT formation [222]. It has also been suggested that denitration may be selective to specific
substrates. This has been observed in Histone H1.2 and calmodulin as specific targets for protein
denitration [223]. Further research is currently underway in order to better understand the physiological
importance of a reversible nitration signaling system [224].
The addition of the nitro group to the tyrosine ring alters chemical properties of the amino acid.
The most notable change is the decreased pKa of the phenol group from 10.1 to 7.2 [225] or 6.8 [226].
This is a result of the nitro group on the phenol ring drawing electron density, which makes the phenol
proton more labile and tyrosine more acidic. The lower pKa increases the amount of deprotonated
nitrotyrosine molecules relative to tyrosine, which in addition to steric effects, can prevent
phosphorylation events altering cellular signaling processes[218]. Spectroscopic measurements can be
used to monitor the shift in pKa. For example, under acidic conditions the phenolic group of 3NT is
protonated allowing hydrogen bonding with an oxygen atom of the nitro group, which can be observed in
the 360 nm UV region. However, basic conditions which lead to deprotonation of the hydroxyl group and
elimination of this hydrogen bonding shift the absorbance to 430 nm [218]. It should be noted that the
absorbance changes of 3NT can allow monitoring of sample preparation procedures.
3.2. PROTEOMICS
Better insight to the effects of 3NT can be realized through the analysis of 3NT-modified
proteins. Proteomic analysis of 3NT can be classified as redox proteomics, which focus on oxidative
47

modifications. It is noteworthy that redox proteomic technologies have also been developed for the
detection of oxidized thiols [227], carbonylation [228], lipid peroxidation [229], and nitration amongst
others. Specialized proteomic approaches for the detection of low abundant PTMs have been developed
[230]. Chapter 1 introduced techniques and strategies used in bottom-up proteomic experiments for
protein identification and quantitation, which can also be applied to study 3NT presented below.
3.2.1. Enrichment
In vivo nitration of tyrosine residues are such that only five nitrated sites are detected per 10,000
tyrosine residues in inflammation conditions [217]. Because 3NT is a low abundance PTM, issues with
ion suppression and false-positive identification arise. A conservative set of guidelines have been
proposed to increase confidence in the identification of 3NT-modified proteins as follows: accurate
peptide charge state and mass, detection of the 3NT immonium ion fragment peak (m/z 181.1), validation
of 3NT peptide chromatographic retention (in comparison to unmodified peptide), and limitation of
unassigned fragment peaks [231]. These guidelines can be adopted by any laboratory. In the context of
biological tissues it can be challenging to identify 3NT-modified proteins, which has led to the
development of enrichment strategies [232]. The earliest enrichment approaches included the use of an
insoluble-antibody column specific to nitrated proteins [233] and immunoprecipitation [234]. Generally,
enrichment of 3NT-modified proteins can be performed through the use of antibodies (e.g., anti-3NT) or
alternatives such as chemical tags that target the nitro group.
Chemical tags rely on increasing the reactivity of 3NT through reduction reactions that generate
3-aminotyrosine (3AT) at the peptide level. This can be achieved with reducing reagents such as sodium
dithionite and dithiothreitol (DTT) in the presence of heme as shown in Figure 3.2. A chemical tagging
approach targeting 3AT offers the advantage of being gel-free and antibody-free. The significant pKa
difference between the aromatic amine (~4.7) and other primary amines on a peptide chain (~8-10) allow
for selective addition of chemical tags to 3AT. A plethora of these tags have been applied targeting 3AT
48

Figure 3.2. Reactions demonstrating the reduction of 3-nitrotyrosine to 3-aminotyrosine using sodium dithionite or dithiothreitol in the presence of heme.
49

including biotin/avidin interactions [235-237], nickel affinity chromatography [173], sulfhydryl
enrichment [238], and fluorinated carbon tags [239]. Signature fragment ions that locate the site of 3NT-
modifications can be generated with the use of dansyl chloride tags on the 3AT residue [240].
Fluorogenic derivatization of 3AT peptides with 1-(4(aminomethyl)phenylsulfonyl)pyrrolidine-3,4-diol
allows enrichment with boronate affinity chromatography and quantification with fluorescence
spectroscopy [241]. A summary of enrichment protocols for 3NT enrichment methods is presented [232].
An alternative enrichment method for 3NT-modified proteins, which is based on diagonal
chromatographic separations, was recently reported [242, 243]. Combined fractional diagonal
chromatography (COFRADIC) is a technique that recognizes the differences in hydrophilicity of 3NT-
and 3AT-modified peptides in reversed phase chromatography. Peptide samples are subject to a one-
dimensional reversed phase separation in which several off-line fractions are collected. Each fraction is
subsequently reduced so that the 3NT residues are converted to 3AT residues. Direct LC analysis of the
3AT-peptide samples results in a shift in retention time due to the hydrophilic nature of the peptides
relative to the original LC analysis of the 3NT-peptides. COFRADIC is designed to be a targeted
analysis of 3NT modifications by focusing only on peptides which shift in retention time. As this is not a
direct enrichment method, it does provide a straightforward means of identifying nitrated proteins in
complex mixtures. A major observation from the application of COFRADIC to Jurkat cell lines was the
detection of sulfated 3NT residues which arise due to a side reaction that occurs with the use of sodium
dithionite during the reduction step. Thus, database search parameters should include sulfation as an
additional dynamic modification of nitrated tyrosine residues.
3.3. QUANTITATIVE PROTEOMICS
3.3.1. Antibodies and Gel Electrophoresis-Based Methods
Enzyme-linked immunosorbent assay (ELISA) is a traditional method to quantify nitrated
proteins using anti-3NT antibodies [244]. ELISA assays have been applied to quantitate 3NT in human
plasma [245, 246], brain of traumatic injury patients [247], plasma from diabetic patients [248], and
50

plasma from smokers with chronic obstructive pulmonary disease [249]. Quantitation of protein bound
3NT has also been reported using ELISA analysis of human serum plasma [250] and can achieve a
detection limit of 20 nmol/L [251]. Challenges occur with ELISA quantification due to the limited
availability of highly specific antibodies [252] potentially resulting in underestimation of nitration levels.
Additionally, the nature (e.g., monoclonal, polyclonal) and source (e.g., vendor) of the antibody and
location of the 3NT modification can influence the recognition of 3NT-modified proteins [253].
Limitations with antibodies are not specific to 3NT or 3NT-based ELISA methods as will be discussed
below.
Redox proteomics approaches for high throughput 3NT detection were initiated through gel
electrophoresis-based measurements [254]. Figure 3.3 gives an overview of the gel-based approach.
Two-dimensional (2D) gel electrophoresis separates proteins in the first dimension separation according
to relative mobility (and hence MW) and by protein isoelectric point in the second dimension. For
comparative analyses, individual 2D gels are prepared for control and experimental samples. Detection of
protein spots can be achieved with fluorescence [7], chemiluminescence [255], or colorimetric assays
such as Coomassie blue and silver staining [9]. At this stage, only information about the total protein
abundance is obtained.
For targeted analysis of 3NT-modified proteins, the proteins in the gel are transferred to a
nitrocellulose or PVDF membrane such that the 2D blot can be probed with an anti-3NT antibody [256]
and scanned with an image reader. In this Western analysis, only protein bands which contain 3NT
should appear on the blot and be indicative of the relative concentration of the 3NT-modified protein.
Normalization is used to compare the 3NT signal from the blot to the total protein signal on the 2D gel
prior to comparisons between the control and experimental samples. The Western blot image serves to
locate the nitrated proteins and provide quantification, however does not provide identification of the
protein spot. Thus, the Western blot and 2D gel must be aligned, and the protein spots of interest are
excised, digested, and analyzed with MS. Examples of the application of this gel-based Western analysis
51

Figure 3.3. Schematic of general workflows for quantitative proteomic studies of nitrated proteins. Note that 3NT sites are identified by triangles.
52
include studies of undernourished rats [257], nitration levels of manganese superoxide dismutase in liver
[222], and cystic fibrosis in lung [258].
Gel-based approaches are very attractive because they are robust, allow detection of thousands of
protein spots, and can be targeted for specific PTMs such as 3NT. However, there are some challenges
with this approach, which require further development. For example, sample preparation steps which
incorporate DTT can cause reduction of 3NT-modified proteins (to 3AT) in the presence of heme found
in many biological samples [259]. This contributes to underestimation of nitrated protein levels. Site-
specific information about the location of the 3NT modification can only be obtained through MS
detection of the excised spot [253], however MS analysis of peptides often miss the nitrated peptides. In
addition, protein solubility of 3NT-modified proteins in gel-based buffers may not be complete providing
limited abundance or no abundance information [253, 260]. Finally, antibody specificity as noted above
and high background signals from antibodies in the blots can mask low level nitrated proteins [261].
3.3.2. Label-Free Methods
Label-free methods of quantification in proteomics, as implied, do not use chemical tags.
Quantification is achieved through protein abundance index [68], MS/MS spectral counts [262] or
extracted ion intensity (based on peak heights or areas) [65, 263] after LC-MS/MS analyses as shown in
Figure 3.3. These methods are advantageous because they are simple, inexpensive, and require minimal
sample preparation in comparison to chemical tagging approaches. Additionally, it is possible to analyze
an unlimited number of samples with label-free methods. However, with each additional sample the
overall throughput of the approach is lessened thus making multiplexing approaches attractive.
The native reference peptide method is capable of quantifying 3NT by comparing the peak area
of nitrated peptides to a selected peptide present in the mixture [264]. Ideal characteristics concerning the
choice of the reference peptide have been previously described [265]. Briefly, the peptide must be
inherent in the digest mixture, contain no potentially modifiable residues, have high digestion efficiency,
and have similar chromatographic retention times and detector responses to the 3NT peptide of interest.
53

Overall these characteristics result in an internal peptide standard that is inherent in the original digest.
Native reference peptides selected from in vitro nitrated albumin resulted in a 10% relative standard
deviation and femtomole detection limit of nitrated peptides [265].
Stable isotope dilution, which relies on spiking known concentrations of heavy isotope 3NT into
a hydrolyzed protein sample (i.e., a mixture of free amino acids), can provide absolute quantitative
information. Selected ion monitoring (SIM) of heavy isotope peaks using a triple quadrupole MS
produce detection limits of 3NT as low as five pg in reported nitration studies of human urine [266].
While this method gives insight to the global levels of 3NT in the mixture it lacks site- and protein-
specific detail, which is important for complete characterization of 3NT-modified proteins.
Nitrated peptides upon gas-phase fragmentation result in a peak at m/z 181.1 which is the
immonium ion of nitrotyrosine [195]. Selected (SRM) or multiple reaction monitoring (MRM) allows
selective detection of fragments from nitrated peptides by scanning the Q3 of a triple quadrupole MS in a
collision induced dissociation experiment. Peak areas from the signature fragments are compared to that
from reference peptides and are indicative of the relative concentrations of the 3NT-modified peptides
and hence proteins. Using MRM, levels of 3NT-modified peptides from α-synuclein have been
characterized in PD [195]. SRM analyses have also revealed eleven 3NT sites in human hemoglobin
obtained from cigarette smokers suggesting that in vivo ONOO- levels are higher in smokers [267].
3.3.3. Precursor Labeling
Complementary or alternative MS-based methods to gel-based approaches have been developed
in the last two decades and are attractive due to multiplexing capabilities [1]. Sample multiplexing with
bottom-up proteomic methods can be achieved with precursor or isobaric tags at the MS [67] and MS/MS
spectral levels. Chapter 1 reviewed precursor quantitation strategies in bottom-up proteomics. To
briefly highlight, 3NT-modified proteins can be digested to peptides (e.g., 3NT modified and unmodified)
using trypsin. Primary amine groups found in lysine, N-termini, or 3AT residues can be manipulated to
incorporate chemical groups using acetylation [268] or dimethylation [74] that can contain stable isotopes
54

(e.g., 2H and 13C). Depending on the nature of the chemical tag and heavy isotope incorporation, a total
of two to three samples can be pooled and simultaneously measured in the LC-MS/MS experiment. As
illustrated in Figure 3.3, the peptide peaks from light and heavy labeled samples elute from the LC
column simultaneously and are detected in the mass spectrometer. This assumes that electrospray
ionization of the peptides is similar and will not influence the final signal measured. Therefore the peaks
are shifted in mass by the number of heavy isotopes incorporated into the tag and the intensities or areas
of the peptide peaks can be used for relative quantification.
Due to the reactivity of both primary amine groups in peptides and reduced 3NT to 3AT groups,
it becomes necessary to block primary amine chemistry on peptides in order to track the location of
modified residues. Generally, precursor labeling uses the following major steps to make quantitative
tagging selective for 3NT sites: 1) digest proteins to peptides, 2) block primary amines with acetyl (or
other) groups, 3) reduce 3NT to 3AT, and 4) derivatize 3AT with a light or heavy isotope chemical tag.
Figure 3.4a highlights the incorporation of a light or heavy (e.g., 2H3) 1-(6-methylnicotinoyloxy)
succinimide reagent to 3AT residues [269]. The structure of this reagent contains a pyridine ring with a
methyl group in the para position that has hydrogen atoms which can be exchanged for deuterium. A
mass shift of 3 Da would result for every peptide containing a 3NT modification. Additionally, since
peptides are capped with either a light or heavy acetyl group at Step 2, a global shift of 3 Da per acetyl
group is observed for all peptides and an additional 3 Da is observed per 3NT modification. Interestingly,
the use of this nicotinoyloxy based reagent results in higher ionization efficiencies for peptides generated
with matrix assisted laser desorption ionization (MALDI) and prevents photodecomposition with the laser
[269, 270].
Derivatization of 3AT can also be performed using light or heavy (-2H5) phenylisothiocyanate
depicted in Figure 3.4b [271]. The structure of the tag contains heavy atoms which are incorporated in
the phenyl ring generating a mass shift of 5 Da and a reactive thiocyanate group to selectively target 3AT.
The mechanism involves an intermolecular cyclization between the sulfur atom of thiourea and the
55

Figure 3.4. Example precursor quantification tags: a) 1-(6-methylnicotinoyloxy) succinimide and b) phenylisothiocyanate which incorporate mass shifts of 3 and 5 Da, respectively.
56

hydroxyl group of tyrosine, which is the first reported transformation in aqueous media using
photocatalysis. Due to the addition of deuterium atoms, the hydrophilic shift which can occur due to
kinetic isotope effects [272] was evaluated and its effects are negligible. For quantification purposes, this
tag demonstrates precursor quantification capabilities and the potential use of signature fragments (m/z
116 and 121 for light and heavy tags, respectively) in SRM or MRM experiments. The presence of the
signature fragment peaks also confirms 3NT-modification sites as the fragments are unique to the
phenylisothiocyanate tag.
3.3.4. Isobaric Tags
A secondary approach to multiplexing techniques is the use of commercially available isobaric
tags (Figure 3.3). The most commonly used isobaric tags are tandem mass tags (TMT) [273] and the
isobaric tag for relative and absolute quantification (iTRAQ) [274], which can multiplex six or eight
samples, respectively. To briefly summarize Chapter 1, isobaric tags incorporate heavy isotopes of 13C,
15N, and 18O such that the overall mass of the tags are similar, however, upon gas-phase fragmentation
specific low m/z reporter ions (e.g., 126-131 for TMT) are generated. The reporter ion signals can be
related to the relative abundances of the peptides from which they were cleaved. Because relative
quantification occurs in MS/MS spectra, increased precursor MS complexity is avoided. Advantages and
disadvantages of isobaric tagging methods are reviewed [88], as well as improvements to instrumental
analysis to obtain accurate reporter ion ratios [89, 94]. These methods should be included for future
quantitation experiments using isobaric tags including the analysis of 3NT-modified proteins.
Few reports of isobaric tagging applications for 3NT modifications are reported. Quantification
of nitrated peptides with isobaric tags was first demonstrated by Chiappetta et. al. using mixtures of
nitrated bovine serum albumin (BSA) and bovine milk proteins [275]. After acetylation, 3AT BSA
peptides were tagged with iTRAQ reagents and analyzed with precursor ion scanning using a triple
quadrupole MS. The presence of iTRAQ fragment immonium ions at m/z 292.1 proved advantageous for
confirming modification sites of low abundant nitrated peptides. Additionally, this approach does not
57

require time consuming sample fractionation steps and provided accurate reporter ion quantification.
Chapter 4 introduces the novel quantitative approach termed “Combined Precursor Isotopic Labeling and
Isobaric Tagging (cPILOT)”, which selectively quantifys nitrated peptides and expands the quantification
capacity of isobaric tags to either 12 or 16 for TMT and iTRAQ, respectively [98].
3.4. CONCLUSIONS AND FUTURE OUTLOOK
Obtaining quantitative information for 3NT allows a better understanding of the role this PTM
plays in biological systems. 3NT has been linked to neurodegenerative disorders, cancer, and
cardiovascular disease and has been shown to impact protein function and potentially redox cellular
signaling pathways. With the advent of proteomics for PTM investigation, there have been a number of
reports focusing on qualitative information of 3NT-modified proteins obtained through targeted analyses
or enrichment methods. There are fewer reports that address quantification of 3NT-modified proteins in
complex mixtures. Perhaps this is partially attributable to the low abundance of this PTM in biological
samples, which leads to the need for highly selective and sensitive analytical techniques. As a result,
enrichment approaches, which rely on antibodies or other chemical tagging strategies, must continue to be
developed to allow targeted analyses of nitrated proteins in complex biological samples. A number of
these methods currently exist, however limitations in antibody selection including nonspecific binding
have prevented their widespread ability to identify large numbers of nitrated proteins. Gel-based redox
proteomics methods offer targeted identification and relative quantification of nitrated proteins using 2D
Western Analysis, but also have similar issues that arise from antibody use such as high background
signals and nonspecific binding of non-nitrated proteins. Furthermore, peptide loss during excision and
digestion processes often limits the MS detection of nitrated peptides preventing 3NT site-specific
information.
Currently, most of the approaches available have yet to provide large-scale identification and
quantification of nitrated proteins in biological samples since a large percentage of total peptides detected
58

in these experiments contain no site of nitration. This is notably a result of the challenges associated with
the low abundance of this modification, sample loss during lengthy derivatization steps using chemical
tags, and the complexity of samples of interest. Guidelines that help to strengthen the confidence in
identification of nitrated peptides and proteins from MS data should also be adapted by many of these
groups. Due to the importance of 3NT in numerous diseases, this research area will continue to be of
great interest such that improved proteomics methods are desirable.
59
4.0 ENHANCED SAMPLE MMULTIPLEXING FOR NITROTYROSINE-MODIFIED
PROTEINS USING COMBINED PRECURSOR ISOTOPIC LABELING AND ISOBARIC
TAGGING *
(*Reprinted with permission from Robinson, R. A. S, Evans, A. R. Analytical Chemistry. 2012.
84. 4677-4686. Copyright 2014. American Chemical Society.) [98]
4.1. INTRODUCTION
Chapter 3 introduces the biological significance and previous proteomic techniques to quantitate
3NT. Briefly, gel electrophoresis with Western blot detection is commonly used to identify and quantify
3NT proteins, however relies on mass spectrometry (MS) for sequence identification. Matrix-assisted
laser desorption ionization (MALDI)-MS [276, 277], electrospray ionization (ESI) tandem mass
spectrometry (MS/MS) [278, 279], and liquid chromatography (LC) coupled with MS/MS have also been
employed to identify nitrated residues in tryptic peptides [264, 280, 281]. Precursor [269] [282] and
isobaric tagging [275] methods have been employed to quantify 3NT. The isobaric tag for relative and
absolute quantitation (iTRAQ) was used to tag 3AT peptides after the blocking of N-termini and lysine
residues with an acetyl group. In this approach, no enrichment is carried out however, 3NT-modified
peptides are easily identified by performing precursor ion scanning for specific iTRAQ containing ions.
Although it was only partially demonstrated, this approach can quantify up to a total of eight samples
using the iTRAQ 8-plex reagent kit.
Chapter 4 presents an approach that increases the multiplexing capability of quantitative
proteomics to assess differences in the relative abundances of 3NT-modified proteins. Through combined
precursor isotopic labeling and isobaric tagging (cPILOT), we have developed a novel strategy that uses
commercially available tandem mass tags (TMT) and iTRAQ reagents in order to increase the number of
60

samples that can be compared in a single analysis to 12 and 16, respectively. Additionally, the presence
of reporter ions in the mass spectra can be used to identify nitrated peptides and help to eliminate false
positive identifications that can arise from shotgun proteomics experiments [283]. cPILOT builds upon
currently used quantitative proteomics strategies presented in Chapter 1 [73, 275]. Herein, proof-of-
principle cPILOT experiments are presented using simple mixtures of in vitro nitrated bovine serum
albumin (BSA) and mouse splenic protein digests, which are analyzed using nanoflow LC-MS/MS
coupled with an LTQ-Orbitrap Velos MS.
4.2. EXPERIMENTAL
4.2.1. In Vitro Nitration of BSA
One milligram of BSA (Sigma Aldrich; St. Louis, MO) was dissolved in 500 μL of phosphate
buffer saline (PBS) and a 50 μL aliquot of ~40 mM ONOO- (Millipore; Billerica, MA) was added to the
solution. The sample was incubated at room temperature for 30 minutes under constant stirring (hereafter
referred to as 3NT-BSA). The reaction was quenched by flash freezing in liquid nitrogen. A control BSA
sample was treated in the same manner with the exception of the addition of ONOO- to the buffer
solution. Samples were stored at -80 °C until further use.
4.2.2. Spleen Homogenization
Mouse spleen tissue was homogenized in an ice-cold phosphate buffer saline (PBS) solution
containing 8 M urea with 100 passes of a Wheaton homogenizer. Homogenate solution was collected,
sonicated, and centrifuged at 13000 RPM for 10 minutes (4 °C). Supernatants were collected and protein
concentrations determined using the BCA assay according to the manufacturer’s instructions (Pierce
Thermo; Rockford, IL). Samples were stored at -80 °C until further use.
61
4.2.3. Immunochemical Measurement of 3NT-BSA Level
Control and 3NT-BSA samples (5 µL) were incubated at room temperature for 20 min with 5 µL
of SDS (12% v/v) and 10 µL of Laemmli buffer [0.125 M Tryzma base, pH 6.8, SDS (4% v/v), and
glycerol (20% v/v)]. Samples (250 ng) were blotted onto a nitrocellulose membrane and blocked with
BSA (3% w/v) in a PBS solution containing 0.04% (v/v) Tween-20, and 0.10 M NaCl (hereafter referred
to as Wash blot). A 1:2000 dilution of rabbit polyclonal anti-3NT primary antibody (Sigma-Aldrich) was
added and the blot incubated for 3 hours on a rocker. The blot was rinsed for 5 min in Wash Blot three
times and subsequently incubated with a 1:8000 dilution of anti-rabbit IgG alkaline phosphatase
secondary antibody (Sigma-Aldrich) in Wash blot for 1 h at room temperature on a rocker. The
membrane was washed as described above and developed using a solution of 0.2 mM nitrotetrazolium
blue chloride and 0.4 mM 5-bromo-4-chloro-3-indolyl phosphate dipotassium in an alkaline phosphatase
buffer (0.1 M Tris, 0.1 M NaCl, 5 mM MgCl2; pH 9.5). The dried blot was scanned on a Canon scanner
and saved as a .TIF image.
4.2.4. BSA Trypsin Digestion
Desired amounts of samples were subject to trypsin digestion as follows. 0.25 M DTT (Thermo
Fisher; Pittsburgh, PA) was added in a 1:40 protein:reagent mole excess and incubated at 37°C for 2
hours. 0.25 M iodoacetamide (Acros Organics; Morris Plains, NJ) was added in a 1:80 protein:reagent
mole excess at 0°C for two hours in the dark followed by the addition of 1:40 protein:reagent mole excess
L-cysteine at room temperature for 30 minutes. Tris buffer (0.2M tris, 10mM CaCl2, pH 8.0) was added
to the mixture until final volume was four times the original volume. TPCK-treated trypsin (Sigma
Aldrich) was added to each sample at 2% w:w enzyme:protein and incubated at 37°C for 24 hours.
Samples were flash frozen with liquid nitrogen and stored at -80 °C until further use.
62

4.2.5. Synthesis of N-acetoxy-H3-succinimide and N-acetoxy-2H3-succinimide
The procedure for synthesis of N-acetoxy-H3-succinimide and N-acetoxy-2H3-succinimide is
described elsewhere[73, 146]. Briefly, 1.9478 g of N-hydroxysuccinimide (NHS, Sigma Aldrich) was
added to 4.8mL of >99% acetic anhydride (Sigma Aldrich) or 1.9451 g of NHS was added to 4.4 mL of
99% 2H6-acetic anhydride (Sigma Aldrich). Reactions occurred at room temperature under nitrogen with
constant stir for 15 hours. White crystals were collected, washed thoroughly with hexane, and allowed to
dry under vacuum. Product yield was 1.9909 g and 1.5085 g for N-acetoxy-H3-succinimide and N-
acetoxy-2H3-succinimide, respectively. Nuclear magnetic resonance (NMR) analysis confirmed the
formation of the appropriate succinimide ester (>95% purity).
4.2.6. 3NT Reduction and Isobaric Tagging of Peptides
For experiments using the TMT0 reagent, 50 µg of the light and heavy labeled 3AT-BSA peptides
were pooled into a single mixture. To this sample (100 µg), one vial of TMT0 dissolved in anhydrous
acetonitrile, was added directly to the sample according to manufacturer’s instructions (Thermo
Scientific). Reactions incubated at room temperature under constant stirring for one hour. Excess
hydroxylamine hydrochloride (Sigma Aldrich) was used to quench the reaction. For experiments using
the TMT 6-plex reagents (hereafter referred to as TMT6), light and heavy labeled 3AT-BSA peptide
samples were split into six mixtures each. Samples were reacted with the appropriate TMT6 reagent
according to manufacturer’s instructions. Next, portions of the light and heavy labeled TMT6 derivatized
samples were mixed into a new sample tube to generate the desired mass ratios for reporter ions
(discussed below). Overall, the total mass of light and heavy labeled peptides was equal after pooling.
For experiments using the iTRAQ 8-plex reagents (hereafter referred to as iTRAQ8), light and heavy
labeled peptide samples (100 µg) were each split into two equal aliquots. The appropriate iTRAQ8
reagent was dissolved in 70 µL of ethanol and directly added to the light or heavy labeled peptide
samples. Reactions incubated at room temperature under constant stirring for one hour. Light and heavy
63

labeled peptide samples were then pooled into a single mixture to generate the desired iTRAQ8 reagent
ratios (discussed below). Finally, samples were cleaned using Waters Oasis HLB C18 cartridges and dried
using a speedy-vac.
4.2.7. LC-MS/MS
Samples were reconstituted in a water solution with 0.1% formic acid (1 μg⋅μL-1) and separated
on a nanoflow Eksigent 2D LC system. Buffer A was composed of 97:3 H2O:Acetonitrile (ACN) with
0.1% formic acid. Buffer B was composed of ACN with 0.1% formic acid. Samples were injected onto a
trapping column (100 µm i.d. × 2 cm) packed with 200 Å C18 material (Michrom Bioresources Inc.;
Auburn, CA) using an autosampler. After a short wash, samples were eluted to a pulled-tip analytical
column (75 µm i.d. × 13.2 cm) packed with 100 Å C18 material (Michrom Bioresources Inc.). Gradient
elution was performed as follows (% buffer A:% buffer B): 90:10 for 10 minutes, ramp to 70:30 over 90
minutes, ramp to 40:60 over 30 minutes, ramp to 20:80 over 5 minutes, hold for 10 minutes, followed by
column equilibration. Eluted peptides were ionized using the nanospray source (~1.7 kV) of an LTQ-
Orbitrap Velos MS. The MS was operated using data-dependent acquisition with the following
parameters: full FT parent scans at 60,000 resolution over the m/z range 300-1600, top seven most
intense ions were selected for CID (isolation width 3 m/z, 35% normalized collision energy) and HCD (10
ms activation time, isolation width 3 m/z, 45% normalized collision energy). CID- and HCD-MS/MS
spectra were recorded in the LTQ and Orbitrap (7500 resolution), respectively.
4.2.8. Database Searching and Data Analysis
RAW data files were searched against the BSA sequence (Swiss Prot Entry: P02769) or mouse
International Protein Index Database with SEQUEST in Proteome Discoverer 1.2 (Thermo Scientific).
Database searching parameters include: precursor mass tolerance of 15 ppm, fragment mass tolerance of
1.0 Da, static modification of carbamidomethylation to cysteine, dynamic modifications of light and
64

heavy acetyl groups at the N-terminus and lysine residues, methionine oxidation, and special modification
for TMT or iTRAQ derivatized 3AT residues. Masses for these modifications were 239.163 Da (TMT0),
244.174 Da (TMT6), and 319.216 Da (iTRAQ8). False discovery rates of p<0.05 and p<0.01 were set
using decoy database searching such that only medium and high confidence peptides, respectively, were
used for analyses. Intensity and area information for light and heavy labeled peptides were provided in the
software output (.msf file). Manual calculation of relative reporter ion peak intensity (or peak area) ratios
was performed due to limitations in the software output for this cPILOT strategy.
4.3. RESULTS AND DISCUSSION
4.3.1. Combined Precursor Isotopic Labeling and Isobaric Tagging (cPILOT)
Herein we present the novel approach cPILOT, which combines isotopic labeling with isobaric
tagging strategies such as TMT and iTRAQ in order to extend the number of 3NT-modified samples that
can be multiplexed in a single experiment to 12 and 16, respectively. The strategy consists of three
primary steps as shown in Figure 4.1: acetylation of primary amine groups, reduction of 3NT groups to
3AT, and isobaric tagging (using TMT or iTRAQ) of 3AT groups. Nitrated tryptic peptides are initially
reacted with N-acetoxy-H3-succinimide ester or isotopically labeled N-acetoxy-2H3-succinimide ester in
order to acetylate primary amine groups (i.e., N-termini and lysine residues) with an isotopically light (-
H3) or heavy (-2H3) label, respectively. The second step involves the use of sodium dithionite to reduce
3NT to 3AT. The third major step uses commercially available TMT reagents (Figure 4.1) or the iTRAQ
reagent to react with 3AT according to manufacturer’s instructions. Finally, the derivatized samples are
mixed in a 1:1 light:heavy ratio and analyzed by LC-MS/MS. We reduce sample loss of low abundance
3NT-modified peptides by performing a single clean-up step, which occurs after isobaric tagging.
65

Figure 4.1. Schematic representation of the chemical derivatization steps performed in the cPILOT strategy.
66

4.3.2. Validation of In Vitro Nitration and Isotopic Acetylation of BSA
Immunochemistry and LC-MS/MS experiments were initially performed in order to confirm
nitration and acetylation of BSA. BSA 3NT-modification sites have been well-characterized using
various enrichment methods [173, 242, 275, 284-286]. In total, BSA has 21 Tyr residues (Swiss Prot
Entry: P02769) that could potentially be nitrated. Figure 4.2a shows an immunoblot with a dark band
corresponding to the 3NT-BSA sample. Under similar reaction conditions, without the presence of
ONOO-, BSA control samples showed no immunoreactivity verifying the generation of in vitro nitrated
BSA. Validation of the first step of cPILOT was tested by tryptically digesting and acetylating (light
label) 3NT-BSA followed by LC-MS/MS analysis on an LTQ-Orbitrap Velos MS. Nitrated peptides
should be shifted in mass according to the number of added acetyl (42.011 Da) and nitro (44.985) groups.
Figure 4.2b shows an example MS/MS spectrum obtained upon fragmentation of a peak with a precursor
m/z 783.897. Based on the b- and y-type fragment ions detected in the CID MS/MS analysis, the peptide
has been assigned as [L(Acetyl)GEY(NO2)GFQNALIVR+2H]2+. The acetylation of the N-terminus was
observed in this spectrum as well the y9/y10 and b3/b4 singly charged fragment ions locating the position of
nitration to Tyr424. The Δm of 208 Da corresponds to the mass shift of a nitrated tyrosine residue.
Overall in these experiments, we observed nitration of 15 Tyr residues in which MS/MS spectra were
manually validated. The location of the 3NT-modification sites are as follows: Tyr54, Tyr108, Tyr161,
Tyr163, Tyr171, Tyr173, Tyr179, Tyr180, Tyr355, Tyr357, Tyr364, Tyr376, Tyr424, Tyr475, and
Tyr520.
67

Figure 4.2. Validation of in vitro nitration. a) Immunochemical blot of BSA incubated with buffer (control) and ONOO- after probing with primary anti-3NT antibody. b) Example MS/MS spectrum obtained for a doubly-charged peak at tr 101.47 min with m/z 783.897 that has been assigned as [L(Acetyl)GEY(NO2)GFQNALIVR+2H]2+. The corresponding CID generated b- and y-type fragment ions are labeled in the spectrum.
68

4.3.3. 3AT-BSA Isotopic Labeling & TMT0
Having validated the presence of nitration and acetylation, 3NT-BSA samples were reduced to
3AT-BSA, split into two equal aliquots, and isotopically labeled with either a light or heavy acetyl group.
Acetylated 3AT-BSA samples were derivatized with the TMT0 reagent that generates reporter ion m/z 126
and pooled in a 1:1 ratio light:heavy mixture. Figure 4.3a shows an example pair of doubly-charged
peaks at m/z 913.402 and 916.421 that have a total mass shift of 6 Da. This mass shift indicates the
presence of two acetylations to the peptide. Upon independent CID-MS/MS of the light and heavy
precursor peaks (Figure 4.3b), this pair has been identified as the peptide [E(Acetyl)Y(NH-
TMT0)EATLEEccAK(Acetyl)+2H]2+. This tryptic peptide has been modified with both N-terminal and
Lys acetyl groups, carbamidomethyl groups to Cys, and the addition of the TMT0 reagent to Tyr376.
Confirmation of the TMT derivatization can be determined by the presence of the reporter ion m/z 126.13
in the HCD spectra (low m/z range shown) for both the light and heavy labeled precursor ions (Figure
4.3c).
It should be noted that fragmentation of acetylated tryptic peptides generates an immonium ion at
m/z 143.12, which upon loss of NH3 produces a fragment peak at m/z 126.09 [287]. This immonium ion -
NH3 fragment can be detected in the HCD-MS/MS spectrum of the light precursor peak, however at R =
7500 it is resolved from the TMT0 reporter ion m/z 126.13 in the Orbitrap MS. For lower resolution MS,
it will be difficult to discern the contribution of relative peak intensity that is derived from acetylated
immonium ions -NH3 and TMT reporter ions. This is not the case for the heavy precursor ions, in which
the immonium ion -NH3 is shifted by 3 Da. For example, in the HCD-MS/MS spectrum shown in the
upper right of Figure 4.3c, the immonium ion -NH3 occurs at m/z 129.11. For TMT6 reagents, in which
reporter ions are generated at m/z 126-131, lower resolution MS will not be able to distinguish immonium
ion vs. reporter ion signal generated at m/z 126 and 129. Therefore, these reporters would have to be
avoided in low resolution instruments especially for analysis of more complex mixtures in which the
relative abundances across samples would not be known a priori. Another approach is to use iTRAQ
69

Figure 4.3. Demonstration of chemical derivatization using TMT0 reagents. a) Integrated parent mass spectrum at tr 54.00-54.45 minutes across the m/z range 912-920 in which a doubly-charged isotopic pair is observed at m/z 913.402 and 916.421 for the light and heavy labeled peptide, respectively. b) An overlay of the MS/MS spectra obtained after CID of the light and heavy labeled peaks shown in a). It should be noted that each peptide peak was isolated individually. The MS/MS spectra from the light and the heavy labeled peptides have been superimposed in this spectrum. The b- and y-type fragment ions (as labeled in the plot) have led to the peptide assignment of [E(Acetyl)Y(NH-TMT0)EATLEEccAK(Acetyl)+2H]2+. The lowercase letter “c” in the peptide sequence corresponds to carbamidomethylated cysteine. c) Zoomed-in low m/z region of the HCD spectra shown in light (left) and heavy (right) labeled peptide peaks, respectively.
70
reagents in which reporter ions occur at lower m/z values (i.e., 113-121); this approach is presented
below.
4.3.4. Twelve Sample Multiplexing with TMT6 Reagents
Isobaric tagging strategies have an inherent cost, which is augmented with the desired sample
multiplexing capability for an experiment. This makes analyses expensive for projects involving a large
N, use of technical and/or biological replicates, and experimental validation (e.g., forward and reverse
tagging). Herein, we demonstrate how cPILOT can be employed in order to maximize the cost of
isobaric tagging strategies for a single experiment that involves the identification of nitrated peptides.
Figure 4.4a shows a precursor ion MS spectrum obtained for a pair of peaks in 3AT-BSA whereby light
and heavy acetylated peptides were derivatized with the TMT6 reagents (reporter ions m/z 126-131). The
particular peptide pair shown at m/z 488.282 and 489.792 has been assigned to [A(Acetyl)W(NH-
TMT6)SVAR+2H]2+. The corresponding mass shift of 3 Da confirms the presence of only one acetyl
group which has been detected on the N-terminus. Additionally, this peptide contains a Trp residue that
was nitrated in vitro as validated by the mass shift corresponding to the TMT6 reagent in CID- and HCD-
MS/MS spectra (data not shown).
In order to assess the ability of this approach to measure quantitative differences across multiple
samples, we prepared a 3NT-BSA sample and split into twelve equal aliquots whereby six aliquots were
acetylated with the light label and an additional six aliquots were acetylated with the heavy label. Each
sample was then derivatized with a particular TMT6 reagent and samples were pooled to generate the
following mass ratios. For aliquots containing 3AT light acetylation and TMT6 tagged peptides, the six
aliquots were mixed in a 1:50:10:1:2:0.5 ratio corresponding to reporter ions m/z
126:127:128:129:130:131. The six aliquots containing 3AT heavy acetylation and TMT6 tagged peptides
were mixed in a 1:0.5:2:1:10:50 ratio corresponding to reporter ions m/z 126:127:128:129:130:131.
Overall, the total mass ratios of the derivatized light labeled:heavy labeled tryptic peptides was 1:1. This
is reflected in the precursor peaks measured in the parent MS (Figure 4.4a). Figures 4.4b and 4.4c show
71
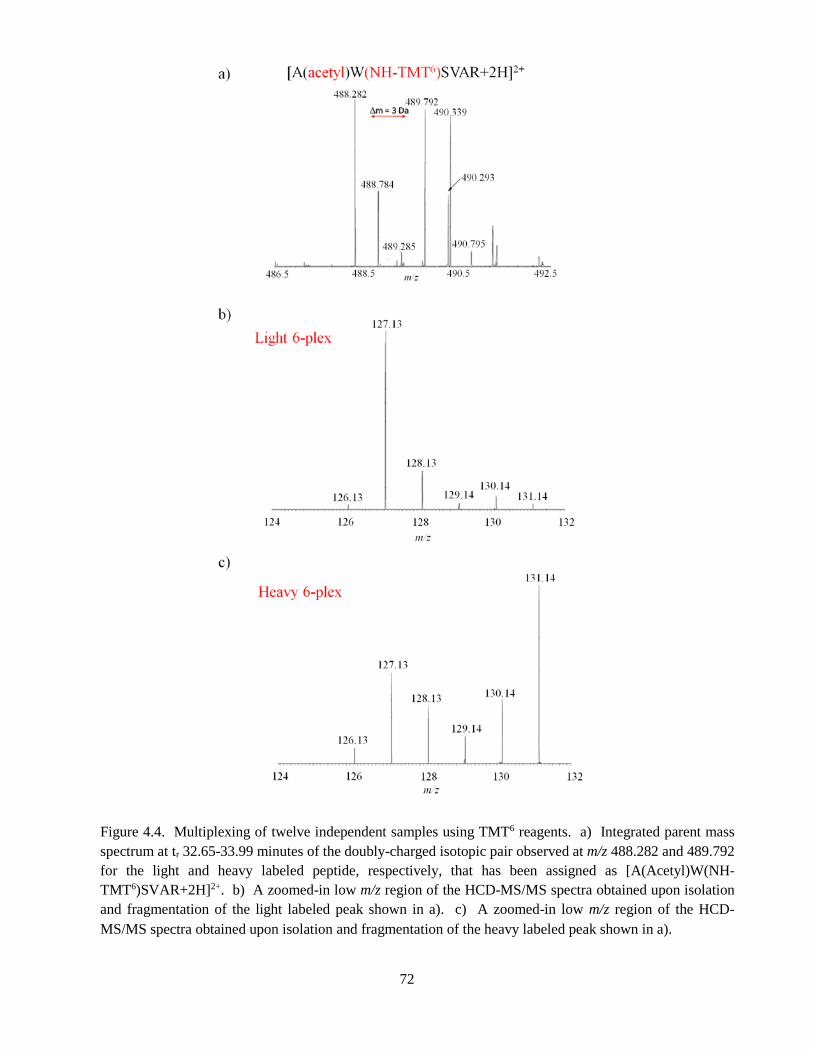
Figure 4.4. Multiplexing of twelve independent samples using TMT6 reagents. a) Integrated parent mass spectrum at tr 32.65-33.99 minutes of the doubly-charged isotopic pair observed at m/z 488.282 and 489.792 for the light and heavy labeled peptide, respectively, that has been assigned as [A(Acetyl)W(NH-TMT6)SVAR+2H]2+. b) A zoomed-in low m/z region of the HCD-MS/MS spectra obtained upon isolation and fragmentation of the light labeled peak shown in a). c) A zoomed-in low m/z region of the HCD-MS/MS spectra obtained upon isolation and fragmentation of the heavy labeled peak shown in a).
72

the presence of each of the TMT6 reagents for the light and heavy labeled precursor ions, respectively.
The observed relative abundance ratios for the light precursor peak (Figure 4.4b) according to peak areas
are 1.0:38:8.5:1.2:2.9:1.2 and the ratios for the heavy precursor peak (Figure 4.4c) are
1.0:5.6:3.6:1.7:4.0:11. The correlation in measured versus expected reporter ion ratios is linear for both
the light (R2=0.9991) and heavy (R2=0.7956) precursor ions. However, the measured reporter ion ratios
are compressed in some cases and overestimated in others deviating from expected reporter ion ratios
from sample preparation. While some error in quantitation can be related to errors during sample
preparation, upon closer inspection of the precursor and CID-MS/MS and HCD-MS/MS spectra, we
attribute the inaccuracy in measured reporter ion ratios to overlap of the isotopically labeled precursor
ions that occurs during isolation in the LTQ. The [A(Acetyl)W(NH-TMT6)SVAR+2H]2+ peptide shown
in Figure 4.4 is doubly charged and contains a single label; thus precursor ions are shifted in mass by 1.5
m/z. The isolation window used in these studies was 3.0 m/z (±1.5 m/z). Therefore, it is highly possible
that ions from the heavy labeled precursor m/z were isolated with the light labeled precursor m/z and vice
versa. Isolation of both precursor ions in one MS scan event would cause an overlap in the ion signal for
each of the reporter ions and hence inaccuracies in the measured relative abundances. This is consistent
with the compressed and overestimated reporter ion ratios that were detected in the [A(Acetyl)W(NH-
TMT6)SVAR+2H]2+ and other peptides detected in this dataset. Similar issues with underestimation of
reporter ion abundance ratios have been previously discussed [288, 289]. Solutions to reduce quantitation
errors might involve the use of proton transfer reactions to charge reduce precursor ions [89, 290] or the
use of different isotopically labeled reagents (e.g., dimethylation) that will increase the mass shift
between light and heavy labeled precursors in the parent mass scan [94]. Overall, this is the first
demonstration of a quantitative proteomics approach that couples precursor isotopic labeling with isobaric
tagging to enhance sample multiplexing capabilities for 3NT-modified peptides. Roughly speaking, the
relative abundances for the cPILOT 12-plex study presented above are reflective of the expected
abundances based on sample pooling for most of the reporter ions. The ability to distinguish immonium
ions is indicated in these spectra (Figures 4.4b and 4.4c) by the two resolved peaks at m/z 126.09 and
73
129.10 in both HCD-MS/MS spectra. Based on experimental design, cPILOT offers inter- and intra-
sample quantification. For example, cPILOT could be employed to control (light) vs. diseased (heavy)
samples whereby information regarding the relative change in abundance across multiple N could be
assessed at the level of precursor ion signal (i.e., average of all control or disease biological replicates)
and intra-sample variation can be assessed at the level of reporter ion signal.
4.3.5. 3AT-BSA Isotopic Labeling & iTRAQ
Figure 4.5 shows the extension of cPILOT to iTRAQ multiplex reagents. The doubly charged
peptide pair at m/z 949.380 and 952.399 shifted in mass by 6 Da (Figure 4.5a) has been assigned to
[E(Acetyl)TY(NH-iTRAQ8)GDmADccEK(Acetyl)+2H]2+. The number of observed acetyl groups agrees
with labeling of the N-terminus and a Lys residue, carbamidomethylation of Cys, and tagging of Tyr108
with the iTRAQ8 reagent that produces reporter ion m/z 113. Addition of the iTRAQ8 reagent to the
Tyr108 is also confirmed by the presence of the reporter ion m/z 113 in the HCD-MS/MS spectra of both
the light and heavy labeled precursor ions (Figures 4.5b and 4.5c, respectively). This peptide also
contains an oxidized Met residue in which oxidation could have occurred during the in vitro nitration
reaction. Due to the lower m/z range (i.e., 113-121) of iTRAQ reporter ions there is no overlap with the
acetylated immonium ion-NH3 that occurs at m/z 126.
4.3.6. Multiplexing with iTRAQ Reagents
We designed another proof-of-principle experiment to assess whether or not overlap in reporter
ion abundances occurs during precursor ion isolation. Non-overlapping reporter ion m/z values for
isotopically labeled peptides were purposefully selected for this experiment. Briefly, two aliquots of light
labeled 3AT-BSA were derivatized with iTRAQ8 reagents that produce reporter ions m/z 113 and 115 and
mixed in a 1:1 ratio. Two equal aliquots of heavy labeled 3AT-BSA were derivatized with iTRAQ8
reagents that produce reporter ions m/z 117 and 118 and mixed in a 1:4 ratio. Light and heavy labeled
samples (1:1 ratio) were combined into a single mixture for analysis. Figure 4.6 shows the low m/z
74
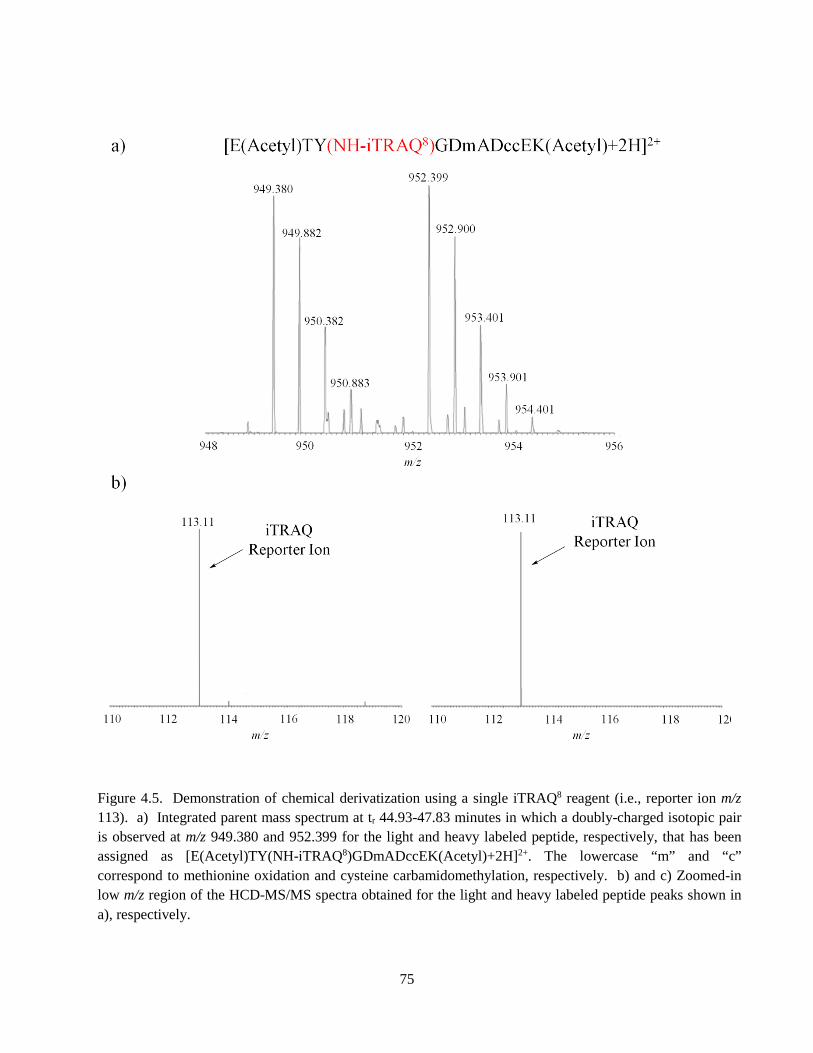
Figure 4.5. Demonstration of chemical derivatization using a single iTRAQ8 reagent (i.e., reporter ion m/z 113). a) Integrated parent mass spectrum at tr 44.93-47.83 minutes in which a doubly-charged isotopic pair is observed at m/z 949.380 and 952.399 for the light and heavy labeled peptide, respectively, that has been assigned as [E(Acetyl)TY(NH-iTRAQ8)GDmADccEK(Acetyl)+2H]2+. The lowercase “m” and “c” correspond to methionine oxidation and cysteine carbamidomethylation, respectively. b) and c) Zoomed-in low m/z region of the HCD-MS/MS spectra obtained for the light and heavy labeled peptide peaks shown in a), respectively.
75
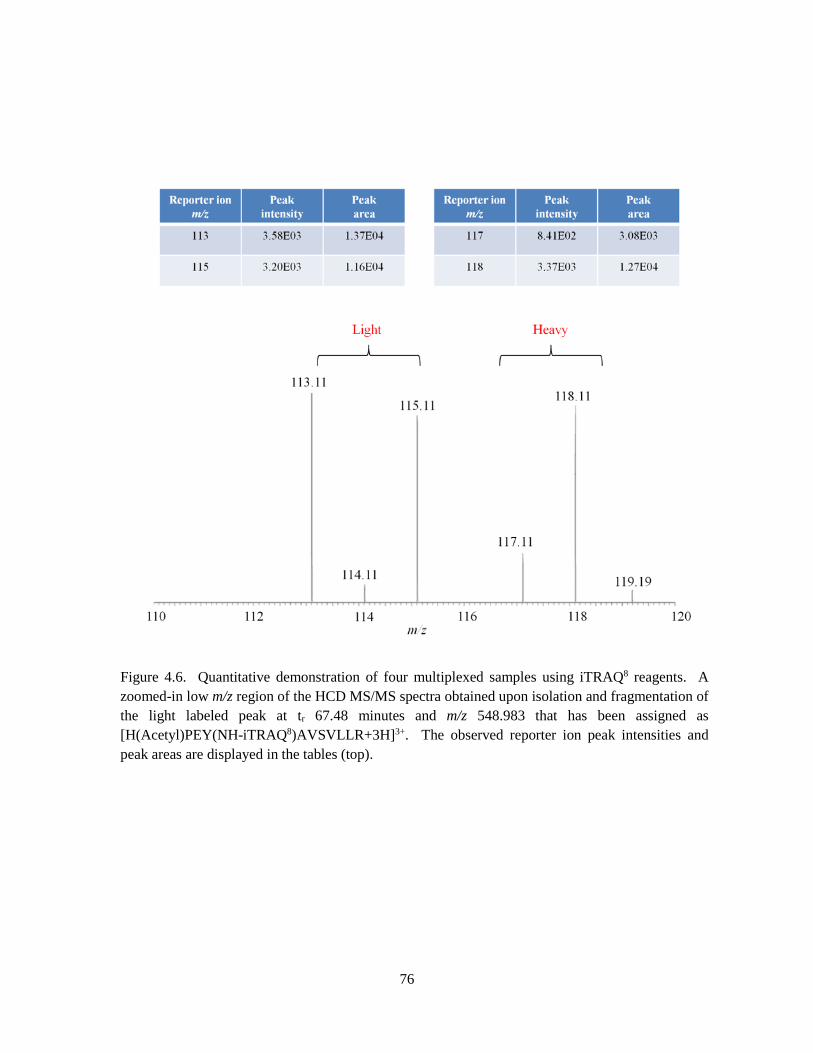
Figure 4.6. Quantitative demonstration of four multiplexed samples using iTRAQ8 reagents. A zoomed-in low m/z region of the HCD MS/MS spectra obtained upon isolation and fragmentation of the light labeled peak at tr 67.48 minutes and m/z 548.983 that has been assigned as [H(Acetyl)PEY(NH-iTRAQ8)AVSVLLR+3H]3+. The observed reporter ion peak intensities and peak areas are displayed in the tables (top).
76

region of the HCD-MS/MS spectra generated upon isolation and fragmentation of the light labeled
precursor peak at m/z 548.983. Based on CID- and HCD-MS/MS spectra (data not shown) this peak has
been assigned as [H(Acetyl)PEY(NH-iTRAQ8)AVSVLLR+3H]3+. The issue of overlapping precursor
ion isolation for the isotopically labeled pairs is better demonstrated in this data than could be delineated
with the data presented in Figure 4.4. Theoretically, the HCD-MS/MS spectrum (Figure 4.6) should only
contain the reporter ions at m/z 113 and 115 since it was generated upon isolation and fragmentation of
the light labeled precursor peak. However, there is signal observed from the heavy labeled precursor ion
peak as the reporter ions at m/z 117 and 118 are also present in the spectrum. Detection of the heavy
labeled reporter ion peaks confirms that overlap in precursor ion isolation is occurring in the LTQ and is
consistent with the inaccurate abundances measured in the 12-plex experiments (Figures 4.4b and 4.4c).
Figure 4.6 only displays the HCD-MS/MS spectrum obtained for the light labeled precursor peak,
however accurate reporter ion abundances for both isotopically labeled peaks are observed. The expected
reporter ion ratios for the light labeled peak are 1:1 for m/z 113:115 and for the heavy labeled peak are 1:4
for m/z 117:118. For the light labeled precursor peak, the measured reporter ion abundances based on
peak intensity are 1:1.1 for m/z 113:115. The heavy labeled precursor peak measured reporter ion
abundances are 1:4.0 for m/z 117:118. Similar ratio values are obtained using peak areas as opposed to
peak intensities for abundance calculations (see table in Figure 4.6). These data provide evidence to
support that cPILOT allows differences in relative protein abundances to be measured across multiple
samples. Furthermore, cPILOT can increase the multiplexing capability of iTRAQ8 (m/z 113-121) to the
analysis of 16 samples in a single experiment. We also note that the presence of reporter ion tags in the
HCD spectra can be used as a selection criterion to filter for 3NT-modified peptides during data analysis.
In order to demonstrate the potential capability of this approach to detect nitrated peptides in complex
mixtures, the cPILOT workflow was carried out on tryptic peptides from mouse splenic proteins. Based
on the aforementioned issues, only a four-plex experiment was designed which allowed us to track the
occurrence of precursor ion overlap and evaluate the reporter ion quantitation. The peptide mixture was
split into four individual aliquots, acetylated with either light or heavy labels, derivatized with iTRAQ8
77

reagents, and mixed in a 1:1 ratio for m/z 113, 114 and 1:1 ratio for m/z 115 and 116, respectively. Figure
4.7a shows a precursor mass spectrum for a doubly-charged precursor peak pair at m/z 810.972 (light) and
812.481 (heavy) that is shifted by 3 Da. This pair has been assigned as the [A(Acetyl)PGISY(NH-
iTRAQ8)QRLVR+2H]2+ peptide belonging to phosphoinositide 3-kinase regulatory subunit 5 protein
(IPI00400180.1). From the HCD-MS/MS spectra obtained from the light and heavy labeled precursors, it
is evident that this peptide was nitrated as indicated by the presence of the four reporter ions.
Additionally, the observed peak intensity ratios for reporter ions are similar to the expected values. It is
still apparent from the MS/MS spectra that there is overlap in the precursor isolation indicated by the
presence of the reporter ions at m/z 115 and 116 in the HCD spectra (Figure 4.7b) taken upon isolation of
the light precursor peak and the presence of m/z 113 and 114 in the HCD spectra taken upon isolation of
the heavy precursor peak (Figure 4.7b). Under ideal conditions, only reporter ions at 113 and 114 m/z
should be present in HCD spectra from the light labeled precursor (similarly 115 and 116 m/z should be
observed for the heavy precursor). Overall, we identified 371 peptides, which correspond to 96 mouse
splenic proteins. Five proteins (five peptides and twelve spectral counts) were identified with nitrated
residues: phosphoinositide 3-kinase regulatory subunit 5 protein [A(Acetyl)PGISY(NH-
iTRAQ8)QRLVR], nebulin [D(Acetyl)Y(NH-iTRAQ8)DLREDAISIK(Acetyl)], Ep300 protein
[K(Acetyl)VEGDM(Ox)Y(NH-iTRAQ8)ESANNR], Isoform 1 of Bullous pemphigoid antigen 1
[S(Acetyl)IDELNSAWDSLNK(Acetyl)AW(NH-iTRAQ8)K(Acetyl)], and Npas3 protein
[V(Acetyl)ERY(NH-iTRAQ8)VESEADLR]. We note that a low percentage (i.e., 1.6%) of nitrated
peptides was identified with modifications on Tyr or Trp residues. Additional enrichment steps (i.e.,
immunoprecipitation of 3NT-modified peptides prior to cPILOT) will be necessary in order to identify
large numbers of nitrated peptides in complex mixtures.
Caveats to obtaining accurate quantitative information with cPILOT relies on minimal to no
overlap in the precursor ion isolation for isotopically labeled peaks, efficient chemical reactions, and
minimal errors during sample preparation. The N-acetoxy-2H3-succinimide reagent used to isotopically
label tryptic peptides in these studies can be substituted with other reagents that will increase the mass
78

Figure 4.7. Application of cPILOT to mouse spleen tissue using iTRAQ8 reagents in a four-plex experiment. a) Parent mass spectrum at tr 105.03 minutes of the doubly-charged isotopic pair observed at m/z 810.972and 812.481 for the light and heavy labeled peptide, respectively, [A(Acetyl)PGISY(NH-iTRAQ8)QRLVR+2H]2+ of the phosphoinositide 3-kinase regulatory subunit 5 protein (IPI00400180.1) protein from spleen tissue. b) A zoomed-in low m/z region of the HCD-MS/MS spectra obtained upon isolation and fragmentation of the light (left) and heavy (right) labeled peaks shown in a).
79

shift between light and heavy labeled peptides, thus eliminating compression and overestimation of
reporter ion abundance ratios. Section 4.3.7 and Chapters 5 and 6 explore alternative precursor isotopic
labeling reagents to improve these issues. Errors associated with sample loss were minimized during
these experiments by performing “one-pot” reactions and using a single sample clean-up step prior to LC-
MS/MS analysis. Finally, for application of cPILOT to complex peptide mixtures in which protein
abundances are not known a priori it is necessary to have efficient chemical reactions in order to reduce
complexity in data analysis and interpretation. The isotopic labeling and commercial TMT and iTRAQ
reactions have efficiencies reported to be greater than 98% [74, 218, 291, 292]. Our results are consistent
with these reported efficiencies.
4.3.7. Improved cPILOT Quantitative Accuracy using 13C2, 2H3-Acetylation*
(*De Gruyter Proteomics Quantification of Protein Nitration, Walter De Gruyter GmbH Berlin
Boston, 2013. Copyright and all rights reserved. Material from this publication has been used
with the permission of Walter De Gruyter GmbH.) [99]
To directly address the issue of precursor ion overlap, acetylation reagents which generate higher
mass shifts in the precursor MS spectra have been employed as shown in Figure 4.8. The cPILOT
workflow was modified by exchanging the GIST reagent with direct addition of light (C4H6O3) and heavy
(13C42H6O3) acetic anhydride for acetylation of protein digests. Nitrated BSA peptides after acetylation
exhibit a mass shift of 5 Da between light and heavy (13C2,2H3-acetyl) precursor peaks. Due to the
enhanced m/z shift, there should be no overlap in MS ion selection between light and heavy precursors.
Improvements in quantification are observed using this approach. For example, the light and heavy
MS/MS spectra generated for the doubly-charged peptide (Acetyl)NY(NH-TMT6)QEAK(Acetyl), show a
1.0:4.5 and 3.7:1.0 reporter ion ratio for m/z 130:131, respectively. Due to the accuracy of the ratios
(which should be 1:4 and 4:1 for light and heavy, respectively), this demonstrates the applicability of
increasing precursor mass shifts for reducing ion overlap while yet improving quantification. Also, the
80

Figure 4.8. Chemical reaction of peptide primary amines with acetic anhydride (top). Example HCD MS/MS spectra (zoom-in of lower m/z region) of BSA peptide whereby light (-COCH3, bottom left) and heavy (-13CO13C2H3, bottom right) peptide mixtures were tagged with TMT reagents that generate reporter ions at m/z 130 and 131. Theoretical ratios should be 1:4 and 4:1 (m/z 130:131) for light and heavy peptides, respectively.
81
use of Lys C protease as opposed to trypsin results in all Lysine terminated peptides ensuring at least two
sites of acetylation (and thus a mass shift of 10 Da).
4.4. CONCLUSIONS
This work reports on the first quantitative proteomics approach that combines precursor ion
isolation with isobaric tagging strategies such as TMT and iTRAQ for the analysis of 3NT-modified
proteins. cPILOT extends sample multiplexing capabilities to 12 and 16 samples with commercial TMT6
and iTRAQ8 reagents, respectively, and provides the identification of nitrated peptides through detection
of reporter ions in HCD MS/MS spectra. Despite the observed limitations with the reagents used for this
cPILOT strategy, accurate quantitative information could be obtained with appropriate precursor tagging
reagents and/or improvements to experimental design. The incorporation of a 5 Da acetylation mass shift
and the use of LysC protease are an important steps to achieve accurate quantitation using cPILOT. Since
3NT modifications are low-abundance, we also note that this approach can be combined with prior
enrichment procedures for nitrated peptides such as immunoprecipitation or with selected ion monitoring
experiments to search for reporter ions. Primary advantages with cPILOT include the ability to use
reporter ion tags to identify nitrated peptides, reduction of cost associated with purchasing commercial
isobaric tag kits, and increasing the number of samples analyzed in a single experiment. The ability to
increase multiplexing of proteomics experiments is an attractive area for many researchers that are
examining expression differences in a large number of biological samples. Chapters 5 and 6 extend
cPILOT to a global quantitative proteomic approach to enhance multiplexing, which can be applied to
protein samples of any origin.
82

5.0. GLOBAL COMBINED PRECURSOR ISOTOPIC LABELING AND ISOBARIC TAGGING
(cPILOT) APPROACH WITH SELECTIVE MS3 ACQUISITION*
(*Global Combined Precursor Isotopic Labeling and Isobaric Tagging (cPILOT) Approach with
Selective MS3 Acquisition. Evans, A. R.; Robinson, R. A. S. Proteomics. 13. Copyright © 2013.
Permission granted by John Wiley and Sons. 2014.)
5.1. INTRODUCTION
Enhanced multiplexing techniques were presented in Chapter 1, which include SILAC combined
with TMT [102], Neucode tags [105], and the synthesis of novel TMT reagents [103]. However, these
approaches are limited to cell cultures, ultra-high resolution mass analyzers (R > 480k), or require tags
not commercially available. Chapter 4 reported a strategy for combining precursor isotopic labeling and
isobaric tagging, termed “cPILOT”, which increases the multiplexing of isobaric tagging to 12 and 16
samples for TMT and iTRAQ, respectively [98]. This approach however, is exclusive to the detection of
nitrated peptides. Herein, Chapter 5 presents a novel global cPILOT method, which can be applied to
protein samples from any origin (e.g., cell cultures, tissues, biological fluids, etc.) using common
commercially available reagents. This new approach relies on the use of low pH dimethylation to
chemically tag peptide N-termini [293], leaving lysine residues accessible for TMT tagging. The key to
this workflow for future multiplexing experiments is the use of light [-(CH3)2] and heavy [-(13C2H3)2]
dimethyl tags for precursor labeling of up to 12 or 16 samples that will be subsequently tagged with TMT
six-plex or iTRAQ eight-plex reagents, respectively. Global cPILOT is a technique, which can be applied
to any laboratory interested in enhanced multiplexing.
The second aspect of global cPILOT includes a novel strategy which increases detection of
reporter ions at the MS3 level. Several methods have been presented, which clean up precursor
83
interferences [86, 87] and thus improve reporter ion quantitation, such as gas-phase purification with
electron transfer dissociation [89], HCD-MS3 [94], and the analysis of fragment ions other than the
traditional reporter ions (i.e., TMT clusters) [90]. It has been previously suggested that HCD-MS3 data
collection using gas phase fractionation significantly increases the number of MS3 reporter ion spectra
from trypsin digests [294]. This method is limited because it generates MS3 spectra that do not contain
reporter ions due to the selection of y-ions from arginine-terminated peptides, which lack a TMT tag. To
overcome this limitation and increase the number of HCD-MS3 spectra with reporter ions accessible for
quantitation, we developed a selective MS3 data acquisition method that uses y1 (m/z 371.2) collisional
induced dissociation (CID) fragments arising from C-terminal lysine-TMT peptides.
5.2. EXPERIMENTAL
In order to demonstrate the global nature of this new cPILOT workflow, peptide mixtures from
wild-type mice (14 months old, C57BL/6J) brain homogenates were prepared. Mice were purchased from
Jackson Laboratory and housed in the Division of Laboratory Animal Resources at the University of
Pittsburgh. All animal protocols were approved by the Institutional Animal Care and Use Committee at
the University of Pittsburgh. Brains were homogenized in phosphate buffer saline (PBS) with 8M urea,
centrifuged at 13000 rpm, and the protein concentration of the supernatant was determined by BCA assay
(Pierce Thermo Scientific). Proteins (100 µg) were reduced with dithiothreitol DTT, alkylated with
iodoacetamide [98], and digested with either trypsin or LysC at a 1:50 protein:enzyme for 24 hours at
37°C or 18 hours at 30°C, respectively. LysC and trypsin digests were split into equal portions for low
pH dimethylation [293] resulting in light [-(CH3)2] or heavy [-(13C2H3)2] labeled peptides that were
individually subject to TMT0 tagging according to manufacturer’s protocol (Thermo Fisher). Pooled
mixtures of light and heavy TMT0 tagged peptides were separated using nanoflow reverse phase liquid
chromatography (nRPLC) as previously described [98] with the following gradient (%A:%B): 90:10 for
84

5 minutes, 87:13 over 40 minutes, 80:20 over 50 minutes, 70:30 over 25 minutes, 40:60 over 15 minutes,
20:80 over 5 minutes, hold for 10 minutes, and re-equilibrate column for 30 minutes. Eluting peptides
were nanosprayed into an LTQ Orbitrap Velos MS that was operated with data-dependent acquisition as
follows: parent scan m/z range 300-1800, 60,000 resolution, top 7 ions were selected for CID-MS/MS
(35% normalized collision energy, 2.0 isolation window, rejection of +4 or higher charge states) with
HCD-MS3 scans following each CID-MS/MS. MS3 spectra were acquired either from selection of the
most intense ion in CID-MS/MS spectra [94] across the m/z range 300-800 or selection of the y1 (m/z
371.2 ± 0.5 Da, within the top 50 most intense in MS/MS) fragment ion in CID-MS/MS spectra. RAW
files were searched against the International Protein Index (IPI) for mouse proteome database (v3.87,
59534 sequences, 08/16/2012) using SEQUEST (Thermo Proteome Discoverer v1.3) with the following
parameters: trypsin or lysC protease, two miscleavages, 15 ppm parent mass tolerance, 1 Da fragment
mass tolerance, static modifications of light (28.031 Da) or heavy (36.076 Da) dimethylation on N-
termini and carbamidomethyl (57.021 Da) on cysteine, dynamic modifications of oxidation (15.995 Da)
on methionine and the TMT0 tag (224.152 Da) on lysine. Raw data was searched against the database
separately for static light and heavy dimethylation modifications (adding twice the search time). Both
search results were manually combined for further data analysis processing. Decoy database searching
was performed using a reverse protein database with FDRs set at 0.01 and 0.05 for high and medium
confidence peptides, respectively. Two technical replicates for each pooled sample were acquired.
5.3. RESULTS AND DISCUSSION
For the presented global cPILOT workflow (Figure 5.1), different peptide samples (e.g., control
and experimental, longitudinal, etc.) that arise from any source can be independently subject to low pH
(~2.5) dimethylation, which selectively targets N-termini [293] in order to generate light or heavy labeled
peptides. The mechanism for dimethylation involves the formation of an imine resulting from
85

Figure 5.1. Schematic of the workflow for a global cPILOT approach applied to two samples that use TMT0 reagents.
86
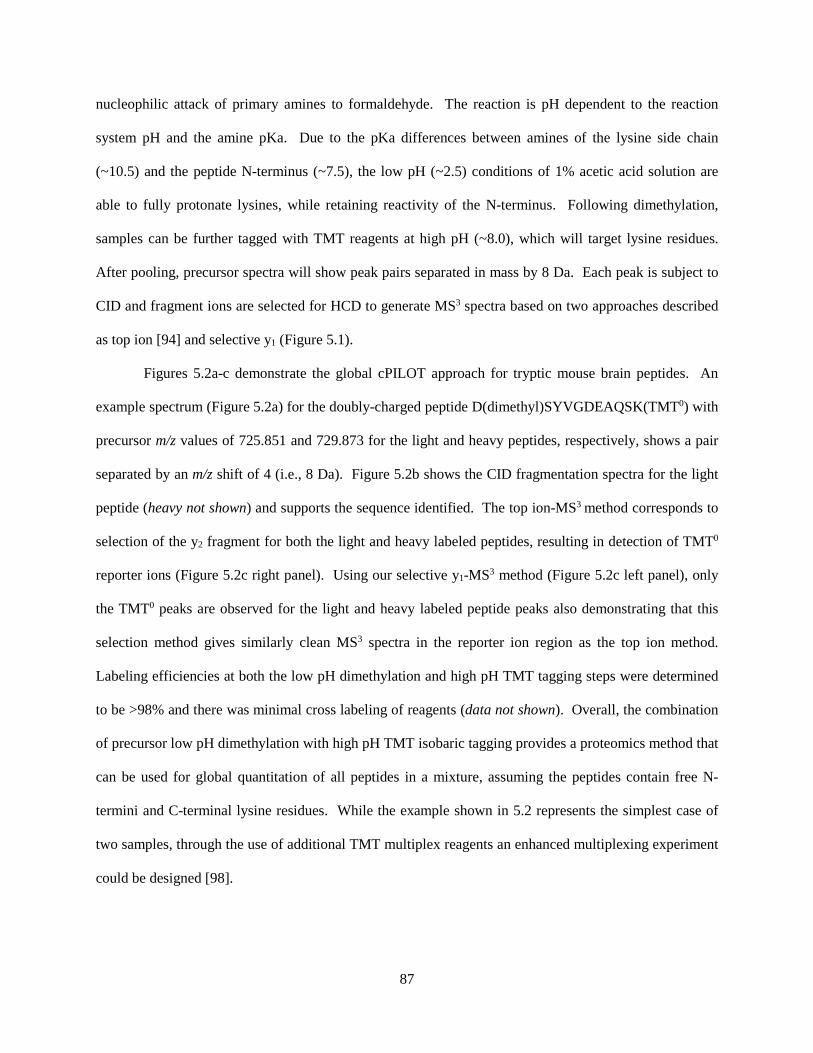
nucleophilic attack of primary amines to formaldehyde. The reaction is pH dependent to the reaction
system pH and the amine pKa. Due to the pKa differences between amines of the lysine side chain
(~10.5) and the peptide N-terminus (~7.5), the low pH (~2.5) conditions of 1% acetic acid solution are
able to fully protonate lysines, while retaining reactivity of the N-terminus. Following dimethylation,
samples can be further tagged with TMT reagents at high pH (~8.0), which will target lysine residues.
After pooling, precursor spectra will show peak pairs separated in mass by 8 Da. Each peak is subject to
CID and fragment ions are selected for HCD to generate MS3 spectra based on two approaches described
as top ion [94] and selective y1 (Figure 5.1).
Figures 5.2a-c demonstrate the global cPILOT approach for tryptic mouse brain peptides. An
example spectrum (Figure 5.2a) for the doubly-charged peptide D(dimethyl)SYVGDEAQSK(TMT0) with
precursor m/z values of 725.851 and 729.873 for the light and heavy peptides, respectively, shows a pair
separated by an m/z shift of 4 (i.e., 8 Da). Figure 5.2b shows the CID fragmentation spectra for the light
peptide (heavy not shown) and supports the sequence identified. The top ion-MS3 method corresponds to
selection of the y2 fragment for both the light and heavy labeled peptides, resulting in detection of TMT0
reporter ions (Figure 5.2c right panel). Using our selective y1-MS3 method (Figure 5.2c left panel), only
the TMT0 peaks are observed for the light and heavy labeled peptide peaks also demonstrating that this
selection method gives similarly clean MS3 spectra in the reporter ion region as the top ion method.
Labeling efficiencies at both the low pH dimethylation and high pH TMT tagging steps were determined
to be >98% and there was minimal cross labeling of reagents (data not shown). Overall, the combination
of precursor low pH dimethylation with high pH TMT isobaric tagging provides a proteomics method that
can be used for global quantitation of all peptides in a mixture, assuming the peptides contain free N-
termini and C-terminal lysine residues. While the example shown in 5.2 represents the simplest case of
two samples, through the use of additional TMT multiplex reagents an enhanced multiplexing experiment
could be designed [98].
87

Selection of the top most intense ion for HCD-MS3 data acquisition is limited by selection of
CID-MS/MS fragments that do not contain a TMT tag. Examples include selection of a b-ion,
Figure 5.2. a) Precursor MS spectra for the peptide D(dimethyl)SYVGDEAQSK(TMT0) with b) corresponding CID-MS/MS for the light peptide. The shaded region corresponds to the m/z window for selection of the most intense ion for MS3, indicated by the (**). The (*) indicates the y1 fragment selected. c) HCD-MS3 is shown for the top ion method (right) and the selective y1 method (left) for light and heavyprecursor peaks.
88
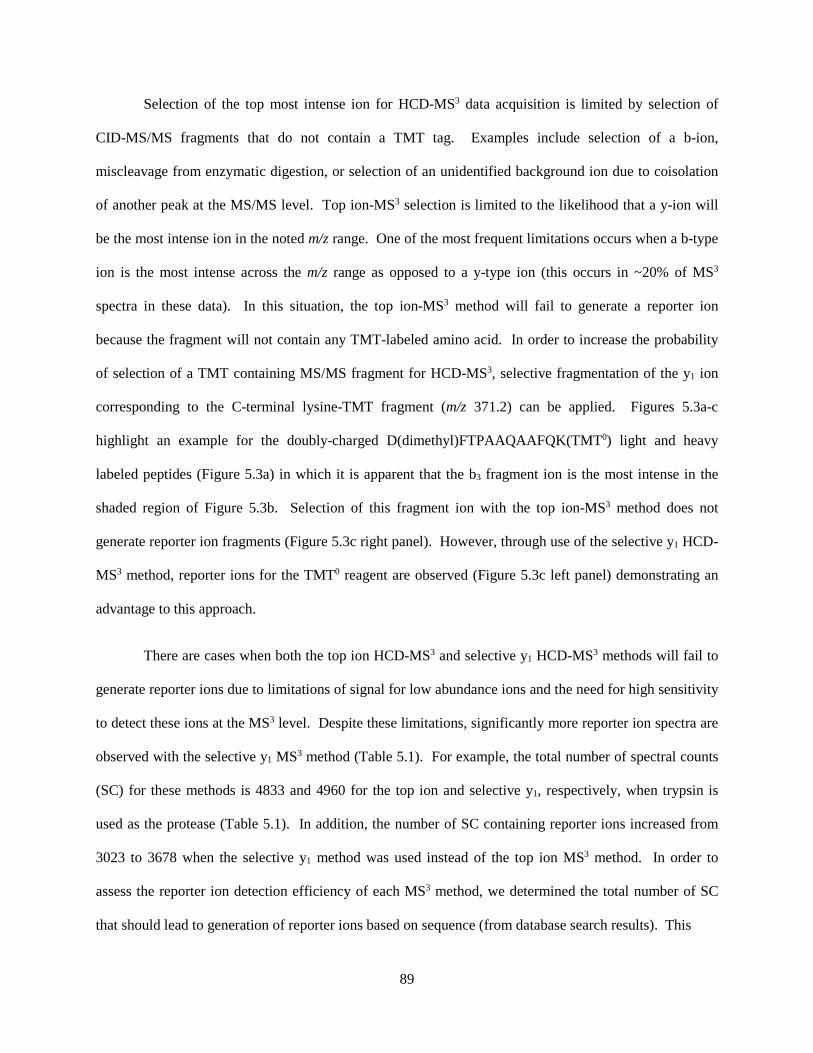
Selection of the top most intense ion for HCD-MS3 data acquisition is limited by selection of
CID-MS/MS fragments that do not contain a TMT tag. Examples include selection of a b-ion,
miscleavage from enzymatic digestion, or selection of an unidentified background ion due to coisolation
of another peak at the MS/MS level. Top ion-MS3 selection is limited to the likelihood that a y-ion will
be the most intense ion in the noted m/z range. One of the most frequent limitations occurs when a b-type
ion is the most intense across the m/z range as opposed to a y-type ion (this occurs in ~20% of MS3
spectra in these data). In this situation, the top ion-MS3 method will fail to generate a reporter ion
because the fragment will not contain any TMT-labeled amino acid. In order to increase the probability
of selection of a TMT containing MS/MS fragment for HCD-MS3, selective fragmentation of the y1 ion
corresponding to the C-terminal lysine-TMT fragment (m/z 371.2) can be applied. Figures 5.3a-c
highlight an example for the doubly-charged D(dimethyl)FTPAAQAAFQK(TMT0) light and heavy
labeled peptides (Figure 5.3a) in which it is apparent that the b3 fragment ion is the most intense in the
shaded region of Figure 5.3b. Selection of this fragment ion with the top ion-MS3 method does not
generate reporter ion fragments (Figure 5.3c right panel). However, through use of the selective y1 HCD-
MS3 method, reporter ions for the TMT0 reagent are observed (Figure 5.3c left panel) demonstrating an
advantage to this approach.
There are cases when both the top ion HCD-MS3 and selective y1 HCD-MS3 methods will fail to
generate reporter ions due to limitations of signal for low abundance ions and the need for high sensitivity
to detect these ions at the MS3 level. Despite these limitations, significantly more reporter ion spectra are
observed with the selective y1 MS3 method (Table 5.1). For example, the total number of spectral counts
(SC) for these methods is 4833 and 4960 for the top ion and selective y1, respectively, when trypsin is
used as the protease (Table 5.1). In addition, the number of SC containing reporter ions increased from
3023 to 3678 when the selective y1 method was used instead of the top ion MS3 method. In order to
assess the reporter ion detection efficiency of each MS3 method, we determined the total number of SC
that should lead to generation of reporter ions based on sequence (from database search results). This
89

Figure 5.3. a) MS spectrum for the peptide D(dimethyl)FTPAAQAAFQK(TMT0) with b) CID-MS/MS for the light peptide. c) HCD-MS3 is shown for the top ion method (right) and the selective y1 method (left) for light and heavy precursor peaks. The shaded region corresponds to the m/z window for selection of the most intense ion for MS3, indicated by the (**). The (*) indicates the y1 fragment selected.
90
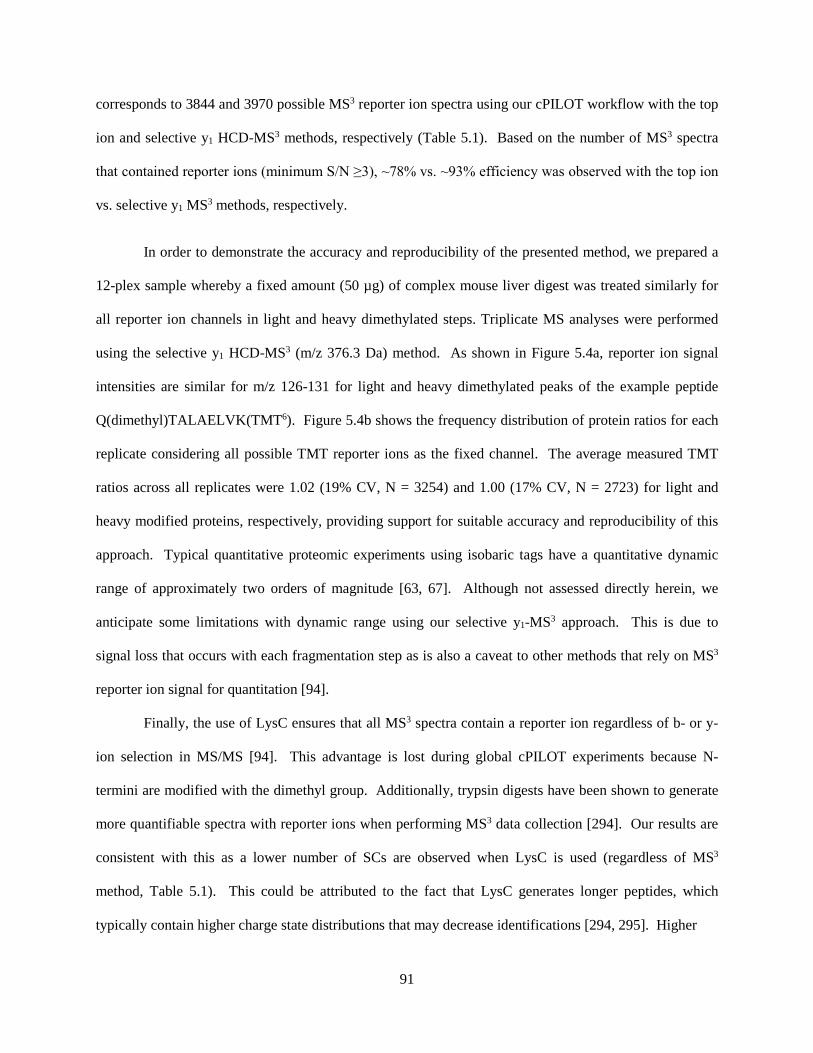
corresponds to 3844 and 3970 possible MS3 reporter ion spectra using our cPILOT workflow with the top
ion and selective y1 HCD-MS3 methods, respectively (Table 5.1). Based on the number of MS3 spectra
that contained reporter ions (minimum S/N ≥3), ~78% vs. ~93% efficiency was observed with the top ion
vs. selective y1 MS3 methods, respectively.
In order to demonstrate the accuracy and reproducibility of the presented method, we prepared a
12-plex sample whereby a fixed amount (50 µg) of complex mouse liver digest was treated similarly for
all reporter ion channels in light and heavy dimethylated steps. Triplicate MS analyses were performed
using the selective y1 HCD-MS3 (m/z 376.3 Da) method. As shown in Figure 5.4a, reporter ion signal
intensities are similar for m/z 126-131 for light and heavy dimethylated peaks of the example peptide
Q(dimethyl)TALAELVK(TMT6). Figure 5.4b shows the frequency distribution of protein ratios for each
replicate considering all possible TMT reporter ions as the fixed channel. The average measured TMT
ratios across all replicates were 1.02 (19% CV, N = 3254) and 1.00 (17% CV, N = 2723) for light and
heavy modified proteins, respectively, providing support for suitable accuracy and reproducibility of this
approach. Typical quantitative proteomic experiments using isobaric tags have a quantitative dynamic
range of approximately two orders of magnitude [63, 67]. Although not assessed directly herein, we
anticipate some limitations with dynamic range using our selective y1-MS3 approach. This is due to
signal loss that occurs with each fragmentation step as is also a caveat to other methods that rely on MS3
reporter ion signal for quantitation [94].
Finally, the use of LysC ensures that all MS3 spectra contain a reporter ion regardless of b- or y-
ion selection in MS/MS [94]. This advantage is lost during global cPILOT experiments because N-
termini are modified with the dimethyl group. Additionally, trypsin digests have been shown to generate
more quantifiable spectra with reporter ions when performing MS3 data collection [294]. Our results are
consistent with this as a lower number of SCs are observed when LysC is used (regardless of MS3
method, Table 5.1). This could be attributed to the fact that LysC generates longer peptides, which
typically contain higher charge state distributions that may decrease identifications [294, 295]. Higher
91

Table 5.1. Peptide and Spectra Evaluation
Enzyme Method SC Predicted Observed Efficiency (%)Trypsin Top Ion 4833 3844 3023 78LysC Top Ion 2807 2751 2200 80
Trypsin y1 selection 4960 3970 3678 93LysC y1 selection 2889 2853 2509 88
cPILOT Reporter Ion Spectral Counts (SC)
92

Figure 5.4. a) HCD-MS3 fragmentation spectra (low m/z shown) for light (left) and heavy (right) petide Q(dimethyl)TALAELVK(TMT-6plex) showing equimolar twelve plex spectra. b) Log2 plot of protein TMT ratios from three replicate experiments.
93

charge states (≥4) are rejected in our workflow to minimize overlap between light and heavy precursor
pairs.
5.4. CONCLUSIONS
Chapter 5 presents a novel global cPILOT method, which includes a selective y1-MS3 method
for increased coverage of reporter ion spectra. Global cPILOT can be applied peptide mixtures (trypsin
or LysC) from various sources (e.g., cell cultures, tissue, etc) and can be expanded to multiplex 12 and 16
samples for TMT and iTRAQ tags, respectively. Accurate and reproducible quantitation was
demonstrated with < 20 % CV. Chapter 6 expands global cPILOT to assess the dynamic range and
applies the technique to biological tissues in a large scale discovery-based proteomics experiment.
94
6.0. GLOBAL cPILOT ANALYSIS OF THE APP/PS-1 MOUSE LIVER PROTEOME*
(*Information in this chapter is written based on a submitted manuscript, Evans, A.R.; Gu, L.; Guerrero
Jr. R.; Robinson, R.A.S. Proteomics Clinical Applications.)
6.1. INTRODUCTION
Alzheimer’s disease (AD) is a neurodegenerative disorder accounting for 60-80% of total
dementia cases [296]. Symptoms include memory loss, confusion, decreased language skills and reduced
motor function [297]. Senile plaques (SP), consisting of amyloid β (Aβ) peptides, are a major hallmark of
AD, and are formed from the cleavage of amyloid precursor protein (APP) by α, β, and γ secretases [298,
299]. Presenilin-1 (PS-1) is a part of the γ-secretase complex and several mouse models of AD have been
created which have APP and PS-1 mutations [300, 301]. Aβ peptides can be cleared from the brain by
forming a complex with high density lipoprotein, which is facilitated by Apolipoprotein E (ApoE) [302].
Overexpression of ApoEε4 is a genetic risk factor for AD [303]. Disruption of cholesterol metabolism
and homeostasis is linked to APP processing, β and γ-secretase activity, and Aβ peptide production [304,
305]. Other AD hallmarks include synapse loss, dystrophic neuritis, oxidative stress, mitochondrial
dysfunction and neurofibrillary tangles composed of hyperphosphorylated tau protein [297]. AD is also a
metabolic disorder as evidenced by alterations in glucose [306] and lipid metabolism [304], and insulin
resistance [307]. Lower glucose metabolism in brains of AD subjects contributes to cognitive decline
[308] and mitochondrial dysfunction [309].
Aside from the noted characteristics of AD present in the central nervous system there are also
changes that take place in peripheral tissues, such as liver. Presenilin-2 (PS-2) is heritable in R1.40 human
APP transgenic mouse liver [310]. Glucose intolerance and insulin resistance are observed in APP/PS-1
95
mouse liver and results in Aβ overproduction [311]. Docosahexaenoic acid (DHA), a neuroprotective
fatty acid synthesized in the liver, decreases Aβ toxicity [312]. Impaired DHA biosynthesis correlates
with cognitive impairment [313], while DHA administration decreases Aβ deposition [314]. The liver
also plays a role in the clearance and degradation of Aβ peptides through liver low-density lipoprotein
receptor-related protein (LRP) [315-317]. Higher LRP expression in liver increases Aβ peptide clearance
and improves behavioral changes in APP/PS-1 and APPwIndJ20 mouse models of AD [318]. However,
LRP is oxidized in AD which prevents Aβ peptide clearance ultimately contributing to elevated Aβ
concentrations in the circulatory system [319]. It is clear that the liver plays a major role in AD however,
the specific mechanisms and their relation to characteristic hallmarks in the central nervous system are
not fully understood. The liver is responsible for system wide metabolic regulation, protein synthesis,
and detoxification [320]. We believe that dyshomeostasis in the liver could contribute to AD
pathogenesis. Here, we sought to measure changes in the liver proteome of an APP/PS-1 mouse model at
advanced stages of disease [321] in comparison to heterozygous wild-type (WT) controls. Proteomic
studies using this mouse model have been performed on the brain [322, 323], immune cells [324],
astrocytes [325].
Enhanced multiplexing increases sample throughput and minimizes experimental variations,
which result from multiple sample preparations and separate LC-MS injections. Chapters 4 and 5
present cPILOT [98, 100], which increases sample multiplexing capabilities through multiple labeling
steps. Global cPILOT enhances sample multiplexing and can be applied to protein digests from any
sample origin (e.g., tissues, cell cultures, cell types, etc.) [100]. Here, we apply global cPILOT to the
liver proteome of 14-month old APP/PS-1 and WT control mice. In a single proteomics workflow, six
biological replicates are analyzed simultaneously. Independent verification of the changes in the liver
proteome was performed using precursor dimethylation experiments of the six biological replicates
independently. Merits of the cPILOT approach, results from the liver proteome analysis, and implications
for AD are presented.
96
6.2. EXPERIMENTAL
6.2.1. Animal Housing and Tissue Harvesting
APP/PS-1 male mice [B6.Cg-Tg(APPswe, PSEN1dE9) 85Dbo/Mmjax, stock no. 005864, genetic
background: C57BL/6J] and heterozygous controls were purchased from Jackson Laboratory and housed
in the Division of Laboratory Animal Resources at the University of Pittsburgh. All animal protocols
were approved by the Institutional Animal Care and Use Committee at the University of Pittsburgh. Mice
were fed standard Purina rodent laboratory chow ad libitum and kept in a 12 hour light/dark cycle. Liver
tissues were harvested from 14-month old APP/PS-1 (N=6) and WT (N=6) mice and stored at -80°C.
6.2.2. Protein Extraction and Digestion
Livers were individually homogenized in phosphate buffer saline (PBS) with 8 M urea using a
Wheaton homogenizer. Homogenates were sonicated, centrifuged (13000 RPM, 4°C, 15 minutes), and
supernatant collected. Protein concentrations were determined using BCA assay according to the
manufacturer’s protocol (Thermo Pierce, Rockford IL). Proteins (100 µg) were diluted to a concentration
of 1.0 µg/µL in PBS with 8 M urea and spiked with bovine alpha-casein (Sigma, 1.0 µg) to serve as an
internal quality control. Samples were digested with trypsin as previously described [98, 100]. Briefly,
protein mixtures were treated with dithiothreitol (1:40 protein:reagent mol ratio, 2 hours, 37°C),
iodoacetamide (1:80 protein:reagent mol ratio, 2 hours, 0°C, dark), and cysteine (1:40 protein:reagent mol
ratio, 30 minutes, 25°C). Protein solutions were diluted using Tris buffer (0.2 M Tris, pH 8.0, 10 mM
CaCl2) and TPCK-treated trypsin was added (2.5% w/w enzyme/protein, 37°C, 24 hours). Digestions
were quenched by flash freezing in liquid nitrogen, desalted using HLB C18 cartridges, and dried by
speed-vac.
97
6.2.3. cPILOT Chemical Tagging
The global cPILOT [100] study design allows the simultaneous analysis of twelve biological
samples in a single experiment (Figure 6.1). WT and APP/PS-1 mouse liver digests were paired using a
random number generator and low pH (~2.5) dimethylation was performed to selectively modifies
peptides with light [-(CH3)2] or heavy [-(13C2H3)2] dimethyl groups at the N-termini [100, 293]. Peptide
digests were reconstituted in 1% acetic acid (0.25 µg/µL, pH = 2.5) and treated with either formaldehyde
(60 mM)/sodium cyanoborohydride (24 mM) or 13C,2H2-formaldehyde (60 mM)/sodium
cyanoborodeuteride (24 mM) for light and heavy dimethylation, respectively. All samples were
incubated (10 min, 25°C), quenched with 1% NH3 (5 min, 25°C), acidified with 5% formic acid, and
desalted using HLB C18 cartridges. After sample cleanup, TMT6 reagents are used to modify lysine
residues at high pH (~8.5). Peptide solutions were reconstituted in 100 mM triethylammonium
bicarbonate (TEAB) buffer (1 µg/µL) for TMT tagging (Thermo Scientific). Dimethylated WT and
APP/PS-1 liver peptides were individually tagged with TMT reagents 126, 128, or 130 and TMT reagents
127, 129, or 131, respectively, according to the manufacturer’s protocol. Samples were pooled to a single
mixture, dried, and reconstituted in 25% acetonitrile (5 mM KH2PO4, pH 2.98).
6.2.4. Strong Cation Exchange
The pooled peptide sample (600 µg) was separated by offline strong cation exchange (SCX) on a
Polysulfoethyl A column (Nest Group Inc., 2.1 mm i.d., 10.0 cm, 5U, 100Å) using a Waters 2695 LC
with a Waters 996 PDA detector (210 nm – 400 nm). Buffer A was composed of 25% acetonitrile and 5
mM KH2PO4 (pH 3.0). Buffer B was composed of 25% acetonitrile, 5 mM KH2PO4, and 350 mM KCl
(pH 3.0). Gradient elution was performed at 0.20 mL/min as follow (%A/%B): 100/0 for 5 minutes,
60/40 over 55 minutes, 40/60 over 25 minutes, 20/80 over 5 minutes, 0/100 over 10 minutes, hold 0/100
for 10 minutes, followed by column re-equilibration. Fractions were collected in a 96 well plate and
98

divided equally to create 13 equimolar fractions. Each fraction was cleaned using HLB C18 cartridges and
dried by speed-vac.
6.2.5. RPLC-MS3 Data Acquisition
SCX fractions were reconstituted in 0.1% formic acid solution and separated using nanoflow
reversed phase liquid chromatography (nRPLC). Buffer A was composed of 3% acetonitrile (ACN) with
0.1% formic acid (FA) and buffer B was composed of 100% ACN with 0.1% FA. Samples were loaded
onto a trap column (C18, 200 Å, 2.0 cm, 5U, 3 µL/min), washed with buffer A for 3 minutes, and
transferred onto an analytical column (C18, 100 Å, 5U, 13.2 cm). Separation occurred at 300 nL/min with
the following gradient: (%A/%B) 90/10 for 5 minutes, 85/15 over 20 minutes, 80/20 over 75 minutes,
70/30 in 20 minutes, 40/60 in 10 minutes, 20/80 in 5 minutes, hold 20/80 for 10 minutes, followed by
column re-equilibration. Eluted peptides underwent nanospray ionization and were detected using an
LTQ-Orbitrap Velos MS instrument. Parent MS scans (60,000 resolution, 400-1600 m/z, AGC 1x10⁶
ions, maximum injection time 500 ms) were performed followed by data-dependent acquisition (DDA).
The top seven most intense ions were selected for CID MS/MS (500 minimum signal, 3 m/z isolation
width, 35% NCE, 0.25 activation q, 10 ms activation time, 3x10⁴ AGC, 50 ms max injection time)
followed by selection and fragmentation of the most intense ion from CID-MS/MS for HCD-MS3
(Orbitrap detection, 200 minimum signal, 4 m/z isolation width, 60% NCE, 0.1 activation time, 3x10⁵
AGC, 250 ms IT, 300-1300 m/z MS/MS selection range, exclude unfragmented parent ion). Charge state
screening was disabled, +4 or higher precursor mass charge states were rejected, and dynamic exclusion
was disabled. To increase proteome coverage and the number of 12-plex peptides, second-tier
experiments were performed for all samples using the same DDA conditions with the exception that the
top 8 through 14th most intense ions were selected for CID-MS/MS. Triplicate injections were performed
for all samples.
99
6.2.6. Database Searching and Processing
RAW files were searched with SEQUEST HT against the Uniprot mouse database (51178
sequences, 11/13/2013, bovine alpha-S1-casein P02662 added manually) and processed using Proteome
Discoverer v1.4 (Thermo Scientific). Search parameters included: trypsin with two missed cleavages,
peptide mass range 300-6000 Da, 15 ppm parent mass tolerance, 1 Da fragmentation tolerance, dynamic
modifications of TMT-6plex (+229.163) on lysine residues, oxidation (+15.995) on methionine, static
modifications of light (+28.031) or heavy (+36.076) dimethylation on the N-terminus, and
carbamidomethyl (+57.021) on cysteine. Decoy database searching was performed using a reverse
protein database with FDR settings at 0.01 and 0.05 for high and medium confidence peptides,
respectively. Peptide reporter ion intensities were extracted using Proteome Discoverer v1.4 software (20
ppm mass tolerance, most confident peak, MS3 scan event). The median value across an individual
reporter ion channel was calculated from all peptides quantified. Next, the median of the medians for the
twelve reporter ion channels was used to normalize reporter ion signals. Light or heavy peptide spectra
containing at least one TMT tagged lysine and six reporter ions in HCD-MS3 were used for
quantification. Protein TMT ratios were calculated as the average of the summed reporter ion intensity
ratio corresponding to assigned APP/PS-1 and WT pairs for each peptide (referred to hereafter as
AD/WT). The following criteria were used to derive differentially-expressed proteins: one-way ANOVA
(p < 0.05) with Bonferroni correction, protein score ≥ 10.0, spectral counts (SCs) ≥ 4, and biological
replicate count ≥ 3. AD/WT ratios were considered differentially expressed if AD/WT values < 0.7 and >
1.4. Appropriate fold-change cutoff values were chosen based on the 95% confidence interval of average
protein AD/WT ratios and previously described methods [100, 326, 327]. IPA pathway analysis, Panther
[328], and Uniprot functional analysis was used to categorize differentially-expressed proteins by
biological function.
100
6.2.7. Precursor Dimethyl Labeling
Liver tissues were also subject to precursor dimethylation in six independent experiments [75].
WT (N=6) and APP/PS-1 (N=6) mouse homogenates (100 µg) were digested as described above, cleaned
using HLB C18 cartridges, dried, and reconstituted in 100 mM TEAB buffer (0.25 µg/µL, pH = 8.5). WT
and APP/PS-1 samples were treated with formaldehyde (60 mM)/sodium cyanoborohydride (24 mM) and
13C,2H2-formaldehyde (60 mM)/sodium cyanoborodeuteride (24 mM), respectively and incubated for 1
hour at 25°C. Samples were quenched with aqueous ammonia (0.1% final concentration), acidified with
FA, and pooled pairwise to match the cPILOT experiment design (Supplemental Figure S3). Samples
were cleaned using HLB C18 cartridges, dried, and reconstituted in 0.1% FA. Each sample was analyzed
using nano-RPLC-MS/MS as described above with the following exceptions: 350-1700 m/z range for MS
scans, selection of the top 15 most intense ions for CID-MS/MS, charge state screening enabled with
rejection of +1 ions, and dynamic exclusion enabled (repeat count 2, 60 s duration). Database search
parameters were performed with dynamic modifications of oxidation (+15.995) on methionine, light
(+28.031) or heavy (+36.076) dimethylation on the N-terminus and lysine residues, and static
modifications of carbamidomethyl (+57.021) on cysteine. Precursor signals were extracted using
Proteome Discoverer v1.4 and peptide ratios (heavy/light for AD/WT) were calculated. Median peptide
ratios across biological replicates were used for normalization.
6.3. RESULTS
6.3.1. Global cPILOT Approach
Global cPILOT [100] performed simultaneous analysis of twelve biological samples (Figure
6.1). To increase the number of peptide pairs resulting in 12-plex quantitation, we employed a two-tiered
DDA method (Figure 6.2), which increased 12-plex peptides by approximately 50%. Tradeoffs to the
multi-tier approach are additional instrument and data analysis times. We chose the top-ion-HCD-
101

Figure 6.1. Schematic diagram of global cPILOT workflow. Details are described in text.
102

Figure 6.2. Data-dependent acquisition (DDA) method employed for AD mouse liver experiments. Offline SCX fractions were injected in triplicate and DDA parameters set to scan the top 1 through 7 most intense ions across 150 minutes of analysis time. Samples were re-injected three additional times and the top 8-14 most intense ions were selected and fragmented.
103

MS3 [94] method since a 4-fold reduction in reporter ion signal was observed using the previously
described selective y1-MS3 approach [100]. Reduced signal with selective y1-MS3 data acquisition can be
attributed to the relatively lower signal (i.e., the y1 fragment is ~35% of the base peak) of the selected
MS/MS fragments and signal spread across six reporter ion channels and other MS3 fragments.
6.3.2. Global cPILOT Accuracy and Dynamic Range
We assessed the accuracy of cPILOT across two orders of magnitude based on samples prepared
as follows: 0.01:0.02:0.10:0.20:1.0:1.0 using TMT reagents that generate reporter ions at m/z =
126:127:128:129:130:131. Ratios were calculated with reporter ions at m/z = 130 or 131 as the
numerator to measure fold-change values as follows: 1:1, 1:5, 1:10, 1:50, and 1:100. Box plots of
experimental log2 (TMT ratios) are shown in Figure 6.3. TMT ratios for light dimethylated precursors
were 1.0:1.0 ± 0.1 (average ± standard deviation) (N=416 proteins), 1.0:6.0 ± 1.0 (N=784), 1.0:10.5 ± 2.1
(N=682), 1.0:46.4 ± 15.9 (N=316), and 1.0:72.4 ± 27.4 (N=132) while TMT ratios from heavy precursors
were 1.0:1.0 ± 0.1 (N=218), 1.0:5.8 ± 0.8 (N=424), 1.0:10.7 ± 1.8 (N=390), 1.0:53.3 ± 11.5 (N=214), and
1.0:81.8 ± 20.5 (N=158) (average ± standard deviation). Linearity is observed across a 50-fold change
range between reporter ion channels for light (r2 = 0.9988) and heavy (r2 = 0.9999) protein TMT ratios
and across a 100-fold change range with r2 = 0.9823 and 0.9791 for light and heavy protein TMT ratios,
respectively. Based on these findings, cPILOT is accurate over a 50-fold change range.
6.3.3. cPILOT Analysis of the APP/PS-1 Liver Proteome
Global cPILOT was applied to the liver proteome of 14-month old male APP/PS-1 mice,
mimicking advanced stages of AD. In total, 1734 unique proteins were identified from 5084 unique
peptides (324517 SCs) and 545 proteins were quantified, which contain twelve reporter ion signals. In
104
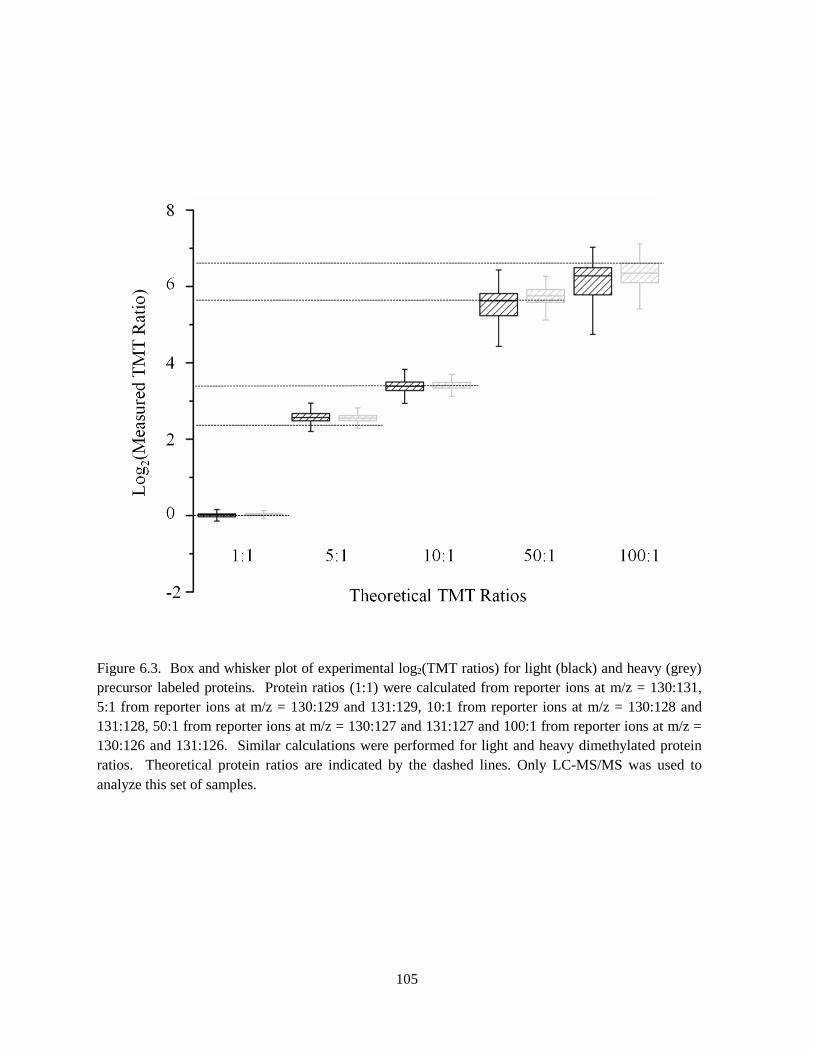
Figure 6.3. Box and whisker plot of experimental log2(TMT ratios) for light (black) and heavy (grey) precursor labeled proteins. Protein ratios (1:1) were calculated from reporter ions at m/z = 130:131, 5:1 from reporter ions at m/z = 130:129 and 131:129, 10:1 from reporter ions at m/z = 130:128 and 131:128, 50:1 from reporter ions at m/z = 130:127 and 131:127 and 100:1 from reporter ions at m/z = 130:126 and 131:126. Similar calculations were performed for light and heavy dimethylated protein ratios. Theoretical protein ratios are indicated by the dashed lines. Only LC-MS/MS was used to analyze this set of samples.
105

some cases, only a single dimethylated peak (i.e. light or heavy) was selected for MS/MS thus
yielding results for less than six biological replicates. Figure 6.4a shows a sample 12-plex spectrum for
the peptide [T(dimethyl)ITVSQDEGVRPSTTMQGLAK(TMT6)+3H]3+ which identifies to the protein 3-
ketoacyl-CoA thiolase B, peroxisomal. HCD-MS3 of light and heavy dimethylated peptides
results in 12-plex quantitation (Figure 6.4b). Higher expression of this peptide is observed in AD
tissue compared to WT (AD/WT = 1.4 ± 0.4, average ± standard deviation). Sixty-four proteins are
differentially-expressed in AD liver (Figure 6.5) and have total reporter ion signals that span five orders
of magnitude.
6.3.4. Precursor Dimethyl Labeling
Precursor isotopic dimethylation [75] was used as an independent means to verify cPILOT
fold-change values (Figure 6.6). This approach included six duplex dimethylation experiments
compared to the single 12-plex cPILOT analysis described above. Figure 6.4c displays the peptide
[T(dimethyl)ITVSQDEGVRPSTTMQGLAK(dimethyl)+3H]3+ observed in Figure 6.4a with light and
heavy peaks. Similar to the cPILOT data, this peptide his higher abundance in the AD liver (1.4 ±
0.6). The six duplex dimethylation experiments resulted in 1415 proteins identified in which 712
proteins overlapped with the single 12-plex cPILOT experiment. Both approaches identified novel
proteins that were not present in the other dataset. Overall, we have identified 2437 total liver proteins in
these studies. Of the 64 differentially-expressed proteins from the cPILOT analysis, 22 protein ratios
were verified using precursor dimethylation (Figure 6.7). Thirteen additional differentially-
expressed proteins were detected using precursor dimethylation. Precursor dimethylation verified many
of the cPILOT ratios.
106

Figure 6.4. a) Precursor spectra for the peptide [T( dimethyl)ITVSQDEGVRPSTTMQGLAK(TMT6)+3H]3+ which belongs to 3-Ketoacyl-CoA Thiolase B (Uniprot Acc. No. Q8VCH0) with b) left, HCD-MS3
reporter ion spectra from light (m/z = 831.442) and right, heavy (m/z = 834.123) peptide peaks. Only the low m/z region is shown. c) Precursor specrum from the precursor dimethylation experiment of the same peptide from a). The light (m/z = 759.068) and heavy (m/z = 764.430) peptide peaks correspond to WT and AD samples, respectively.
107

Figure 6.5. AD/WT protein ratios (log2 scale) as a function of reporter ion signal (log scale). The highlighted area corresponds to a 95% confidence interval. Ratios for differentially-expressed proteins ( ) with error bars (coefficient of variation) are shown in the plot. The following proteins are labeled in the figure: 3-keto-CoA thiolase, peroxisomal (ACAA1), Dihydropteridine reductase (DHPR), U3 small nucleolar ribonucleoprotein (MPP10), Ferric-chelate reductase (FRRS1), Zinc finger CCCH domain-containing protein 6 (C3H6), ATP-binding cassette, sub-family F (ABCF1), Dystrophin (DMD), cytochrome c oxidase, subunit 2 (MT-CO2), Fanconi anemia group D2 (FANCD2), Ras-related protein Rab-5C (Rab5C), PHD finger protein 21A (PHF2A), TATA-box binding protein (TBP), Coiled-coil domain-containing protein 86 (CCDC86), Alpha-1,3-mannosyl-glycoprotein 4-beta-N-acetylglucosaminyltransferase A (MGT4A), tetratricopeptide repeat domain 6 (TCC), interferon-induced protein 44 (IFI44), cytoplasmic dynein 1 heavy chain 1 (DYNC1H1), Acyl-CoA thioesterase 10, mitochondrial (ACO10), Glycogen [starch] synthase, liver (GYS2), serine-pyruvate aminotransferase (AGXT).
108

Figure 6.6. Schematic diagram of workflows used for cPILOT and precursor dimethylation experiments.
109

Figure 6.7. a) Bar graph comparing the AD/WT ratios (average ± standard deviation) calculated from cPILOT (light grey) and precursor dimethylation (dark grey) experiments. b) Bar graph comparing WT/AD ratios (average ± standard deviation) calculated from cPILOT (light grey) and precursor dimethylation (dark grey) experiments.
110
6.4. DISCUSSION
6.4.1. Global cPILOT Methodology
Previously, we presented global cPILOT, which performs precursor dimethylation at the N-
termini followed by isobaric tagging of lysine residues [100]. Traditional analysis of twelve samples
using stable isotopic labeling techniques requires six or two experiments using precursor dimethylation
[75] or TMT tags [329], respectively. cPILOT provides the ability to perform simultaneous quantitation
of twelve samples in a single experiment, which saves analysis time and isobaric tagging reagent.
Fragmentation of both light and heavy dimethylated peptides is necessary to achieve 12-plex quantitation.
This occurred for 59.3% of our quantified peptides, which is consistent with similar experiments
previously presented [102]. Our two-tiered approach also resulted in detection of additional peptide pairs
and increased overall peptide identification.
Significant overlap was observed between cPILOT and precursor dimethylation results in protein
identifications, differentially expressed proteins, and similar protein fold change ratios (Figure 6.7),
highlighting the complementary nature of these techniques. Interestingly, precursor dimethylation
resulted in 703 additional unique proteins not detected using cPILOT, which we attribute to differences in
data collection. cPILOT experiments required the selection of the top CID-MS/MS ion for MS3
fragmentation to obtain maximum sensitivity due to enhanced reporter ion signal compared to selective
y1-HCD-MS3 [100]. We recommend disabling the dynamic exclusion parameter in cPILOT MS3
experiments in order to maximize the number of peptides that contain full 12-plex information. We
recognize that this impacts protein identification rates and compensated for the decrease by incorporating
SCX fractionation and a two-tiered data collection method. These add-ons resulted in a total
experimental time of ten days, compared to 2.5 days for the six duplex dimethylation experiments that
lacked any fractionation. Similar fractionation experiments performed on six duplex dimethylation would
have resulted in an experimental time of almost 30 days. New instrumentation, such as the Orbitrap
111

Fusion, performs multinotched MS3 scan events [330], which may allow the dynamic exclusion setting
with the enhanced MS3 sensitivity, thus eliminating the need for a two-tiered data method. The faster
scan rates of the Fusion significantly enhance proteome coverage coupled with highly sensitive MS3
scans.
In future cPILOT experiments, it could be helpful to perform one analysis that focuses on
identification of many features in the data similar to an accurate mass tag approach [331]. After this
initial experiment, then inclusion or reject lists could be used to setup faster and more focused scanning
methods based on HCD-MS3 without CID-MS/MS. This would minimize the amount of time associated
with these experiments. Compared to label-free analyses of the twelve samples, precursor labeling or
multiple TMT samples that would incorporate multidimensional separations, we still believe that cPILOT
drastically reduces experimental time and costs. Overall, cPILOT successfully performed high throughput
protein identification and quantitation of relatively high abundant liver metabolism related proteins and is
discussed below.
6.4.2. Differentially-Expressed Proteins in APP/PS-1 Liver
Decreased glucose metabolism, disruption of energy homeostasis, insulin resistance, and
dysregulation of lipid metabolism are manifested in AD subjects and can greatly help our understanding
of AD pathogenesis [308, 332]. Since the liver is responsible for metabolic regulation and detoxification
of Aβ peptides, we sought to characterize the liver proteome in an AD mouse model (i.e., APP/PS-1) and
assess if metabolic dysfunction is systemic in AD. It is noteworthy to highlight that there exists no mouse
model which contains all characteristics and behaviors of AD. Sporadic AD accounts for a majority of
cases, however autosomal dominant AD caused by genetic mutations contains similar characteristics and
pathologies [333]. We refer the reader to extensive reviews on genetically modified AD mouse models as
well as potential limitations of their use [300, 334]. The APP/PS-1 develops amyloid senile plaques at 6
112

months of age [335] and exhibits cognitive impairment by 12 months of age. The mice used in this study
are 14 months of age, which is appropriate to study the effects of late stage AD on the liver proteome.
Below is a brief discussion of major pathways identified across differentially-expressed proteins in AD
liver.
6.4.3. Fatty Acid Metabolism
β-oxidation is the principle pathway for fatty acid metabolism that ends in the production of
acetyl-CoA. β-oxidation can occur in mitochondria [336] or peroxisomes [337] that are present in the
liver. Long chain specific acyl CoA dehydrogenase (1.4 ± 0.4), 3-keto-CoA thiolase (1.4 ± 0.4), and
acyl–CoA thioesterase 10 (0.2 ± 0.1) are differentially-expressed in AD liver (Figure 6.8a), which
suggests elevated fatty acid β-oxidation and increased acetyl-CoA production. This is consistent with
acyl-CoA dehydrogenase in APP/PS-1 cerebral cortices [325] and enoyl-CoA hydratase in 3xTG-AD
(APP/PS-1/Tau-p) cortices [338]. Our laboratory has simultaneously detected differential-expression of
acyl-CoA oxidase in APP/PS-1 liver using a cysteine selective cPILOT approach [326]. Ketogenesis
produces ketone bodies such as β-hydroxybutyrate, acetone, and acetoacetate from acetyl-CoA in liver,
which supplies energy to other organs during starvation [339]. Increased ketone body-producing enzymes
have been previously observed in AD mouse models [326, 338]. Ketogenic diets improve motor
functions in APP/PS-1 mice and may be a potential therapeutic approach for neurological disorders [340,
341]. Since glucose metabolism is dysfunctional in AD brain [332], increased fatty acid metabolism in
the AD mouse liver may increase ketone body formation. This would provide a compensatory energy
source for AD brain (Figure 6.8b). We hypothesize there may be elevated ketone body synthesis in liver,
transport of these ketone bodies to the brain, and ketone body metabolism in AD brain. However, further
experiments are necessary in order to test this hypothesis.
113
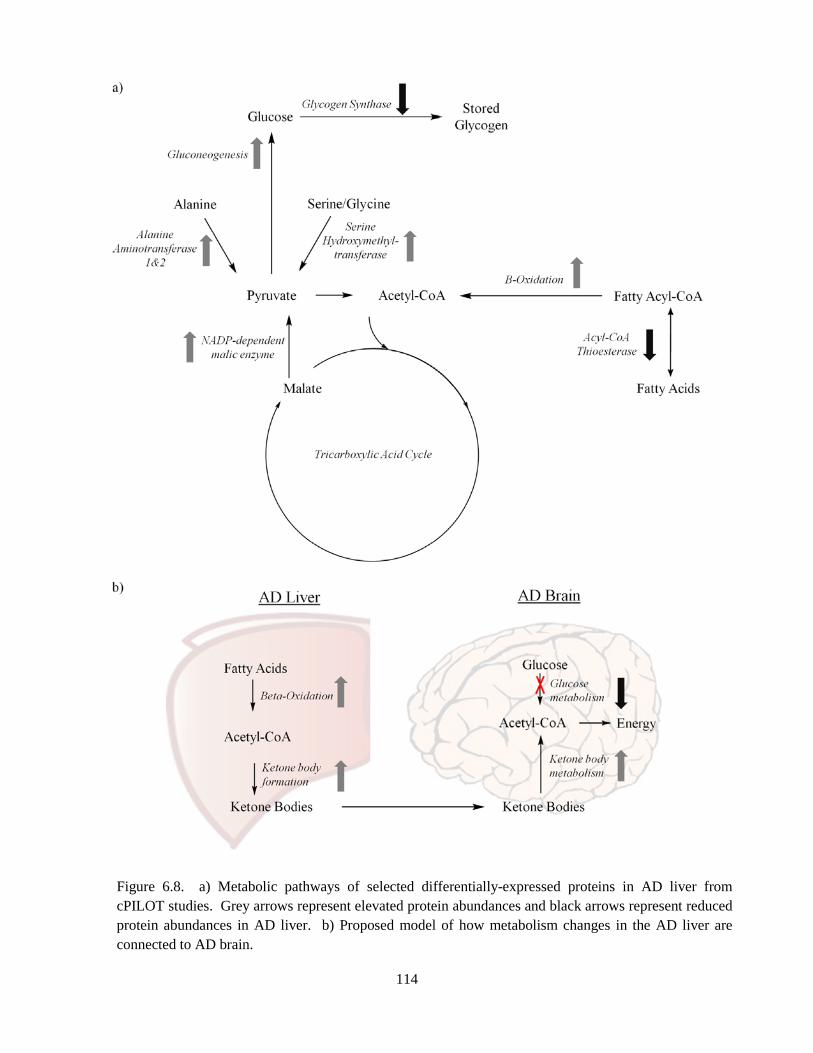
Figure 6.8. a) Metabolic pathways of selected differentially-expressed proteins in AD liver from cPILOT studies. Grey arrows represent elevated protein abundances and black arrows represent reduced protein abundances in AD liver. b) Proposed model of how metabolism changes in the AD liver are connected to AD brain.
114

6.4.4. Pyruvate Metabolism
Serine hydroxymethyltransferase (1.4 ± 0.4) and NADP-dependent malic enzyme (1.4 ± 0.4) are
higher in AD liver, while serine-pyruvate aminotransferase (0.7 ± 0.1) was lower suggesting elevated
pyruvate concentrations. Pyruvate is an essential metabolite that fuels the tricarboxylic acid cycle (TCA)
and drives other biosynthetic pathways [342]. Alanine aminotransferase 1 (1.5 ± 0.8) and glutamic
pyruvate transaminase 2 (1.4 ± 0.3) are enzymes involved in the alanine cycle that produce pyruvate in
liver. The alanine cycle coupled with glutamate dehydrogenase creates α-ketogluterate and ammonia,
which must be detoxified through the urea cycle [342]. The α-ketoglutarate dehydrogenase complex has
decreased activity in AD brain [306] and is inhibited by elevated ammonia concentrations [343]. Our
laboratory has measured differential expression in aspartate aminotransferase and glutamate synthetase in
the APP/PS-1 mouse tissue elsewhere. Hyperammonemia can lead to hepatic encephalopathy, a
neurological complication resulting from liver damage [344]. Clinically, elevated alanine
aminotransferase activity is indicative of liver damage [345]. Impairment of ammonia detoxification may
contribute to AD pathology and neurodegeneration [346].
6.4.5. Other Metabolic Processes
Gluconeogenesis is a process related to the alanine cycle in which glucose is synthesized from
pyruvate and alanine. Phosphoenolpyruvate carboxykinase (3.9 ± 2.1) is involved in glucose synthesis.
Differential-expression of glycogen synthase (0.7 ± 0.2) and glycogen break-down proteins [326] in AD
liver suggests reduced glucose storage. The liver regulates glucose levels by balancing the synthesis and
breakdown of glycogen. Diabetes, hyperglycemia, and insulin resistance may be metabolic mediators of
AD [332]. Observed proteomic changes from cPILOT analysis point to dysregulation of blood-glucose
levels in APP/PS-1 mouse liver. It is possible that this systemic dysregulation may correlate with altered
glucose metabolism in AD brain.
115

Propionyl CoA carboxylase (0.7 ± 0.3) and methylmalonyl-CoA mutase (1.6 ± 1.3) are enzymes
involved in catabolism of succinyl-CoA, an intermediate of the TCA cycle. Succinyl-CoA is a precursor
for heme synthesis [347]. Ferrochelatase (0.6 ± 0.2) forms protoheme in heme biosynthesis and
hemopexin (0.7 ± 0.1) is a heme scavenger [348]. Lower levels of these proteins in AD liver would result
in low circulating heme levels. Mitochondrial dysfunction in AD can decrease TCA cycle activity, which
depletes succinyl-CoA concentrations and reduces the cells’ ability to synthesize heme [349].
Dihydropteridine reductase (1.5 ± 0.5) is involved in the formation of tetrahydrobiopterin, an important
cofactor required in the biosynthesis of tyrosine in liver [350]. Higher dihydropteridine reductase levels
in AD liver can cause more liver resident tyrosine. Tyrosine can be metabolized into fumarate for use in
the TCA cycle or be converted into ketone bodies. Alterations in TCA cycle intermediates are likely due
to mitochondrial dysfunction in AD liver.
6.4.6. Redox Signaling
Enzymes involved in the electron transport chain can generate reactive oxygen species by
forming the superoxide anion from molecular oxygen [351]. We detected elevated levels of cytochrome
C oxidase subunit 2 (2.5 ± 1.6) and sulfite oxidase (1.5 ± 0.7) in AD liver and hence potential elevation of
oxidative phosphorylation. Changes in oxidative phosphorylation have been reported in triple transgenic
AD mouse models [352]. Differentially-expressed redox enzymes which use NADPH as a cofactor are
dihydropteridine reductase, NADP-dependent malic enzyme (1.4 ± 0.4), carbonyl reductase 1 (0.7 ± 0.1),
ferric-chelate reductase 1 (2.1 ± 1.4), 25-hydroxycholesterol 7 alpha hydroxylase (0.6 ± 0.1), and protein-
methionine sulfoxide oxidase (0.6 ± 0.3). Antioxidant regeneration relies on a continuous supply of
NADH and NADPH, which may be altered in AD liver [353]. Oxidative stress is a key contributor to AD
pathology [27] and may impact redox signaling activity of protein-methionine sulfoxide oxidase (0.6 ±
0.3) [354] and cytochrome p450 (0.7 ± 0.1) [27]. Ferric-chelate reductase 1 (2.1 ± 1.4) may also induce
116
metal-catalyzed oxidative damage. Imbalance of redox signaling enzymes and oxidative stress in liver
tissue can result in cellular dysfunction and damage.
6.4.7. Transcription and Translation
We detected a number of differentially-expressed proteins involved in transcription and
translation processes. 60S ribosomal protein L5 (1.5 ± 0.8), 39 ribosomal protein L22 (1.4 ± 0.2), 40S
ribosomal protein S27 (1.4 ± 0.3), and zinc finger CCCH domain-containing protein 10 (2.3 ± 1.7),
histone H2A (1.5 ± 0.5), and fanconi anemia group D2 (2.2 ± 1.4) are enzymes which play a role in RNA
binding, protein synthesis or DNA transcription. RNA oxidation is increased in AD including 60S
ribosomal fractions and can lead to dysregulation of protein synthesis [355]. Phosphorylated histone
family proteins are indicative of DNA damage and lead to apoptosis [356]. Fanconi anemia group D2
actively eliminates damaged DNA during the cell replication [357] and higher levels in AD liver is likely
in response to elevated damaged DNA. Alterations in transcription and protein synthesis in AD liver can
be a result of damaged DNA and RNA, although additional studies are necessary to confirm this
hypothesis.
6.5. CONCLUSIONS
We performed an enhanced multiplexed proteomic study of the APP/PS-1 liver proteome using
the global cPILOT approach developed in our laboratory. Global cPILOT analysis allowed six biological
replicates (twelve samples) of APP/PS-1 and WT mouse liver to be measured in a single proteomics
experiment. Advantages of enhanced multiplexing include higher sample throughput, reduced variation
across multiple samples, and lower cost of isobaric tagging reagents in comparison to the cost associated
with repeated isobaric tagging experiments. However, we note that samples are not pooled in our
117

approach until after precursor labeling and isobaric tagging steps are complete. Precursor dimethylation
was performed in parallel and verified differentially-expressed proteins from cPILOT. Necessary
improvements to the approach are focused on increasing the duty cycle of the acquisition to increase
selection of dimethylated pairs. For example, in some cases only the light or heavy dimethylated
precursor ions were selected for MS/MS, which resulted in only half of the reporter ion channels being
detected (although the other precursor in the pair was detected in parent scans). Also, we increased
experimental time by incorporation of the two-tiered DDA approach to improve the likelihood of
selecting dimethylated pairs. This could be reduced significantly by improvements to data acquisition or
by using faster and more sensitive MS instruments such as the Orbitrap Fusion. In comparison to label-
free or other isotopic labeling approaches, the overall experimental time was still significantly shorter.
cPILOT provides the ability to perform high-throughput quantitative analysis of clinical laboratory
samples using readily available chemical reagents. Multiplexing can be further increased by using
iTRAQ 8-plex or TMT 10-plex reagents.
The cPILOT approach was used to successfully identify changes in the liver proteome of
APP/PS-1 mice. Differentially-expressed proteins in the AD liver proteome are involved in fatty acid
metabolism, pyruvate metabolism, redox signaling, transcription and translation processes, and
gluconeogenesis. The changes observed in AD liver have considerable overlap with already reported
metabolic changes in AD brain. Novel findings from this work highlight the potential use of ketone
bodies produced in the liver as an alternative energy source for AD brain. Furthermore, hyperammonia
production from the alanine cycle could lead to hepatic encephalopathy, which is linked with
neurodegeneration. The changes observed in the liver proteome of APP/PS-1 mice provide further
evidence that AD is a metabolic disorder and redox signaling and oxidative stress may be manifested in
the periphery of AD subjects. Future studies that shed insight on the global or systemic changes that
occur in AD are warranted. This work represents a promising step in that direction, which will lead to a
more thorough and better understanding of AD.
118

7.0. EXPANDING VERSITILITY OF cPILOT USING N-N-DIMETHYL LEUCINE ISOBARIC
TAGS
7.1. INTRODUCTION
Stable isotopic labeling in proteomics achieves relative quantitation of two or more samples in a
single experiment using mass spectrometry (MS) [358]. Sample throughput and multiplexing is limited
by the chemical tagging approach and the data collection method. Chapter 1 highlights common
techniques used in proteomics to perform relative quantitation. Precursor isotopic labeling employs a
chemical tag, which creates a mass shift in MS and can multiplex up to five samples in an experiment
using dimethylation [359]. Isobaric tags, such as tandem mass tags (TMT), achieves relative quantitation
by comparing the signals from signature reporter ions, which are detected using tandem mass
spectrometry (MS/MS) [88]. These tags offer multiplexing up to ten samples in a single shotgun
proteomics experiment.
Enhanced multiplexing beyond the sample limitations mentioned above is achieved using
combined precursor isotopic labeling and isobaric tagging (cPILOT) [100, 101]. The work presented in
Chapter 6 demonstrates protein quantitation of twelve samples in a single experiment by combining light
and heavy dimethylation with TMT 6-plex reagents [101]. Multiplexing of 20 samples per experiment is
possible using TMT 10-plex reagents with an Orbitrap resolution of R > 35,000 (m/z = 200) in higher
energy collisional dissociation (HCD) MS/MS [85]. One disadvantage in current cPILOT methodology is
the cost of the TMT reagents. Despite the sample throughput capabilities of isobaric tags, the cost to
perform full multiplexed experiments is $516 and $933 per experiment for TMT 6-plex and 10-plex
reagents, respectively (Thermo Scientific). cPILOT approaches can reduce the costs by half since TMT
reagent vials can be split among light and heavy dimethylated peptides, however routine analysis is still
approximately $250 per 12-plex experiment (Chapter 6). Deuterium isobaric amine reactive tags
119
(DiART) [82] and N-N-dimethyl leucine reagents (DiLeu) are alternative isobaric tagging reagents in
quantitative proteomics. Specifically, DiLeu tags are chemically synthesized by performing
dimethylation on the amine of L-leucine [83]. Additional heavy atoms are incorporated by performing
18O exchange on the carbonyl group. Similar to other isobaric tags, DiLeu tags contain a reporter ion
region (m/z 114-117), a mass balance region, and a peptide reactive group. Currently, these isobaric tags
enhance reporter ion stability and are developed as 4-plex [83], 8-plex [360], and 12-plex reagents [361].
Herein, Chapter 7 demonstrates the incorporation of DiLeu tags into the cPILOT method using bovine
serum albumin. cPILOT using the DiLeu approach is benchmarked against the TMT0 tag and a cost
analysis is presented for multiplexed experiments. The implementation of DiLeu into the cPILOT
approach demonstrates the versatility and accessibility of this high throughput quantitative proteomics
method.
7.2. EXPERIMENTAL
7.2.1. BSA Digestion
Bovine serum albumin (BSA, Sigma) solution was prepared in PBS with 8M urea (1.0 µg/µL)
and digested as previously described [107]. Briefly, 200 µg of BSA was treated with DTT (0.600 mM
final concentration, 37°C, 2 hours), iodoacetamide (1.20 mM final concentration, 0°C, 2 hours), and L-
cysteine (0.600 mM, 25 °C, 30 minutes). Tris buffer (0.2 M tris, 10 mM CaCl2, pH 8.0) was added to the
mixture resulting in a four time volume dilution. TPCK-treated trypsin (Sigma Aldrich) was added to
each sample at 2% w:w enzyme:protein and incubated at 37°C for 24 hours. Samples were quenched by
flash freezing in liquid nitrogen, cleaned using a Waters HLB C18 cartridge, and dried by speed vac.
7.2.2. Activation of Dimethyl Leucine Tag 118
N,N-dimethyl leucine tag 118 (DiLeu118) was synthesized as previously described [83]. To
activate the tag, 11.1 mg of 4-(4,6-dimethoxy-1,3,5-triazin-2-yl)-4-methylmorpholinium tetrafluoroborate
(DMTMM, Sigma) was dissolved in 350 µL 1% N-methylmorpholine in anhydrous dimethylformamide
120
and added (50 µL) to 1.0 mg of DiLeu118. The resulting mixture was stirred, incubated for 30 minutes
(25 °C), and centrifuged (1000x g) to collect supernatant, which contains activated DiLeu118 reagent.
7.2.3. BSA Peptide Labeling
BSA digests were reconstituted in 1% acetic acid solution (0.25 µg/µL) for light and heavy
dimethylation as previously described [100, 101]. Briefly, BSA digests were treated with either
formaldehyde (60 mM)/sodium cyanoborohydride (24 mM) or 13C,2H2-formaldehyde (60 mM)/sodium
cyanoborodeuteride (24 mM) for light and heavy dimethylation, respectively. All samples were
incubated (10 min, 25°C), quenched with 1% NH3 (5 min, 25°C), acidified with 5% formic acid, and
desalted using HLB C18 cartridges. For DiLeu118 tagging, dimethylated peptides were reconstituted in
500 mM triethylammonium bicarbonate (TEAB) buffer (2.0 µg/µL). Anhydrous acetonitrile (1.6x
volume) was added to the peptide solution followed by the activated DiLeu118 mixture (1:15 peptide:tag
mol ratio). Peptides were incubated at 25°C for 3 hours followed by addition of hydroxylamine (50 mM)
to quench the reaction. Samples were diluted two-fold with water, cleaned using SCX spin tips (Protea
Biosciences) and desalted using C18 HLB solid phase extraction cartridges. For TMT0 tagging,
dimethylated BSA peptides were reconstituted in 100 mM TEAB buffer and modified with TMT0 reagent
according to manufacturer instructions (Thermo Scientific). Sample was desalted using C18 HLB solid
phase extraction cartridges.
7.2.4. LC-MS/MS
Peptide samples were reconstituted in 0.1% formic acid solution and separated using nRPLC on a
C18 column (1.7U, 130Å, 300nL/min) [98]. Buffer A was 5% DMSA and 0.1% formic acid (FA) in water
and buffer B was 5% DMSO and 0.1% FA in acetonitrile. Gradient elution was performed as follow
(%A/%B): 95/5 for 5 minutes, ramp to 65/35 over 55 minutes, ramp to 5/95 over 10 minutes followed by
15 minute column re-equilibration for a total run time of 85 minutes. DiLeu cPILOT peptides were
detected using an LTQ-Orbitrap Elite mass spectrometer [49]. Parent MS scans were performed (1E6
121

AGC, 380-1600 m/z, R = 120,000) followed by data dependent acquisition selection of the top 10 most
intense ions for HCD-MS/MS (2.0 Th isolation window, 29% NCE, 0.1 activation time, 5E4 AGC, R =
15,000) and detection using the Orbitrap (scans start at 110 m/z). Charge state screening was enabled and
singly charged peptides were rejected for HCD-MS/MS scan events. The dynamic exclusion was enabled
with a repeat count of one (five seconds, 500 max exclusion list). TMT0 cPILOT BSA peptides were
detected using an LTQ-Orbitrap Velos. Parent MS scans were performed (1E6 AGC, 300-1600 m/z)
followed by data dependent acquisition selection of the top 10 most intense ions for HCD-MS/MS (2.0 Th
isolation window, 29% NCE, 0.1 activation time, 3E5 AGC) and detection using the Orbitrap (scans start
at 110 m/z). Charge state screening was enabled in which singly charged peptides were rejected for
MS/MS scan events. The dynamic exclusion was enabled with a repeat count of one for a duration time
of five seconds (500 max exclusion list). The small duration time for all dynamic exclusion parameters
allows for the collection of more MS/MS events across a peptide extracted ion chromatogram. Since the
samples are single protein digests, a more quantitative data collection method can be employed without
the need for in-depth proteome coverage.
7.2.5. Database Searching
RAW files were searched using SEQUEST HT against the BSA sequence (Uniprot P02769) and
processed using Proteome Discoverer v1.4 (Thermo Scientific). Search parameters included: trypsin
with two missed cleavages, peptide mass range 300-5000 Da, 15 ppm parent mass tolerance, 1 Da
fragmentation tolerance, dynamic modifications of DiLeu118 (+145.132) or TMT0 (+224.152) on lysine
residues, oxidation (+15.995) on methionine, static modifications of light (+28.031) or heavy (+36.076)
dimethylation on the N-terminus, and carbamidomethyl (+57.021) on cysteine. Decoy database searching
was performed using a reverse protein database with FDR settings at 0.01 and 0.05 for high and medium
confidence peptides, respectively. Reporter ion intensities were extracted using Proteome Discoverer
122

software (30 ppm mass tolerance, most confident centroid) at m/z = 118.153 and 126.128 for DiLeu118
and TMT0, respectively.
7.3. RESULTS AND DISCUSSION
7.3.1. cPILOT and N,N-Dimethyl Leucine Isobaric Tags
DiLeu tags are chemically synthesized isobaric tags, which can be employed in MS/MS
quantitative proteomic experiments [83]. Figure 7.1a illustrates the chemical structure of the DiLeu118
reagent. Similar to other isobaric tags (i.e. iTRAQ, TMT), DiLeu118 contains a reporter ion region, a
mass balance region, and a peptide reactive group. Four deuterium atoms are incorporated within the
reporter ion region from dimethylation of L-leucine with 2H-formaldehyde during tag synthesis. In order
to modify peptides, the DiLeu tags must be activated with DMTMM to create a triazide-based reactive
group towards peptide amines [83]. Global cPILOT was previously presented in Chapters 5 and 6 using
TMT0 [100] or 6-plex tags [101]. Figure 7.1b illustrates the cPILOT method with incorporation of the
DiLeu isobaric tags. BSA protein digests are modified with either light or heavy dimethyl groups at low
pH to selectively modify peptide N-termini. After sample clean-up and a buffer exchange, activated
DiLeu118 modifies the lysine residues. The method demonstrates the versatility of cPILOT by the
incorporation of isobaric tagging reagents other than TMT.
7.3.2. BSA with DiLeu cPILOT
To benchmark the incorporation of the DiLeu118 isobaric tag into cPILOT, BSA samples were
prepared using the TMT0 reagent as previously described [100]. Figure 7.2a shows the sample peptide
D(dimethyl)LGEEHFK(TMT0) with light and heavy peaks at m/z 613.823 and 617.844, respectively.
Isolation and HCD fragmentation of light and heavy peptides results in the MS/MS spectra shown in
Figure 7.2b (only low m/z range shown). The presence of the reporter ion corresponding to the TMT0 tag
at m/z 126.13 is detected in the light (left) and heavy (right) HCD-MS/MS spectra similar to previously
presented TMT cPILOT experiments [100]. DiLeu118 based cPILOT samples were prepared using BSA
123
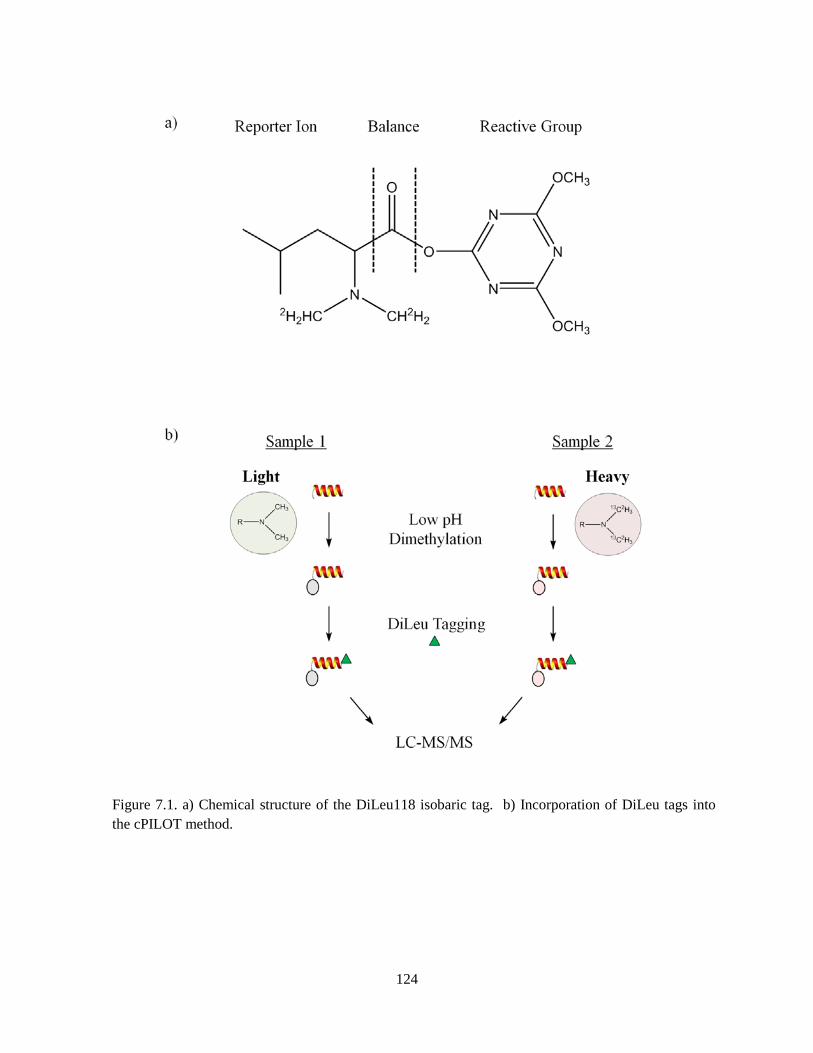
Figure 7.1. a) Chemical structure of the DiLeu118 isobaric tag. b) Incorporation of DiLeu tags into the cPILOT method.
124

Figure 7.2. a) MS spectra for the peptide D(dimethyl)LGEEHFK(TMT0) resulting in light (m/z = 613.823) and heavy peptide (m/z = 617.844) peaks. Isolation and fragmentation of b) light (left) and heavy (right) peptides results in the detection of the TMT0 reporter ion at m/z = 126.13.
125

following the cPILOT procedure shown in Figure 7.1b. The MS spectra for the peptide
D(dimethyl)LGEEHFK(DiLeu118) is shown in Figure 7.3a. Light and heavy dimethylated peptides are
located at m/z 574.319 and 578.340, respectively, which corresponds to the mass shift of 8 Da per
dimethyl modification [100]. DiLeu cPILOT peptides differ in m/z values compared to TMT0 cPILOT
peptides due to the mass differences between the isobaric tags, which are +145.132 Da and +224.152 Da
for DiLeu118 and TMT0, respectively. Figure 7.3b (left) shows the low m/z region of the HCD-MS/MS
spectra resulting from fragmentation of the light peptide at m/z = 574.32, which results in the detection of
the DiLeu118 reporter ion at m/z = 118.15. Isolation and fragmentation of the heavy peptide at m/z =
578.34 also results in the detection of the m/z 118.15 reporter ion peak. These spectra show that the
DiLeu118 reporter ion is detected similarly for the same peptide sequences detected in TMT0 cPILOT
experiments.
We compared BSA proteome coverage and labeling efficiency between TMT-based cPILOT and
DiLeu based cPILOT experiments. Overall, 62 unique peptides were detected in BSA samples tagged
with DiLeu118, which corresponds to 81.6% protein sequence coverage Comparatively, TMT0 cPILOT
peptides produced an 88.3% protein sequence coverage resulting from the identification of 85 unique
peptide sequences. Results show high protein sequence coverage from a large pool of peptides detected
in both methods. To determine labeling efficiency in both methods, RAW files were searched with each
isobaric tag as a dynamic modification, which allows mislabeled lysine residues to be reported in
SEQUEST search results. Spectral count (SC) comparisons were performed between labeled and
unlabeled lysine ending peptides only. Due to the cPILOT design, all Arg-ending peptides (from
digestion with trypsin) will not be modified with an isobaric tag and are not considered in cPILOT data
analysis. Labeling efficiency was 91% and 99% using DiLeu118 and TMT0, respectively. DMTMM
condensation reactions have been reported with 80-100% efficiency [362]. DiLeu activation and peptide
labeling is highly sensitive to hydrolysis in aqueous solutions and can impact labeling efficiency
compared to NHS reactions employed by TMT [83]. Drying agents such as MgSO4 or adjusting the
DMTMM/NMM ratio during DiLeu tag activation may improve labeling efficiency in future experiments.
126

Figure 7.3. a) MS spectra for the peptide D(dimethyl)LGEEHFK(DiLeu118) resulting in light (m/z = 574.319) and heavy peptide (m/z = 578.340) peaks. Isolation and fragmentation of b) light (left) and heavy (right) peptides results in the detection of the DiLeu reporter ion at m/z = 118.15.
127

The experiments performed in Chapter 7 employed data dependent acquisition selecting the top
10 most intense ions for HCD-MS/MS in order to collect more spectra containing the targeted reporter
ion. HCD-MS/MS is more efficient at detecting reporter ion signal in MS/MS spectra compared to MS3
spectra and was employed to verify successful DiLeu chemical labeling by the detection of the 118
reporter ion [294]. Peptides detected with both dimethyl and DiLeu tag modifications indicate a properly
labeled peptide for cPILOT and should produce reporter ions at m/z 118.15 and 126.13 in the HCD-
MS/MS spectra for DiLeu118 and TMT0, respectively. Overall, 32 detected DiLeu cPILOT peptides
overlapped with TMT0 cPILOT peptides. These sample spectra and data demonstrate that DiLeu
chemistry can be successfully incorporated into the cPILOT workflow after low pH dimethylation to
modify lysine amines. Additionally 100% of cPILOT labeled peptides produced the reporter ion in HCD-
MS/MS fragmentation spectra (S/N > 3) for both DiLeu118 and TMT0. These results are consistent with
previous reports of DiLeu tags, whereby a stable reporter ion is produced [83]. We note that in MS3
quantitative multiplexed experiments, there is an expected increase in the number of spectra which
contain missing reporter ions due to sensitivity limitations [100, 294]. Ongoing experiments include MS3
data collection using DiLeu based cPILOT samples with multinotch data collection [330] and
incorporation of DiLeu 12-plex reagents [361].
7.3.3. Cost Analysis
Substituting DiLeu tags in place of TMT tags for cPILOT provides a more cost-effective
multiplexing approach. Table 7.1 compares the cost of TMT 6-plex tags, a 12-plex cPILOT or 20-plex
cPILOT experiment, and a cPILOT experiment using the DiLeu 4-plex tags. Isobaric tags are
approximately 100x the cost of precursor dimethylation reagents per experiment (Table 7.1) making these
reagents the biggest contributor to experimental cost. Implementing less expensive isobaric tags in
cPILOT is imperative to create a more cost-effective method. cPILOT experiments using commercially
available isobaric tags were determined to be over $500 per experiment. Table 7.1 shows that DiLeu tags
128

Tabl
e 7.
1. M
ultip
lexi
ng C
ost
Mul
tiple
xed
Expe
rimen
tTM
T 6-
plex
cPIL
OT
12-p
lexa
cPIL
OT
20-p
lexa
4-pl
ex D
iLeu
cPIL
OT
8-pl
exb
Isob
aric
Tag
Cos
t per
Kit
$2,5
63.0
0$2
,563
.00
$2,8
00.0
0$1
,494
.00
$1,4
94.0
0Ex
perim
ents
per
Kitc
55
310
0d10
0d
Isob
aric
Tag
Cos
t per
Exp
erim
ent
$512
.60
$512
.60
$933
.33
$4.9
8$1
4.94
Dim
ethy
latio
n C
ost p
er E
xper
imen
t$0
.00
$4.9
2$7
.52
$1.8
4$3
.68
Sam
ples
per
exp
erim
ent
612
204
20To
tal S
ampl
es30
6060
400
800
Tota
l Cos
t per
Exp
erim
ent
$512
.60
$517
.52
$940
.85
$21.
18$1
8.62
Cos
t per
Sam
ple
$85.
43$4
3.13
$47.
04$5
.30
$2.3
3a TM
T ta
gsb D
iLeu
tags
c Num
ber o
f max
imum
mul
tiple
exp
erim
ents
d Estim
ated
bas
ed o
n av
erag
e m
ass
of s
ynth
esize
d D
iLeu
tags
129
offer multiplexing at roughly $15 per experiment which is significant savings compared to TMT reagents.
This is attributed to the number of samples that can be labeled using DiLeu tags. Dimethyl leucine tags
are synthesized in quantities that can label approximately 100 reactions per isobaric tag (estimated based
on average product yields), compared to 30 total reactions using TMT tags (6-plex and 10-plex). cPILOT
doubles the amount of samples analyzed per experiment resulting in a cost of $43.13 per 12-plex
experiment. Substitution of the DiLeu 4-plex tags into cPILOT results in approximately a 25-fold
reduction in cost per experiment. Cost can be reduced further using DiLeu 8-plex reagents [360] and 12-
plex reagents [361]. It is also noteworthy that the cost of graduate student hours and synthesis tools were
not factored into the calculation, however long term savings are expected due to the significantly higher
sample throughput offered by DiLeu tags.
7.4. CONCLUSIONS
N,N-dimethyl leucine (DiLeu) isobaric tagging reagents can be synthesized in house and perform
multiplexed experiments at a lower cost compared to TMT tags. DiLeu tags were implemented into the
cPILOT workflow by substitution with TMT isobaric tags at high pH buffer conditions. DiLeu tags
successfully bind to the lysine amines of light or heavy dimethylated peptides with labeling efficiencies >
90% as demonstrated using BSA. Fragmentation of DiLeu cPILOT peptide pairs results in the detection
of the reporter ion at m/z 118.15 and is comparable to the TMT0 reporter ion generated at m/z 126.13.
Future work includes the optimization of tag activation, peptide labeling efficiency, multiplexing cPILOT
with DiLeu tags, and implementation to study biological tissues. Overall, the incorporation of DiLeu tags
into the cPILOT workflow enhances multiplexing, significantly reduces cost, and demonstrates the
versatility and accessibility of this method.
130

8.0. CONCLUDING REMARKS AND FUTURE DIRECTIONS
8.1. SUMMARY
This dissertation presents novel multiplexing techniques in quantitative proteomics that increase
sample throughput in a single experiment. Chapter 2 presents a precursor quantitative technique called
global internal standard technology (GIST), which adds light (-CH3) or heavy (-C2H3) acetyl groups to
peptide amines from two different samples. Relative quantitation is achieved by comparing the peak
areas of light and heavy acetylated peptides. GIST was applied to study the spleen proteome of mice
treated with Adriamycin, which revealed alterations to cell structural integrity and calcium binding
proteins potentially leading to a weakened immune system in response to anti-cancer treatment. Chapter
3 reviews the biological significance and proteomic techniques used to study 3-nitrotyrosine (3NT).
Protein nitration is mediated by the presence of reactive oxygen species when cellular conditions are
under oxidative stress. Neurodegenerative diseases, arthritis, and cardiovascular disease are associated
with 3NT. Identification and quantitation of 3NT is analytically challenging due to the need for selective
and sensitive approaches to isolate 3NT peptides. Chapter 4 presents a novel approach termed
“combined precursor isotopic labeling and isobaric tagging” (cPILOT), which selectively quantifies 3NT-
modified peptides and enhances multiplexing in quantitative proteomics using TMT and iTRAQ tags.
Acetylation (Chapter 2) blocks primary amines on 3NT peptides with light or heavy labels. Afterwards,
3NT is reduced to 3-aminotyrosine, which allows for selective addition of an isobaric tag directly on 3NT
sites. Reporter ion detection in HCD-MS/MS confirms the location of 3NT modifications. In addition,
relative quantitation of 12 and 16 nitrated samples is performed in a single experiment for TMT and
iTRAQ tags, respectively. Due to the overlap of precursor acetylated peak pairs, it was determined that a
mass shift of at least 5 Da is required to generate accurate and reproducible reporter ion quantitation in
MS/MS using cPILOT.
131

Chapter 5 transforms cPILOT from a post-translation modification technique to a global
approach (global cPILOT), which can be applied to protein samples of any origin. This is made possible
by performing light (-2CH3) or heavy (-213C2H3) dimethylation at low pH (~2.5) to selectively modify
peptide N-termini. After sample cleanup and a buffer exchange, high pH conditions (~8.0) allow the
modification of lysine residues with isobaric tags. Peptides exhibit a mass shift of 8 Da per precursor
modification. Isolation and fragmentation of light and heavy dimethylated peaks results in the appearance
of two sets of reporter ions for enhanced multiplexing and relative quantitation. Selective y1-HCD-MS3
targets TMT modified peptides for HCD fragmentation, which increases the number of MS3 spectra
containing reporter ions. Global cPILOT is accurate over a dynamic range of two orders of magnitude
and is reproducible with < 25% CV.
Global cPILOT is applied to the liver proteome of APP/PS-1 mice to study the effects of
metabolism in Alzheimer’s disease (AD) liver in Chapter 6. Strong cation exchange and a multi-tiered
data collection method resulted in 1734 proteins identified in AD liver. Six duplex precursor
dimethylation experiments showed comparable results with 12-plex cPILOT analysis. Differentially-
expressed proteins in AD liver were involved in fatty acid β-oxidation and pyruvate metabolic enzymes,
which have significant overlap with the changes observed in AD brain. For example, increased fatty acid
metabolism can result in the formation of ketone bodies in the liver, which can be a compensatory energy
source in AD brain. While cPILOT successfully expands sample throughput in protein quantitation, the
overall cost for routine cPILOT experiments is high (although less expensive compared to multiple
isobaric tagging experiments). Chapter 7 demonstrates the versatility of cPILOT by incorporating N,N-
dimethyl leucine (DiLeu) isobaric tags into the method. The reporter ion corresponding to the DiLeu118
tags (m/z = 118.15) was detected in HCD-MS/MS spectra resulting from fragmentation of light and heavy
dimethyated peptides. DiLeu tags have potential to provide a more cost-effective cPILOT workflow and
multiplexing of 24 samples in a single experiment.
In summary, novel methods for increasing sample multiplexing in quantitative proteomics have
been developed using stable isotopic labeling. The combination of precursor isotopic labeling with
132

isobaric tags enhances sample throughput. Currently, cPILOT can be adapted in any laboratory to
simultaneously quantify 20 proteomic samples in a single experiment using TMT 10-plex reagents.
cPILOT can be either selective to the PTM 3-nitrotyrosine or be used as a global approach to study
disease conditions. cPILOT saves instrument time, reduces overall experimental cost, and is comparable
to precursor techniques such as dimethylation in large scale experiments.
8.2. FUTURE DIRECTIONS
8.2.1. Improving cPILOT Sample Preparation Techniques
Currently cPILOT requires sample preparation using multiple reaction steps across twelve
samples (using TMT 6-plex reagents) in approximately 3-4 days. While data normalization can account
for errors associated with multiple pipetting steps and separate chemical reactions, emphasis should be
placed on creating a lean workflow. Optimized sample preparation should focus on reduced clean-up
steps and implementation of stable isotopes earlier in the procedure. One solution would be to perform all
chemical reactions in a one pot system. Current cPILOT protocol employs dimethylation in a 1% acetic
acid solution to obtain a reaction pH of 2.5. After dimethylation, the solution pH can be adjusted to 8.0
without sample clean up using base. This is only possible by ensuring a completely quenched
dimethylation reaction prior to pH adjustment so the lysine amines are not modified with excess reagent.
Additionally, the reagent that quenches the reaction should not be reactive with succinimide chemistry
employed by most isobaric tags. This presents a chemical challenge as amines are the best quenching
reagents for dimethylation, however secondary or tertiary amines may be possible since
triethylammonium bicarbonate (TEAB) buffer currently used in TMT protocol does not interfere with the
reaction. Another option is to perform peptide capture and chemical reactions on a resin. Thiol selective
[363] and amine selective [364] peptide immobilization has been previously presented and may provide a
starting point for resin-assisted cPILOT. Hydrophobic interaction-based capture methods may also be
explored such as a high pore size C18 resin. This will provide the ability to perform multiple chemical
reactions without the need for clean-up steps and provide optimal peptide recovery.
133
cPILOT requires manual preparation of twelve samples simultaneously, which introduces
variation prior to instrumental analysis. Additionally as cPILOT continues to develop, it is possible that
more samples will need to be prepared as multiplexing expands, which creates a need for high throughput
sample preparation. This can be accomplished by using a 96 well plate with a liquid handling robotic arm
as shown in Figure 8.1. Automation in sample preparation procedures reduces pipetting mixing errors
and streamlines a continuous workflow for large scale studies. The use of a 96 well plate can also
simultaneously perform multiple reactions (Figure 8.1). For example, the chemistries of multiple
precursor labeling techniques (acetylation, dimethylation) and isobaric tags (TMT, iTRAQ, DiLeu) can be
performed in one experiment. This could allow for cPILOT expansion, incorporation of more channels,
and analysis of more samples prepared with minimal variation.
Reduced cPILOT variation can be achieved using alternative chemical labeling techniques.
Metabolic labeling offers the lowest variation using stable isotopic chemical tags which incorporates
heavy atoms at the earliest point in sample preparation. Metabolic labeling using SILAM (Chapter 1)
adds stable isotopes in animal mouse models with sufficient labeling efficiency [365]. SILAM
experiments are gradually increasing in popularity [365], which includes the newest generation of
NeuCode tags [366]. While ideal, this technique is challenging to implement to new labs due to the high
cost and need for multiple animal generations to obtain optimal labeling efficiency. Alternatively, protein
chemical labeling techniques can provide reduced variation since the reactions occur before digestion.
Samples can be labeled, digested, and chemically modified at the N-terminus with isobaric tags, which
eliminates a post-digestion sample cleanup step. Protein labeling has been experimented in our laboratory
and is shown in Figure 8.2. Here, dimethylation was performed on intact proteins to modify lysine
residues. After digestion with chymotrypsin or Arg-C [367] proteases, the N-terminal is accessible for
isobaric tagging. Figure 8.2a shows the sample peptide A(TMT6)LK(Dimethyl)AWSVAR (Bovine
serum albumin) showing light and heavy dimethylated peptides at m/z 629.897 and 633.919, respectively.
Isolation and fragmentation spectra for both precursor peaks are shown in Figure 8.2b. Target reporter
134

Figure 8.1. Sketch of cPILOT implementation on a 96-well plate with robotic arm attachment for high throughput sample preparation.
135

Figure 8.2. a) Precursor spectra for the protein labeled cPILOT peptide A(TMT6)LK(Dimethyl)AWSVAR showing light (m/z = 629.897) and heavy (m/z = 633.919) precursor peaks. b) HCD-spectra showing isolation and fragmentation light (left) and heavy (right) peptides. c) Alternative protein tagging using isotope coded protein labels. “X” indicates the atoms 12C and 13C for light and heavy ICPL tags, respectively.
ICPL
136

ion ratios are 1:1:4 (TMT 126:127:128) and 4:1:1 (TMT 126:127:128) for light and heavy dimethylated
proteins, respectively. As seen in Figure 8.2b, accurate reporter ion ratios were detected. These
preliminary results are promising, however optimization is required since labeling efficiency was
determined to be approximately 85%. Precursor labeling using isotope coded protein labels (ICPL,
Figure 8.2c) provides labeling efficiency greater than 95% and modifies peptide lysine residues prior to
digestion creating accurate and reproducible quantitation [368, 369]. Future protein labeling based
cPILOT experiments should explore ICPL reagents.
8.2.2. Enhanced Multiplexing
cPILOT expansion can occur by creating additional precursor and isobaric channels to further
enhance the multiplexing shown in Figure 8.3. Currently, cPILOT employs two precursor dimethylated
channels, which can easily be expanded to add a third “middle” channel resulting in a +4 Da mass shift
(Figure 8.3a). Challenges with this approach are ensuring precursor peaks do not overlap so that clean
MS/MS spectra are obtained. To accomplish this, the isolation window during data collection should be
narrowed to 1.5-2.0 Th. It is also likely that peptides with charge states of three or higher may not be
used for analysis due to closely spaced precursors. A different approach to enhanced multiplexing
combines TMT and iTRAQ tags in a single experiment [106]. Peptides modified with different isobaric
tags will not co-elute, which prevents quantitation across different isobaric tags, however enhanced
multiplexing and sample throughput is still achieved. TMT tags produce reporter ions at m/z 126-131,
while iTRAQ tags produce reporter ions at m/z 113-121 (exclude m/z 120). Methods which employ both
sets of tags will perform quantitation of 14 samples in a single MS/MS spectrum (m/z range 113-131) as
illustrated in Figure 8.3b. Multiple precursor labeling techniques could also be applied to one cPILOT
sample, such as acetylation and dimethylation seen in Figure 8.1. These approaches rely on the ability to
perform selective N-terminal modification using succinimide based chemical tags, which should work
since the reaction mechanism begins with nucleophilic attack of the primary amine rather than the
137

Figure 8.3. Increases in sample throughput using cPILOT can be done by a) the addition of more precursor channels or b) combining iTRAQ and TMT isobaric tags in a single experiment.
138
chemical nature of the electrophile. However, increasing multiplexing in quantitative proteomics creates
a paradox. Large scale proteomic experiments typically perform protein identification simultaneously
with relative quantitation. To identify as many unique proteins as possible in a single experiment, data
collection methods employ as many fragmentation scan events as possible, which requires efficient
separations, fast scanning mass spectrometers, careful exclusion parameters, and a high scan count per
instrument cycle. Quantitation requires the collection of multiple points across a single peptide extracted
ion chromatogram. As a result, there is a tradeoff between qualitative and quantitative based experiments.
Increasing multiplexing channels in quantitative proteomics using cPILOT also has a similar tradeoff. As
more precursor channels are added, unique peptide identifications will decrease because MS/MS scan
events are performed on the same peptide sequence to obtain complete quantitative information. cPILOT
can be developed to further enhance multiplexing beyond the current maximum of 20 samples, however a
sample limit will eventually be reached due to the impact in unique protein identification rates. Figure
8.4a shows the scan cycle for a typical cPILOT experiment performed in Chapters 5 and 6. After
precursor MS scans in the Orbitrap, the top seven most intense ions are selected for CID-MS/MS and
HCD-MS3 for each instrument cycle. The LTQ Orbitrap Velos instrument performs approximately
48,000 total scans, which includes 22,400 CID-MS/MS scans during cPILOT experiments (Table 8.1).
As more precursor peaks are added to increase cPILOT multiplexing, MS/MS and MS3 scan events must
be performed on the same peptide sequence in order to obtain complete reporter ion coverage under all
peaks. As seen in Table 8.1, the number of predicted MS/MS scan events on unique precursor ions
decreases proportionally by the number of precursor channels added, which will impact identification.
This can be circumvented by implementing multi-dimensional separations or longer LC gradients (i.e. 7+
hours) because more MS/MS spectra will be acquired. Additionally, this calculation is assuming uniform
selection of all precursor channels (i.e. light, middle, heavy, etc) across the entire experiment, which does
not happen under data dependent acquisition (DDA) conditions since precursor 1:1 ratios have
approximately 20% CV. This leads to the most important future direction in cPILOT method
development, which is changing data collection strategies discussed below.
139

Figure 8.4. a) Scan event process and timing for cPILOT experiments presented in Chapters 5 and 6. b) cPILOT data collection would be improved by performing DDA acquisition according to the most intense precursor pairs as opposed to most intense ions.
140
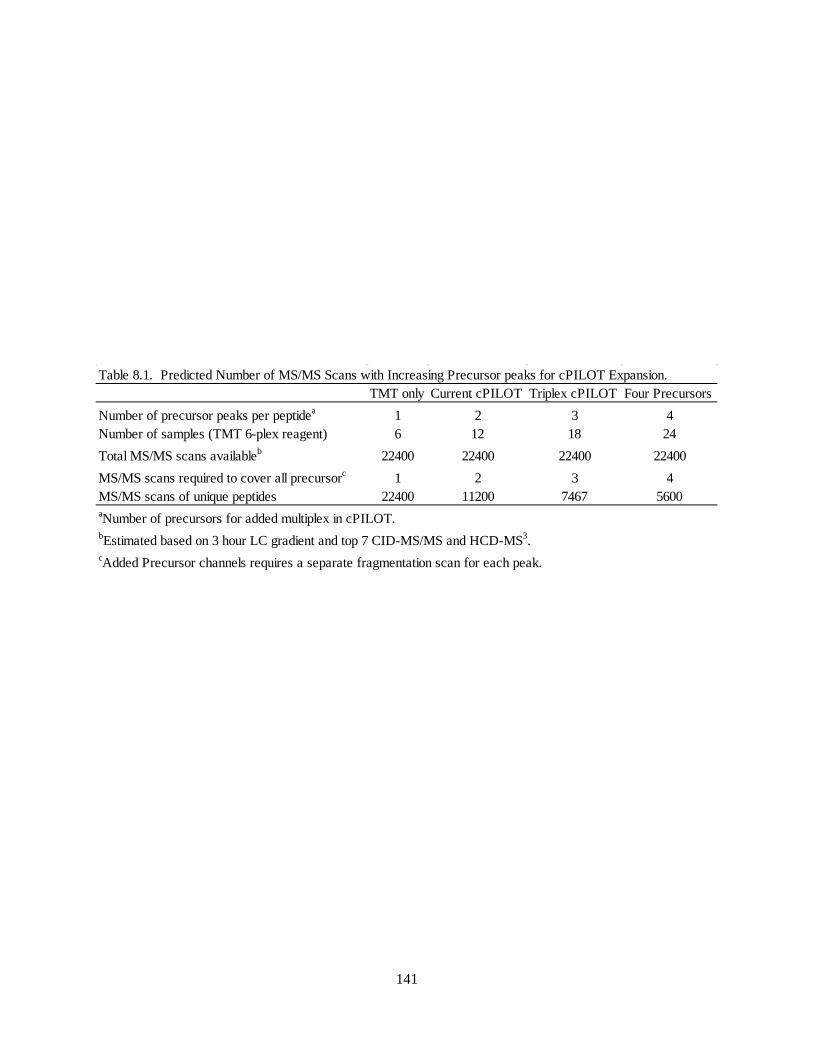
Table 8.1. Predicted Number of MS/MS Scans with Increasing Precursor peaks for cPILOT Expansion.TMT only Current cPILOT Triplex cPILOT Four Precursors
Number of precursor peaks per peptidea 1 2 3 4Number of samples (TMT 6-plex reagent) 6 12 18 24Total MS/MS scans availableb 22400 22400 22400 22400MS/MS scans required to cover all precursorc 1 2 3 4MS/MS scans of unique peptides 22400 11200 7467 5600aNumber of precursors for added multiplex in cPILOT.bEstimated based on 3 hour LC gradient and top 7 CID-MS/MS and HCD-MS3.cAdded Precursor channels requires a separate fragmentation scan for each peak.
141

8.2.3. cPILOT Data Collection and Processing
DDA determines which fragmentation events to perform in real time based on the previous MS
scan. The Orbitrap scans with high resolution and high mass accuracy, which can be exploited to search
for dimethylated peak pairs in real time. After MS scans, isolation and fragmentation should occur on
peaks which are separated by the mass corresponding to dimethylated peptides (Figure 8.4b). This would
create a targeted data collection method specific to cPILOT peptide pairs and eliminate the random nature
of DDA. Selection for MS/MS by peak pairing would also result in additional 12-plex peptide pairs in
current cPILOT experiments since MS/MS events for each peptide pair would be back-to-back scans in
the instrument cycle.
cPILOT presented in Chapters 5 and 6 utilized MS3 to obtain accurate reporter ion quantitation.
While this is powerful in quantitative proteomics, the tradeoff is the need to perform slow HCD-MS3 scan
events (300-400 ms) using the Orbitrap Velos, which reduces the number of proteins identified.
Additionally, reporter ion sensitivity decreases in MS3 scan events compared to MS/MS, which increases
the likelihood of missing reporter ions. The most recent hybrid mass spectrometer, the Orbitrap Fusion
(Thermo Scientific, 2013), can circumvent these limitations by performing ~20 fragmentation
scans/second and synchronous MS3 to enhance sensitivity [52, 330]. The Orbitrap Fusion is an ideal
instrument for MS3 experiments, and increases reporter ion signal in MS3 scan events by 10-fold [330].
Additionally, the enhanced Fourier Transform algorithm recently reported doubles the resolving power of
the Orbitrap under the similar transient lengths currently used [52, 370]. Performing faster high
resolution scan events, synchronous MS3 scans, and collection of more total MS/MS spectra provide the
ability to enhance protein identification in cPILOT experiments.
Ion mobility in quantitative proteomics would also add an additional dimension of separation for
enhanced protein identification, while simultaneously cleaning precursor windows for accurate
quantitation. Global cPILOT currently employs multiple SCX fractions and a two tiered experiment in
cPILOT. Ion mobility has the advantage of both enhancing proteome coverage and reducing co-
fragmentation of neighboring peptides, which eliminates the need to perform MS3 scan events [91, 92].
142
Ion mobility appears to be growing in popularity in proteomic experiments [35, 36] and would provide an
additional separation technique.
Finally, new data processing strategies are required for any enhanced multiplexing. Currently,
commercially available software, such as Proteome Discoverer, cannot process cPILOT data or other
multiplexed strategies properly. For example, Proteome Discoverer combines reporter ion signals
collected by fragmentation of light and heavy peptide ions, which much remain separate to perform
accurate quantitation across all channels. New software technology and processing tools should be
developed to streamline data analysis of cPILOT experiments. Variables to control in cPILOT data
processing include normalization, determination of fold-change cutoffs, statistical analysis and protein
filtering criteria.
8.2.4. Alzheimer’s Disease and the Liver
Chapter 6 revealed alteration in enzymes involved in fatty acid and pyruvate metabolic proteins
in APP/PS-1 mouse liver. To summarize, elevated fatty acid oxidation can lead to the production of
ketone bodies, which travel to other organs as an alternative energy source when glucose metabolism is
low. Reduced glucose metabolism and mitochondrial dysfunction is observed in Alzheimer’s disease
(AD) brain [306]. When glucose levels are low, the brain relies on ketone body and glucose production
through gluconeogenesis as fuel sources, which are processes that occur in the liver [371]. Proteomic
data from Chapter 6 reveals elevations in the alanine cycle, which suggests elevated pyruvate, the
precursor required for gluconeogenesis [101]. The alanine cycle also results in ammonia as a downstream
byproduct, which must be detoxified [342, 372]. Ammonia is elevated in both the blood and brain of AD
patients, which suggest a correlation between ammonia concentrations and cognitive impairment [346].
In order to metabolize and detoxify ammonia from cells, it must be converted to urea and eliminated by
the kidneys. Therefore, a proteomic study on the kidneys of APP/PS-1 mice may reveal alterations in
nitrogen metabolism and the urea cycle. Additionally, alanine aminotransferase (ALT) was elevated in
APP/PS-1 mouse liver and is clinically measured in serum to determine liver failure. Acute liver failure
143

results in altered cognitive function and often results in acute kidney injury [373]. Due to the reported
elevated levels of ammonia coupled with an altered pyruvate/alanine cycle, the kidney is the next logical
peripheral organ to study in APP/PS-1 mice due to its involvement in the urea cycle and ammonia
detoxification. Combining studies of multiple peripheral organs provides the ability to fully trace
metabolism changes throughout AD and would present an in-depth understanding of AD metabolism.
Ketone bodies are an alternative energy source to the brain in states of glucose shortage. These
small molecules are formed when fatty acid metabolism (β-oxidation) is elevated [374]. Experiments
should be performed to evaluate key metabolites in β-oxidation. During fatty acid metabolism, long chain
fatty acids are esterfied with coenzyme A (CoA), then modified with L-carnitine to form acylcarnitines,
which shuttle into the mitochondria matrix for metabolism [375]. Measurements of acylcarnitine
concentrations using mass spectrometry can verify altered fatty acid metabolism in AD liver (Chapter 6).
Derivatization using butanol and HCl adds a butyl group to the carboxylic acid group of acylcarnitines for
MS analysis (Figure 8.5a). It is noteworthy to point out that Figure 8.5 depicts L-carnitine, however the
derivatization is similar for acylcarntines [376, 377]. Butyl derivatization creates hydrophobic
metabolites that allows for optimal reversed phase separation conditions [376]. Additionally, stable
isotopic labeling is performed for differential analysis between WT and AD samples by using 2H10-
butanol. Preliminary targeted experiments are shown in Figure 8.5b. Butyl carnitine exhibits a mass of
218.1726 (singly charged, experiments at R = 100,000), which is detected in MS (Figure 8.5a). Isolation
and fragmentation of this ion results in a signature buytl-acylcarnitine ion at m/z 159.04 in MS/MS
(Figure 8.5b). By selectively scanning for this MS/MS fragment, targeted quantitation of fatty acid
metabolites can be achieved within a complex mixture. Heavy 2H9-acylcarnitine would present a total
mass of approximately 227.2 Da with a signature fragment nine Da higher in mass at m/z 168.2. While
the data shown is collected using the ion trap, the Orbitrap is capable of performing parallel reaction
monitoring (PRM) at high resolution if multiple peaks co-elute during targeted MS/MS analysis [378].
Additionally, the benchtop Q-Exactive would be the optimal instrument of choice due to the quadrupole
filtering prior to Orbitrap analysis for multiplexed selected ion monitoring and PRM data collection [50].
144

Figure 8.5. a) Chemical derivatization of l-carnitine using light or heavy isotopic butanol in HCl. Targeted MS/MS data collection is shown in b) by scanning for the signature butyl carnitine peak at m/z 159.04. The peak at m/z 85.07 is present in both derivatized and underivatized carnitines and can be used to verify the presence of the analyte.
145

Future work should focus on development and optimization of the assay in order to quantify
acylcarnitines in liver and serum from APP/PS-1 mice.
146

APPENDIX A
APPENDIX A Table 2.3. Peptides Detected in Spleen Proteome of ADR-Treated Mice.
APPENDIX A Table 2.4. Peptides Used for Quantitation in Spleen Proteome of ADR-Treated Mice.
147
APPENDIX B
APPENDIX B Table 5.2. Protein Identification in Mouse Brain Tissue .
APPENDIX B Table 5.3. Peptide Identification in Mouse Brain Tissue .
148

APPENDIX C
APPENDIX C Table 6.1. Peptide Identification Using Multi-Tier Data Dependent Acquisition .......... 150
APPENDIX C Table 6.2. Complete List of Identified Proteins Using cPILOT.
APPENDIX C Table 6.3. Complete List of Identified Peptides Using cPILOT.
APPENDIX C Table 6.4. Complete List of Identified Proteins Using Dimethylation.
APPENDIX C Table 6.5. Complete List of Identified Peptides Using Dimethylation .
APPENDIX C Table 6.6. Differentially-Expressed Proteins in cPILOT and Precursor Dimethylation
Experiments
APPENDIX C Figure 6.9. Box Plot of Reporter Ion Signal (log scale) for Top-Ion-HCD-MS3 (black)
and Selective-y1-HCD-MS3 ..................................................................................................................... 151
APPENDIX C Figure 6.10. Venn Diagrams Illustrating Overlap Between cPILOT and Precursor
Dimethylation Experiments ..................................................................................................................... 152
149

Identification Category DDA Top 1 to 7 DDA Top 8 to 14 CombinedTotal PSMs 211453 113064 324517
6-plex PSMsᵃ 144357 72895 217252Unique Peptides 3258 4289 5084
Quantified Peptidesᵇ 2090 2606 306812-plex Peptide Pairsᵈ 1206 1246 1821
ᵃ Identified Peptide Spectra with 6 TMT channelsᵇ Peptides used for protein quantificationᵈ Peptides identified with both precursor dimethyl labels
Appendix C Table 6.1. Peptide Identification Using Multi-Tier Data Dependent Acquisition.
150

Appendix C Figure 6.9. Box plot of reporter ion signal (log scale) for top-ion-HCD-MS3 (black) and selective-y1-HCD-MS3 (red) using an equim olar 12-plex liver digest. Reporter ion signals for each TMT channel correspond to a) light and b) heavy dimethylated peptides. The number of peptides, N, shown in a) are as f ollows [top-ion-HCD-MS3 (selective-y1-HCD-MS3)]: 1637 (510), 1622 (522), 1667 (600), 1597 (524), 1618 (533), 1522 (519), for reporter ions at m/z = 126, 127, 128, 12 9, 130, and 131, respectively. The number of peptides, N, shown in b) are as follows [top-ion-HCD-MS3 (selective-y1-HCD-MS3)]: 1612 (776), 1604 (775), 1637 (827), 1586 ( 763), 1586 (793), 1574 (763), for reporter ions at m/z = 126, 127, 128, 129, 130, and 131, respectively. Only LC-MS/MS was applied to this set of samples.
151

Appendix C Figure 6.10. Venn Diagrams illustrating overl ap between cPILOT and precursor dimethylation experiments regarding the number of uniquely identified a) peptides and b) proteins and c) the number of quantified proteins.
152

REFERENCES
[1] Aebersold, R., Mann, M., Mass spectrometry-based proteomics. Nature 2003, 422, 198-207.
[2] Yates, J. R., 3rd, The revolution and evolution of shotgun proteomics for large-scale proteome
analysis. J Am Chem Soc 2013, 135, 1629-1640.
[3] Hernandez-Fernaud, J. R., Reid, S. E., Neilson, L. J., Zanivan, S., Quantitative mass spectrometry-
based proteomics in angiogenesis. Proteomics Clin Appl 2013, 7, 464-476.
[4] Cox, J., Mann, M., Quantitative, high-resolution proteomics for data-driven systems biology. Annu
Rev Biochem 2011, 80, 273-299.
[5] Lehmann, S., Hoofnagle, A., Hochstrasser, D., Brede, C., et al., Quantitative Clinical Chemistry
Proteomics (qCCP) using mass spectrometry: general characteristics and application. Clin Chem Lab Med
2013, 51, 919-935.
[6] Rabilloud, T., Chevallet, M., Luche, S., Lelong, C., Two-dimensional gel electrophoresis in
proteomics: Past, present and future. J Proteomics 2010, 73, 2064-2077.
[7] Van den Bergh, G., Arckens, L., Fluorescent two-dimensional difference gel electrophoresis unveils
the potential of gel-based proteomics. Curr Opin Biotechnol 2004, 15, 38-43.
[8] Tao, Q., Wang, Z., Zhao, H., Baeyens, W. R., et al., Direct chemiluminescent imaging detection of
human serum proteins in two-dimensional polyacrylamide gel electrophoresis. Proteomics 2007, 7, 3481-
3490.
[9] Patton, W. F., Detection technologies in proteome analysis. J Chromatogr B Analyt Technol Biomed
Life Sci 2002, 771, 3-31.
[10] Han, X., Aslanian, A., Yates, J. R., 3rd, Mass spectrometry for proteomics. Curr Opin Chem Biol
2008, 12, 483-490.
[11] Lopez, J. L., Two-dimensional electrophoresis in proteome expression analysis. J Chromatogr B
Analyt Technol Biomed Life Sci 2007, 849, 190-202.
153

[12] Zhang, Y., Fonslow, B. R., Shan, B., Baek, M. C., Yates, J. R., 3rd, Protein analysis by
shotgun/bottom-up proteomics. Chem Rev 2013, 113, 2343-2394.
[13] Preisler, J., Hu, P., Rejtar, T., Karger, B. L., Capillary electrophoresis--matrix-assisted laser
desorption/ionization time-of-flight mass spectrometry using a vacuum deposition interface. Anal Chem
2000, 72, 4785-4795.
[14] Faserl, K., Sarg, B., Kremser, L., Lindner, H., Optimization and evaluation of a sheathless capillary
electrophoresis-electrospray ionization mass spectrometry platform for peptide analysis: comparison to
liquid chromatography-electrospray ionization mass spectrometry. Anal Chem 2011, 83, 7297-7305.
[15] Hebert, A. S., Richards, A. L., Bailey, D. J., Ulbrich, A., et al., The one hour yeast proteome. Mol
Cell Proteomics 2014, 13, 339-347.
[16] Schrimpf, S. P., Weiss, M., Reiter, L., Ahrens, C. H., et al., Comparative functional analysis of the
Caenorhabditis elegans and Drosophila melanogaster proteomes. PLoS Biol 2009, 7, e48.
[17] Witze, E. S., Old, W. M., Resing, K. A., Ahn, N. G., Mapping protein post-translational
modifications with mass spectrometry. Nat Methods 2007, 4, 798-806.
[18] Junger, M. A., Aebersold, R., Mass spectrometry-driven phosphoproteomics: patterning the systems
biology mosaic. Wiley Interdiscip Rev Dev Biol 2014, 3, 83-112.
[19] Paulsen, C. E., Carroll, K. S., Cysteine-mediated redox signaling: chemistry, biology, and tools for
discovery. Chem Rev 2013, 113, 4633-4679.
[20] Gould, N., Doulias, P. T., Tenopoulou, M., Raju, K., Ischiropoulos, H., Regulation of protein
function and signaling by reversible cysteine S-nitrosylation. J Biol Chem 2013, 288, 26473-26479.
[21] Choudhary, C., Weinert, B. T., Nishida, Y., Verdin, E., Mann, M., The growing landscape of lysine
acetylation links metabolism and cell signalling. Nat Rev Mol Cell Biol 2014, 15, 536-550.
[22] Ma, J., Hart, G. W., O-GlcNAc profiling: from proteins to proteomes. Clin Proteomics 2014, 11, 8.
[23] Finley, D., Ciechanover, A., Varshavsky, A., Ubiquitin as a central cellular regulator. Cell 2004, 116,
S29-32, 22 p following S32.
154

[24] Maes, E., Tirez, K., Baggerman, G., Valkenborg, D., et al., The use of elemental mass spectrometry
in phosphoproteomic applications. Mass Spectrom Rev 2014.
[25] Gault, J., Malosse, C., Machata, S., Millien, C., et al., Complete posttranslational modification
mapping of pathogenic Neisseria meningitidis pilins requires top-down mass spectrometry. Proteomics
2014, 14, 1141-1151.
[26] Butterfield, D. A., Dalle-Donne, I., Redox proteomics. Antioxid Redox Signal 2012, 17, 1487-1489.
[27] Butterfield, D. A., Dalle-Donne, I., Redox proteomics: from protein modifications to cellular
dysfunction and disease. Mass Spectrom Rev 2014, 33, 1-6.
[28] Butterfield, D. A., Gu, L., Di Domenico, F., Robinson, R. A., Mass spectrometry and redox
proteomics: applications in disease. Mass Spectrom Rev 2014, 33, 277-301.
[29] Sultana, R., Perluigi, M., Newman, S. F., Pierce, W. M., et al., Redox proteomic analysis of
carbonylated brain proteins in mild cognitive impairment and early Alzheimer's disease. Antioxid Redox
Signal 2010, 12, 327-336.
[30] Baraibar, M. A., Ladouce, R., Friguet, B., Proteomic quantification and identification of
carbonylated proteins upon oxidative stress and during cellular aging. J Proteomics 2013, 92, 63-70.
[31] Yeo, W. S., Kim, Y. J., Kabir, M. H., Kang, J. W., Kim, K. P., Mass spectrometric analysis of
protein tyrosine nitration in aging and neurodegenerative diseases. Mass Spectrom Rev 2014.
[32] Feeney, M. B., Schoneich, C., Proteomic approaches to analyze protein tyrosine nitration. Antioxid
Redox Signal 2013, 19, 1247-1256.
[33] Butterfield, D. A., Perluigi, M., Reed, T., Muharib, T., et al., Redox proteomics in selected
neurodegenerative disorders: from its infancy to future applications. Antioxid Redox Signal 2012, 17,
1610-1655.
[34] Zhou, H., Ning, Z., Starr, A. E., Abu-Farha, M., Figeys, D., Advancements in top-down proteomics.
Anal Chem 2012, 84, 720-734.
[35] Helm, D. V., J.; Hughes, C. J.; Hahne, H.; Ruprecht, B.; Pachl, F.; Grzyb, A.; Richardson, K.;
Wildgoose, J.; Maier, S. K.; Marx, H.; Wilhelm, M.; Becher, I.; Lemeer, S.; Bantscheff, M.; Langridge, J.
155

I.; Kuster, B., Ion Mobility Tandem Mass Spectrometry Enhances Performance of Bottom-up Proteomics.
mol Cell Proteomics 2014, Article in Press.
[36] Brown, L. M., in: Woods, A. G. D., C. C. (Ed.), Advancements of Mass Spectrometry in Biomedical
Research, Springer International Puiblishing, Springer International Publishing Switzerland 2014, pp. 79-
91.
[37] Simpson, D. C., Smith, R. D., Combining capillary electrophoresis with mass spectrometry for
applications in proteomics. Electrophoresis 2005, 26, 1291-1305.
[38] Righetti, P. G., Sebastiano, R., Citterio, A., Capillary electrophoresis and isoelectric focusing in
peptide and protein analysis. Proteomics 2013, 13, 325-340.
[39] Eng, J. K., McCormack, A. L., Yates, J. R., An approach to correlate tandem mass spectral data of
peptides with amino acid sequences in a protein database. J Am Soc Mass Spectrom 1994, 5, 976-989.
[40] Fenn, J. B., Mann, M., Meng, C. K., Wong, S. F., Whitehouse, C. M., Electrospray ionization for
mass spectrometry of large biomolecules. Science 1989, 246, 64-71.
[41] Karas, M., Hillenkamp, F., Laser desorption ionization of proteins with molecular masses exceeding
10,000 daltons. Anal Chem 1988, 60, 2299-2301.
[42] Takats, Z., Wiseman, J. M., Ifa, D. R., Cooks, R. G., Desorption Electrospray Ionization (DESI)
Analysis of Tryptic Digests/Peptides. CSH Protoc 2008, 2008, pdb prot4993.
[43] Trimpin, S., Inutan, E. D., Herath, T. N., McEwen, C. N., Laserspray ionization, a new atmospheric
pressure MALDI method for producing highly charged gas-phase ions of peptides and proteins directly
from solid solutions. Mol Cell Proteomics 2010, 9, 362-367.
[44] Pagnotti, V. S., Chubatyi, N. D., McEwen, C. N., Solvent assisted inlet ionization: an ultrasensitive
new liquid introduction ionization method for mass spectrometry. Anal Chem 2011, 83, 3981-3985.
[45] Xian, F., Hendrickson, C. L., Marshall, A. G., High resolution mass spectrometry. Anal Chem 2012,
84, 708-719.
[46] Perry, R. H., Cooks, R. G., Noll, R. J., Orbitrap mass spectrometry: instrumentation, ion motion and
applications. Mass Spectrom Rev 2008, 27, 661-699.
156

[47] Page, J. S., Masselon, C. D., Smith, R. D., FTICR mass spectrometry for qualitative and quantitative
bioanalyses. Curr Opin Biotechnol 2004, 15, 3-11.
[48] Olsen, J. V., Schwartz, J. C., Griep-Raming, J., Nielsen, M. L., et al., A dual pressure linear ion trap
Orbitrap instrument with very high sequencing speed. Mol Cell Proteomics 2009, 8, 2759-2769.
[49] Michalski, A., Damoc, E., Lange, O., Denisov, E., et al., Ultra high resolution linear ion trap
Orbitrap mass spectrometer (Orbitrap Elite) facilitates top down LC MS/MS and versatile peptide
fragmentation modes. Mol Cell Proteomics 2012, 11, O111 013698.
[50] Michalski, A., Damoc, E., Hauschild, J. P., Lange, O., et al., Mass spectrometry-based proteomics
using Q Exactive, a high-performance benchtop quadrupole Orbitrap mass spectrometer. Mol Cell
Proteomics 2011, 10, M111 011015.
[51] Denisov, E. D., E.; Lange, O.; Makarov, A., Orbitrap Mass Spectrometry with Resolving Powers
above 1,000,000. International Journal of Mass Spectrometry 2012, 325-327, 80-85.
[52] Senko, M. W., Remes, P. M., Canterbury, J. D., Mathur, R., et al., Novel parallelized
quadrupole/linear ion trap/Orbitrap tribrid mass spectrometer improving proteome coverage and peptide
identification rates. Anal Chem 2013, 85, 11710-11714.
[53] Michalski, A., Cox, J., Mann, M., More than 100,000 detectable peptide species elute in single
shotgun proteomics runs but the majority is inaccessible to data-dependent LC-MS/MS. J Proteome Res
2011, 10, 1785-1793.
[54] Shen, Y., Tolic, N., Xie, F., Zhao, R., et al., Effectiveness of CID, HCD, and ETD with FT MS/MS
for degradomic-peptidomic analysis: comparison of peptide identification methods. J Proteome Res 2011,
10, 3929-3943.
[55] Kocher, T., Pichler, P., Schutzbier, M., Stingl, C., et al., High precision quantitative proteomics
using iTRAQ on an LTQ Orbitrap: a new mass spectrometric method combining the benefits of all. J
Proteome Res 2009, 8, 4743-4752.
[56] Olsen, J. V., Macek, B., Lange, O., Makarov, A., et al., Higher-energy C-trap dissociation for
peptide modification analysis. Nat Methods 2007, 4, 709-712.
157

[57] Dayon, L., Pasquarello, C., Hoogland, C., Sanchez, J. C., Scherl, A., Combining low- and high-
energy tandem mass spectra for optimized peptide quantification with isobaric tags. J Proteomics 2010,
73, 769-777.
[58] MacCoss, M. J., Wu, C. C., Yates, J. R., 3rd, Probability-based validation of protein identifications
using a modified SEQUEST algorithm. Anal Chem 2002, 74, 5593-5599.
[59] Bairoch, A., Apweiler, R., Wu, C. H., Barker, W. C., et al., The Universal Protein Resource
(UniProt). Nucleic Acids Res 2005, 33, D154-159.
[60] Qian, W. J., Liu, T., Monroe, M. E., Strittmatter, E. F., et al., Probability-based evaluation of peptide
and protein identifications from tandem mass spectrometry and SEQUEST analysis: the human proteome.
J Proteome Res 2005, 4, 53-62.
[61] Eng, J. K., Fischer, B., Grossmann, J., Maccoss, M. J., A fast SEQUEST cross correlation algorithm.
J Proteome Res 2008, 7, 4598-4602.
[62] Kall, L., Storey, J. D., MacCoss, M. J., Noble, W. S., Assigning significance to peptides identified by
tandem mass spectrometry using decoy databases. J Proteome Res 2008, 7, 29-34.
[63] Bantscheff, M., Lemeer, S., Savitski, M. M., Kuster, B., Quantitative mass spectrometry in
proteomics: critical review update from 2007 to the present. Anal Bioanal Chem 2012, 404, 939-965.
[64] Wasinger, V. C., Zeng, M., Yau, Y., Current status and advances in quantitative proteomic mass
spectrometry. Int J Proteomics 2013, 2013, 180605.
[65] Bantscheff, M., Schirle, M., Sweetman, G., Rick, J., Kuster, B., Quantitative mass spectrometry in
proteomics: a critical review. Anal Bioanal Chem 2007, 389, 1017-1031.
[66] Schulze, W. X., Usadel, B., Quantitation in mass-spectrometry-based proteomics. Annu Rev Plant
Biol 2010, 61, 491-516.
[67] Xie, F., Liu, T., Qian, W. J., Petyuk, V. A., Smith, R. D., Liquid chromatography-mass
spectrometry-based quantitative proteomics. J Biol Chem 2011, 286, 25443-25449.
[68] Zhu, W., Smith, J. W., Huang, C. M., Mass spectrometry-based label-free quantitative proteomics. J
Biomed Biotechnol 2010, 2010, 840518.
158

[69] Wang, M., You, J., Bemis, K. G., Tegeler, T. J., Brown, D. P., Label-free mass spectrometry-based
protein quantification technologies in proteomic analysis. Brief Funct Genomic Proteomic 2008, 7, 329-
339.
[70] Ong, S. E., Blagoev, B., Kratchmarova, I., Kristensen, D. B., et al., Stable isotope labeling by amino
acids in cell culture, SILAC, as a simple and accurate approach to expression proteomics. Mol Cell
Proteomics 2002, 1, 376-386.
[71] Rauniyar, N., McClatchy, D. B., Yates, J. R., 3rd, Stable isotope labeling of mammals (SILAM) for
in vivo quantitative proteomic analysis. Methods 2013, 61, 260-268.
[72] Wu, C. C., MacCoss, M. J., Howell, K. E., Matthews, D. E., Yates, J. R., 3rd, Metabolic labeling of
mammalian organisms with stable isotopes for quantitative proteomic analysis. Anal Chem 2004, 76,
4951-4959.
[73] Chakraborty, A., Regnier, F. E., Global internal standard technology for comparative proteomics. J
Chromatogr A 2002, 949, 173-184.
[74] Boersema, P. J., Aye, T. T., van Veen, T. A., Heck, A. J., Mohammed, S., Triplex protein
quantification based on stable isotope labeling by peptide dimethylation applied to cell and tissue lysates.
Proteomics 2008, 8, 4624-4632.
[75] Boersema, P. J., Raijmakers, R., Lemeer, S., Mohammed, S., Heck, A. J., Multiplex peptide stable
isotope dimethyl labeling for quantitative proteomics. Nat Protoc 2009, 4, 484-494.
[76] Gygi, S. P., Rist, B., Gerber, S. A., Turecek, F., et al., Quantitative analysis of complex protein
mixtures using isotope-coded affinity tags. Nat Biotechnol 1999, 17, 994-999.
[77] Schmidt, A., Kellermann, J., Lottspeich, F., A novel strategy for quantitative proteomics using
isotope-coded protein labels. Proteomics 2005, 5, 4-15.
[78] Patton, G. C., Sanci, L. A., Sawyer, S. M., Adolescent medicine. Med J Aust 2002, 176, 3.
[79] Bantscheff, M., Kuster, B., Quantitative mass spectrometry in proteomics. Anal Bioanal Chem 2012,
404, 937-938.
159

[80] Becker, G. W., Stable isotopic labeling of proteins for quantitative proteomic applications. Brief
Funct Genomic Proteomic 2008, 7, 371-382.
[81] Nasef, A., Fouillard, L., El-Taguri, A., Lopez, M., Human bone marrow-derived mesenchymal stem
cells. Libyan J Med 2007, 2, 190-201.
[82] Zhang, J., Wang, Y., Li, S., Deuterium isobaric amine-reactive tags for quantitative proteomics. Anal
Chem 2010, 82, 7588-7595.
[83] Xiang, F., Ye, H., Chen, R., Fu, Q., Li, L., N,N-dimethyl leucines as novel isobaric tandem mass tags
for quantitative proteomics and peptidomics. Anal Chem 2010, 82, 2817-2825.
[84] McAlister, G. C., Huttlin, E. L., Haas, W., Ting, L., et al., Increasing the multiplexing capacity of
TMTs using reporter ion isotopologues with isobaric masses. Anal Chem 2012, 84, 7469-7478.
[85] Viner, R. B., R.; Blank, M.; Rogers, J., Increasing the Multiplexing of Protein Quantitation from 6-
to 10-plex with Reporter Ion Isotopologues. Thermo Fisher Scientific Technical Note 2013.
[86] Bantscheff, M., Boesche, M., Eberhard, D., Matthieson, T., et al., Robust and sensitive iTRAQ
quantification on an LTQ Orbitrap mass spectrometer. Mol Cell Proteomics 2008, 7, 1702-1713.
[87] Karp, N. A., Huber, W., Sadowski, P. G., Charles, P. D., et al., Addressing accuracy and precision
issues in iTRAQ quantitation. Mol Cell Proteomics 2010, 9, 1885-1897.
[88] Christoforou, A. L., Lilley, K. S., Isobaric tagging approaches in quantitative proteomics: the ups and
downs. Anal Bioanal Chem 2012, 404, 1029-1037.
[89] Wenger, C. D., Lee, M. V., Hebert, A. S., McAlister, G. C., et al., Gas-phase purification enables
accurate, multiplexed proteome quantification with isobaric tagging. Nat Methods 2011, 8, 933-935.
[90] Wuhr, M., Haas, W., McAlister, G. C., Peshkin, L., et al., Accurate multiplexed proteomics at the
MS2 level using the complement reporter ion cluster. Anal Chem 2012, 84, 9214-9221.
[91] Shliaha, P. V., Jukes-Jones, R., Christoforou, A., Fox, J., et al., Additional precursor purification in
isobaric mass tagging experiments by traveling wave ion mobility separation (TWIMS). J Proteome Res
2014, 13, 3360-3369.
160

[92] Sturm, R. M., Lietz, C. B., Li, L., Improved isobaric tandem mass tag quantification by ion mobility
mass spectrometry. Rapid Commun Mass Spectrom 2014, 28, 1051-1060.
[93] Savitski, M. M., Sweetman, G., Askenazi, M., Marto, J. A., et al., Delayed fragmentation and
optimized isolation width settings for improvement of protein identification and accuracy of isobaric mass
tag quantification on Orbitrap-type mass spectrometers. Anal Chem 2011, 83, 8959-8967.
[94] Ting, L., Rad, R., Gygi, S. P., Haas, W., MS3 eliminates ratio distortion in isobaric multiplexed
quantitative proteomics. Nat Methods 2011, 8, 937-940.
[95] Cihoric, N., Tapia, C., Kruger, K., Aebersold, D. M., et al., IMRT with (1)(8)FDG-PET\CT based
simultaneous integrated boost for treatment of nodal positive cervical cancer. Radiat Oncol 2014, 9, 83.
[96] Qu, J., Young, R., Page, B. J., Shen, X., et al., Reproducible ion-current-based approach for 24-plex
comparison of the tissue proteomes of hibernating versus normal myocardium in swine models. J
Proteome Res 2014, 13, 2571-2584.
[97] Nouri-Nigjeh, E., Sukumaran, S., Tu, C., Li, J., et al., Highly multiplexed and reproducible ion-
current-based strategy for large-scale quantitative proteomics and the application to protein expression
dynamics induced by methylprednisolone in 60 rats. Anal Chem 2014, 86, 8149-8157.
[98] Robinson, R. A., Evans, A. R., Enhanced sample multiplexing for nitrotyrosine-modified proteins
using combined precursor isotopic labeling and isobaric tagging. Anal Chem 2012, 84, 4677-4686.
[99] Evans, A. R. R., R. A. S., Proteomics Quantification of Protein Nitration. Reviews in Analytical
Chemistry 2013, 32, 173-187.
[100] Evans, A. R., Robinson, R. A., Global combined precursor isotopic labeling and isobaric tagging
(cPILOT) approach with selective MS(3) acquisition. Proteomics 2013, 13, 3267-3272.
[101] Evans, A. R. G., L.; Guerrero Jr., R.; Robinson, R. A. S., Global cPILOT Analysis of the APP/PS-1
Liver Proteome. Manuscript Submitted 2014.
[102] Dephoure, N., Gygi, S. P., Hyperplexing: a method for higher-order multiplexed quantitative
proteomics provides a map of the dynamic response to rapamycin in yeast. Sci Signal 2012, 5, rs2.
161
[103] Everley, R. A., Kunz, R. C., McAllister, F. E., Gygi, S. P., Increasing Throughput in Targeted
Proteomics Assays: 54-plex Quantitation in a Single Mass Spectrometry Run. Anal Chem 2013.
[104] Werner, T., Becher, I., Sweetman, G., Doce, C., et al., High-resolution enabled TMT 8-plexing.
Anal Chem 2012, 84, 7188-7194.
[105] Merrill, A. E., Hebert, A. S., MacGilvray, M. E., Rose, C. M., et al., NeuCode Labels for Relative
Protein Quantification. Mol Cell Proteomics 2014, 13, 2503-2512.
[106] Parker, J. B., K.; Zhu, F.; Zhu, N.; Chen, S., cysTMTRAQ - An Integrative Method for Unbiased
Thiol-based Redox Proteomics. Mol Cell Proteomics 2014, Article in Press.
[107] Evans, A. R., Miriyala, S., St Clair, D. K., Butterfield, D. A., Robinson, R. A., Global effects of
adriamycin treatment on mouse splenic protein levels. J Proteome Res 2012, 11, 1054-1064.
[108] Bonadonna, G., Evolving concepts in the systemic adjuvant treatment of breast cancer. Cancer Res
1992, 52, 2127-2137.
[109] Di Marco, A., Gaetani, M., Scarpinato, B., Adriamycin (NSC-123,127): a new antibiotic with
antitumor activity. Cancer Chemother Rep 1969, 53, 33-37.
[110] Chuang, R. Y., Chuang, L. F., Inhibition of chicken myeloblastosis RNA polymerase II activity by
adriamycin. Biochemistry 1979, 18, 2069-2073.
[111] Cummings, J., Anderson, L., Willmott, N., Smyth, J. F., The molecular pharmacology of
doxorubicin in vivo. Eur J Cancer 1991, 27, 532-535.
[112] Buzdar, A. U., Marcus, C., Smith, T. L., Blumenschein, G. R., Early and delayed clinical
cardiotoxicity of doxorubicin. Cancer 1985, 55, 2761-2765.
[113] Aluise, C. D., Sultana, R., Tangpong, J., Vore, M., et al., Chemo brain (chemo fog) as a potential
side effect of doxorubicin administration: role of cytokine-induced, oxidative/nitrosative stress in
cognitive dysfunction. Adv Exp Med Biol 2010, 678, 147-156.
[114] Schagen, S. B., Hamburger, H. L., Muller, M. J., Boogerd, W., van Dam, F. S., Neurophysiological
evaluation of late effects of adjuvant high-dose chemotherapy on cognitive function. J Neurooncol 2001,
51, 159-165.
162

[115] Multani, P., White, C. A., Grillo-Lopez, A., Non-Hodgkin's lymphoma: review of conventional
treatments. Curr Pharm Biotechnol 2001, 2, 279-291.
[116] Handa, K., Sato, S., Generation of free radicals of quinone group-containing anti-cancer chemicals
in NADPH-microsome system as evidenced by initiation of sulfite oxidation. Gan 1975, 66, 43-47.
[117] Chen, Y., Jungsuwadee, P., Vore, M., Butterfield, D. A., St Clair, D. K., Collateral damage in
cancer chemotherapy: oxidative stress in nontargeted tissues. Mol Interv 2007, 7, 147-156.
[118] Aluise, C. D., St Clair, D., Vore, M., Butterfield, D. A., In vivo amelioration of adriamycin induced
oxidative stress in plasma by gamma-glutamylcysteine ethyl ester (GCEE). Cancer Lett 2009, 282, 25-29.
[119] Joshi, G., Sultana, R., Tangpong, J., Cole, M. P., et al., Free radical mediated oxidative stress and
toxic side effects in brain induced by the anti cancer drug adriamycin: insight into chemobrain. Free
Radic Res 2005, 39, 1147-1154.
[120] Llesuy, S. F., Milei, J., Gonzalez Flecha, B. S., Boveris, A., Myocardial damage induced by
doxorubicins: hydroperoxide-initiated chemiluminescence and morphology. Free Radic Biol Med 1990,
8, 259-264.
[121] DeAtley, S. M., Aksenov, M. Y., Aksenova, M. V., Carney, J. M., Butterfield, D. A., Adriamycin
induces protein oxidation in erythrocyte membranes. Pharmacol Toxicol 1998, 83, 62-68.
[122] Qin, X. J., He, W., Hai, C. X., Liang, X., Liu, R., Protection of multiple antioxidants Chinese herbal
medicine on the oxidative stress induced by adriamycin chemotherapy. J Appl Toxicol 2008, 28, 271-282.
[123] Prahalathan, C., Selvakumar, E., Varalakshmi, P., Remedial effect of DL-alpha-lipoic acid against
adriamycin induced testicular lipid peroxidation. Mol Cell Biochem 2004, 267, 209-214.
[124] Kalaiselvi, P., Pragasam, V., Chinnikrishnan, S., Veena, C. K., et al., Counteracting adriamycin-
induced oxidative stress by administration of N-acetyl cysteine and vitamin E. Clin Chem Lab Med 2005,
43, 834-840.
[125] Siegfried, J. A., Kennedy, K. A., Sartorelli, A. C., Tritton, T. R., The role of membranes in the
mechanism of action of the antineoplastic agent adriamycin. Spin-labeling studies with chronically
hypoxic and drug-resistant tumor cells. J Biol Chem 1983, 258, 339-343.
163

[126] Kusuoka, H., Futaki, S., Koretsune, Y., Kitabatake, A., et al., Alterations of intracellular calcium
homeostasis and myocardial energetics in acute adriamycin-induced heart failure. J Cardiovasc
Pharmacol 1991, 18, 437-444.
[127] Singh, V., Singh, S. M., Effect of high cell density on the growth properties of tumor cells: a role in
tumor cytotoxicity of chemotherapeutic drugs. Anticancer Drugs 2007, 18, 1123-1132.
[128] Joshi, G., Aluise, C. D., Cole, M. P., Sultana, R., et al., Alterations in brain antioxidant enzymes
and redox proteomic identification of oxidized brain proteins induced by the anti-cancer drug adriamycin:
implications for oxidative stress-mediated chemobrain. Neuroscience 2010, 166, 796-807.
[129] Joshi, G., Hardas, S., Sultana, R., St Clair, D. K., et al., Glutathione elevation by gamma-glutamyl
cysteine ethyl ester as a potential therapeutic strategy for preventing oxidative stress in brain mediated by
in vivo administration of adriamycin: Implication for chemobrain. J Neurosci Res 2007, 85, 497-503.
[130] Aluise, C. D., Miriyala, S., Noel, T., Sultana, R., et al., 2-Mercaptoethane sulfonate prevents
doxorubicin-induced plasma protein oxidation and TNF-alpha release: implications for the reactive
oxygen species-mediated mechanisms of chemobrain. Free Radic Biol Med 2011, 50, 1630-1638.
[131] Chen, Y., Daosukho, C., Opii, W. O., Turner, D. M., et al., Redox proteomic identification of
oxidized cardiac proteins in adriamycin-treated mice. Free Radic Biol Med 2006, 41, 1470-1477.
[132] Chen, S. T., Pan, T. L., Tsai, Y. C., Huang, C. M., Proteomics reveals protein profile changes in
doxorubicin--treated MCF-7 human breast cancer cells. Cancer Lett 2002, 181, 95-107.
[133] Hammer, E., Bien, S., Salazar, M. G., Steil, L., et al., Proteomic analysis of doxorubicin-induced
changes in the proteome of HepG2cells combining 2-D DIGE and LC-MS/MS approaches. Proteomics
2010, 10, 99-114.
[134] Dong, X., Xiong, L., Jiang, X., Wang, Y., Quantitative proteomic analysis reveals the perturbation
of multiple cellular pathways in jurkat-T cells induced by doxorubicin. J Proteome Res 2010, 9, 5943-
5951.
[135] Jiang, Y. J., Sun, Q., Fang, X. S., Wang, X., Comparative mitochondrial proteomic analysis of Rji
cells exposed to adriamycin. Mol Med 2009, 15, 173-182.
164
[136] Sultana, R., Di Domenico, F., Tseng, M., Cai, J., et al., Doxorubicin-induced thymus senescence. J
Proteome Res 2010, 9, 6232-6241.
[137] Zhang, J. T., Liu, Y., Use of comparative proteomics to identify potential resistance mechanisms in
cancer treatment. Cancer Treat Rev 2007, 33, 741-756.
[138] Peng, X., Gong, F., Xie, G., Zhao, Y., et al., A proteomic investigation into adriamycin chemo-
resistance of human leukemia K562 cells. Mol Cell Biochem 2011, 351, 233-241.
[139] Shen, S. H., Gu, L. J., Liu, P. Q., Ye, X., et al., Comparative proteomic analysis of differentially
expressed proteins between K562 and K562/ADM cells. Chin Med J (Engl) 2008, 121, 463-468.
[140] Zhu, F., Wang, Y., Zeng, S., Fu, X., et al., Involvement of annexin A1 in multidrug resistance of
K562/ADR cells identified by the proteomic study. OMICS 2009, 13, 467-476.
[141] Keenan, J., Murphy, L., Henry, M., Meleady, P., Clynes, M., Proteomic analysis of multidrug-
resistance mechanisms in adriamycin-resistant variants of DLKP, a squamous lung cancer cell line.
Proteomics 2009, 9, 1556-1566.
[142] Brown, K. J., Fenselau, C., Investigation of doxorubicin resistance in MCF-7 breast cancer cells
using shot-gun comparative proteomics with proteolytic 18O labeling. J Proteome Res 2004, 3, 455-462.
[143] Gehrmann, M. L., Fenselau, C., Hathout, Y., Highly altered protein expression profile in the
adriamycin resistant MCF-7 cell line. J Proteome Res 2004, 3, 403-409.
[144] Strong, R., Nakanishi, T., Ross, D., Fenselau, C., Alterations in the mitochondrial proteome of
adriamycin resistant MCF-7 breast cancer cells. J Proteome Res 2006, 5, 2389-2395.
[145] Orsini, F., Pavelic, Z., Mihich, E., Increased primary cell-mediated immunity in culture subsequent
to adriamycin or daunorubicin treatment of spleen donor mice. Cancer Res 1977, 37, 1719-1726.
[146] Ji, J., Chakraborty, A., Geng, M., Zhang, X., et al., Strategy for qualitative and quantitative analysis
in proteomics based on signature peptides. J Chromatogr B Biomed Sci Appl 2000, 745, 197-210.
[147] Mebius, R. E., Kraal, G., Structure and function of the spleen. Nat Rev Immunol 2005, 5, 606-616.
[148] Lee, J. W., Sung, N. Y., Kim, J. K., Kim, J. H., et al., Effect of gamma irradiation on spleen cell
function and cytotoxicity of doxorubicin. Chem Biol Interact 2008, 173, 205-214.
165

[149] Miranda, C. J., Makui, H., Soares, R. J., Bilodeau, M., et al., Hfe deficiency increases susceptibility
to cardiotoxicity and exacerbates changes in iron metabolism induced by doxorubicin. Blood 2003, 102,
2574-2580.
[150] Wu, W. R., Zheng, J. W., Li, N., Bai, H. Q., et al., Immunosuppressive effects of dihydroetorphine,
a potent narcotic analgesic, in dihydroetorphine-dependent mice. Eur J Pharmacol 1999, 366, 261-269.
[151] Zhang, X. Y., Li, W. G., Wu, Y. J., Zheng, T. Z., et al., Proanthocyanidin from grape seeds
potentiates anti-tumor activity of doxorubicin via immunomodulatory mechanism. Int Immunopharmacol
2005, 5, 1247-1257.
[152] Cesta, M. F., Normal structure, function, and histology of the spleen. Toxicol Pathol 2006, 34, 455-
465.
[153] Gerke, V., Moss, S. E., Annexins: from structure to function. Physiol Rev 2002, 82, 331-371.
[154] Zhang, F., Zhang, L., Zhang, B., Wei, X., et al., Anxa2 plays a critical role in enhanced
invasiveness of the multidrug resistant human breast cancer cells. J Proteome Res 2009, 8, 5041-5047.
[155] Munoz, L. E., Frey, B., Pausch, F., Baum, W., et al., The role of annexin A5 in the modulation of
the immune response against dying and dead cells. Curr Med Chem 2007, 14, 271-277.
[156] Gehrmann, M. L., Hathout, Y., Fenselau, C., Evaluation of metabolic labeling for comparative
proteomics in breast cancer cells. J Proteome Res 2004, 3, 1063-1068.
[157] Gelebart, P., Opas, M., Michalak, M., Calreticulin, a Ca2+-binding chaperone of the endoplasmic
reticulum. Int J Biochem Cell Biol 2005, 37, 260-266.
[158] Gold, L. I., Eggleton, P., Sweetwyne, M. T., Van Duyn, L. B., et al., Calreticulin: non-endoplasmic
reticulum functions in physiology and disease. FASEB J 2010, 24, 665-683.
[159] Tufi, R., Panaretakis, T., Bianchi, K., Criollo, A., et al., Reduction of endoplasmic reticulum Ca2+
levels favors plasma membrane surface exposure of calreticulin. Cell Death Differ 2008, 15, 274-282.
[160] Mayur, Y. C., Jagadeesh, S., Thimmaiah, K. N., Targeting calmodulin in reversing multi drug
resistance in cancer cells. Mini Rev Med Chem 2006, 6, 1383-1389.
166

[161] Nicotera, P., Bellomo, G., Orrenius, S., Calcium-mediated mechanisms in chemically induced cell
death. Annu Rev Pharmacol Toxicol 1992, 32, 449-470.
[162] Storck, S., Shukla, M., Dimitrov, S., Bouvet, P., Functions of the histone chaperone nucleolin in
diseases. Subcell Biochem 2007, 41, 125-144.
[163] Bonello, T. T., Stehn, J. R., Gunning, P. W., New approaches to targeting the actin cytoskeleton for
chemotherapy. Future Med Chem 2009, 1, 1311-1331.
[164] Oikonomou, K. G., Zachou, K., Dalekos, G. N., Alpha-actinin: a multidisciplinary protein with
important role in B-cell driven autoimmunity. Autoimmun Rev 2011, 10, 389-396.
[165] Yang, Y. X., Sun, X. F., Cheng, A. L., Zhang, G. Y., et al., Increased expression of HSP27 linked
to vincristine resistance in human gastric cancer cell line. J Cancer Res Clin Oncol 2009, 135, 181-189.
[166] Zhang, L. H., Zhang, X., Roles of GRP78 in physiology and cancer. J Cell Biochem 2010, 110,
1299-1305.
[167] Kubota, H., Hynes, G., Willison, K., The chaperonin containing t-complex polypeptide 1 (TCP-1).
Multisubunit machinery assisting in protein folding and assembly in the eukaryotic cytosol. Eur J
Biochem 1995, 230, 3-16.
[168] Kazerounian, S., Yee, K. O., Lawler, J., Thrombospondins in cancer. Cell Mol Life Sci 2008, 65,
700-712.
[169] Piccard, H., Van den Steen, P. E., Opdenakker, G., Hemopexin domains as multifunctional
liganding modules in matrix metalloproteinases and other proteins. J Leukoc Biol 2007, 81, 870-892.
[170] Hempel, N., Carrico, P. M., Melendez, J. A., Manganese superoxide dismutase (Sod2) and redox-
control of signaling events that drive metastasis. Anticancer Agents Med Chem 2011, 11, 191-201.
[171] Yen, H. C., Oberley, T. D., Vichitbandha, S., Ho, Y. S., St Clair, D. K., The protective role of
manganese superoxide dismutase against adriamycin-induced acute cardiac toxicity in transgenic mice. J
Clin Invest 1996, 98, 1253-1260.
[172] Tokarska-Schlattner, M., Wallimann, T., Schlattner, U., Alterations in myocardial energy
metabolism induced by the anti-cancer drug doxorubicin. C R Biol 2006, 329, 657-668.
167

[173] Lee, J. R., Lee, S. J., Kim, T. W., Kim, J. K., et al., Chemical approach for specific enrichment and
mass analysis of nitrated peptides. Anal Chem 2009, 81, 6620-6626.
[174] Yamakura, F., Taka, H., Fujimura, T., Murayama, K., Inactivation of human manganese-superoxide
dismutase by peroxynitrite is caused by exclusive nitration of tyrosine 34 to 3-nitrotyrosine. J Biol Chem
1998, 273, 14085-14089.
[175] Ferrante, R. J., Shinobu, L. A., Schulz, J. B., Matthews, R. T., et al., Increased 3-nitrotyrosine and
oxidative damage in mice with a human copper/zinc superoxide dismutase mutation. Ann Neurol 1997,
42, 326-334.
[176] Kong, S. K., Yim, M. B., Stadtman, E. R., Chock, P. B., Peroxynitrite disables the tyrosine
phosphorylation regulatory mechanism: Lymphocyte-specific tyrosine kinase fails to phosphorylate
nitrated cdc2(6-20)NH2 peptide. Proc Natl Acad Sci U S A 1996, 93, 3377-3382.
[177] Squier, T. C., Oxidative stress and protein aggregation during biological aging. Exp Gerontol 2001,
36, 1539-1550.
[178] Peluffo, G., Radi, R., Biochemistry of protein tyrosine nitration in cardiovascular pathology.
Cardiovasc Res 2007, 75, 291-302.
[179] Nemirovskiy, O. V., Radabaugh, M. R., Aggarwal, P., Funckes-Shippy, C. L., et al., Plasma 3-
nitrotyrosine is a biomarker in animal models of arthritis: Pharmacological dissection of iNOS' role in
disease. Nitric Oxide 2009, 20, 150-156.
[180] Butterfield, D. A., Reed, T., Sultana, R., Roles of 3-nitrotyrosine- and 4-hydroxynonenal-modified
brain proteins in the progression and pathogenesis of Alzheimer's disease. Free Radic Res 2011, 45, 59-
72.
[181] Reynolds, M. R., Berry, R. W., Binder, L. I., Nitration in neurodegeneration: deciphering the
"Hows" "nYs". Biochemistry 2007, 46, 7325-7336.
[182] Good, P. F., Hsu, A., Werner, P., Perl, D. P., Olanow, C. W., Protein nitration in Parkinson's
disease. J Neuropathol Exp Neurol 1998, 57, 338-342.
168

[183] Butterfield, D. A., Reed, T., Newman, S. F., Sultana, R., Roles of amyloid beta-peptide-associated
oxidative stress and brain protein modifications in the pathogenesis of Alzheimer's disease and mild
cognitive impairment. Free Radic Biol Med 2007, 43, 658-677.
[184] Sowell, R. A. B., D.A., in: Landow, M. L. (Ed.), Cognitive Impairment: Causes, Diagnosis and
Treatment, Nova Science Publishers Inc, Hauppauge, NY 2010.
[185] Sultana, R., Reed, T., Perluigi, M., Coccia, R., et al., Proteomic identification of nitrated brain
proteins in amnestic mild cognitive impairment: a regional study. J Cell Mol Med 2007, 11, 839-851.
[186] Reed, T. T., Pierce, W. M., Jr., Turner, D. M., Markesbery, W. R., Butterfield, D. A., Proteomic
identification of nitrated brain proteins in early Alzheimer's disease inferior parietal lobule. J Cell Mol
Med 2009, 13, 2019-2029.
[187] Castegna, A., Thongboonkerd, V., Klein, J. B., Lynn, B., et al., Proteomic identification of nitrated
proteins in Alzheimer's disease brain. J Neurochem 2003, 85, 1394-1401.
[188] Mazzola, J. L., Sirover, M. A., Reduction of glyceraldehyde-3-phosphate dehydrogenase activity in
Alzheimer's disease and in Huntington's disease fibroblasts. J Neurochem 2001, 76, 442-449.
[189] Aksenova, M., Butterfield, D. A., Zhang, S. X., Underwood, M., Geddes, J. W., Increased protein
oxidation and decreased creatine kinase BB expression and activity after spinal cord contusion injury. J
Neurotrauma 2002, 19, 491-502.
[190] Sultana, R. S., R.A.; Butterfield, D.A., in: Veasey, S. C. (Ed.), Oxidative Neural Injury, Humana
Press Inc., New York, NY 2009, pp. 137-157.
[191] Coleman, P. D., Flood, D. G., Neuron numbers and dendritic extent in normal aging and
Alzheimer's disease. Neurobiol Aging 1987, 8, 521-545.
[192] Sly, W. S., Hu, P. Y., Human carbonic anhydrases and carbonic anhydrase deficiencies. Annu Rev
Biochem 1995, 64, 375-401.
[193] Bubber, P., Haroutunian, V., Fisch, G., Blass, J. P., Gibson, G. E., Mitochondrial abnormalities in
Alzheimer brain: mechanistic implications. Ann Neurol 2005, 57, 695-703.
169
[194] Castegna, A., Lauderback, C. M., Mohmmad-Abdul, H., Butterfield, D. A., Modulation of
phospholipid asymmetry in synaptosomal membranes by the lipid peroxidation products, 4-
hydroxynonenal and acrolein: implications for Alzheimer's disease. Brain Res 2004, 1004, 193-197.
[195] Danielson, S. R., Held, J. M., Schilling, B., Oo, M., et al., Preferentially increased nitration of
alpha-synuclein at tyrosine-39 in a cellular oxidative model of Parkinson's disease. Anal Chem 2009, 81,
7823-7828.
[196] Jovanovic, S. V., Clements, D., MacLeod, K., Biomarkers of oxidative stress are significantly
elevated in Down syndrome. Free Radic Biol Med 1998, 25, 1044-1048.
[197] Browne, S. E., Ferrante, R. J., Beal, M. F., Oxidative stress in Huntington's disease. Brain Pathol
1999, 9, 147-163.
[198] Cookson, M. R., Shaw, P. J., Oxidative stress and motor neurone disease. Brain Pathol 1999, 9,
165-186.
[199] Abe, K., Pan, L. H., Watanabe, M., Kato, T., Itoyama, Y., Induction of nitrotyrosine-like
immunoreactivity in the lower motor neuron of amyotrophic lateral sclerosis. Neurosci Lett 1995, 199,
152-154.
[200] Horiguchi, T., Uryu, K., Giasson, B. I., Ischiropoulos, H., et al., Nitration of tau protein is linked to
neurodegeneration in tauopathies. Am J Pathol 2003, 163, 1021-1031.
[201] Turko, I. V., Murad, F., Protein nitration in cardiovascular diseases. Pharmacol Rev 2002, 54, 619-
634.
[202] Lee, J. R., Kim, J. K., Lee, S. J., Kim, K. P., Role of protein tyrosine nitration in neurodegenerative
diseases and atherosclerosis. Arch Pharm Res 2009, 32, 1109-1118.
[203] Upmacis, R. K., Atherosclerosis: A Link Between Lipid Intake and Protein Tyrosine Nitration.
Lipid Insights 2008, 2, 75-88.
[204] Surmeli, N. B., Litterman, N. K., Miller, A. F., Groves, J. T., Peroxynitrite Mediates Active Site
Tyrosine Nitration in Manganese Superoxide Dismutase. Evidence of a Role for the Carbonate Radical
Anion. J Am Chem Soc 2010.
170

[205] Leeuwenburgh, C., Hardy, M. M., Hazen, S. L., Wagner, P., et al., Reactive nitrogen intermediates
promote low density lipoprotein oxidation in human atherosclerotic intima. J Biol Chem 1997, 272, 1433-
1436.
[206] Sandhu, J. K., Robertson, S., Birnboim, H. C., Goldstein, R., Distribution of protein nitrotyrosine in
synovial tissues of patients with rheumatoid arthritis and osteoarthritis. J Rheumatol 2003, 30, 1173-1181.
[207] Turko, I. V., Li, L., Aulak, K. S., Stuehr, D. J., et al., Protein tyrosine nitration in the mitochondria
from diabetic mouse heart. Implications to dysfunctional mitochondria in diabetes. J Biol Chem 2003,
278, 33972-33977.
[208] Azad, N., Rojanasakul, Y., Vallyathan, V., Inflammation and lung cancer: roles of reactive
oxygen/nitrogen species. J Toxicol Environ Health B Crit Rev 2008, 11, 1-15.
[209] Pacher, P., Beckman, J. S., Liaudet, L., Nitric oxide and peroxynitrite in health and disease. Physiol
Rev 2007, 87, 315-424.
[210] Marshall, A., Lutfeaili, R., Raval, A., Chakravarti, D. N., Chakravarti, B., Differential hepatic
protein tyrosine nitration of mouse due to aging - Effect on mitochondrial energy metabolism, quality
control machinery of the endoplasmic reticulum and metabolism of drugs. Biochem Biophys Res Commun
2012.
[211] Zingarelli, B., Szabo, C., Salzman, A. L., Reduced oxidative and nitrosative damage in murine
experimental colitis in the absence of inducible nitric oxide synthase. Gut 1999, 45, 199-209.
[212] Thangaswamy, S., Bridenbaugh, E. A., Gashev, A. A., Evidence of increased oxidative stress in
aged mesenteric lymphatic vessels. Lymphat Res Biol 2012, 10, 53-62.
[213] Bronte, V., Kasic, T., Gri, G., Gallana, K., et al., Boosting antitumor responses of T lymphocytes
infiltrating human prostate cancers. J Exp Med 2005, 201, 1257-1268.
[214] Birnboim, H. C., Lemay, A. M., Lam, D. K., Goldstein, R., Webb, J. R., Cutting edge: MHC class
II-restricted peptides containing the inflammation-associated marker 3-nitrotyrosine evade central
tolerance and elicit a robust cell-mediated immune response. J Immunol 2003, 171, 528-532.
171
[215] Bayden, A. S., Yakovlev, V. A., Graves, P. R., Mikkelsen, R. B., Kellogg, G. E., Factors
influencing protein tyrosine nitration--structure-based predictive models. Free Radic Biol Med 2011, 50,
749-762.
[216] Kissner, R., Nauser, T., Bugnon, P., Lye, P. G., Koppenol, W. H., Formation and properties of
peroxynitrite as studied by laser flash photolysis, high-pressure stopped-flow technique, and pulse
radiolysis. Chem Res Toxicol 1997, 10, 1285-1292.
[217] Radi, R., Nitric oxide, oxidants, and protein tyrosine nitration. Proc Natl Acad Sci U S A 2004, 101,
4003-4008.
[218] Abello, N., Kerstjens, H. A., Postma, D. S., Bischoff, R., Protein tyrosine nitration: selectivity,
physicochemical and biological consequences, denitration, and proteomics methods for the identification
of tyrosine-nitrated proteins. J Proteome Res 2009, 8, 3222-3238.
[219] Alvarez, B., Radi, R., Peroxynitrite reactivity with amino acids and proteins. Amino Acids 2003, 25,
295-311.
[220] Radi, R., Protein tyrosine nitration: biochemical mechanisms and structural basis of functional
effects. Acc Chem Res 2013, 46, 550-559.
[221] Monteiro, H. P., Arai, R. J., Travassos, L. R., Protein tyrosine phosphorylation and protein tyrosine
nitration in redox signaling. Antioxid Redox Signal 2008, 10, 843-889.
[222] Guo, W., Adachi, T., Matsui, R., Xu, S., et al., Quantitative assessment of tyrosine nitration of
manganese superoxide dismutase in angiotensin II-infused rat kidney. Am J Physiol Heart Circ Physiol
2003, 285, H1396-1403.
[223] Rubbo, H., Radi, R., Protein and lipid nitration: role in redox signaling and injury. Biochim Biophys
Acta 2008, 1780, 1318-1324.
[224] Spickett, C. M., Pitt, A. R., Protein oxidation: role in signalling and detection by mass
spectrometry. Amino Acids 2012, 42, 5-21.
[225] Sokolovsky, M., Riordan, J. F., Vallee, B. L., Conversion of 3-nitrotyrosine to 3-aminotyrosine in
peptides and proteins. Biochem Biophys Res Commun 1967, 27, 20-25.
172
[226] Souza, J. M., Peluffo, G., Radi, R., Protein tyrosine nitration--functional alteration or just a
biomarker? Free Radic Biol Med 2008, 45, 357-366.
[227] Casagrande, S., Bonetto, V., Fratelli, M., Gianazza, E., et al., Glutathionylation of human
thioredoxin: a possible crosstalk between the glutathione and thioredoxin systems. Proc Natl Acad Sci U
S A 2002, 99, 9745-9749.
[228] Uchida, K., Stadtman, E. R., Covalent attachment of 4-hydroxynonenal to glyceraldehyde-3-
phosphate dehydrogenase. A possible involvement of intra- and intermolecular cross-linking reaction. J
Biol Chem 1993, 268, 6388-6393.
[229] Adibhatla, R. M., Hatcher, J. F., Lipid oxidation and peroxidation in CNS health and disease: from
molecular mechanisms to therapeutic opportunities. Antioxid Redox Signal 2010, 12, 125-169.
[230] Yates, J. R., Ruse, C. I., Nakorchevsky, A., Proteomics by mass spectrometry: approaches,
advances, and applications. Annu Rev Biomed Eng 2009, 11, 49-79.
[231] Li, B., Held, J. M., Schilling, B., Danielson, S. R., Gibson, B. W., Confident identification of 3-
nitrotyrosine modifications in mass spectral data across multiple mass spectrometry platforms. J
Proteomics 2011, 74, 2510-2521.
[232] Dekker, F., Abello, N., Wisastra, R., Bischoff, R., Enrichment and detection of tyrosine-nitrated
proteins. Curr Protoc Protein Sci 2012, Chapter 14, Unit 14 13.
[233] Helman, M., Givol, D., Isolation of nitrotyrosine-containing peptides by using an insoluble-
antibody column. Biochem J 1971, 125, 971-974.
[234] Zhan, X., Desiderio, D. M., Nitroproteins from a human pituitary adenoma tissue discovered with a
nitrotyrosine affinity column and tandem mass spectrometry. Anal Biochem 2006, 354, 279-289.
[235] Nuriel, T., Deeb, R. S., Hajjar, D. P., Gross, S. S., Protein 3-nitrotyrosine in complex biological
samples: quantification by high-pressure liquid chromatography/electrochemical detection and emergence
of proteomic approaches for unbiased identification of modification sites. Methods Enzymol 2008, 441, 1-
17.
173

[236] Nikov, G., Bhat, V., Wishnok, J. S., Tannenbaum, S. R., Analysis of nitrated proteins by
nitrotyrosine-specific affinity probes and mass spectrometry. Anal Biochem 2003, 320, 214-222.
[237] Abello, N., Barroso, B., Kerstjens, H. A., Postma, D. S., Bischoff, R., Chemical labeling and
enrichment of nitrotyrosine-containing peptides. Talanta 2010, 80, 1503-1512.
[238] Zhang, Q., Qian, W. J., Knyushko, T. V., Clauss, T. R., et al., A method for selective enrichment
and analysis of nitrotyrosine-containing peptides in complex proteome samples. J Proteome Res 2007, 6,
2257-2268.
[239] Kim, J. K., Lee, J. R., Kang, J. W., Lee, S. J., et al., Selective enrichment and mass spectrometric
identification of nitrated peptides using fluorinated carbon tags. Anal Chem 2011, 83, 157-163.
[240] Amoresano, A., Chiappetta, G., Pucci, P., D'Ischia, M., Marino, G., Bidimensional tandem mass
spectrometry for selective identification of nitration sites in proteins. Anal Chem 2007, 79, 2109-2117.
[241] Dremina, E. S., Li, X., Galeva, N. A., Sharov, V. S., et al., A methodology for simultaneous
fluorogenic derivatization and boronate affinity enrichment of 3-nitrotyrosine-containing peptides. Anal
Biochem 2011, 418, 184-196.
[242] Ghesquiere, B., Colaert, N., Helsens, K., Dejager, L., et al., In vitro and in vivo protein-bound
tyrosine nitration characterized by diagonal chromatography. Mol Cell Proteomics 2009, 8, 2642-2652.
[243] Brown, J. R., Hartley, B. S., Location of disulphide bridges by diagonal paper electrophoresis. The
disulphide bridges of bovine chymotrypsinogen A. Biochem J 1966, 101, 214-228.
[244] Oldreive, C., Bradley, N., Bruckdorfer, R., Rice-Evans, C., Lack of influence of dietary
nitrate/nitrite on plasma nitrotyrosine levels measured using a competitive inhibition of binding ELISA
assay. Free Radic Res 2001, 35, 377-386.
[245] Khan, J., Brennand, D. M., Bradley, N., Gao, B., et al., 3-Nitrotyrosine in the proteins of human
plasma determined by an ELISA method. Biochem J 1998, 330 ( Pt 2), 795-801.
[246] Wayenberg, J. L., Ransy, V., Vermeylen, D., Damis, E., Bottari, S. P., Nitrated plasma albumin as a
marker of nitrative stress and neonatal encephalopathy in perinatal asphyxia. Free Radic Biol Med 2009,
47, 975-982.
174

[247] Bayir, H., Kagan, V. E., Clark, R. S., Janesko-Feldman, K., et al., Neuronal NOS-mediated
nitration and inactivation of manganese superoxide dismutase in brain after experimental and human
brain injury. J Neurochem 2007, 101, 168-181.
[248] Ceriello, A., Mercuri, F., Quagliaro, L., Assaloni, R., et al., Detection of nitrotyrosine in the
diabetic plasma: evidence of oxidative stress. Diabetologia 2001, 44, 834-838.
[249] Jin, H., Webb-Robertson, B. J., Peterson, E. S., Tan, R., et al., Smoking, COPD, and 3-nitrotyrosine
levels of plasma proteins. Environ Health Perspect 2011, 119, 1314-1320.
[250] Weber, D., Kneschke, N., Grimm, S., Bergheim, I., et al., Rapid and sensitive determination of
protein-nitrotyrosine by ELISA: Application to human plasma. Free Radic Res 2012, 46, 276-285.
[251] Qu, L. N., Yang, T. B., Yuan, Y. H., Zhong, P., et al., A novel competitive ELISA for both free and
protein-bound nitrotyrosine. Hybrid Hybridomics 2003, 22, 401-406.
[252] Pan, S., Aebersold, R., Chen, R., Rush, J., et al., Mass spectrometry based targeted protein
quantification: methods and applications. J Proteome Res 2009, 8, 787-797.
[253] Duncan, M. W., A review of approaches to the analysis of 3-nitrotyrosine. Amino Acids 2003, 25,
351-361.
[254] Righetti, P. G. A., P.; Simo, C.; Citterio, A., in: Agrawal, G. K. R., R. (Ed.), Plant Proteomics:
Technologies, Strategies, and Applications 2008, pp. 9-31.
[255] Liu, F., Xiong, J., Huang, G. Y., Wang, W., [Study on the underlying mechanism of acupuncture in
regulating neuroendocrine activity in dysmenorrhea rats]. Zhen Ci Yan Jiu 2009, 34, 3-8.
[256] Viera, L., Ye, Y. Z., Estevez, A. G., Beckman, J. S., Immunohistochemical methods to detect
nitrotyrosine. Methods Enzymol 1999, 301, 373-381.
[257] Franco Mdo, C., Fortes, Z. B., Akamine, E. H., Kawamoto, E. M., et al., Tetrahydrobiopterin
improves endothelial dysfunction and vascular oxidative stress in microvessels of intrauterine
undernourished rats. J Physiol 2004, 558, 239-248.
[258] Morrissey, B. M., Schilling, K., Weil, J. V., Silkoff, P. E., Rodman, D. M., Nitric oxide and protein
nitration in the cystic fibrosis airway. Arch Biochem Biophys 2002, 406, 33-39.
175

[259] Soderling, A. S., Hultman, L., Delbro, D., Hojrup, P., Caidahl, K., Reduction of the nitro group
during sample preparation may cause underestimation of the nitration level in 3-nitrotyrosine
immunoblotting. J Chromatogr B Analyt Technol Biomed Life Sci 2007, 851, 277-286.
[260] Bigelow, D. J., Qian, W. J., Quantitative proteome mapping of nitrotyrosines. Methods Enzymol
2008, 440, 191-205.
[261] Wisastra, R., Poelstra, K., Bischoff, R., Maarsingh, H., et al., Antibody-free detection of protein
tyrosine nitration in tissue sections. Chembiochem 2011, 12, 2016-2020.
[262] Liu, H., Sadygov, R. G., Yates, J. R., 3rd, A model for random sampling and estimation of relative
protein abundance in shotgun proteomics. Anal Chem 2004, 76, 4193-4201.
[263] Smith, R. D., Anderson, G. A., Lipton, M. S., Pasa-Tolic, L., et al., An accurate mass tag strategy
for quantitative and high-throughput proteome measurements. Proteomics 2002, 2, 513-523.
[264] Willard, B. B., Ruse, C. I., Keightley, J. A., Bond, M., Kinter, M., Site-specific quantitation of
protein nitration using liquid chromatography/tandem mass spectrometry. Anal Chem 2003, 75, 2370-
2376.
[265] Ruse, C. I., Willard, B., Jin, J. P., Haas, T., et al., Quantitative dynamics of site-specific protein
phosphorylation determined using liquid chromatography electrospray ionization mass spectrometry. Anal
Chem 2002, 74, 1658-1664.
[266] Chen, H. J., Chiu, W. L., Simultaneous detection and quantification of 3-nitrotyrosine and 3-
bromotyrosine in human urine by stable isotope dilution liquid chromatography tandem mass
spectrometry. Toxicol Lett 2008, 181, 31-39.
[267] Chen, H. J., Chen, Y. C., Reactive nitrogen oxide species-induced post-translational modifications
in human hemoglobin and the association with cigarette smoking. Anal Chem 2012, 84, 7881-7890.
[268] Riggs, L., Seeley, E. H., Regnier, F. E., Quantification of phosphoproteins with global internal
standard technology. J Chromatogr B Analyt Technol Biomed Life Sci 2005, 817, 89-96.
176
[269] Tsumoto, H., Taguchi, R., Kohda, K., Efficient identification and quantification of peptides
containing nitrotyrosine by matrix-assisted laser desorption/ionization time-of-flight mass spectrometry
after derivatization. Chem Pharm Bull (Tokyo) 2010, 58, 488-494.
[270] Feeney, M. B., Schoneich, C., Proteomic Approaches to Analyze Protein Tyrosine Nitration.
Antioxid Redox Signal 2012.
[271] Haandel, L. V. K., J.; Li, X.; Schoneich, C.; Stobaugh, J.F., Phenylisothiocyanate as a Multiple
Chemical Dimension Reagent for the Relative Quantitation of Protein Nitrotyrosine. Chromatographia
008, 68, 507-516.
[272] Zhang, R., Regnier, F. E., Minimizing resolution of isotopically coded peptides in comparative
proteomics. J Proteome Res 2002, 1, 139-147.
[273] Thompson, A., Schafer, J., Kuhn, K., Kienle, S., et al., Tandem mass tags: a novel quantification
strategy for comparative analysis of complex protein mixtures by MS/MS. Anal Chem 2003, 75, 1895-
1904.
[274] Ross, P. L., Huang, Y. N., Marchese, J. N., Williamson, B., et al., Multiplexed protein quantitation
in Saccharomyces cerevisiae using amine-reactive isobaric tagging reagents. Mol Cell Proteomics 2004,
3, 1154-1169.
[275] Chiappetta, G., Corbo, C., Palmese, A., Galli, F., et al., Quantitative identification of protein
nitration sites. Proteomics 2009, 9, 1524-1537.
[276] Petersson, A. S., Steen, H., Kalume, D. E., Caidahl, K., Roepstorff, P., Investigation of tyrosine
nitration in proteins by mass spectrometry. J Mass Spectrom 2001, 36, 616-625.
[277] Sarver, A., Scheffler, N. K., Shetlar, M. D., Gibson, B. W., Analysis of peptides and proteins
containing nitrotyrosine by matrix-assisted laser desorption/ionization mass spectrometry. J Am Soc Mass
Spectrom 2001, 12, 439-448.
[278] Gokulrangan, G., Zaidi, A., Michaelis, M. L., Schoneich, C., Proteomic analysis of protein nitration
in rat cerebellum: effect of biological aging. J Neurochem 2007, 100, 1494-1504.
177
[279] Kanski, J., Hong, S. J., Schoneich, C., Proteomic analysis of protein nitration in aging skeletal
muscle and identification of nitrotyrosine-containing sequences in vivo by nanoelectrospray ionization
tandem mass spectrometry. J Biol Chem 2005, 280, 24261-24266.
[280] Jiao, K., Mandapati, S., Skipper, P. L., Tannenbaum, S. R., Wishnok, J. S., Site-selective nitration
of tyrosine in human serum albumin by peroxynitrite. Anal Biochem 2001, 293, 43-52.
[281] Sacksteder, C. A., Qian, W. J., Knyushko, T. V., Wang, H., et al., Endogenously nitrated proteins in
mouse brain: links to neurodegenerative disease. Biochemistry 2006, 45, 8009-8022.
[282] van Haandel, L. K., J.; Li, X.; Schoneich, C.; Stobaugh, J. F., Phenylisothiocyanate as a Multiple
Chemical Dimension Reagent for the Relative Quantitation of Protein Nitrotyrosine. Chromatographia
2008, 68, 507-516.
[283] Stevens, S. M., Jr., Prokai-Tatrai, K., Prokai, L., Factors that contribute to the misidentification of
tyrosine nitration by shotgun proteomics. Mol Cell Proteomics 2008, 7, 2442-2451.
[284] Ghesquiere, B., Goethals, M., Van Damme, J., Staes, A., et al., Improved tandem mass
spectrometric characterization of 3-nitrotyrosine sites in peptides. Rapid Commun Mass Spectrom 2006,
20, 2885-2893.
[285] Ghesquiere, B., Helsens, K., Vandekerckhove, J., Gevaert, K., A stringent approach to improve the
quality of nitrotyrosine peptide identifications. Proteomics 2011, 11, 1094-1098.
[286] Zhang, Y., Yang, H., Poschl, U., Analysis of nitrated proteins and tryptic peptides by HPLC-chip-
MS/MS: site-specific quantification, nitration degree, and reactivity of tyrosine residues. Anal Bioanal
Chem 2011, 399, 459-471.
[287] Kim, J. Y., Kim, K. W., Kwon, H. J., Lee, D. W., Yoo, J. S., Probing lysine acetylation with a
modification-specific marker ion using high-performance liquid chromatography/electrospray-mass
spectrometry with collision-induced dissociation. Anal Chem 2002, 74, 5443-5449.
[288] Kuzyk, M. A., Ohlund, L. B., Elliott, M. H., Smith, D., et al., A comparison of MS/MS-based,
stable-isotope-labeled, quantitation performance on ESI-quadrupole TOF and MALDI-TOF/TOF mass
spectrometers. Proteomics 2009, 9, 3328-3340.
178
[289] Ow, S. Y., Salim, M., Noirel, J., Evans, C., et al., iTRAQ underestimation in simple and complex
mixtures: "the good, the bad and the ugly". J Proteome Res 2009, 8, 5347-5355.
[290] Vincent, C. E. L., A. R.; Westphall, M. S.; Coon, J. J., 59th ASMS Conference on Mass
Specttrometry and Allied Topics, American Society of Mass Spectrometry, Denver, CO 2011.
[291] Pichler, P., Kocher, T., Holzmann, J., Mazanek, M., et al., Peptide labeling with isobaric tags yields
higher identification rates using iTRAQ 4-plex compared to TMT 6-plex and iTRAQ 8-plex on LTQ
Orbitrap. Anal Chem 2010, 82, 6549-6558.
[292] Pierce, A., Unwin, R. D., Evans, C. A., Griffiths, S., et al., Eight-channel iTRAQ enables
comparison of the activity of six leukemogenic tyrosine kinases. Mol Cell Proteomics 2008, 7, 853-863.
[293] Koehler, C. J., Arntzen, M. O., de Souza, G. A., Thiede, B., An approach for triplex-isobaric
peptide termini labeling (triplex-IPTL). Anal Chem 2013, 85, 2478-2485.
[294] Dayon, L., Sonderegger, B., Kussmann, M., Combination of gas-phase fractionation and MS(3)
acquisition modes for relative protein quantification with isobaric tagging. J Proteome Res 2012, 11,
5081-5089.
[295] Thingholm, T. E., Palmisano, G., Kjeldsen, F., Larsen, M. R., Undesirable charge-enhancement of
isobaric tagged phosphopeptides leads to reduced identification efficiency. J Proteome Res 2010, 9, 4045-
4052.
[296] Association, A. s., 2013 Alzheimer's Disease Facts and Figures. Alzheimer's Dementia 2013, 9.
[297] Duyckaerts, C., Delatour, B., Potier, M. C., Classification and basic pathology of Alzheimer
disease. Acta Neuropathol 2009, 118, 5-36.
[298] Wolfe, M. S., The gamma-secretase complex: membrane-embedded proteolytic ensemble.
Biochemistry 2006, 45, 7931-7939.
[299] Papassotiropoulos, A., Fountoulakis, M., Dunckley, T., Stephan, D. A., Reiman, E. M., Genetics,
transcriptomics, and proteomics of Alzheimer's disease. J Clin Psychiatry 2006, 67, 652-670.
[300] Hall, A. M., Roberson, E. D., Mouse models of Alzheimer's disease. Brain Res Bull 2012, 88, 3-12.
179

[301] Saito, T., Matsuba, Y., Mihira, N., Takano, J., et al., Single App knock-in mouse models of
Alzheimer's disease. Nat Neurosci 2014, 17, 661-663.
[302] Jiang, Q., Lee, C. Y., Mandrekar, S., Wilkinson, B., et al., ApoE promotes the proteolytic
degradation of Abeta. Neuron 2008, 58, 681-693.
[303] Hooijmans, C. R., Kiliaan, A. J., Fatty acids, lipid metabolism and Alzheimer pathology. Eur J
Pharmacol 2008, 585, 176-196.
[304] Grimm, M. O., Rothhaar, T. L., Hartmann, T., The role of APP proteolytic processing in lipid
metabolism. Exp Brain Res 2012, 217, 365-375.
[305] Xiong, H., Callaghan, D., Jones, A., Walker, D. G., et al., Cholesterol retention in Alzheimer's brain
is responsible for high beta- and gamma-secretase activities and Abeta production. Neurobiol Dis 2008,
29, 422-437.
[306] Chen, Z., Zhong, C., Decoding Alzheimer's disease from perturbed cerebral glucose metabolism:
implications for diagnostic and therapeutic strategies. Prog Neurobiol 2013, 108, 21-43.
[307] Steculorum, S. M., Solas, M., Bruning, J. C., The paradox of neuronal insulin action and resistance
in the development of aging-associated diseases. Alzheimers Dement 2014, 10, S3-11.
[308] Cunnane, S., Nugent, S., Roy, M., Courchesne-Loyer, A., et al., Brain fuel metabolism, aging, and
Alzheimer's disease. Nutrition 2011, 27, 3-20.
[309] Lin, M. T., Beal, M. F., Mitochondrial dysfunction and oxidative stress in neurodegenerative
diseases. Nature 2006, 443, 787-795.
[310] Sutcliffe, J. G., Hedlund, P. B., Thomas, E. A., Bloom, F. E., Hilbush, B. S., Peripheral reduction of
beta-amyloid is sufficient to reduce brain beta-amyloid: implications for Alzheimer's disease. J Neurosci
Res 2011, 89, 808-814.
[311] Zhang, Y., Zhou, B., Zhang, F., Wu, J., et al., Amyloid-beta induces hepatic insulin resistance by
activating JAK2/STAT3/SOCS-1 signaling pathway. Diabetes 2012, 61, 1434-1443.
[312] Veszelka, S., Toth, A. E., Walter, F. R., Datki, Z., et al., Docosahexaenoic acid reduces amyloid-
beta induced toxicity in cells of the neurovascular unit. J Alzheimers Dis 2013, 36, 487-501.
180
[313] Astarita, G., Jung, K. M., Berchtold, N. C., Nguyen, V. Q., et al., Deficient liver biosynthesis of
docosahexaenoic acid correlates with cognitive impairment in Alzheimer's disease. PLoS One 2010, 5,
e12538.
[314] Hooijmans, C. R., Rutters, F., Dederen, P. J., Gambarota, G., et al., Changes in cerebral blood
volume and amyloid pathology in aged Alzheimer APP/PS1 mice on a docosahexaenoic acid (DHA) diet
or cholesterol enriched Typical Western Diet (TWD). Neurobiol Dis 2007, 28, 16-29.
[315] Ghiso, J., Shayo, M., Calero, M., Ng, D., et al., Systemic catabolism of Alzheimer's Abeta40 and
Abeta42. J Biol Chem 2004, 279, 45897-45908.
[316] Sagare, A., Deane, R., Bell, R. D., Johnson, B., et al., Clearance of amyloid-beta by circulating
lipoprotein receptors. Nat Med 2007, 13, 1029-1031.
[317] Tamaki, C., Ohtsuki, S., Iwatsubo, T., Hashimoto, T., et al., Major involvement of low-density
lipoprotein receptor-related protein 1 in the clearance of plasma free amyloid beta-peptide by the liver.
Pharm Res 2006, 23, 1407-1416.
[318] Sehgal, N., Gupta, A., Valli, R. K., Joshi, S. D., et al., Withania somnifera reverses Alzheimer's
disease pathology by enhancing low-density lipoprotein receptor-related protein in liver. Proc Natl Acad
Sci U S A 2012, 109, 3510-3515.
[319] Sagare, A. P., Deane, R., Zetterberg, H., Wallin, A., et al., Impaired lipoprotein receptor-mediated
peripheral binding of plasma amyloid-beta is an early biomarker for mild cognitive impairment preceding
Alzheimer's disease. J Alzheimers Dis 2011, 24, 25-34.
[320] Reddy, J. K., Rao, M. S., Lipid metabolism and liver inflammation. II. Fatty liver disease and fatty
acid oxidation. Am J Physiol Gastrointest Liver Physiol 2006, 290, G852-858.
[321] Garcia-Alloza, M., Robbins, E. M., Zhang-Nunes, S. X., Purcell, S. M., et al., Characterization of
amyloid deposition in the APPswe/PS1dE9 mouse model of Alzheimer disease. Neurobiol Dis 2006, 24,
516-524.
[322] Robinson, R. A., Joshi, G., Huang, Q., Sultana, R., et al., Proteomic analysis of brain proteins in
APP/PS-1 human double mutant knock-in mice with increasing amyloid beta-peptide deposition: insights
181

into the effects of in vivo treatment with N-acetylcysteine as a potential therapeutic intervention in mild
cognitive impairment and Alzheimer's disease. Proteomics 2011, 11, 4243-4256.
[323] Sultana, R., Robinson, R. A., Di Domenico, F., Abdul, H. M., et al., Proteomic identification of
specifically carbonylated brain proteins in APP(NLh)/APP(NLh) x PS-1(P264L)/PS-1(P264L) human
double mutant knock-in mice model of Alzheimer disease as a function of age. J Proteomics 2011, 74,
2430-2440.
[324] Cao, Z., Robinson, R. A., Proteome characterization of splenocytes from an Abetapp/ps-1
Alzheimer's disease model. Proteomics 2013.
[325] Lv, J., Ma, S., Zhang, X., Zheng, L., et al., Quantitative proteomics reveals that PEA15 regulates
astroglial Abeta phagocytosis in an Alzheimer's disease mouse model. J Proteomics 2014, 110C, 45-58.
[326] Gu, L., Evans, A.; Robinson, R.A.S, Sample Multiplexing with Cysteine-selective Approaches:
cysDML and cPILOT. J. Amer. Soc. Mass Spec., Manuscript Submitted.
[327] Cao, Z., Yende, S., Kellum, J. A., Robinson, R. A., Additions to the Human Plasma Proteome via a
Tandem MARS Depletion iTRAQ-Based Workflow. Int J Proteomics 2013, 2013, 654356.
[328] Mi, H., Muruganujan, A., Thomas, P. D., PANTHER in 2013: modeling the evolution of gene
function, and other gene attributes, in the context of phylogenetic trees. Nucleic Acids Res 2013, 41,
D377-386.
[329] Dayon, L., Hainard, A., Licker, V., Turck, N., et al., Relative quantification of proteins in human
cerebrospinal fluids by MS/MS using 6-plex isobaric tags. Anal Chem 2008, 80, 2921-2931.
[330] McAlister, G. C., Nusinow, D. P., Jedrychowski, M. P., Wuhr, M., et al., MultiNotch MS3 enables
accurate, sensitive, and multiplexed detection of differential expression across cancer cell line proteomes.
Anal Chem 2014, 86, 7150-7158.
[331] Fang, R., Elias, D. A., Monroe, M. E., Shen, Y., et al., Differential label-free quantitative proteomic
analysis of Shewanella oneidensis cultured under aerobic and suboxic conditions by accurate mass and
time tag approach. Mol Cell Proteomics 2006, 5, 714-725.
182

[332] de la Monte, S. M., Tong, M., Brain metabolic dysfunction at the core of Alzheimer's disease.
Biochem Pharmacol 2014, 88, 548-559.
[333] Wong, B. X., Hung, Y. H., Bush, A. I., Duce, J. A., Metals and cholesterol: two sides of the same
coin in Alzheimer's disease pathology. Front Aging Neurosci 2014, 6, 91.
[334] Sowell, R. A., Owen, J. B., Butterfield, D. A., Proteomics in animal models of Alzheimer's and
Parkinson's diseases. Ageing Res Rev 2009, 8, 1-17.
[335] Jankowsky, J. L., Fadale, D. J., Anderson, J., Xu, G. M., et al., Mutant presenilins specifically
elevate the levels of the 42 residue beta-amyloid peptide in vivo: evidence for augmentation of a 42-
specific gamma secretase. Hum Mol Genet 2004, 13, 159-170.
[336] Bartlett, K., Eaton, S., Mitochondrial beta-oxidation. Eur J Biochem 2004, 271, 462-469.
[337] Reddy, J. K., Hashimoto, T., Peroxisomal beta-oxidation and peroxisome proliferator-activated
receptor alpha: an adaptive metabolic system. Annu Rev Nutr 2001, 21, 193-230.
[338] Chou, J. L., Shenoy, D. V., Thomas, N., Choudhary, P. K., et al., Early dysregulation of the
mitochondrial proteome in a mouse model of Alzheimer's disease. J Proteomics 2011, 74, 466-479.
[339] Owen, O. E., Ketone Bodies as a fuel for the Brain during Starvation. Biochemistry and Molecular
Biology Education 2005, 33, 246-251.
[340] Henderson, S. T., Ketone bodies as a therapeutic for Alzheimer's disease. Neurotherapeutics 2008,
5, 470-480.
[341] Beckett, T. L., Studzinski, C. M., Keller, J. N., Paul Murphy, M., Niedowicz, D. M., A ketogenic
diet improves motor performance but does not affect beta-amyloid levels in a mouse model of
Alzheimer's disease. Brain Res 2013, 1505, 61-67.
[342] Gray, L. R., Tompkins, S. C., Taylor, E. B., Regulation of pyruvate metabolism and human disease.
Cell Mol Life Sci 2014, 71, 2577-2604.
[343] Lai, J. C., Cooper, A. J., Brain alpha-ketoglutarate dehydrogenase complex: kinetic properties,
regional distribution, and effects of inhibitors. J Neurochem 1986, 47, 1376-1386.
183

[344] Ott, P., Vilstrup, H., Cerebral effects of ammonia in liver disease: current hypotheses. Metab Brain
Dis 2014.
[345] Senior, J. R., Alanine aminotransferase: a clinical and regulatory tool for detecting liver injury-past,
present, and future. Clin Pharmacol Ther 2012, 92, 332-339.
[346] Seiler, N., Ammonia and Alzheimer's disease. Neurochem Int 2002, 41, 189-207.
[347] Ponka, P., Cell biology of heme. Am J Med Sci 1999, 318, 241-256.
[348] Jomova, K., Vondrakova, D., Lawson, M., Valko, M., Metals, oxidative stress and
neurodegenerative disorders. Mol Cell Biochem 2010, 345, 91-104.
[349] Atamna, H., Frey, W. H., 2nd, Mechanisms of mitochondrial dysfunction and energy deficiency in
Alzheimer's disease. Mitochondrion 2007, 7, 297-310.
[350] Foxton, R. H., Land, J. M., Heales, S. J., Tetrahydrobiopterin availability in Parkinson's and
Alzheimer's disease; potential pathogenic mechanisms. Neurochem Res 2007, 32, 751-756.
[351] Dumont, M., Beal, M. F., Neuroprotective strategies involving ROS in Alzheimer disease. Free
Radic Biol Med 2011, 51, 1014-1026.
[352] Rhein, V., Song, X., Wiesner, A., Ittner, L. M., et al., Amyloid-beta and tau synergistically impair
the oxidative phosphorylation system in triple transgenic Alzheimer's disease mice. Proc Natl Acad Sci U
S A 2009, 106, 20057-20062.
[353] Dringen, R., Pawlowski, P. G., Hirrlinger, J., Peroxide detoxification by brain cells. J Neurosci Res
2005, 79, 157-165.
[354] Erickson, J. R., Joiner, M. L., Guan, X., Kutschke, W., et al., A dynamic pathway for calcium-
independent activation of CaMKII by methionine oxidation. Cell 2008, 133, 462-474.
[355] Ding, Q., Markesbery, W. R., Cecarini, V., Keller, J. N., Decreased RNA, and increased RNA
oxidation, in ribosomes from early Alzheimer's disease. Neurochem Res 2006, 31, 705-710.
[356] Myung, N. H., Zhu, X., Kruman, II, Castellani, R. J., et al., Evidence of DNA damage in Alzheimer
disease: phosphorylation of histone H2AX in astrocytes. Age (Dordr) 2008, 30, 209-215.
184
[357] McKinnon, P. J., DNA repair deficiency and neurological disease. Nat Rev Neurosci 2009, 10, 100-
112.
[358] Altelaar, A. F., Frese, C. K., Preisinger, C., Hennrich, M. L., et al., Benchmarking stable isotope
labeling based quantitative proteomics. J Proteomics 2013, 88, 14-26.
[359] Wu, Y., Wang, F., Liu, Z., Qin, H., et al., Five-plex isotope dimethyl labeling for quantitative
proteomics. Chem Commun (Camb) 2014, 50, 1708-1710.
[360] Li, L. X., F.; Greer, T.; Frost, D.; Liang, Z., United States 2013.
[361] Frost, D. C., Greer, T., Li, L., High-resolution Enabled 12-Plex DiLeu Isobaric Tags for
Quantitative Proteomics. Anal Chem 2014.
[362] Kaminski, Z. J., Kolesinska, B., Kolesinska, J., Sabatino, G., et al., N-triazinylammonium
tetrafluoroborates. A new generation of efficient coupling reagents useful for peptide synthesis. J Am
Chem Soc 2005, 127, 16912-16920.
[363] Hu, W., Tedesco, S., Faedda, R., Petrone, G., et al., Covalent selection of the thiol proteome on
activated thiol sepharose: a robust tool for redox proteomics. Talanta 2010, 80, 1569-1575.
[364] Weston, L. A., Bauer, K. M., Skube, S. B., Hummon, A. B., Selective, bead-based global peptide
capture using a bifunctional cross-linker. Anal Chem 2013, 85, 10675-10679.
[365] McClatchy, D. B. Y., J. R., in: Martins-de-Souza, D. (Ed.), Shotgun Proteomics: Methods in
Molecular Biology, Springer, New York 2014, pp. 133-146.
[366] Hebert, A. S. M., A. E.; Richards, A. L.; MacGilvray, M. E.; Kwiecien, N. W.; Rose, C. M.; Bailey,
D. J.; Coon, J., NeuCode Mouse and One Hour Proteomics. Mol Cell Proteomics 2014, 13, S31-S32.
[367] Saveliev, S. E., L.; Strauss, E.; Jones, R.; Rosenblatt, M., in: Note, P. T. (Ed.) 2012.
[368] Kellermann, J., ICPL--isotope-coded protein label. Methods Mol Biol 2008, 424, 113-123.
[369] Com, E., Clavreul, A., Lagarrigue, M., Michalak, S., et al., Quantitative proteomic Isotope-Coded
Protein Label (ICPL) analysis reveals alteration of several functional processes in the glioblastoma. J
Proteomics 2012, 75, 3898-3913.
185

[370] Lange, O. D., E.; Wieghaus, A.; Makarov, A., ENhanced Fourier Transform for Orbitrap Mass
Spectrometry. International Journal of Mass Spectrometry 2014, 369, 16-22.
[371] Cherrington, A. D. E., D.; Sindelar, D. K., The Direct and Indirect Effects of Insulin on Hepatic
Glucose Production in Vivo. Diabetologia 1998, 41, 987-996.
[372] Brosnan, J. T., Glutamate, at the interface between amino acid and carbohydrate metabolism. J Nutr
2000, 130, 988S-990S.
[373] Moore, J. K., Love, E., Craig, D. G., Hayes, P. C., Simpson, K. J., Acute kidney injury in acute
liver failure: a review. Expert Rev Gastroenterol Hepatol 2013, 7, 701-712.
[374] Wang, X. L., Suzuki, R., Lee, K., Tran, T., et al., Ablation of ARNT/HIF1beta in liver alters
gluconeogenesis, lipogenic gene expression, and serum ketones. Cell Metab 2009, 9, 428-439.
[375] Schooneman, M. G., Vaz, F. M., Houten, S. M., Soeters, M. R., Acylcarnitines: reflecting or
inflicting insulin resistance? Diabetes 2013, 62, 1-8.
[376] Mansour, F. R., Wei, W., Danielson, N. D., Separation of carnitine and acylcarnitines in biological
samples: a review. Biomed Chromatogr 2013, 27, 1339-1353.
[377] Santa, T., Derivatization reagents in liquid chromatography/electrospray ionization tandem mass
spectrometry. Biomed Chromatogr 2011, 25, 1-10.
[378] Peterson, A. C., Russell, J. D., Bailey, D. J., Westphall, M. S., Coon, J. J., Parallel reaction
monitoring for high resolution and high mass accuracy quantitative, targeted proteomics. Mol Cell
Proteomics 2012, 11, 1475-1488.
186