“Multiple-Stable States” Changes in: Species diversity Opportunistic species Incidence of...
22
-
date post
21-Dec-2015 -
Category
Documents
-
view
217 -
download
0
Transcript of “Multiple-Stable States” Changes in: Species diversity Opportunistic species Incidence of...


“Multiple-Stable States”
Changes in:
Species diversity
Opportunistic species
Incidence of disease
Tightness of nutrient cycling
Net Primary Production
Natural Range of Stable States
Degraded/ Loss of integrity
Degraded/ Loss of integrity
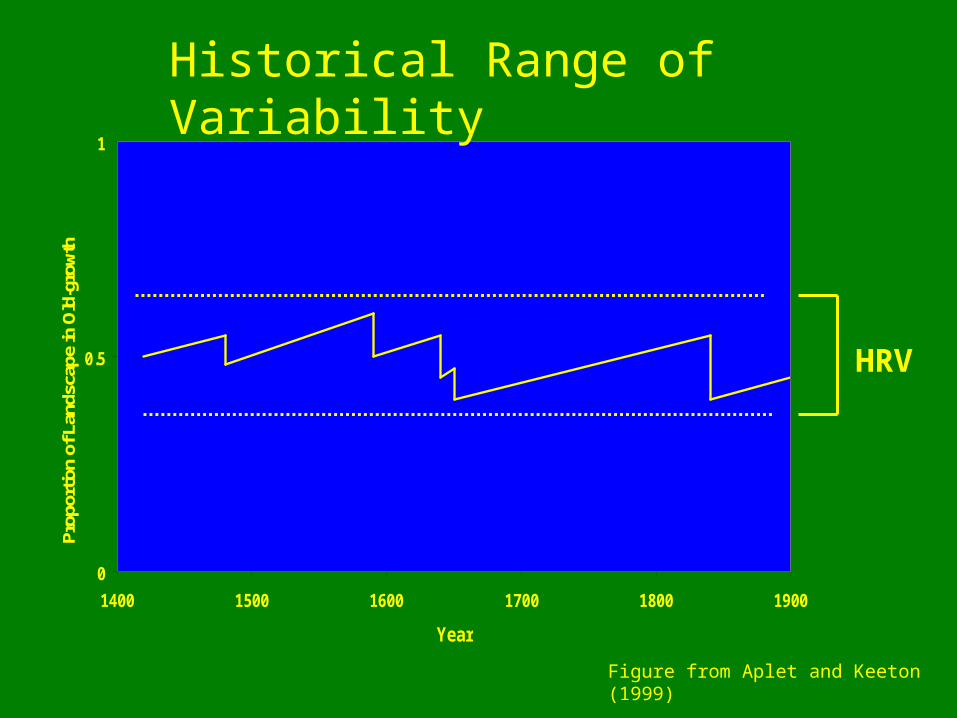
0
0.5
1
1400 1500 1600 1700 1800 1900
Year
Prop
ortio
n of
Lan
dsca
pe in
Old
-gro
wth
HRV
Historical Range of Variability
Figure from Aplet and Keeton (1999)

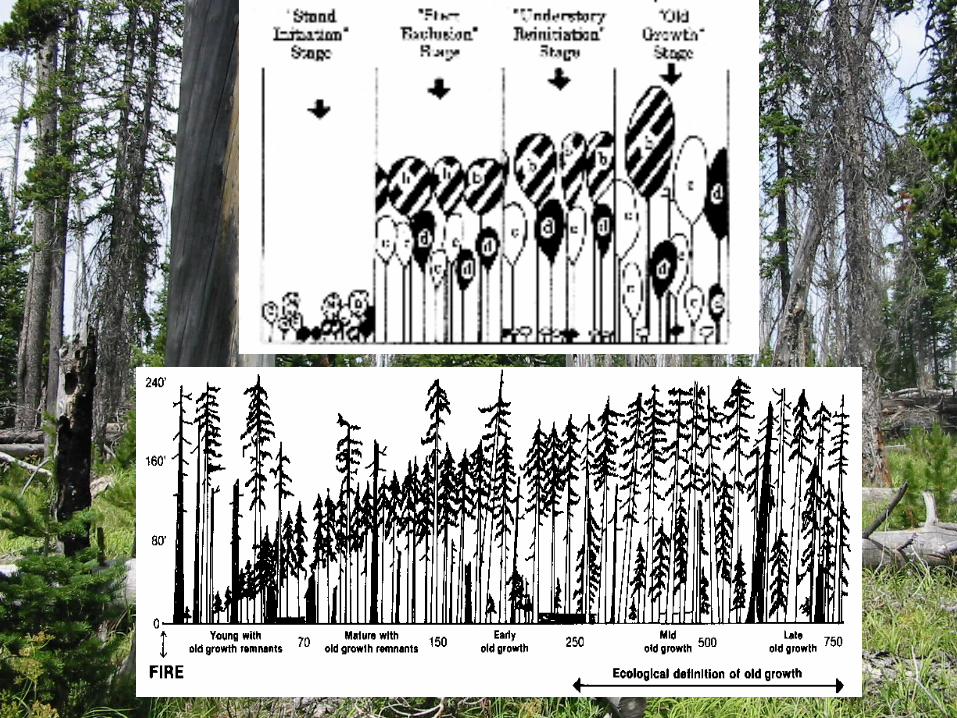
Multiple Pathways of Succession:
f (Timing, Type, and Intensity of Disturbances + Masting and Seed Availability)
From Hemstrom and Logan (1986), in Spies (1997)

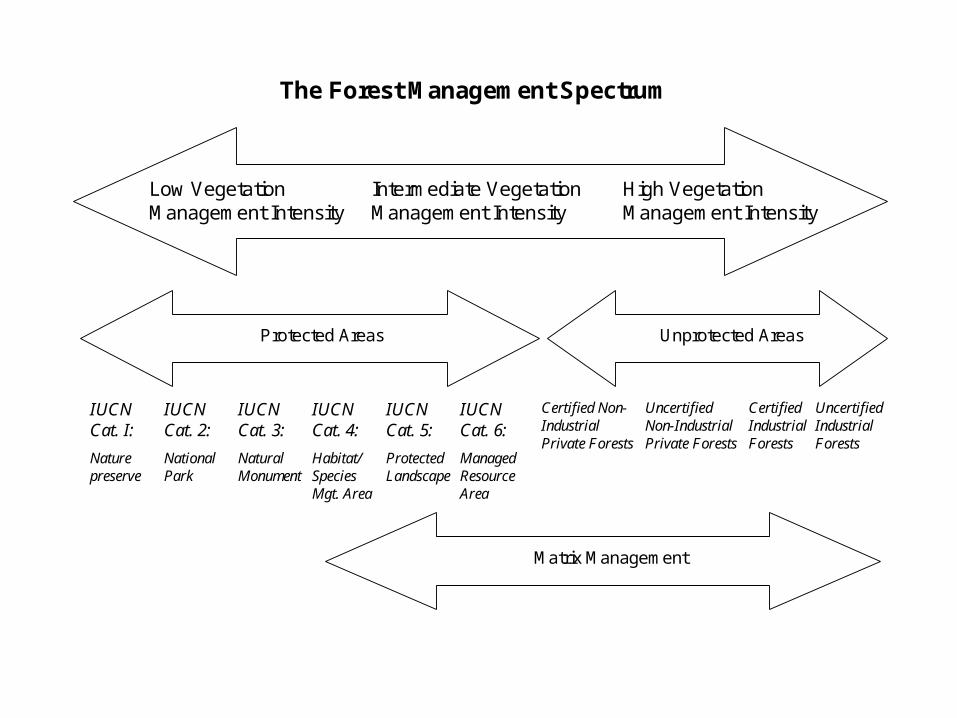
IUCN Cat. 2:
National Park
IUCN Cat. I:
Nature preserve
IUCN Cat. 3:
Natural Monument
IUCN Cat. 4:
Habitat/ Species Mgt. Area
IUCN Cat. 5:
Protected Landscape
IUCN Cat. 6:
Managed Resource Area
Low Vegetation Management Intensity
Protected Areas Unprotected Areas
Matrix Management
Intermediate Vegetation Management Intensity
High Vegetation Management Intensity
Certified Non-Industrial Private Forests
Certified Industrial Forests
Uncertified Non-Industrial Private Forests
Uncertified Industrial Forests
The Forest Management Spectrum

Climate
Direct Indirect
Effects on Organisms(Physiological, etc.)
Effects on DisturbanceRegimes
Ecosystem Composition and Function

Figure courtesy of Ray Drapek,
Oregon State University
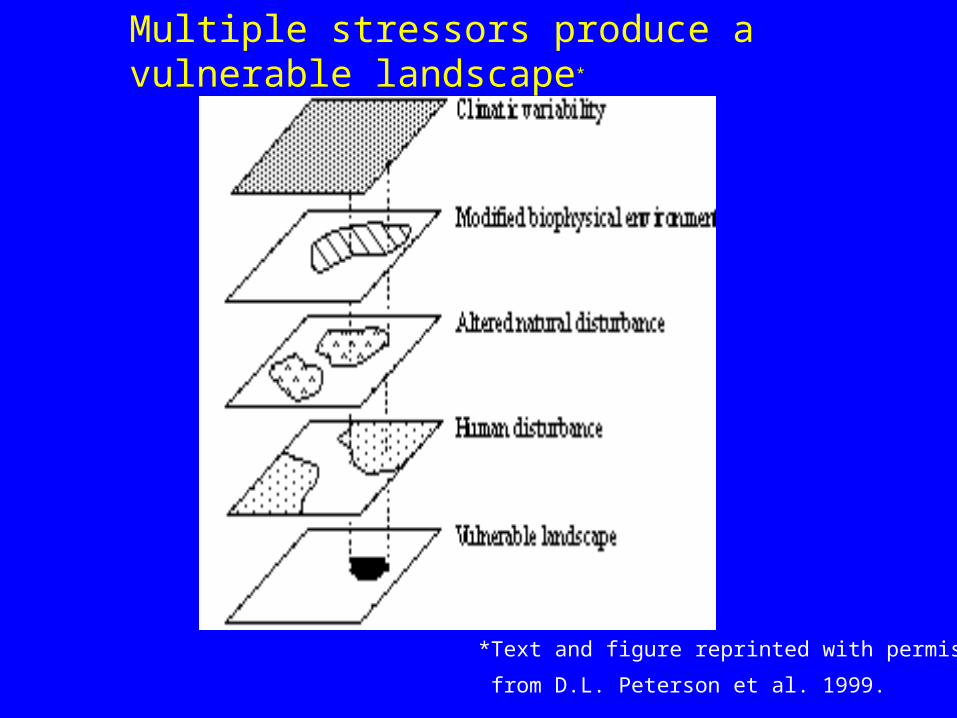
Multiple stressors produce a vulnerable landscape*
*Text and figure reprinted with permission
from D.L. Peterson et al. 1999.
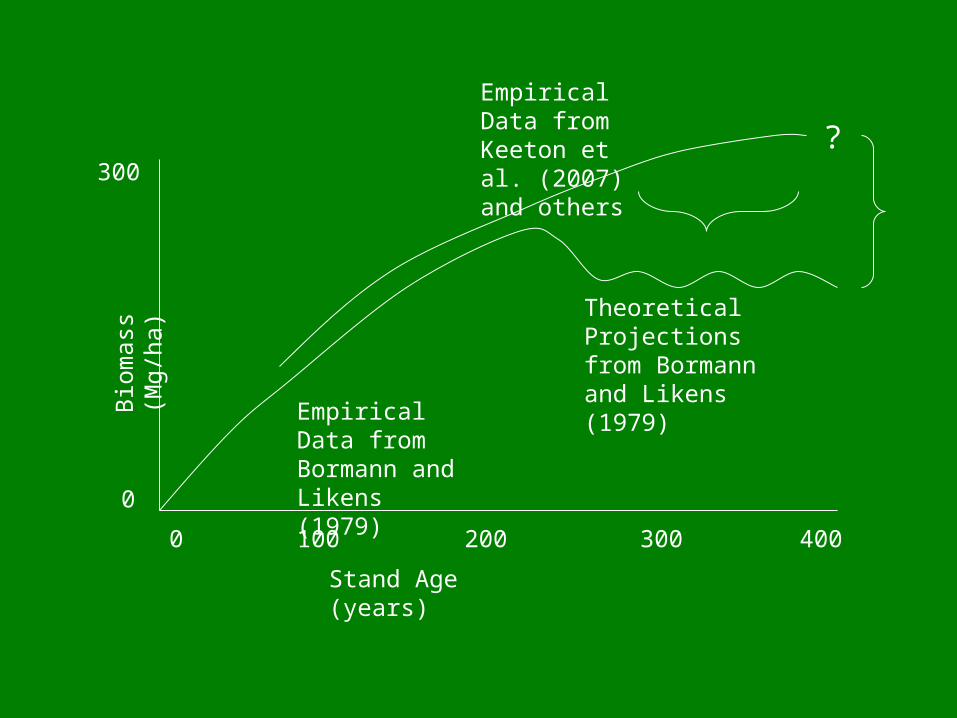
300
0
Bio
mas
s (M
g/ha
)
Stand Age (years)
0 100 200 400300
?
Empirical Data from Keeton et al. (2007) and others
Empirical Data from Bormann and Likens (1979)
Theoretical Projections from Bormann and Likens (1979)
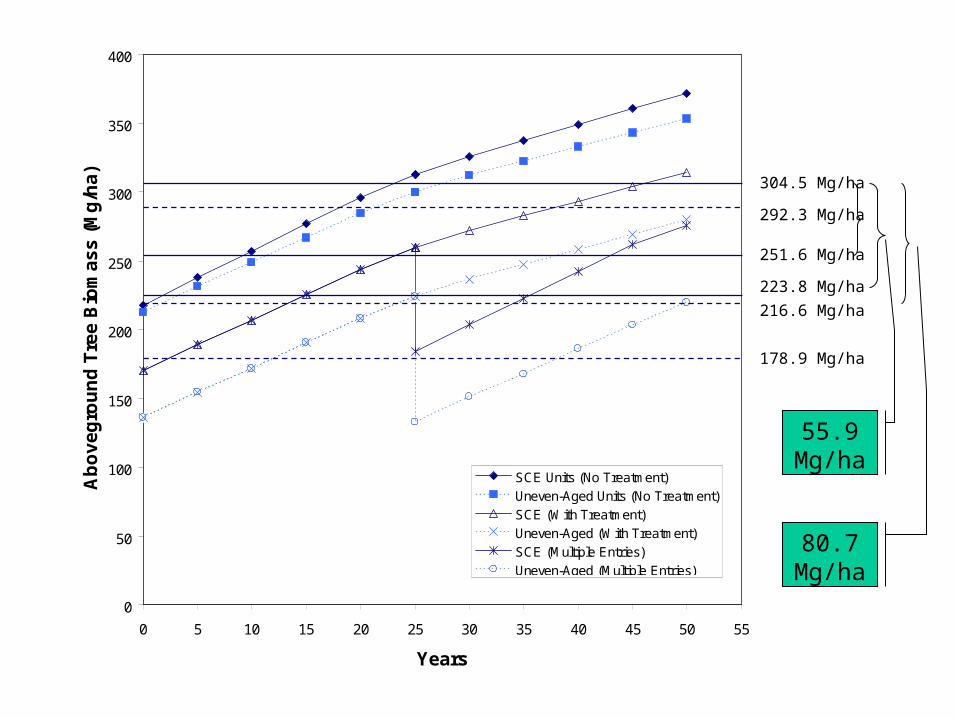
0
50
100
150
200
250
300
350
400
0 5 10 15 20 25 30 35 40 45 50 55
Years
Ab
ov
eg
rou
nd
Tre
e B
iom
as
s (
Mg
/ha
)
SCE Units (No Treatment)
Uneven-Aged Units (No Treatment)
SCE (With Treatment)
Uneven-Aged (With Treatment)
SCE (Multiple Entries)
Uneven-Aged (Multiple Entries)
304.5 Mg/ha
216.6 Mg/ha
292.3 Mg/ha
178.9 Mg/ha
251.6 Mg/ha
223.8 Mg/ha
55.9 Mg/ha
80.7 Mg/ha