
Multidimensional Data Analysis
43
Multidimensional Data Analysis IS 247 Information Visualization and Presentation 22 February 2002 James Reffell Moryma Aydelott Jean-Anne Fitzpatrick
description
Multidimensional Data Analysis. IS 247 Information Visualization and Presentation 22 February 2002 James Reffell Moryma Aydelott Jean-Anne Fitzpatrick. Problem Statement. How to effectively present more than 3 dimensions of information in a visual display with 2 (to 3) dimensions? - PowerPoint PPT Presentation
Transcript of Multidimensional Data Analysis
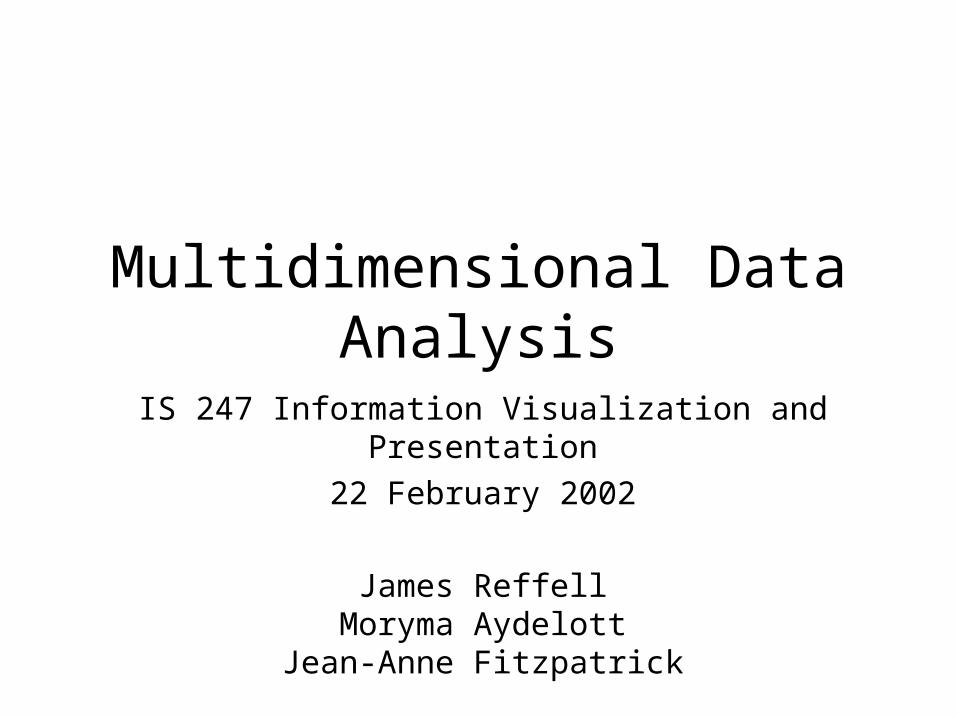
Multidimensional Data Analysis
IS 247 Information Visualization and Presentation
22 February 2002
James ReffellMoryma Aydelott
Jean-Anne Fitzpatrick
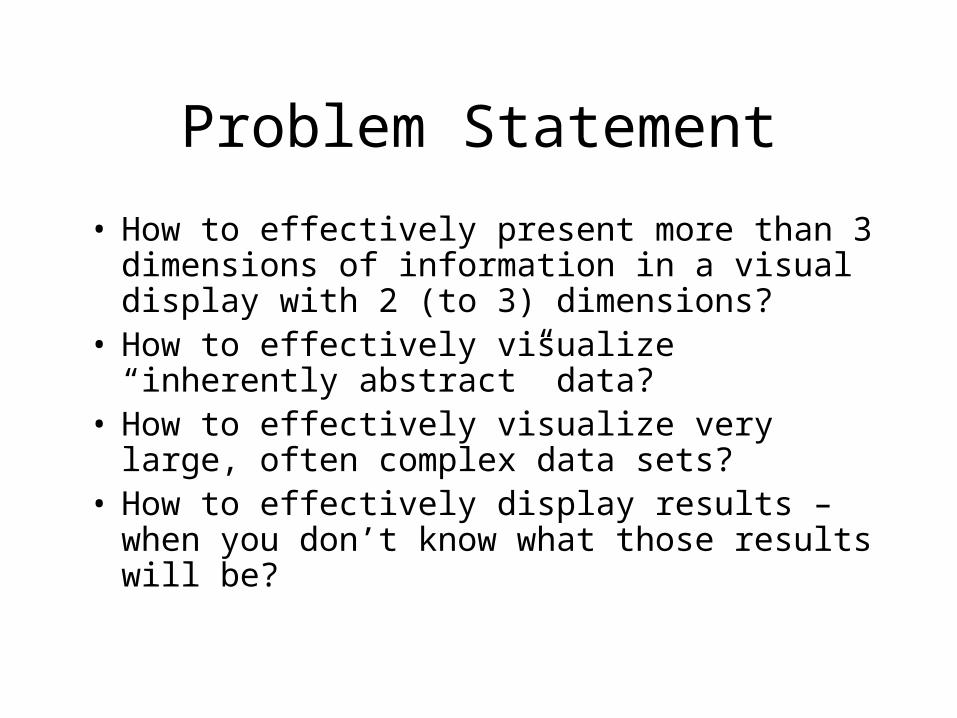
Problem Statement
• How to effectively present more than 3 dimensions of information in a visual display with 2 (to 3) dimensions?
• How to effectively visualize “inherently abstract” data?
• How to effectively visualize very large, often complex data sets?
• How to effectively display results – when you don’t know what those results will be?
Key Goals
• More than 3 dimensions of data simultaneously
• Support “fuzzyness” (similarity queries, vector space, tolerance ranges)
• Support exploratory, opportunistic, “what-if” queries
• Allow identification of “interesting data properties” through pattern recognition
• Explore various dimensions without losing overview
Another Statement of Goals
Visualization of multidimensional data• Without loss of information• With:
– Minimal complexity– Any number of dimensions– Variables treated uniformly– Objects remain recognizable across
transformations– Easy / intuitive conveyance of information– Mathematically / algorithmically rigorous
(Adapted from Inselberg)
Purposes / Uses
• Find clusters of similar data• Find “hot spots” (exceptional items in
otherwise homogeneous regions)• Show relationships between multiple
variables• Similarity retrieval rather than boolean
matching, show near misses
“Searching for patterns in the big picture and fluidly investigating interesting details without losing framing context” (Rao & Card)
Characteristics• “Data-dense displays” (large number of
dimensions and/or values)– Often combine color with position / proximity
representing relevance “distance” – Often provide multiple views
• Build on concepts from previous weeks:– Retinal properties of marks– Gestalt concepts, e.g., grouping– Direct manipulation / interactive queries– Incremental construction of queries– Dynamic feedback
• Some require specialized input devices or unique gesture vocabulary
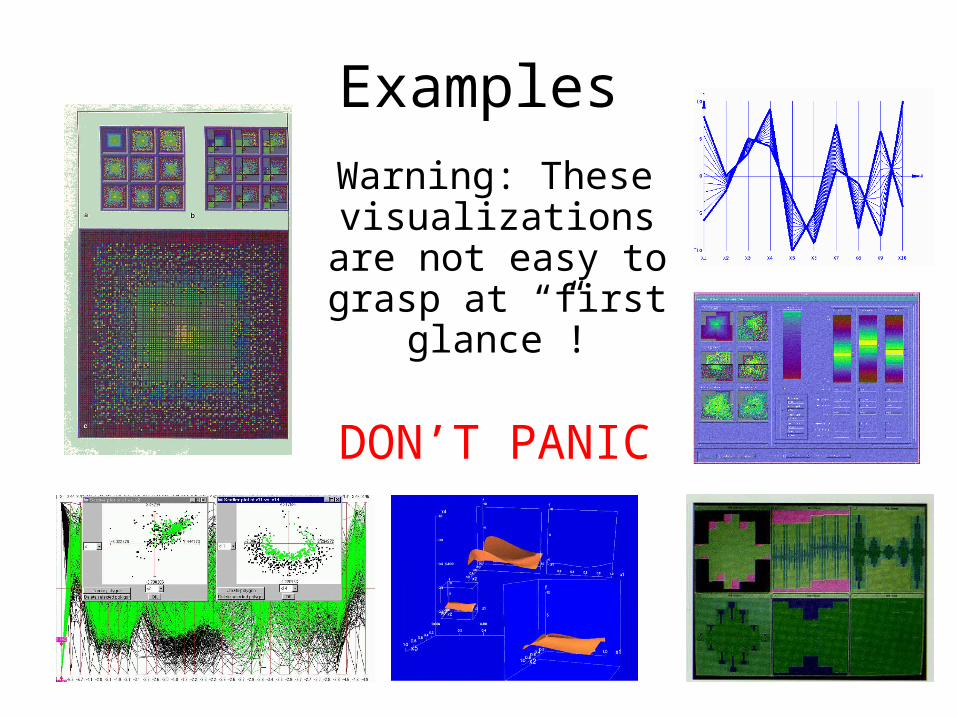
ExamplesWarning: These visualizations
are not easy to grasp at “first
glance”!
DON’T PANIC

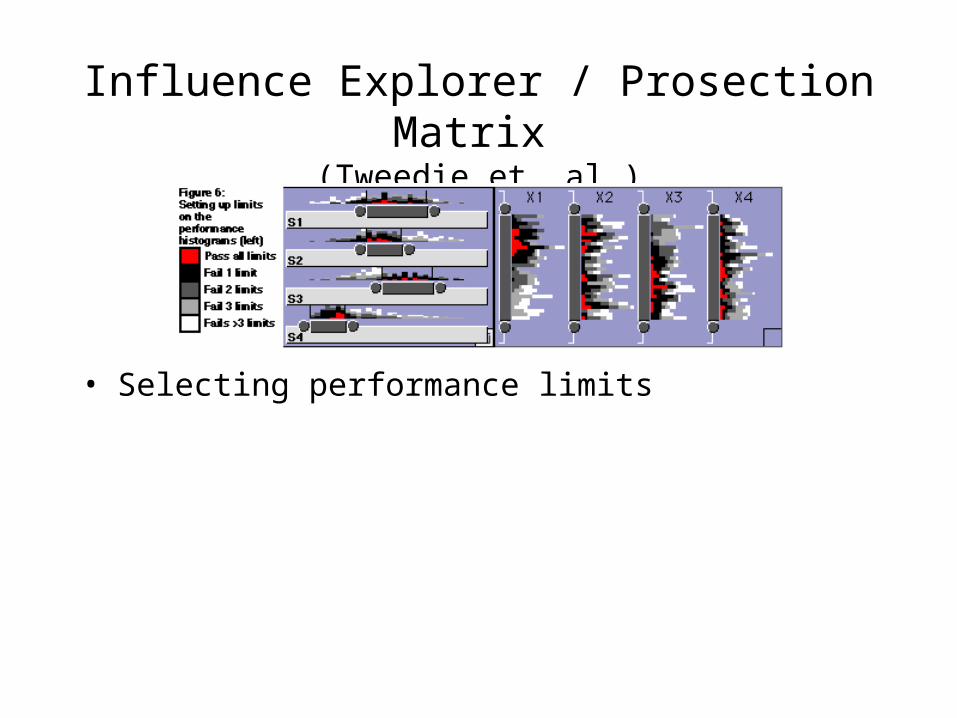
Influence Explorer / Prosection Matrix
(Tweedie et. al.)
• We saw the video• Abstract one-way mathematical
models: multiple parameters, multiple variables
• Data through sampling• Colour coding, esp. near misses• Task: Make the red bit as big as
possible!
Influence Explorer / Prosection Matrix
(Tweedie et. al.)
• Selecting performance limits
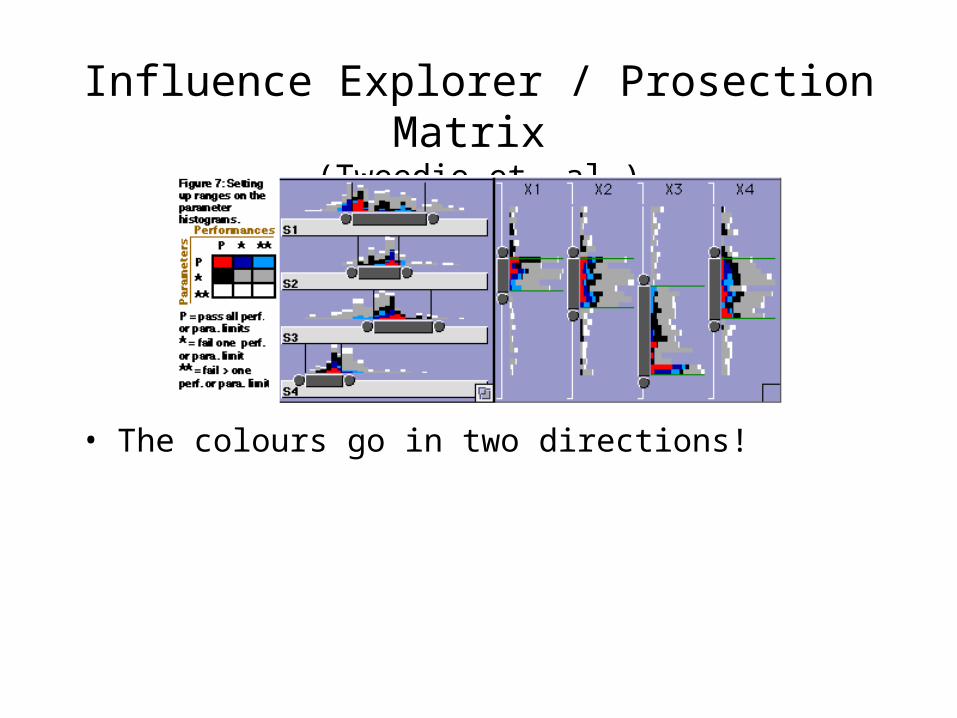
Influence Explorer / Prosection Matrix
(Tweedie et. al.)
• The colours go in two directions!
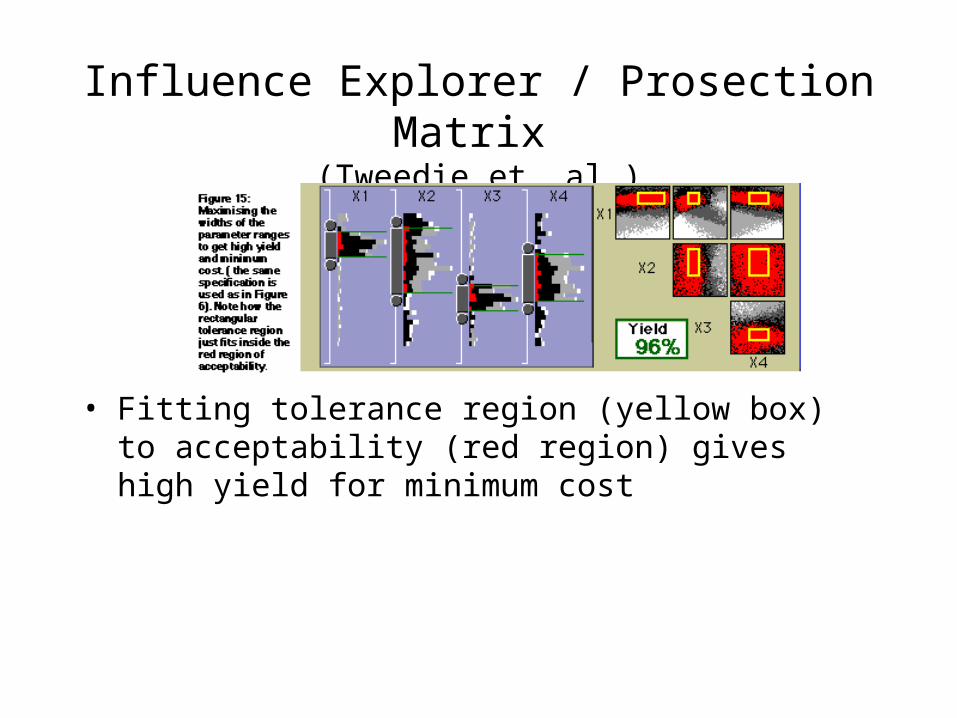
Influence Explorer / Prosection Matrix
(Tweedie et. al.)
• Fitting tolerance region (yellow box) to acceptability (red region) gives high yield for minimum cost
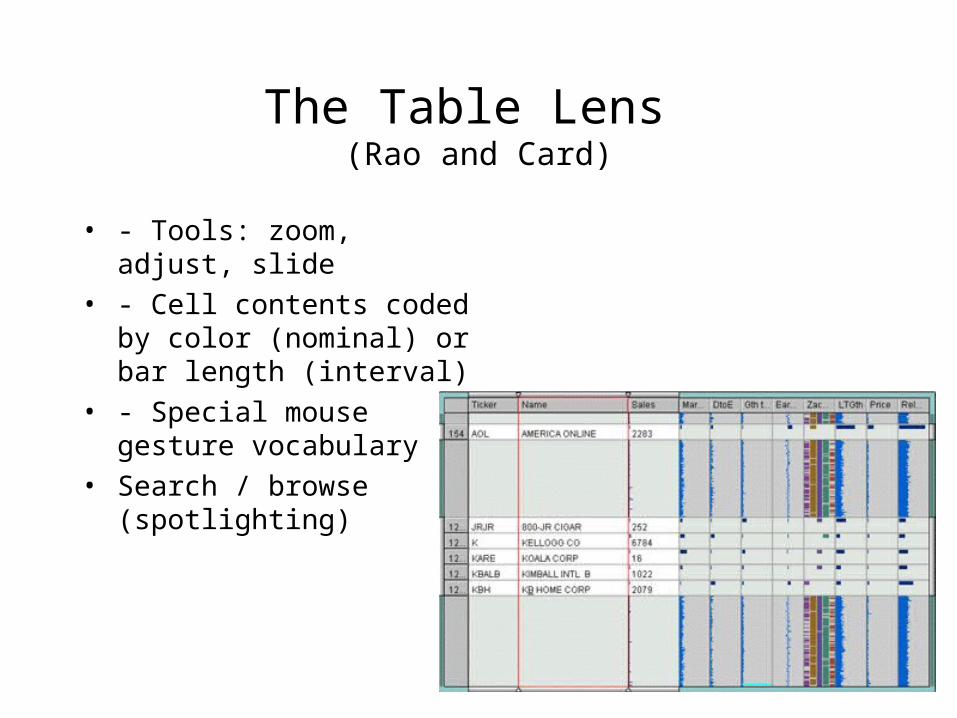
The Table Lens (Rao and Card)
• - Tools: zoom, adjust, slide
• - Cell contents coded by color (nominal) or bar length (interval)
• - Special mouse gesture vocabulary
• Search / browse (spotlighting)
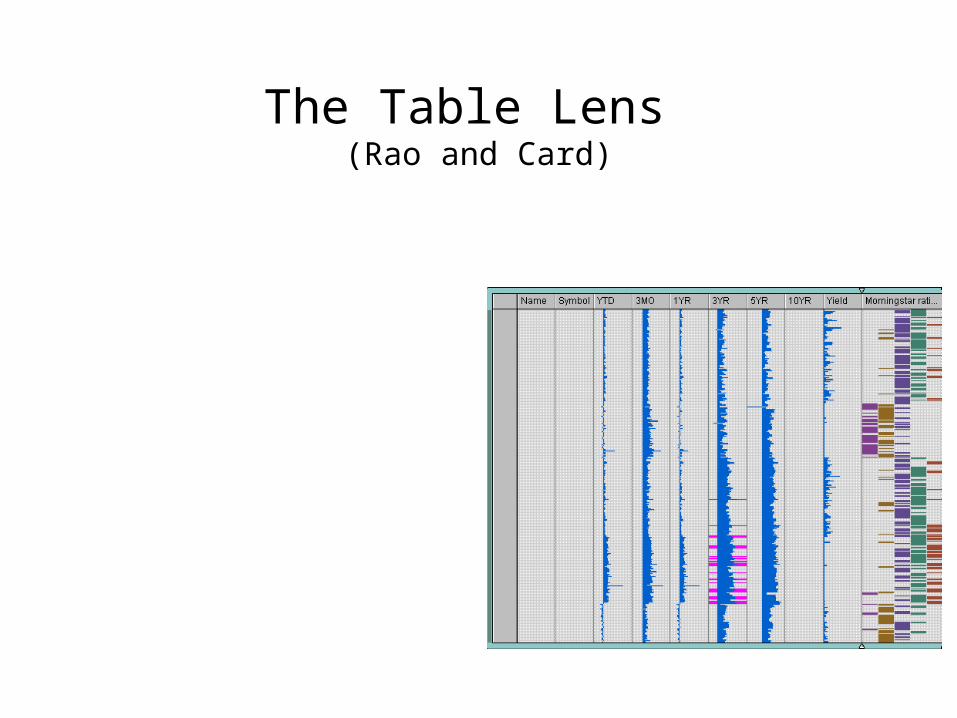
The Table Lens (Rao and Card)
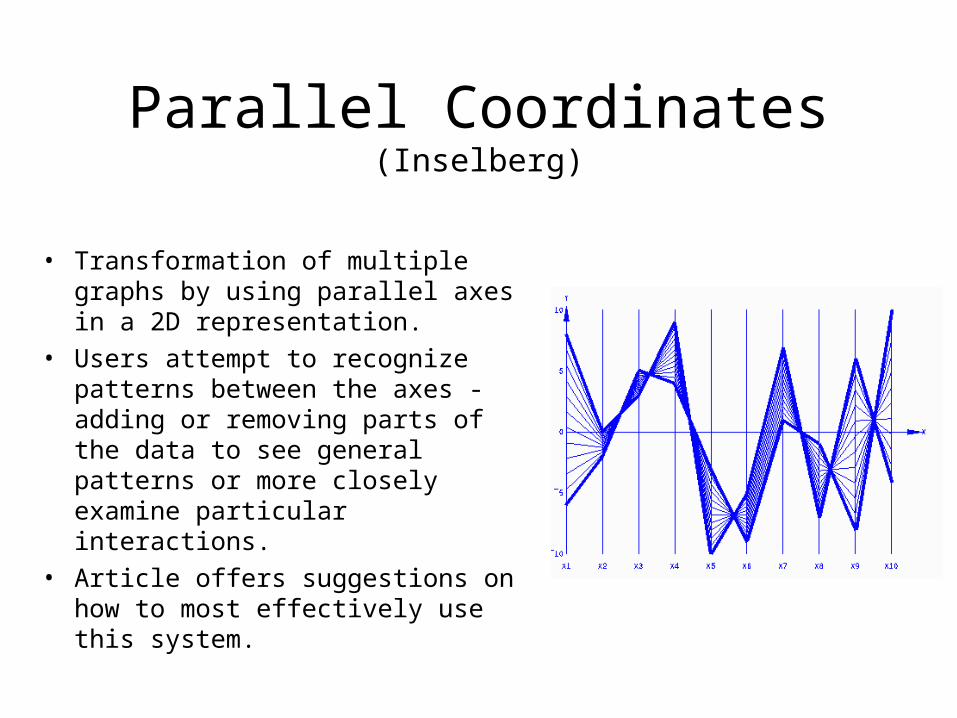
Parallel Coordinates(Inselberg)
• Transformation of multiple graphs by using parallel axes in a 2D representation.
• Users attempt to recognize patterns between the axes - adding or removing parts of the data to see general patterns or more closely examine particular interactions.
• Article offers suggestions on how to most effectively use this system.
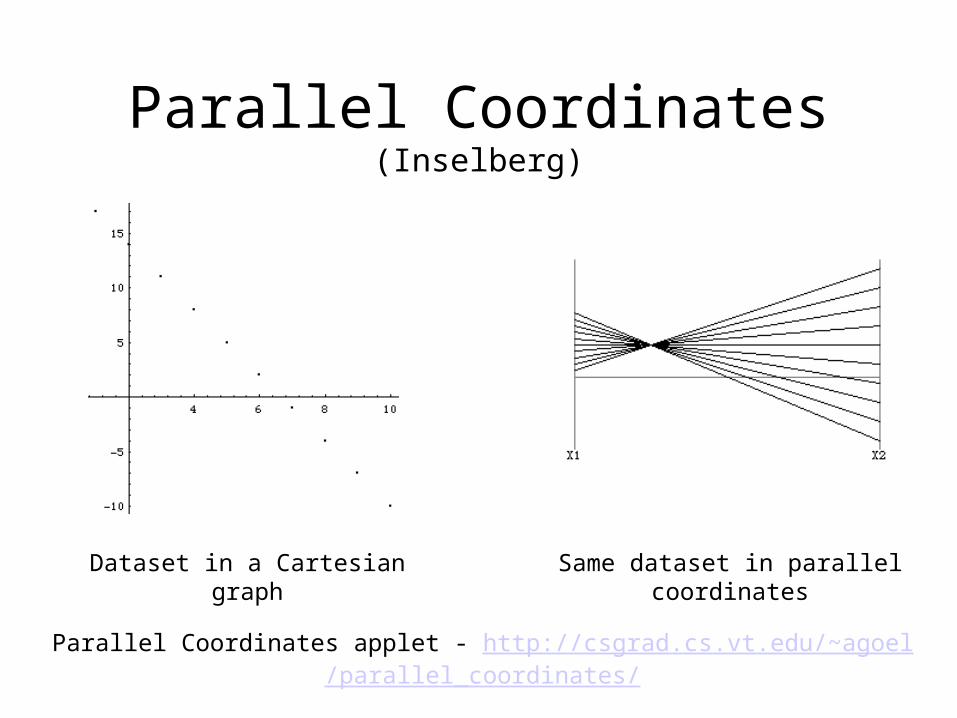
Parallel Coordinates(Inselberg)
Dataset in a Cartesian graph
Same dataset in parallel coordinates
Parallel Coordinates applet - http://csgrad.cs.vt.edu/~agoel/parallel_coordinates/
Parallel Coordinates(Inselberg)
Strengths – • Works for any N• Clearly displays data characteristics of the data (without
needing beaucoup explanations)• Easy to adjust or focus displays/ queries • Testing showed that it showed problems missed using other
forms of process control• Can be used in decision support when used as a visual
modeling tool (to see how adjusting one parameter effects others).
Weaknesses – • Formation of complex queries can be tricky (if you want to
get results that are useful and easy to interpret).
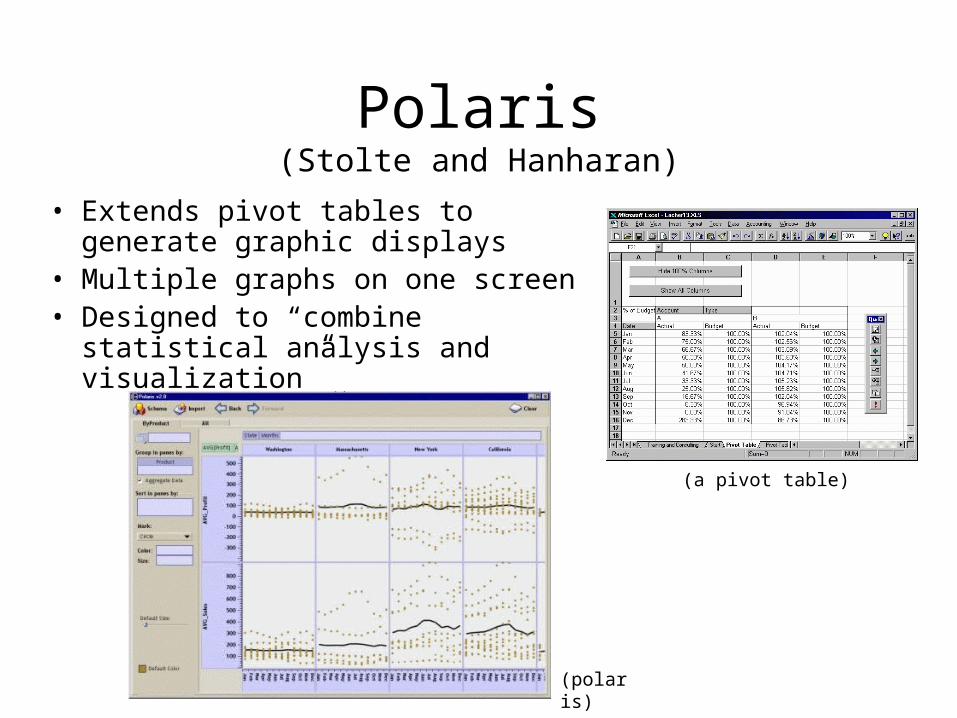
Polaris(Stolte and Hanharan)
• Extends pivot tables to generate graphic displays
• Multiple graphs on one screen• Designed to “combine
statistical analysis and visualization”
(a pivot table)
(polaris)

Polaris(Stolte and Hanharan)
• Table algebra automatically generated via drag and drop.
• Suitable graphic types are system selected based on query/result criteria. Include tables, bar charts, dot plot, gantt charts, matrices of scatterplots, maps.
• Users can select marks (marks differ by shape, size, orientation and color).
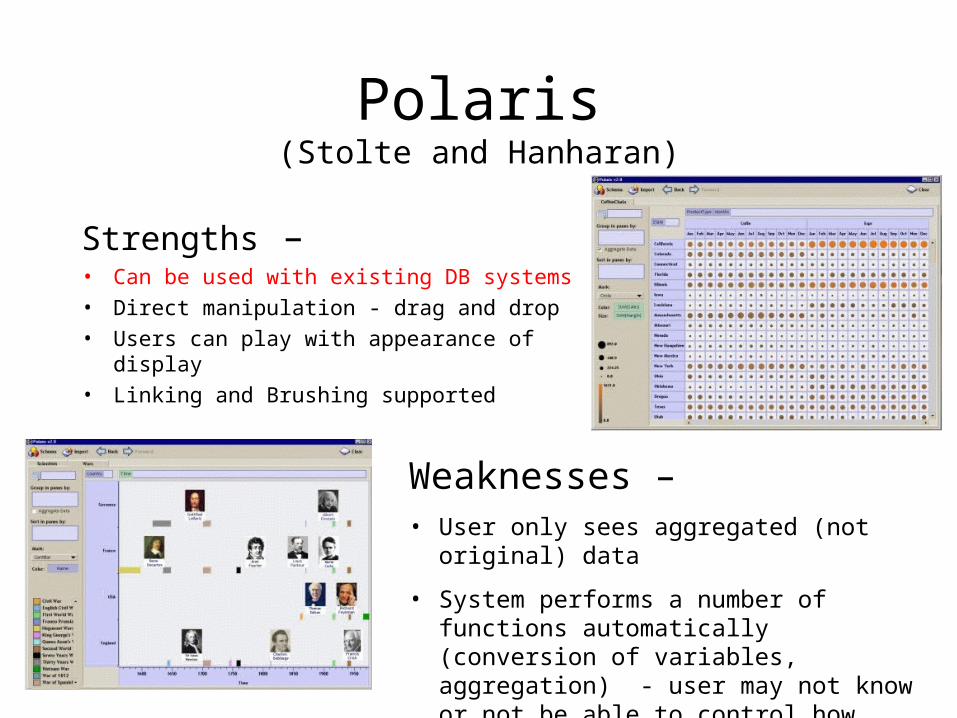
Polaris(Stolte and Hanharan)
Strengths – • Can be used with existing DB systems• Direct manipulation - drag and drop • Users can play with appearance of
display• Linking and Brushing supported
Weaknesses – • User only sees aggregated (not original)
data
• System performs a number of functions automatically (conversion of variables, aggregation) - user may not know or not be able to control how their data is changed.
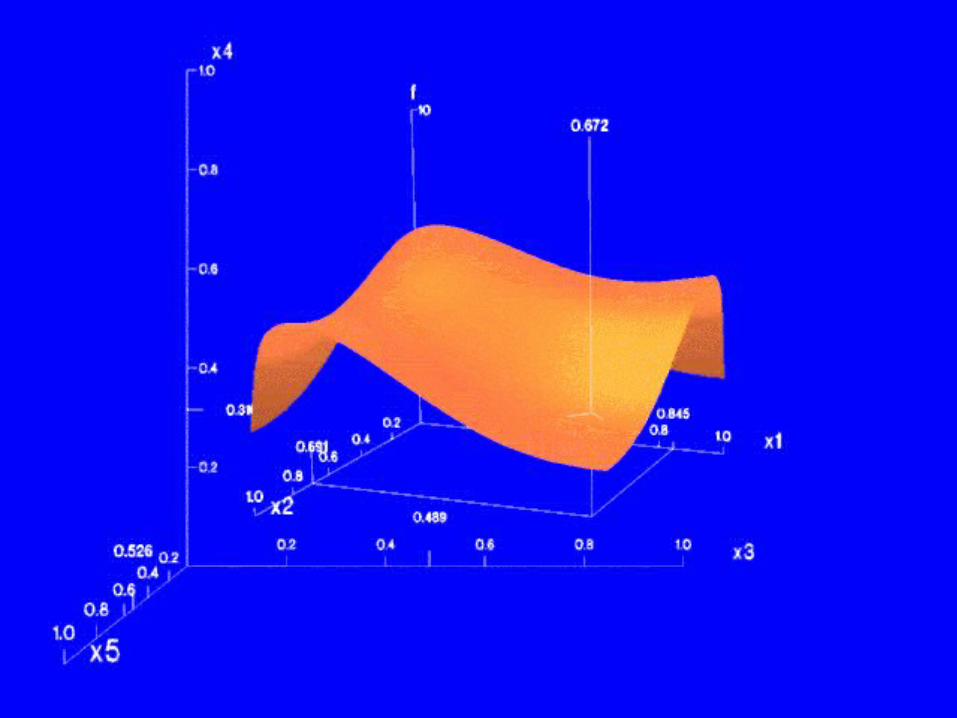
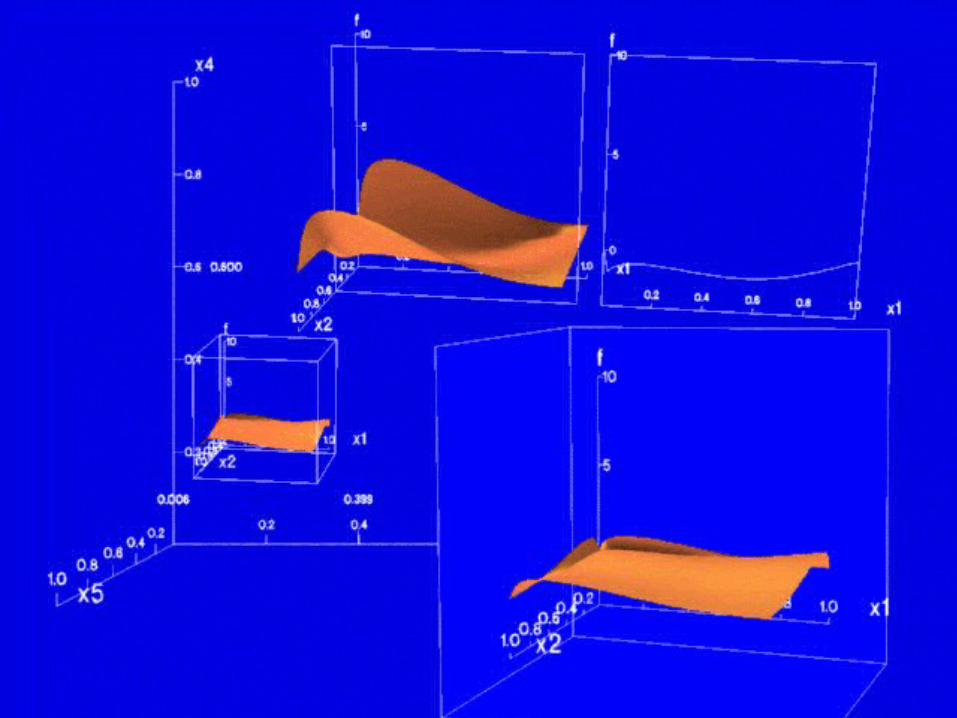
Worlds Within Worlds(Fiener and Beshers)
• Basic approach: graph 3 dimensions, while holding “extra” dimensions constant
• Visually represent “extra” dimensions as space within which graph(s) are placed– Position of “inner world” graph axis zero point
equals set of constant values in “outer world”
• Tools:– Dipstick– Waterline– Magnifying box
The following images from: http://www-courses.cs.uiuc.edu/~cs419/multidim.ppt


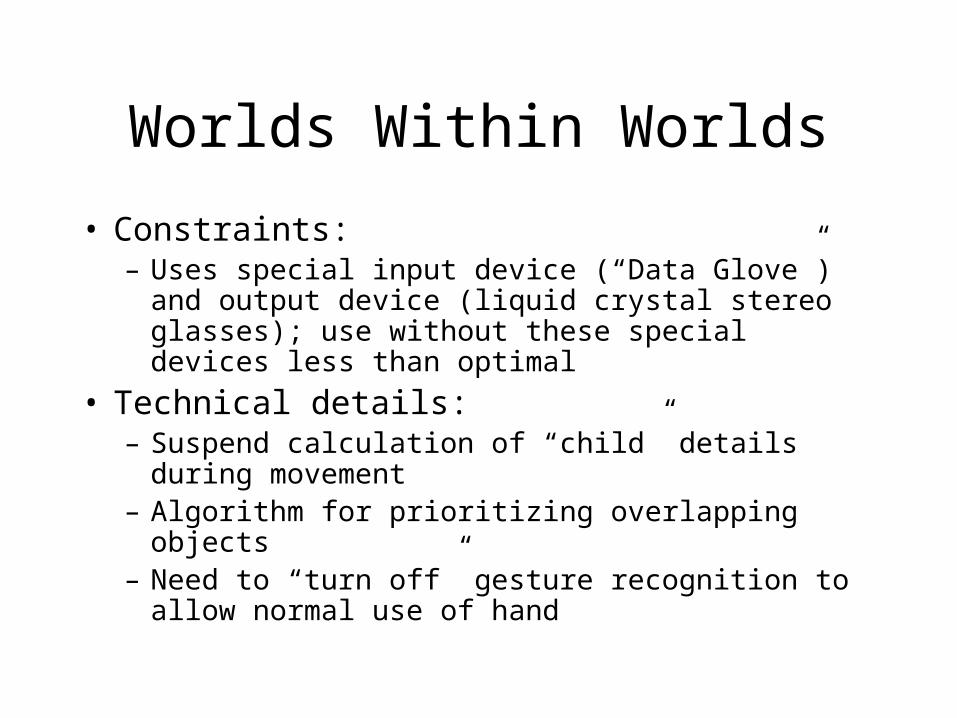
Worlds Within Worlds
• Constraints:– Uses special input device (“Data Glove”)
and output device (liquid crystal stereo glasses); use without these special devices less than optimal
• Technical details:– Suspend calculation of “child” details during
movement– Algorithm for prioritizing overlapping objects– Need to “turn off” gesture recognition to
allow normal use of hand
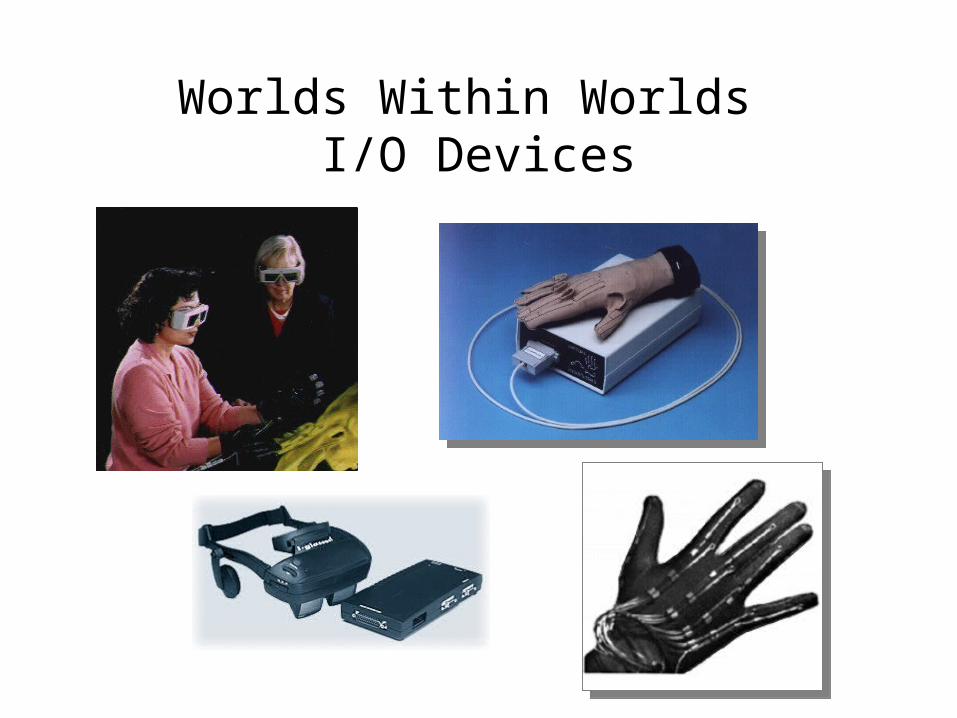
Worlds Within Worlds I/O Devices
Techniques for plotting multivariate functions
(Mihalisin et al)
• Multiples showing component dimensions, color codes for dimensions applied across multiples
• Or, for categorical data, select mth category from nth dimension
• Or, plot nested boxes, step values of independent variables and color-coding dependent variable
Techniques for plotting multivariate functions
(Mihalisin et al)
• Tools:– General zoom: look at smaller range
of data in same amount of space– Subspace zoom: select view of
particular dimension’s input to function
– Decimate tool: sample fewer values within range
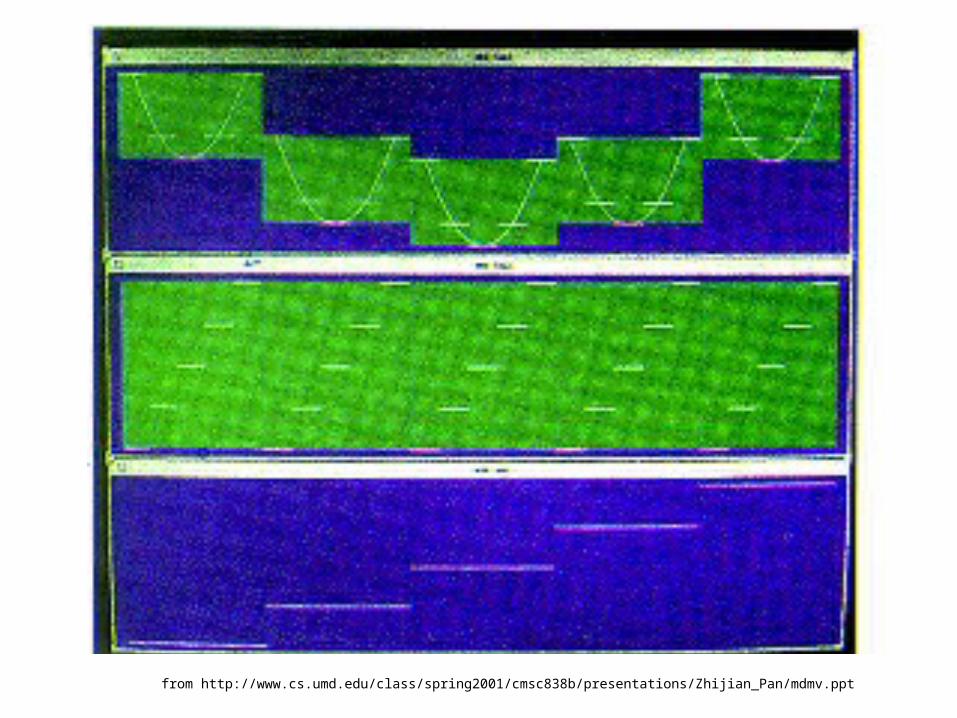
from http://www.cs.umd.edu/class/spring2001/cmsc838b/presentations/Zhijian_Pan/mdmv.ppt
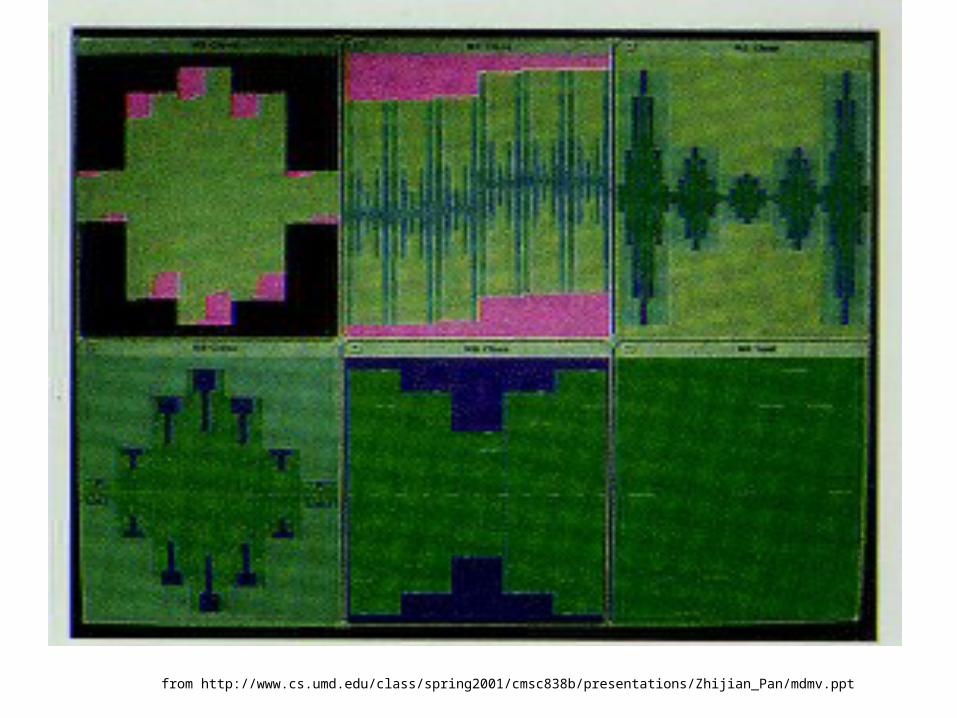
from http://www.cs.umd.edu/class/spring2001/cmsc838b/presentations/Zhijian_Pan/mdmv.ppt
VisDB(Keim & Kriegel)
• Mapping entries from relational database to pixels on the screen
• Include “approximate” answers, with placement and color-coding based on relevance
• Data points laid out in:– Rectangular spiral– Or, with axes representing positive/negative
values for two selected dimensions– Or, group dimensions together (easier to
interpret than very large number of dimensions)
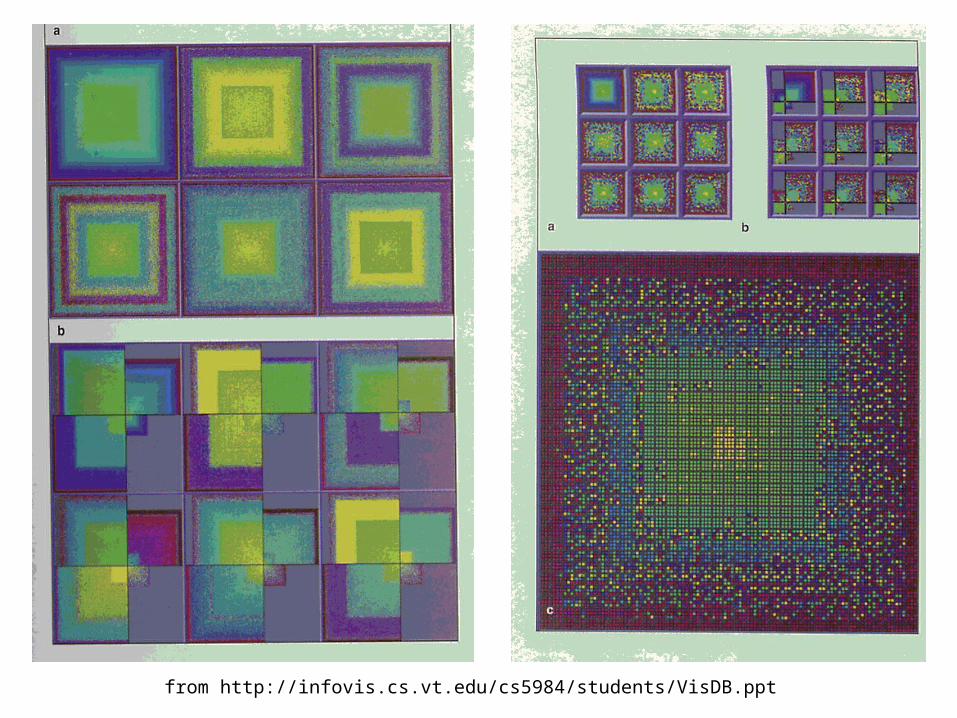
from http://infovis.cs.vt.edu/cs5984/students/VisDB.ppt
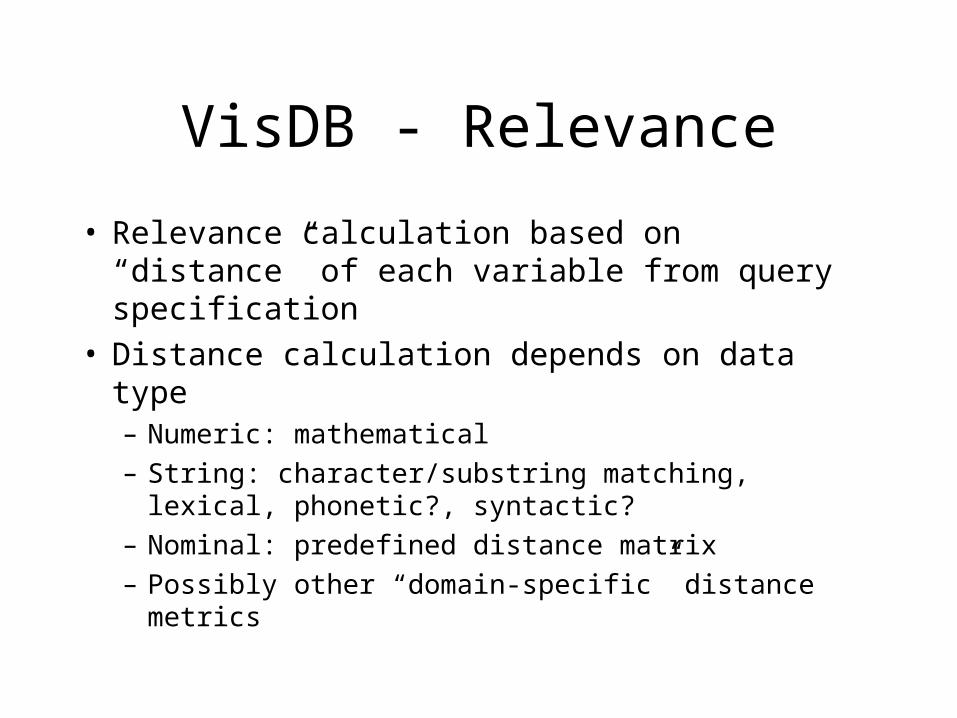
VisDB - Relevance
• Relevance calculation based on “distance” of each variable from query specification
• Distance calculation depends on data type– Numeric: mathematical – String: character/substring matching, lexical,
phonetic?, syntactic?– Nominal: predefined distance matrix– Possibly other “domain-specific” distance
metrics
VisDB – Screen Resolution
• Stated screen resolution seems reasonable by today’s standards:19 inch display, 1024x1280 pixels= 1.3 million data points
• However, controls take up a lot of space!

from http://www1.ics.uci.edu/~kobsa/courses/ICS280/notes/presentations/Keim-VisDB.ppt
VisDB – Implementation
• Requires features not available in commercial databases:– Partial query results– Incremental changes to queries– Speed? (1994 vs today)
Limitations and Issues
• (intro to following slides and/or Tweedie’s words of wisdom?)
Complexity
• Simplest approach to representing N dimensions is N controls, N one-dimensional outputs – but this fails to represent complex relationships
• Middle ground achieved by some?
Abstract data
• These visualizations are oriented toward abstract data
• For “naturally” two or three-dimensional data (things that vary over time or space, e.g., geographic data) visualizations which exploit those properties may exist and be more effective
User Testing?
• Many of these systems seem only appropriate for expert use
Future Work
• Save query parameters for reference / sharing results
• Automated query generation or filtering – Intelligent agents?
Words of wisdomfrom Tweedie et al
• Trade-off between amount of information, simplicity, and accuracy
• “It is often hard to judge what users will find intuitive and how [a visualization] will support a particular task”