Multi-sensor Integrated Agricultural Drought Monitoring ...
24
Multi-sensor Integrated Agricultural Drought Monitoring and Assessment 2017.05.12 Reporter: Xiang Zhang (PhD candidate) Supervisor:Prof. Nengcheng Chen Prof. Dev Niyogi
Transcript of Multi-sensor Integrated Agricultural Drought Monitoring ...
Multi-sensor Integrated
Agricultural Drought
Monitoring and Assessment
2017.05.12
Reporter: Xiang Zhang (PhD candidate)
Supervisor:Prof. Nengcheng Chen
Prof. Dev Niyogi
Page 2
Outline
Current Drought Research
New Drought Index: PADI
Experiment of PADI in China and US
Conclusions
Page 3
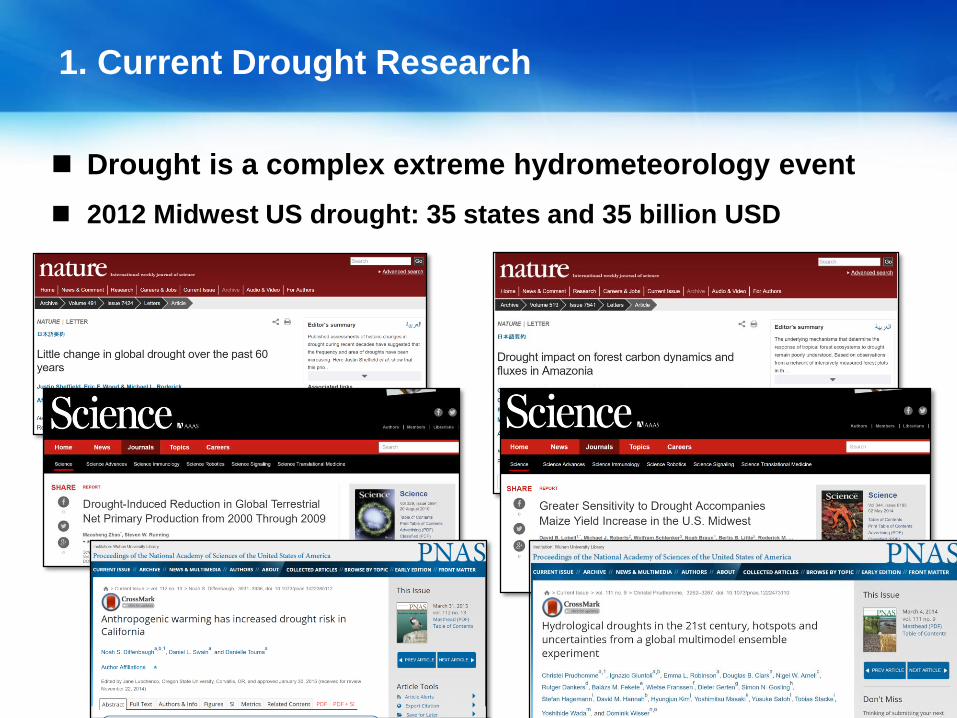
1. Current Drought Research
Drought is a complex extreme hydrometeorology event
2012 Midwest US drought: 35 states and 35 billion USD
Page 4
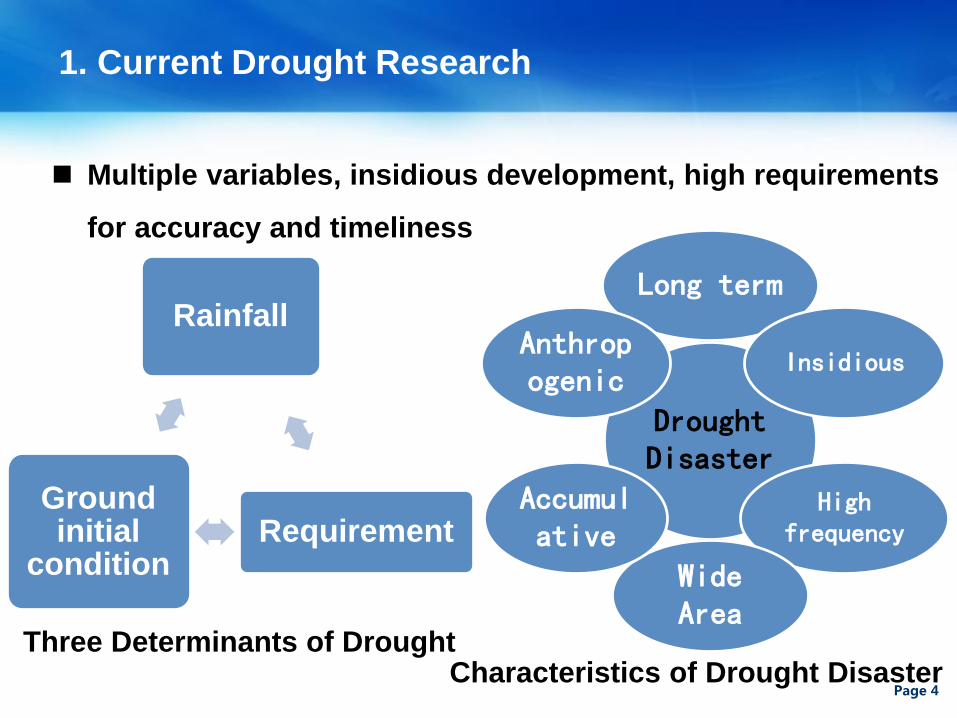
1. Current Drought Research
Multiple variables, insidious development, high requirements
for accuracy and timeliness
Rainfall
RequirementGround initial
condition
Drought Disaster
Long term
Insidious
High frequency
Wide Area
Accumulative
Anthropogenic
Three Determinants of DroughtCharacteristics of Drought Disaster
Page 5
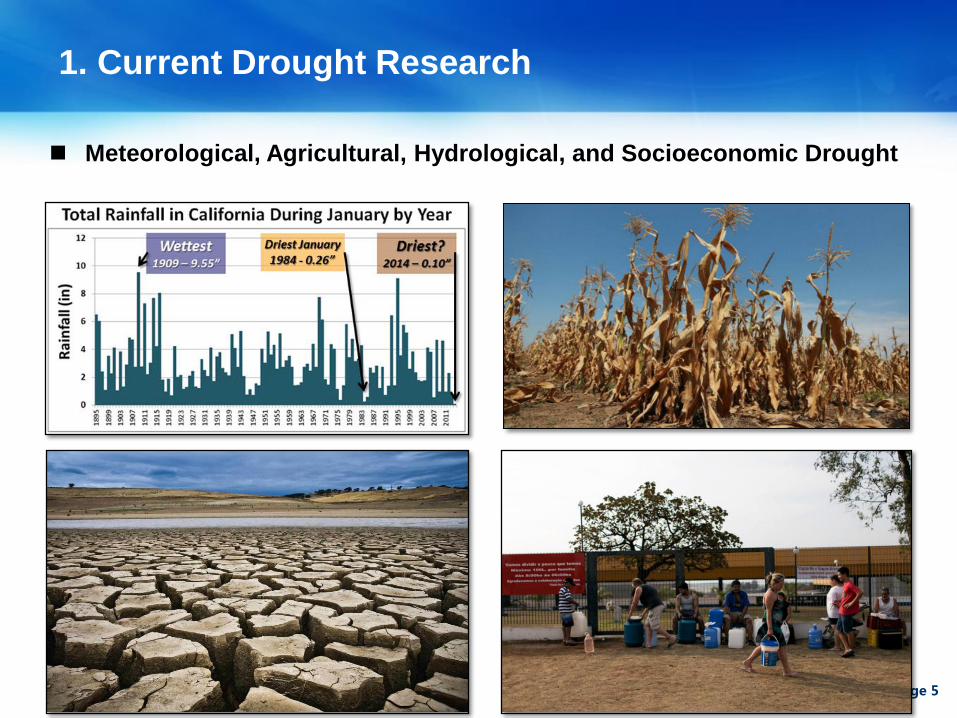
1. Current Drought Research
Meteorological, Agricultural, Hydrological, and Socioeconomic Drought
Page 6
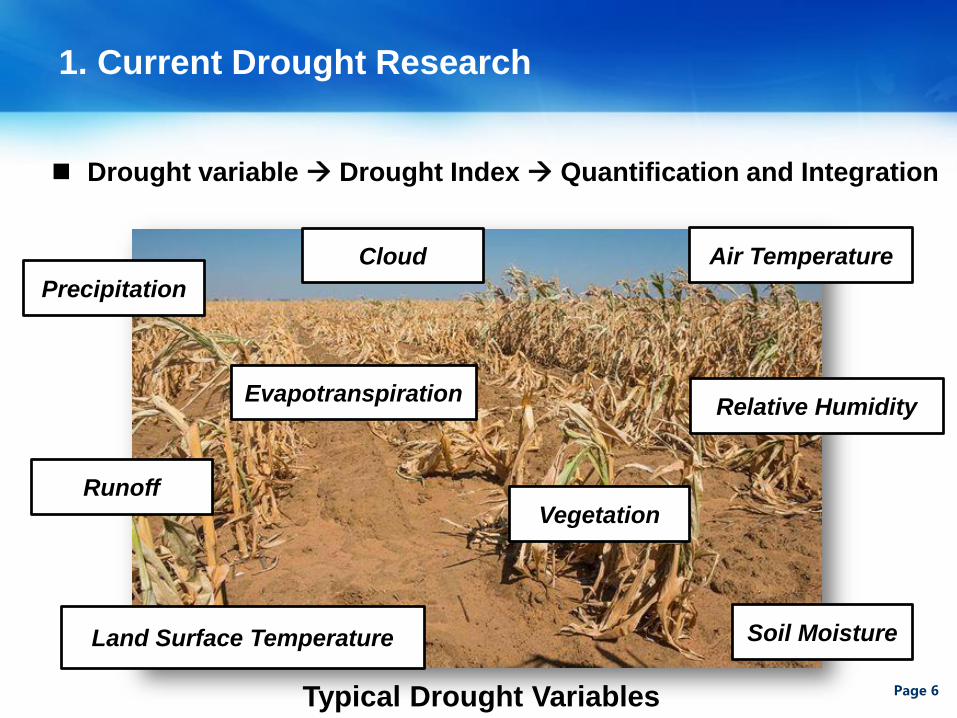
1. Current Drought Research
Typical Drought Variables
Precipitation
Cloud Air Temperature
Soil Moisture
RunoffVegetation
Relative Humidity
Land Surface Temperature
Evapotranspiration
Drought variable Drought Index Quantification and Integration
Page 7
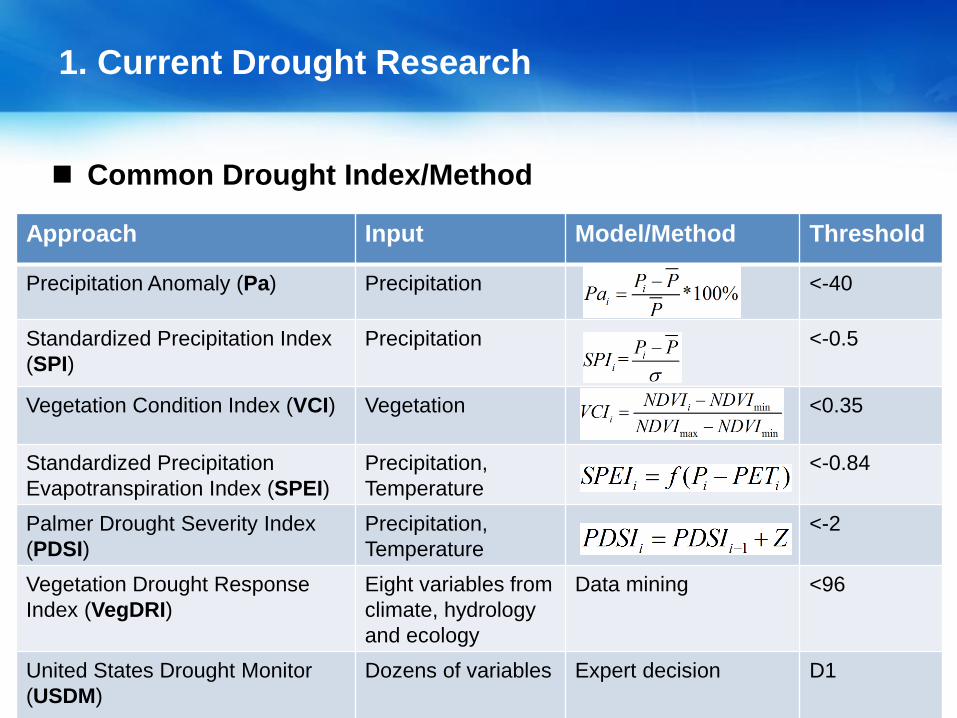
Approach Input Model/Method Threshold
Precipitation Anomaly (Pa) Precipitation <-40
Standardized Precipitation Index
(SPI)
Precipitation <-0.5
Vegetation Condition Index (VCI) Vegetation <0.35
Standardized Precipitation
Evapotranspiration Index (SPEI)
Precipitation,
Temperature
<-0.84
Palmer Drought Severity Index
(PDSI)
Precipitation,
Temperature
<-2
Vegetation Drought Response
Index (VegDRI)
Eight variables from
climate, hydrology
and ecology
Data mining <96
United States Drought Monitor
(USDM)
Dozens of variables Expert decision D1
1. Current Drought Research
Common Drought Index/Method
Page 8
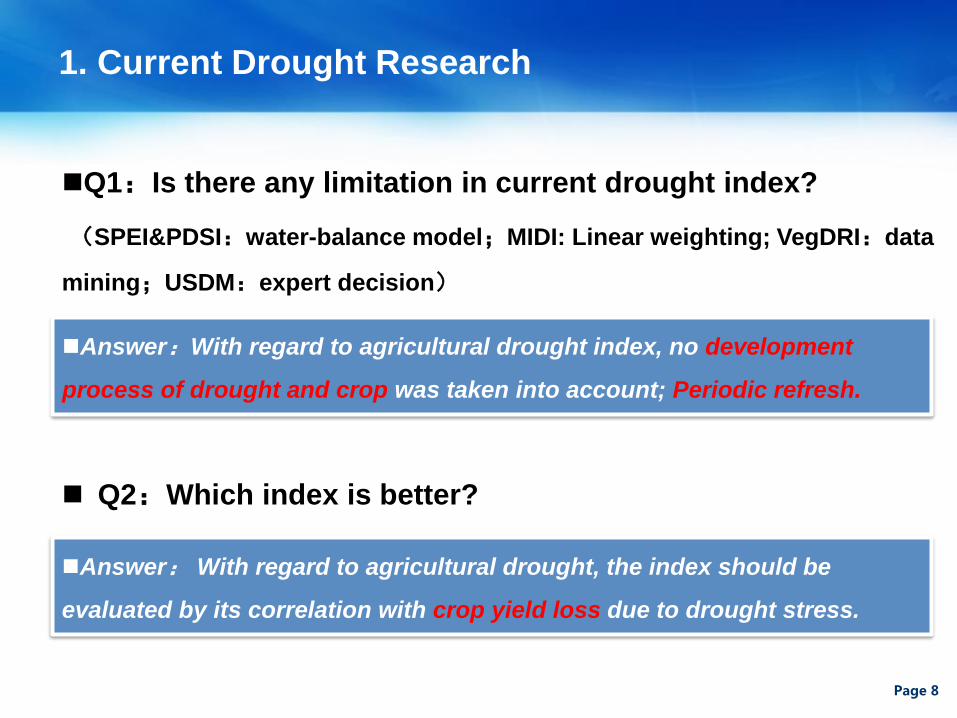
1. Current Drought Research
Q2:Which index is better?
Answer: With regard to agricultural drought, the index should be
evaluated by its correlation with crop yield loss due to drought stress.
Q1:Is there any limitation in current drought index?
(SPEI&PDSI:water-balance model;MIDI: Linear weighting; VegDRI:data
mining;USDM:expert decision)
Answer:With regard to agricultural drought index, no development
process of drought and crop was taken into account; Periodic refresh.

Page 9
2. New Drought Index: PADI
PADI:Process-based Accumulated Drought Index
Process
of an
agricultu
ral
droughtProcess
of wheat
PADI
Page 10
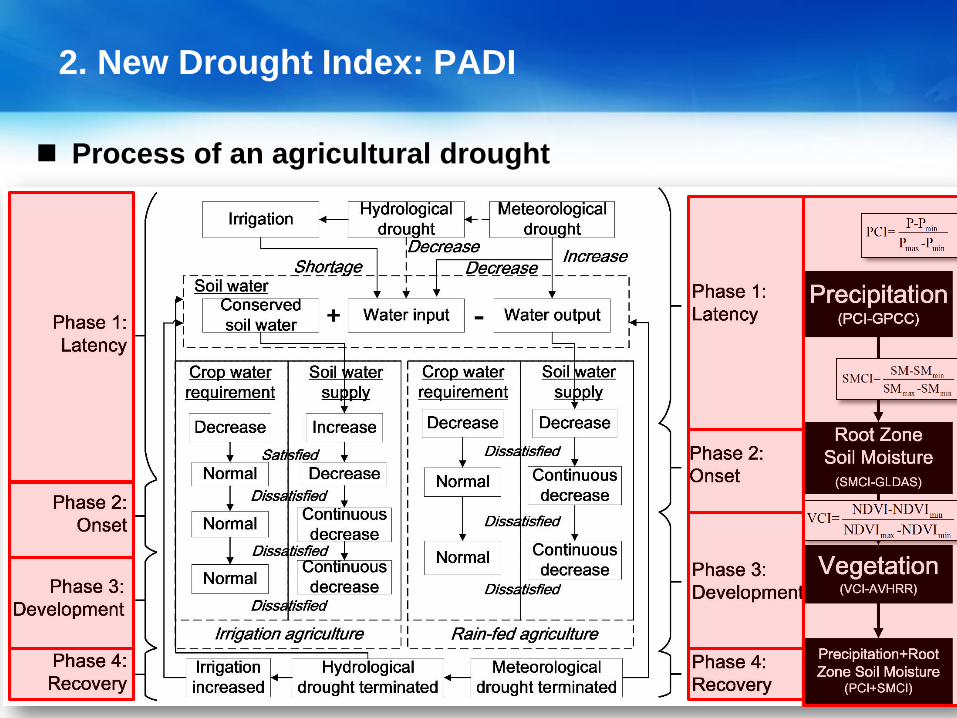
2. New Drought Index: PADI
Process of an agricultural drought
Page 11
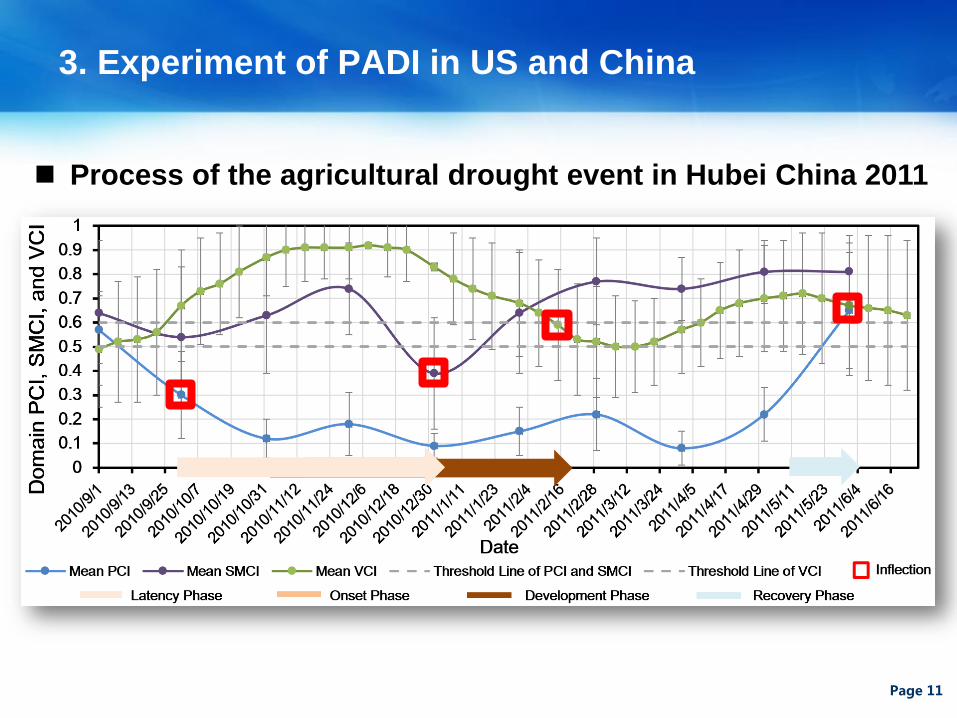
3. Experiment of PADI in US and China
Process of the agricultural drought event in Hubei China 2011
Page 12
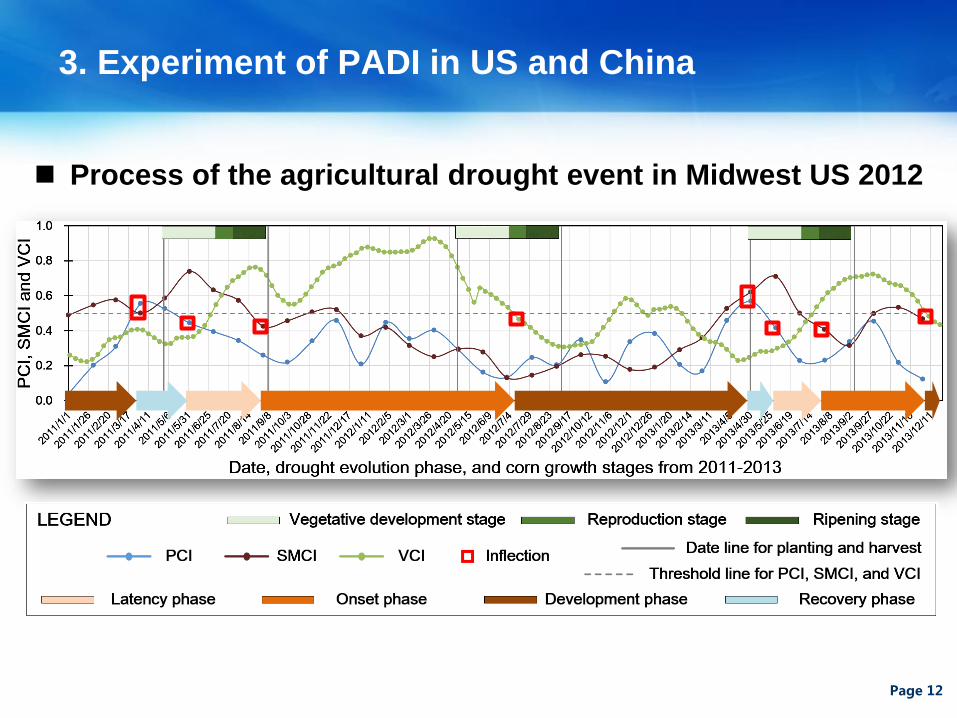
3. Experiment of PADI in US and China
Process of the agricultural drought event in Midwest US 2012
Page 13
2. New Drought Index: PADI
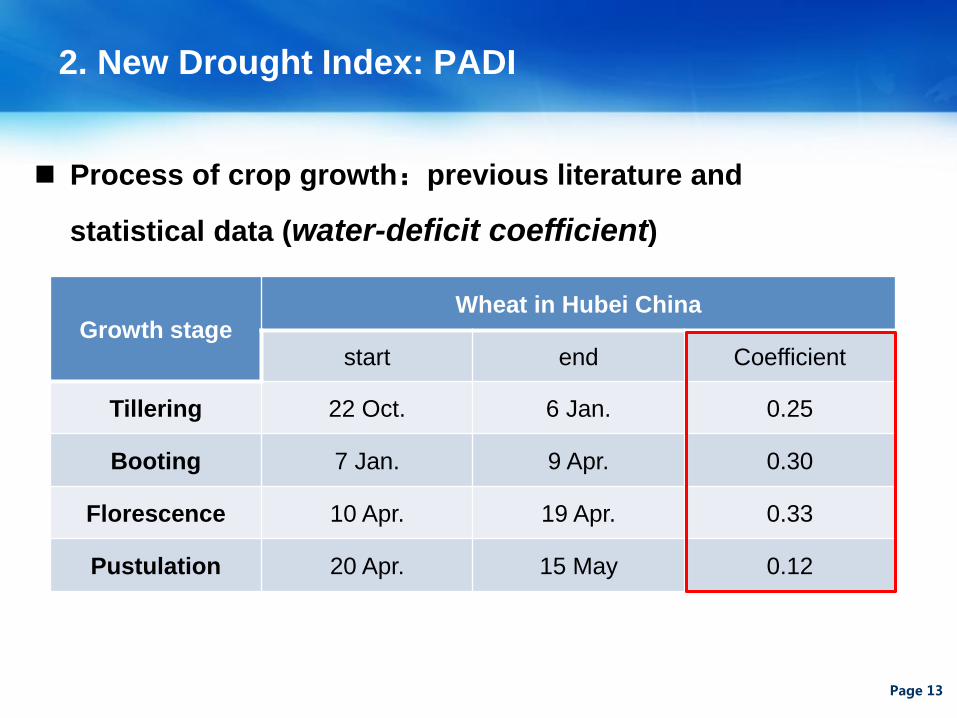
Process of crop growth:previous literature and
statistical data (water-deficit coefficient)
Growth stageWheat in Hubei China
start end Coefficient
Tillering 22 Oct. 6 Jan. 0.25
Booting 7 Jan. 9 Apr. 0.30
Florescence 10 Apr. 19 Apr. 0.33
Pustulation 20 Apr. 15 May 0.12
Page 14
2. New Drought Index: PADI
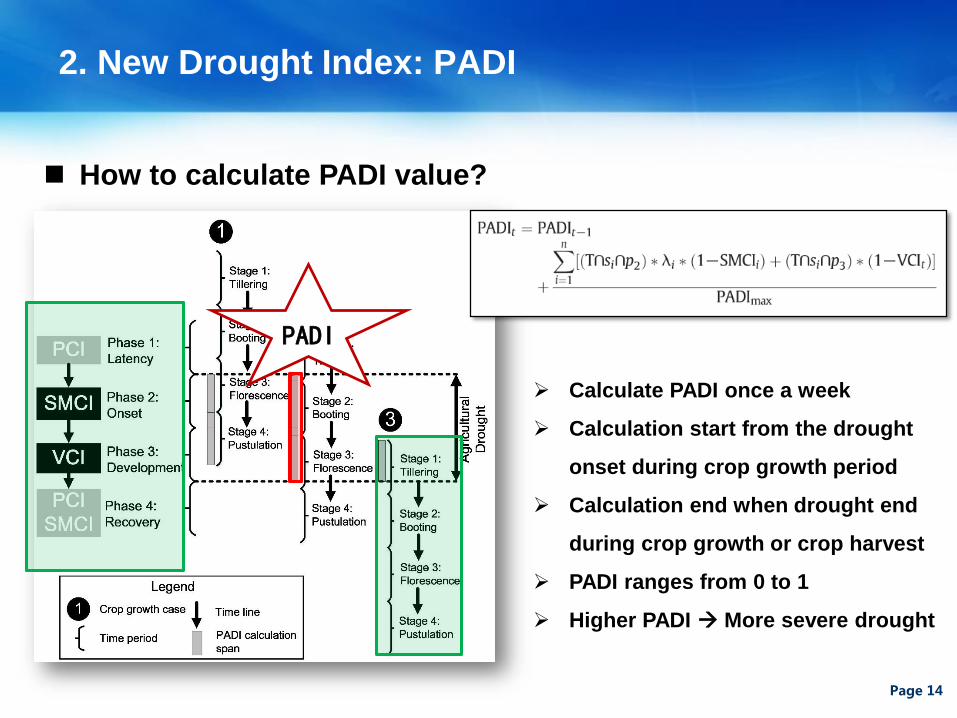
How to calculate PADI value?
Calculate PADI once a week
Calculation start from the drought
onset during crop growth period
Calculation end when drought end
during crop growth or crop harvest
PADI ranges from 0 to 1
Higher PADI More severe drought
PADI
Page 15
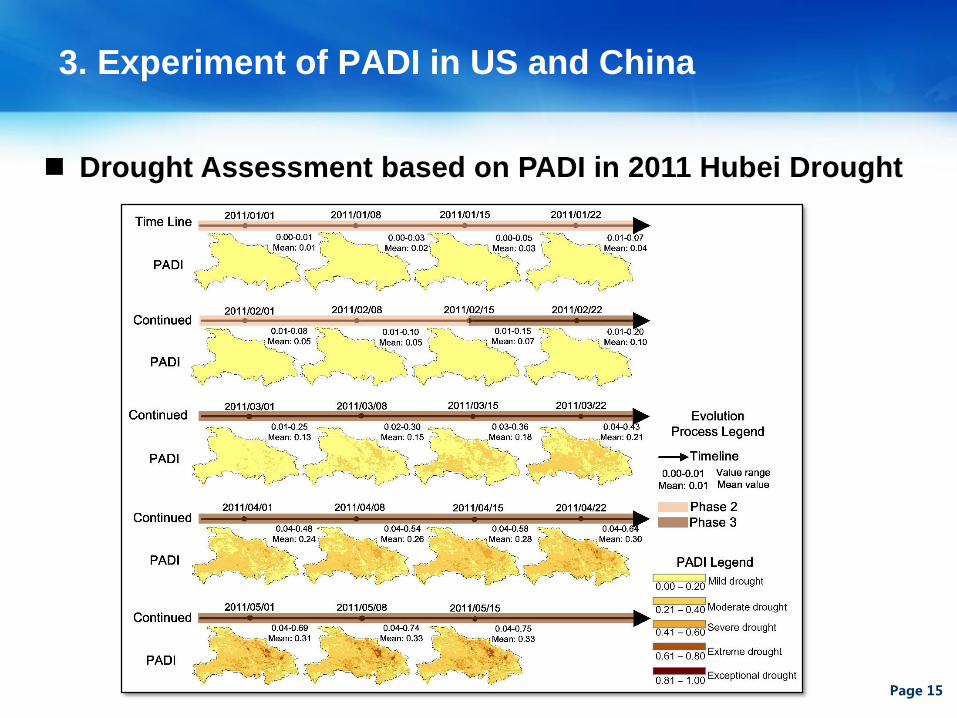
3. Experiment of PADI in US and China
Drought Assessment based on PADI in 2011 Hubei Drought
Page 16
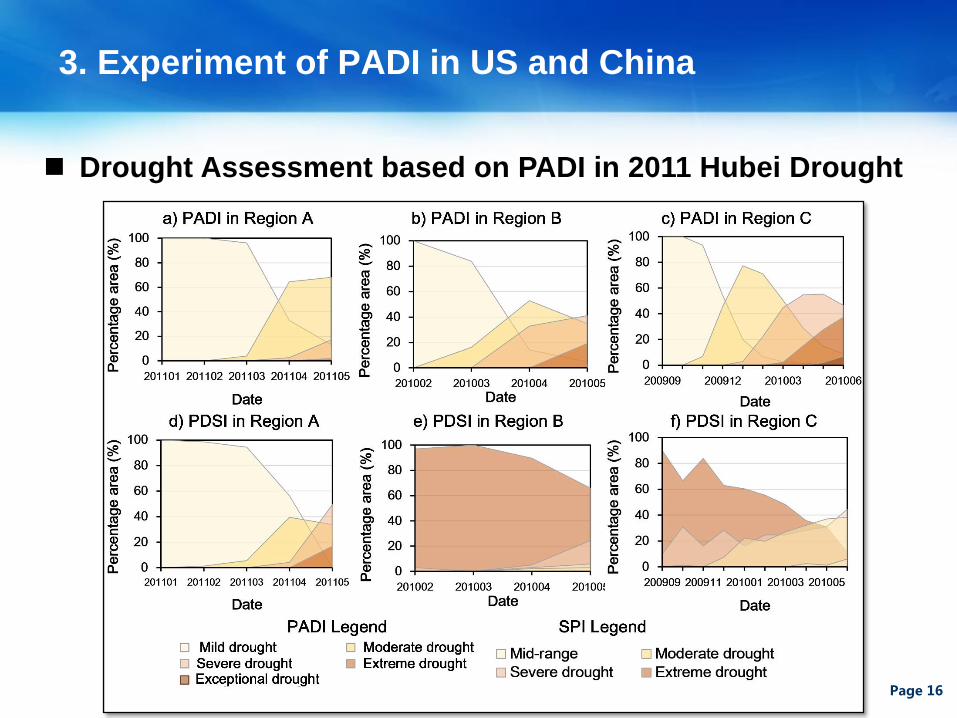
3. Experiment of PADI in US and China
Drought Assessment based on PADI in 2011 Hubei Drought
Page 17
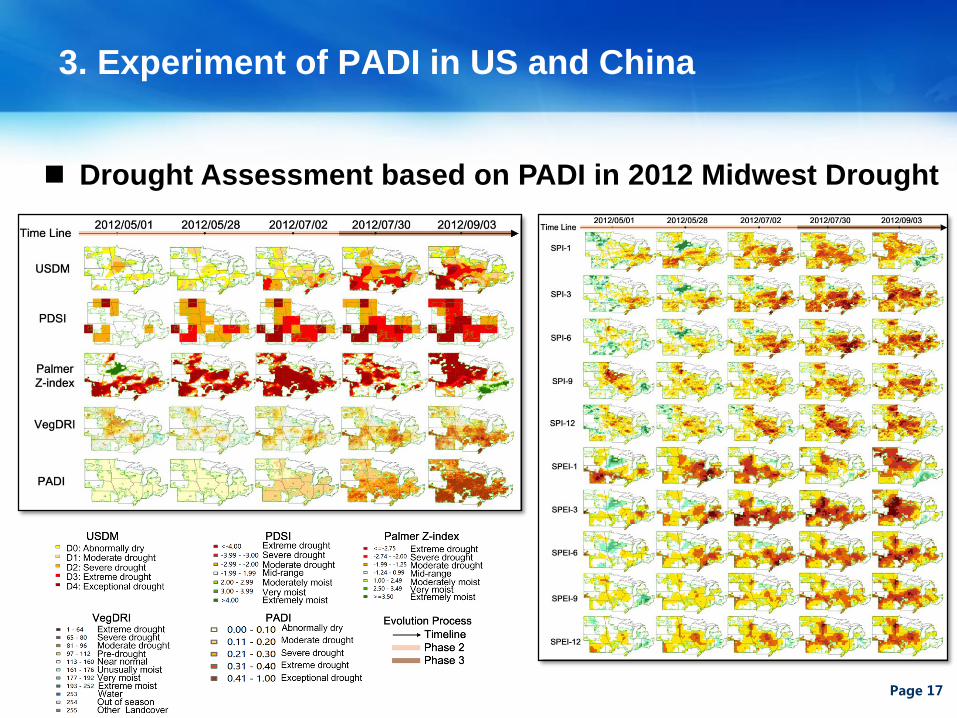
3. Experiment of PADI in US and China
Drought Assessment based on PADI in 2012 Midwest Drought
Page 18
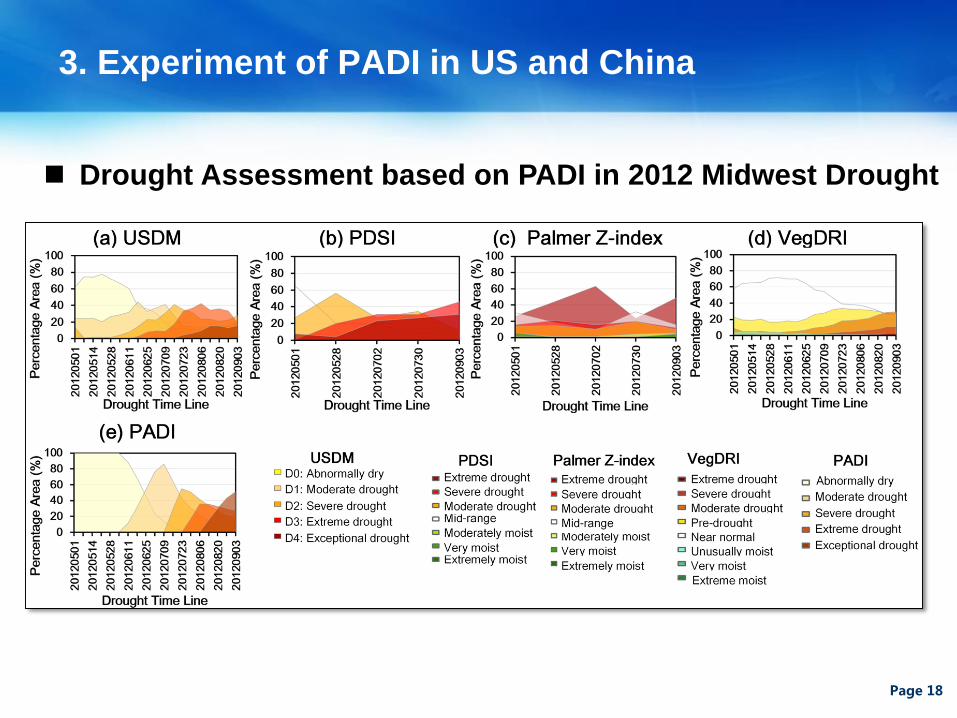
3. Experiment of PADI in US and China
Drought Assessment based on PADI in 2012 Midwest Drought
Page 19
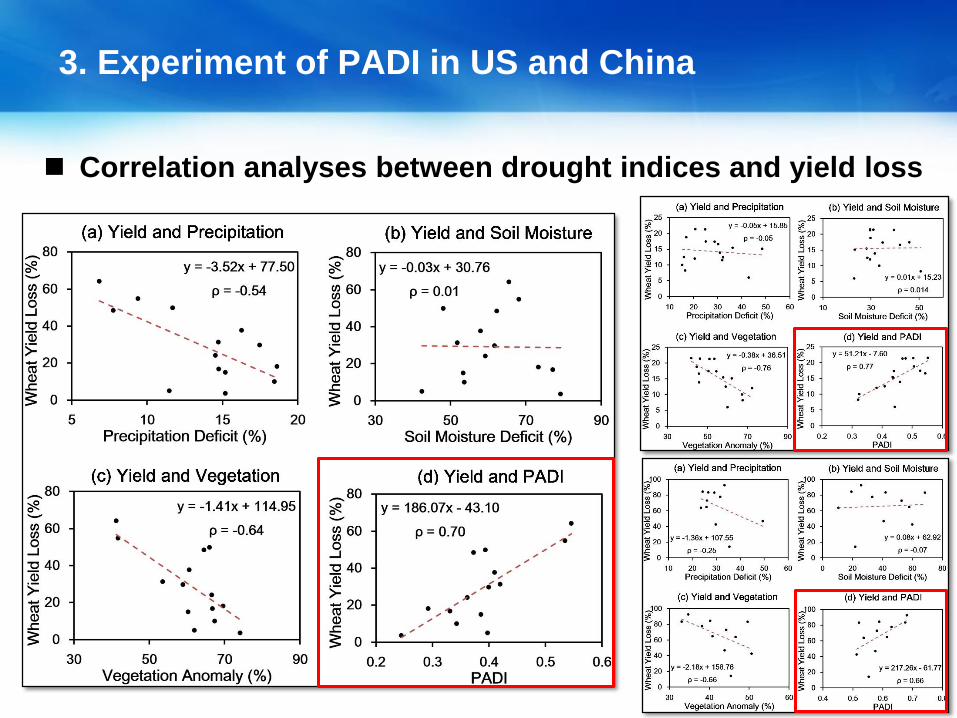
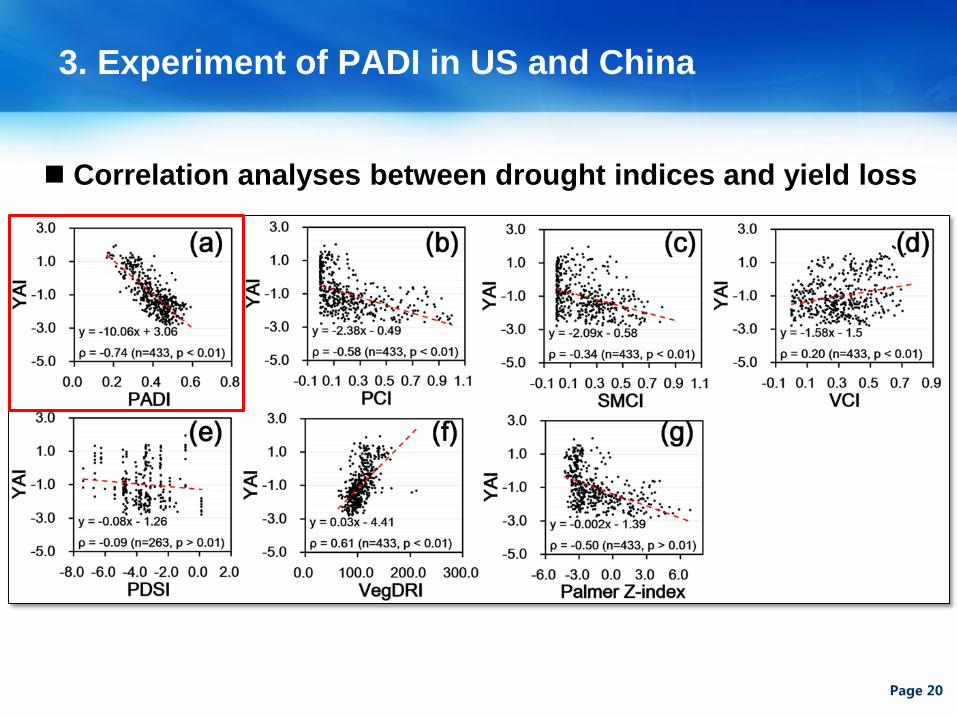
3. Experiment of PADI in US and China
Correlation analyses between drought indices and yield loss
Page 20
3. Experiment of PADI in US and China
Correlation analyses between drought indices and yield loss
Page 21
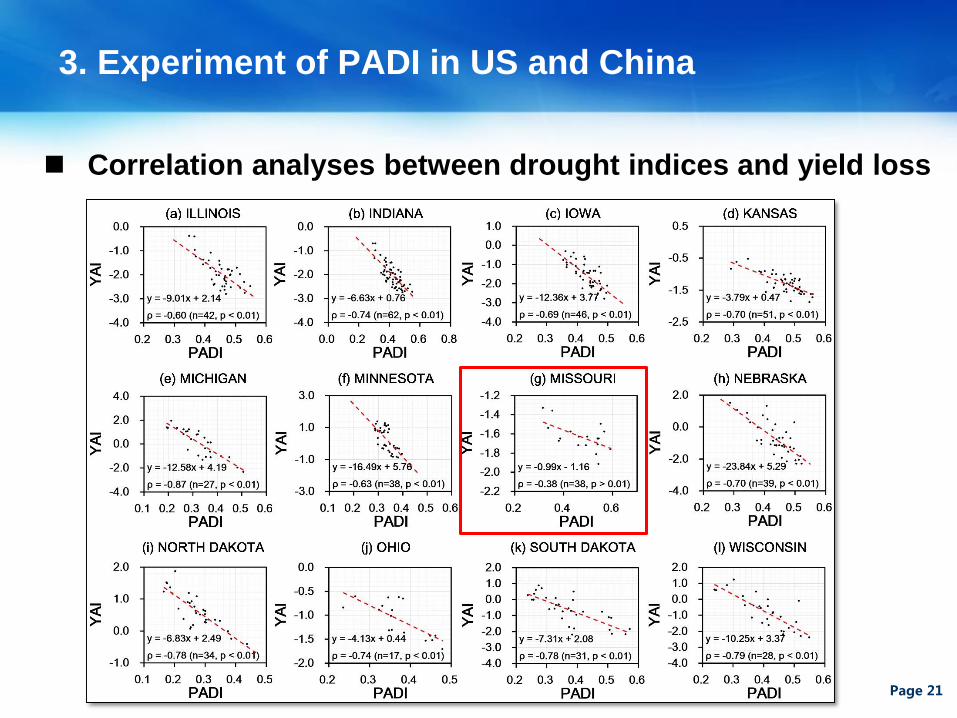
3. Experiment of PADI in US and China
Correlation analyses between drought indices and yield loss
Page 22
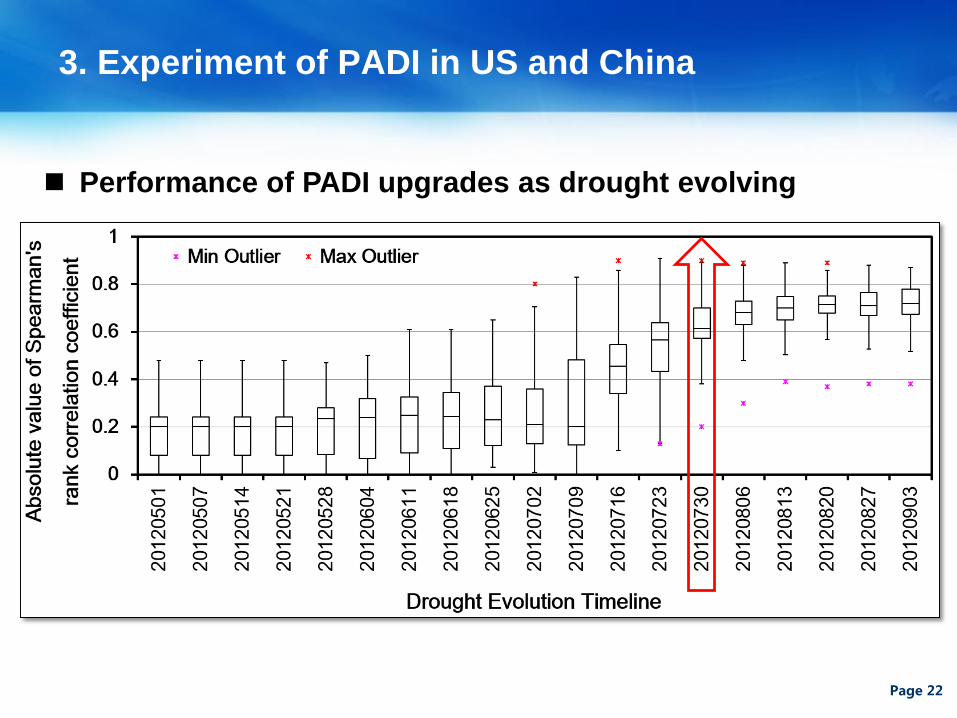
3. Experiment of PADI in US and China
Performance of PADI upgrades as drought evolving
Page 23
4. Conclusions
Based on the basic principle of drought development and impact,
precipitation, root zone soil moisture, and vegetation condition
have been integrated to the proposed PADI model.
Experiments in China and US demonstrated PADI can accurately
and stably calculated accumulated drought impacts on crops,
which is better than other indices when assessing an agricultural
drought disaster.
Future: operational monitoring system, real-time assessment, and
accurate drought reports for the government and public.
Zhang, X., N.C. Chen, Z.H. Chen, and D. Niyogi (2017), Multi-sensor integrated framework and
index for agricultural drought monitoring, Remote Sensing of Environment, 188, 141-163.
Zhang, X., Wei C.H., Obringer R., Chen N.C., and D. Niyogi (2017), Gauging the Severity of 2012
Midwest U.S. Drought for Agriculture, Remote Sensing, Under Review.
Thank you
for your attention!
©2017 Wuhan University, LIESMARS
Acknowledgements:
National Basic Research Program of China (973 Program) (No. 2011CB707101), China Scholarship
Council (CSC) (No. 201506270080), NSF CAREER AGS, USDA/NIFA grant on drought triggers and global
trade 2011-67019-20042 and 2015-67023-23109, USDA NIFA Hatch Project 1007699.