Multi-sectoral assessment on the impact of floods in ... rapid... · Multi-sectoral assessment on...
36
1 Multi-sectoral assessment on the impact of floods in Beletweyne 15 October 2012 By WFP, UNICEF, UNOCHA, WHO, SC-UK, DRC
Transcript of Multi-sectoral assessment on the impact of floods in ... rapid... · Multi-sectoral assessment on...

1
Multi-sectoral assessment on the impact of floods in Beletweyne
15 October 2012
By WFP, UNICEF, UNOCHA, WHO, SC-UK, DRC

2
Acknowledgement
The multi-sectorial rapid assessment was undertaken to understand the
situation and needs of the flood affected population in Beletweyne after the
inter Agency mission to Belet weyne on 8th October 2012. It was found that
it was necessary to do this assessment. The challenge was taken up quickly
by the Flood Task Force with a big support from WFP that avail the tools
and the logistical support and also offered to do the initial report.
We are grateful to WFP support to make this assessment possible at the
shortest time. We are also grateful to the entire Flood Task Force and we
commend the effort of each one of you.

3
Executive summary Area affected by the flood: Over 85% of Beletweyne town was affected which means
that the floods got into homesteads and caused a degree of damage. However the impact
varies and the worst affected areas of Beletweyne town include Bundaweyn section,
Xaawotaako section (Kutimbo sub-section), Hilaac, Hegan and Kooshin.
Where are the displaced people: Members of the Floods ResponseTask Force and
assessment team estimated that about 65 % of the displaced people are in Ceeljaale IDP
site (3 KM on the East-side of Beletweyne) while 35% are in Israac and Suuqaxoolaha
IDP sites and in Hilaac and Heegan section (West-side of Beletweyne).
Major non-food concerns: WASH and shelter are the major nonfood needs.
Number of affected people: The assessment team could not draw any conclusion on
the total number of affected people based on the small sample of households
interviewed during the rapid initial investigation. However, based on the previous
estimations by the Flood Response Task Force coupled with observations made before
and during assessment, the number of displaced households who are now in Ceeljaale
and Hawlwadaag are estimated as more than 5,000 households.
Current food assistance: WFP (1750 HH), Private sector, SC UK (400 HHs), ICRC
(reportedly 10,000HH) and UNICEF’s nutrition products of BSFP reaching over 6000
HH, covered about 90% of the IDP food needs. However, there are concerns over the
one-off kind of response by private sector companies, like telecommunications and
money-transfer, which distributed wheat flour, sugar and rice, but will probably not
extend their assistance in November and December, before the end of the rainy season.
Other concerns: During the assessment it was noted that there are targeting problems
such as selection of beneficiaries, distribution of assistance and management of
distribution process and which already led to human casualties and looting of
assistance. The role of the local authorities in strengthening coordination mechanisms
and ensuring safe distribution of assistance should be enhanced.
Main recommendations by sector:
Food: Based on the findings of the initial assessment, general food distributions
(GFD) could be continued for those households that have been displaced by the
floods taking into consideration the differences between the settlements and
population groups. Secondly, depending on available capacities and resources on the
ground low-tech food-for-work (FFW).programmes could be implemented to
address problems caused by the flooding, such as removal of stagnant water in the
city or stabilization of river banks. A combination of the two activities (GFD and
FFW) is also possible. The duration of the food assistance should be two months

4
(November to December 2012) to allow sufficient time for households to recover
and resume their livelihoods.
WASH: The need for emergence latrines in for the IDPs in the new sites has
remained unaddressed. This needs to be taken up by the WASH cluster. The
possibility is that the population will stay longer at these sites due to the fear of
possible floods reoccurring. There is also need to rehabilitate the collapsed public
latrines and toilets in town as people have started to return. The dirty/stagnant
water is expected to dry soon. However, scattered faeces and dump garbage
found everywhere in the town and in IDP camp is posing a health hazard to the
population. There is urgent need for Garbage collection and cleaning of the town.
The proposed food for work could be used to address this plus direct
intervention by WASH cluster. While the Households in the IDP sites are
benefiting from the ongoing water tracking the need to rehabilitate the drinking
water sources is urgent to provide sustainable solution. In the short run the
water tracking also needs to continue for at least in the month of Novemebrs.
Shelter: Shelter and NFI needs still exist. Though the assessment could not be
definite about the number at least there is need for approximately 8% of the
5200HHs (400- 500 kits). Intervention will need to be target to the families that
have missed out. Another quick assessment of shelter needs will need to be
carried out by the shelter cluster to ascertain numbers.
Education: The affected schools need to be rehabilitated and the ones occupied
to be evacuated by the IDPs. Education kits consisting of reference materials and
stationeries to be replaced.
Health and Nutrition: No outbreak has been reported but there is need for
constant surveillance. There is also need to mitigate the health hazards by
eliminating potential causal conditions like cleaning stagnant water and garbage
and provision of latrines. The nutrition situation is not worrying. It is
recommended to continue with the current nutrition intervention.
Agriculture and livelihood: As noted agriculture, business and casual labour
and self-employment are the main livelihood sources of the people in
Beletweyne. The floods adversely affected this. There is need for quick after flood
intervention. Provision of seeds to the Agro pastoral households and restocking
and other sources of livelihood is recommended for the population to recover.

5
Background
Flash floods struck Beletweyne town on the 28th of September 2012 following heavy
rains that caused the Shabelle River to burst its banks. Beletweyne is the regional
headquarter of Hiran region and the Shabelle river passes through the 4 main sections of
the town.
According to UNDP 2005 population estimate around 36469 urban populations live in
Beletweyne including Mataban urban. However considering the population growth over
this period and the IDP arrivals, the numbers of people are more than this estimate. The
local authorities in Beletweyne say there are more than 150,000 urban people in
Beletweyne.
Agriculture, business and casual labour and self employment are the main livelihood
sources of the people in Beletweyne. The floods have affected each of these sources in
one way or another.
Based on clan affiliations the population is grouped into the Eastside dominated by one
main clan and the Westside where there are a number of clans and the current local
administration is also stratified on these basis with a deputy governor and district
commissioner sitting on each side.
The security situation is extremely volatile and there have been several killings and
explosions since the district was liberated from AS rule 10 months ago. Apart from the
Shabelle valley forces allied to the Somali government, there are the ENDF and AMISOM
troops who have camps on the eastern outskirt of the town. Despite the presence of
these forces, residents live in fear and threat from AS and occasional targeted killings
continues to exists. Insecurity is manifested more in the eastern part of the town where
the foreign troops have deserted (vacated to the East side) after the floods have
occurred in September. Day time curfew of more than 6 hours (From 6:00 AM – 12:15
PM has been imposed by the Ethiopian forces since their arrival in January 2012 and
people are not allowed to carry out business and trading activities. Households have
coped with these challenges by purchasing their daily domestic needs for the following
day after the curfew is lifted. Though less safe, the curfew doesn’t affect much the people
in the west side of the town and business open quite earlier than the Eastside.
Fortunately, a flood preparedness task force was already in place prior to the flooding
comprising of representatives from the local authorities and agencies working in
Beletweyne who have been quick in responding with the initial assessment. The task
force came up with an initial estimation of 5,200 affected households (including 1700
old IDPs which were also affected by the floods). Furthermore, the initial assessment
noted that the floods affected all the 4 main sections of Beletweyne(Xawotako,
Howlwadag, Bundaweyn and Kooshin) but there are some sub-sections such as
Kutimbo, Hilaac, Heegan and parts of Bundaweyn that were worst affected by the flood.

6
The flood response task force led by UNOCHA had been coordinating initial aid
responses and provided daily updates on assistance level (UNOCHA response matrix,
October 1- 15, 2012). So far there have been different forms of interventions from
humanitarian agencies ( UN agencies/INGOs and LNGOs), the private sector
(Telecommunications and money transferring companies) and Diaspora communities
who have responded with food, NFI, temporary shelter (Tarpaulin), water, medicines
and mosquito nets among other items. Despite these responses, adverse living
conditions were observed by the assessment team mainly in Ceeljaale and
SuuqaxoolahaIDp camps with extremely poor shelter, sanitation, water and hygiene
conditions.
1. Objectives, methodology and limitations of the assessment
2.1 Objectives
The multi-sectorial rapid assessment was undertaken to understand the situation and
needs of the flood affected population in Beletweyne town of Hiran region of Somalia.
More specifically, the objectives of this assessment was specifically defined to focus on
priority needs of the flood victims in the immediate and near future, taking into account
the current level of assistance (Food, shelter, NFI and water) that has been provided
since the floods first occurred on 28 September 2012
2.2 Methodology
The data collection exercises was undertaken on the 10th of October by interagency team
comprising of 16 LNGOs operating in Beletweyne, 2 INGO ( DRC and SC – UK) and 3 UN
agencies (UNICEF, UNOCHA and WFP). For details, see list in the annex.
Prior to conducting the rapid assessment most of the participating organizations were
already engaged in the flood response efforts coordinated through a joint task force led
by UNOCHA and the Humanitarian coordinator appointed by Hiran local administration.
However, it is important to mention that the need to conduct a joint rapid assessment
only aroused from the coordination meetings and as such there were no advance
preparation. The team therefore revised available tools (WFP rapid Emergency food
security assessment household questionnaire and a focus group discussion checklist for
rapid interagency assessment - see annexes).
This was followed by one day quick training and familiarization exercise facilitated by
WFP and OCHA staff who have previously used the data collection tools. The planning
session for the number of places to visit and number of questionnaires to administer as
well as the selection of team members and supervisors was jointly done the same day.
In total, 60 Households interviews and 12 FGD interviews were conducted in 8 sites, 4
sections of the town and 4 IDP sites where the flood affected households settled. It
should be noted that the selection of the data collection sites was purely purposeful in
the sense that those sites hit hardest by the floods and which were accessible in terms of

7
the security have been selected. However, the assessment team had ensured a degree of
coverage balance between the 2 sides of Beletweyne town and IDP sites. Table 1 below
shows the sites visited and number of interviews conducted in each site.
Name of site Which side of B/W
Number of HH interviews
Number of FGD interviews
GPS-North GPS-East
Ceeljaale East Side 4 4 4.74543 45.23813 Bundaweyn East Side 25 1 4.73552 45.20667 Hilaac West Side 2 1 4.73957446 45.20016229
Heegan West Side 2 1 4.73176711 45.19353016
Kooshin East Side 5 1 4.73692 45.20169 SuuqaXoolaha West Side 8 2 4.73007 45.19164
XaawoTaako East side 6 1 4.74434 45.21668 Israac West side 8 1 4.74012052 45.19074862
Total 60 12
Google map of visited sites (IDP sites and flood affected sections of Beletweyne town)
2.3 Limitations of the assessment
i. INSECURITY - Given the volatile security situation of Beletweyne town the data
collection teams concentrated only on the accessible areas of the Westside and had
to spend maximum 3 hours in these areas. However these restrictions were minimal

8
in the East side of Beletweyne. This has also made it difficult for standard sampling
procedures to apply.
ii. CURFEW – Data collection in Ceeljaale (new IDP camps near the AMISOM and
Ethiopian forces was delayed until the curfew is lifted at about midday which had
been inconvenient as teams had to interview respondents in the open on a hot day
(poor shelter and no shades) and interviews were disrupted by crowds demanding
for assistance.
iii. SCOPE and PROCEDURE - It is important to reiterate that the idea of conducting a
rapid joint assessment had been borne quite late to the participating members. As
such there was NO adequate time for planning and modifying assessment tools,
schedules, sampling methods and scope of the data to be collected. WFP staff
presented the tools used for this assessment (see annex) and quickly revised with
UNICEF, UNOCHA and UNHCR colleagues to check if the FGD form covers the basic
multi-sectoral information that may be needed to identify gaps.
2. Main findings by sector According to local residents in Beletweyne this year’s flood has had the biggest
magnitude in the history of Beletweyne and had left huge impact people’s lives and
livelihoods. The residents agreed unanimously that it has no comparisons whatsoever
floods of this scale has never happened and that it’s impacts surpassed the 1981 floods
which as long as anyone in Beletweyne remembers had been the worst known floods.
It had caused loss of several human lives, huge livestock death and destruction of other
valuables assets and properties such homes, food stocks, business goods, public and
private infrastructure and has led to massive displacement of residents from their
homes into IDP settlements in a bare and rocky lands in the Western and eastern
outskirts of Beletweyne town.
The damages caused by this year’s flooding were severe due to its scale, the time it
occurred (past midnight) when most people were sleeping and its sudden onset which
unlike in the past was too swift and with no prior warnings. The flood response task
force which conducted the initial assessment a day after the shock estimated that the
floods affected 85% of Beletweyne town.
Based on the discussion with the HHs and Focus group/Key informant interviews and
the teams’ observations the following are the main findings of the rapid assessment.
3.1 Food security
Food security and vulnerability indicators:
The analysis of key Food Security and Vulnerability indicators shows that 40% of
respondents have a poor (23%) or borderline (17%) food consumption score (FCS).

9
Disaggregation of this data by district indicates that respondents in Hilaac and Israac
had a lower FCS than respondents in other districts, such as Bundaweyn, Kooshin or
SuuqaXoolaha. Around 15% of the assessed population reported not to have any assets
and another 37% responded to hold between 1 and 3 livestock and/or productive assets
(vehicles, tools, mobile phones etc.). It is unclear whether this high incidence of low
assets holding is due to the fact that residents of Beletweyne lost their belongings due to
the floods, or whether they had a low assets base before the disaster. With regard to
income sources, the main income source for the male population assessed during the
survey was casual labour (40%), followed by farming (17%). Women were mainly
involved in petty trade (33%), although the overall number of respondents was much
lower than amongst the male population. Access to humanitarian assistance seems to be
available for the majority (68%) of the city’s population, with food (34%), water (28%)
and shelter (17%) being the most common types of assistance received.
Figure 1: FCS overall (left) and by district (middle); assets holding (right)
Challenges and coping strategies:
The main challenge reported by respondents were the floods (28%) which destroyed
parts of the city on 27 and 28 September 2012, followed by the lack of income sources
(20%), the curfew imposed by the Ethiopian military in the town (12%), high food
prices (11%) and insecurity (8%). It has to be noted that many of these challenges are
interlinked. For instance, respondents highlighted that, the floods impeded them to
follow their usual employment, and that the curfew imposed after the floods restricted
access to markets and the ability to find alternative income sources. Notwithstanding
the damage and displacement caused by the floods, reliance on severe (<15%) and very
severe (<10%) coping strategies remains limited. Severe coping strategies include
reliance on food donations from relatives or the clan, or on food assistance, while very
severe coping strategies include sending household members to eat elsewhere, begging,
skipping days without eating and consuming spoilt or left-over foods. On the other hand,

10
the majority of respondents reported to rely on mild coping strategies such as eating
less preferred foods in response to the shock.
Figure 2: Main challenges (left) and coping strategies (right)
Most affected population groups/geographic areas:
The assessment results show that there seems to be a correlation between low assets
holding and a poor FCS. Indeed, the households that indicated that they had a low assets
base (<4) had poorer food consumption than those with a higher assets base. This
means that if households have lost their belongings due to the floods, they are likely to
be more affected by food insecurity. With regard to the incidence of flood-affected
households, Hilaac, Israac and Ceeljaalesettlements have a higher incidence of
households primarily affected by the floods than, for instance, in Bundaweyn or Heegan.
It should be noted that the urban settlements in Beletweyne Town (including
Bundaweyn, Heegan, XaawoTaako and Hilaac) experienced average to severe damage to
housing (mostly permanent and semi- permanent structures); however, households in
Israac and Ceeljaale (mostly displaced due to the floods) are more vulnerable in terms of
food security due to their low asset holding (temporary shelter) and limited livelihood
options (casual labour) and should be targeted primarily for food assistance.
Figure 3: Asset holding vs FCS (left) and incidence of flood-affected households (right)
3.2Markets
Markets in Beletweyne continue to function normally and are fairly integrated with
other regions of Somalia. Commodity Supply routes and the flow of trade goods into
and out of Beletweyne town remains the same as before the floods. Most of the

11
commercial import goods including food stuffs come to Beletweyne through Bosasso
port followed by Mogadishu port.
The assessment team conducted separate market visit and had discussions with 3
key traders (whole sale) traders who confirmed that no major price changes have
occurred over the last 30 days and in particular since the floods occurred.
The team has also collected current retail prices of food commodities and compared
with prices before floods reported by the same retailers. This was then cross checked
with FSNAU September prices of cereal commodities which showed no major
changes as shown below in the table.
However, traders mentioned that the floods have damaged and destroyed hundreds
of bags of locally produced and commercial food commodities. Additionally, traders
stated that the curfew (currently in place from 6:00 AM to 11:00 AM) coupled with
increasing number of illegal check points on the way (Bosasso – Beletweyne) and
general insecurity in Hiran and neighboring regions continued to disrupt trading
activities in the region.
On the other hand, as reported by key informant and household respondent physical
access to the market (distance and roads) remains normal though availability of
labour jobs has reportedly declined after the floods. For households living in Israac
and Ceeljaale which are the new IDP settlements, travel to the main markets on foot
takes some time as they have to cover about 3 KM. This is quite difficult as these
households have to wait for the curfew to be lifted even before they go to the market
for their shopping.
The curfew hampers market access and market activities every day from 6:00 AM to
around mid day. Buyers and sellers are not allowed to come to the market and
people are asked to stay indoors. Overall food availability in the market is quite
normal. The table gives prices before the floods and after the floods.
NO Commodity Unit Price before floods (Source: FSNAU Sept)
Price BEFORE floods Traders
Price AFTER floods Traders
Remarks
1 White maize Kg 8000 8000 8000 2 Yellow maize
(Food Aid) Kg 5000 5000
3 Rice Kg 8000 24000 18000 Price reduction attributed to rice food Aid
4 Vegetable oil Liter 36000 35000 5 Wheat grain Kg 4000 6000 6 Wheat flour Kg 15000 18000 20000 7 Pulses local Kg 24000 24000 24000 8 Sorghum Kg 6000 4000 4000 9 Meat Kg 1600000 160000 10 Milk goat Liter 30000 20000 11 Milk camel Liter 30000 20000

12
12 Milk cow liter 24000 24000 13 Goat local Head 1500,000 1500000 14 Cow local Head 5000,000 5000,000 15 Camel local Head 10,000,000 10,000,000 16 Labour Day 113000 100000 80000
3.3 Health and nutrition related conditions
• Most of the interviewed key informants revealed that there are NO new cases of
illnesses except skin diseases (Scabies) and diarrhea which was reported in the new
IDP camps. The household interviews have also indicated there are NO outbreaks.
However, both the FGDs and HH interviews confirmed that there are increasing
cases of common illness such as malaria and ARI.
• Information from health facilities, Beledweyne main hospital on the Eastside and
health clinics for WARDI (local NGO partner with WHO) which runs MCHs and clinics
on the Westside have reported no major outbreaks except few cases of measles and
AWDs.
• All interviewed respondents expressed strong concern and fear of possible
disease outbreaks particularly cholera and Malaria owing to the poor and
deteriorating hygiene and sanitation conditions.
• On the other hand although the team never conducted anthropometric
measurements due to the time and security limitations, there were no major
evidences of alarming malnutrition levels observed or reported by nutrition partners
in the area. However, cases of sick and weak looking children were observed in
Ceeljaale, Israac, and Suuqa xoolaha IDP camps.
• There were only 12 kids in the stabilization centre of Beledweyne main hospital
supported by MSF) on the day of the assessment. However, nurses in the ward
reported high number of defaulters as patients prefer to go to the OTP centers in and
around Beledweyne which makes this data less indicative of the malnutrition
situation. Conversely gradual increases in the number of OTP admissions were
reported by WARDI since the floods occurred on the Westside.
• In total 4 MCHs were reportedly affected by the floods which have partially
stopped their operations.
• 4 of the 12 (33%) FGD interviews conducted revealed that there are mothers
who stopped breastfeeding their kids due to food shortages and fear her live.
However, the team has been able to verify only 2 mothers in Ceeljaale IDP camp

13
3.4 Water, hygiene and sanitation conditions
Water, sanitation and hygiene related problems were frequently mentioned during
the HH interviews and the FGD mainly arising from destroyed latrines in the IDP
settlements and collapsed toilets and sewage systems in most of the affected parts of
the town.
The focus group discussion interviews had also explained that dirty and stagnant
water still remain in many parts and pavements of the town and IDP settlements,
some of which are still impassable due to the muddy water. They have expressed
that such dampened and dirty places are already proving to be breeding sites for
mosquitoes and other harmful insects and would possibly pose risks to people living
in those areas. The team’s observations have confirmed the following issues which
were given during the FGD and HH interviews.
• Dirty stagnant water on the main roads, pathways and the teams observations
have also depicted a dreadful WASH conditions in all the areas visited and more so
on the new IDP camps in Ceeljaale (East side) and Israac and Suuqa xoolaha of the
west side.
• Access to latrines is very limited in the IDP camps of Ceeljaale, Israac and Suuqa
xoolaha. Many people are currently defecting in the open during the night in these
sites and scattered faeces were observed.
• Many partially collapsed toilets were observed and sewage systems have also
been damaged by the floods. As a result, surface runoff water from sewages has
messed up with rainwater and pathways and streets remain dirty and dump in many
parts of the town.
• In other places people are still using their dilapidated toilets which are very dirty
and dangerous to use.
• In Ceeljaale respondents complained of contamination of water points (berkads)
as young children play with the water. Water management for IDPs using open
berkads is poor and may cause health problems.
• All open wells in the town were affected by the flood water and access to drinking
water has been affected in the town. IDP continues to use water tracked by agencies
(UNICEF partners and ICRC). However, access to clean water remains quite normal
as reported by KIs and FGDs. The assessment teams observed ongoing water
tracking activities.
• Dampened heaps and garbage were observed in most parts of the town and in the
IDP sites.
• Concerns of another flood that may completely worsen the sanitation situation
was repeatedly mentioned throughout the FGD
• There were NO latrine construction and rehabilitation efforts ongoing at the time
of the assessment. Those who remained in the town and whose toilets have been
demolished by the floods are still skeptical of another flood and have not yet
embarked on repair works.

14
3.5 Infrastructure and shelter conditions The damage on infrastructure is quite enormous and has impacted various infrastructural
elements which include, roads, schools, Health clinics, electric poles, water pipes and open wells.
It has also destroyed a number of homes, business premises, toilets in the town and had
temporarily blocked feeder roads within the various sections of the town. At the time of the
assessment, reconstruction work had not commenced and the assessment team observed
destroyed toilets and sewage systems and few partially collapsed buildings.
Within the town the shelter damage varied depending on the type and land terrain with minimal
damage for those who live in permanent stone houses than those who lives in temporary
shelters made of local building materials with corrugated sheets or thatches as a roof. The latter
were mainly affected by the floods and many of the owners have moved out to the new IDP sites
on either side of the town.
In the IDP settlements in Ceeljaale, Israac and Suuqa xoolaha, majority of the households have
received plastic tarpaulin and have erected temporary shelters made of sticks and tarpaulin.
The following shelter related issues have been raised during the assessment (HH and FGD
interviews) and were verified through the teams’ observation.
Out of the 60 household’s interviewed 62 % live in tarpaulin and sticks, 20% live in
corrugated sheets, 10% live in stone houses and the remaining 8% live in open areas.
This was confirmed by the focus group discussions who repeatedly mentioned ill-fated
shelters and inadequacies in housing. The teams’ observation had also recorded need
for more shelter interventions in the IDP camps.
While there are many households who didn’t receive plastic tarpaulin, even those who
received explained the need for more plastic sheets due to the large household sizes.
Households’ interviewed indicated average household sizes of 9 people.
58% of the FGD interviews revealed that shelter is one of their most immediate needs.
The new IDP camps lack most of the basic services such as health facilities, schools,
permanent water points, electricity, police stations and recreational facilities.
There are no administrative units to maintain law and order and agencies have been
having difficult in distributing assistance. The NGOs have to liaise with AMISOM forces
to maintain order during distribution.
Due to the lack of the local authority function during distribution and the huge crowds
that gather around distribution points, targeting has been compromised many times
especially during food distribution by the private sector.
3.6 Education and protection
Six schools were badly affected by the floods and have stopped functioning. The
other schools were suspended for a while and were about to resume at the time
of the assessment
Education kits consisting of reference materials and stationeries were destroyed.
A number of schools (including Budaweyn and Heegan) have been occupied by
IDP and were closed.
Since there were no schools in the new IDP sites, majority of the school going
children have resorted to stay indoors and learning was suspended indefinitely.
15
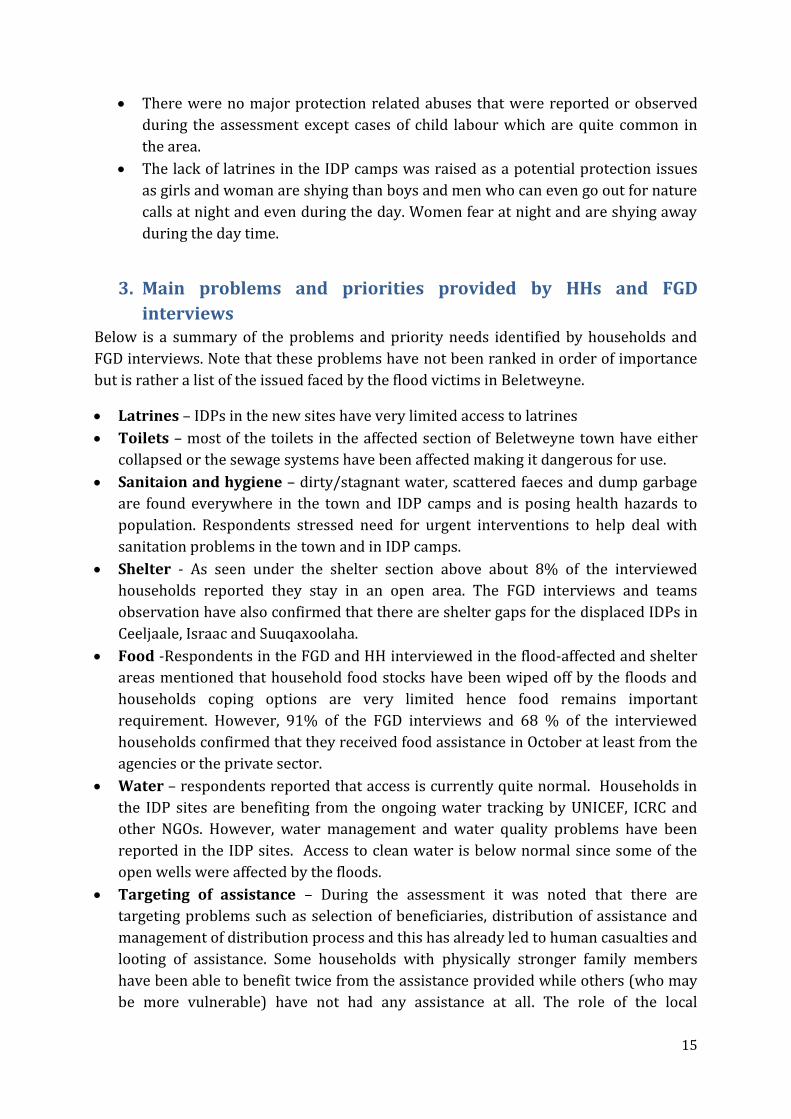
There were no major protection related abuses that were reported or observed
during the assessment except cases of child labour which are quite common in
the area.
The lack of latrines in the IDP camps was raised as a potential protection issues
as girls and woman are shying than boys and men who can even go out for nature
calls at night and even during the day. Women fear at night and are shying away
during the day time.
3. Main problems and priorities provided by HHs and FGD
interviews Below is a summary of the problems and priority needs identified by households and
FGD interviews. Note that these problems have not been ranked in order of importance
but is rather a list of the issued faced by the flood victims in Beletweyne.
Latrines – IDPs in the new sites have very limited access to latrines
Toilets – most of the toilets in the affected section of Beletweyne town have either
collapsed or the sewage systems have been affected making it dangerous for use.
Sanitaion and hygiene – dirty/stagnant water, scattered faeces and dump garbage
are found everywhere in the town and IDP camps and is posing health hazards to
population. Respondents stressed need for urgent interventions to help deal with
sanitation problems in the town and in IDP camps.
Shelter - As seen under the shelter section above about 8% of the interviewed
households reported they stay in an open area. The FGD interviews and teams
observation have also confirmed that there are shelter gaps for the displaced IDPs in
Ceeljaale, Israac and Suuqaxoolaha.
Food -Respondents in the FGD and HH interviewed in the flood-affected and shelter
areas mentioned that household food stocks have been wiped off by the floods and
households coping options are very limited hence food remains important
requirement. However, 91% of the FGD interviews and 68 % of the interviewed
households confirmed that they received food assistance in October at least from the
agencies or the private sector.
Water – respondents reported that access is currently quite normal. Households in
the IDP sites are benefiting from the ongoing water tracking by UNICEF, ICRC and
other NGOs. However, water management and water quality problems have been
reported in the IDP sites. Access to clean water is below normal since some of the
open wells were affected by the floods.
Targeting of assistance – During the assessment it was noted that there are
targeting problems such as selection of beneficiaries, distribution of assistance and
management of distribution process and this has already led to human casualties and
looting of assistance. Some households with physically stronger family members
have been able to benefit twice from the assistance provided while others (who may
be more vulnerable) have not had any assistance at all. The role of the local

16
authorities in creating safe environment where services are rendered for the IDPs
can be done with minimal security concerns is seen to be lagging and needs to
strengthen coordination mechanisms.
Insecurity and fear of humanitarian workers – the targeting problem cited above
is exacerbated by insecurity at distribution points.
4. Conclusion Based on the findings of the assessment, the following measures are recommended by
sector to meet the immediate and short term needs of the flood affected households:
Food: General food distributions (GFD) could be continued for those households
that have been displaced by the floods taking into consideration the differences
between the settlements and population groups for a maximum period of two
month. Secondly, depending on available capacities and resources on the ground
low-tech food-for-work (FFW).programmes could be implemented to address
problems caused by the flooding, such as removal of stagnant water in the city or
stabilization of river banks. A combination of the two activities (GFD and FFW) is
also possible. The duration of the food assistance should be two months
(November to December 2012) to allow sufficient time for households to recover
and resume their livelihoods.
WASH: The need for emergence latrines in for the IDPs in the new sites has
remained unaddressed. This needs to be taken up by the WASH cluster. The
possibility is that the population will stay longer at these sites due to the fear of
possible floods reoccurring. There is also need to rehabilitate the collapsed public
latrines and toilets in town as people have started to return.
The dirty/stagnant water is expected to dry soon. However, scattered faeces and
dump garbage found everywhere in the town and in IDP camp is posing a health
hazard to the population. There is urgent need for Garbage collection and
cleaning of the town. The proposed food for work could be used to address this
plus direct intervention by WASH cluster. While the Households in the IDP sites
are benefiting from the ongoing water tracking the need to rehabilitate the
drinking water sources is urgent to provide sustainable solution. In the short run
the water tracking also needs to continue for at least in the month of Novemebrs.
Shelter: Shelter and NFI needs still exist. Though the assessment could not be
definite about the number at least there is need for approximately 8% of the
5200HHs (400- 500 kits). Intervention will need to be target to the families that
have missed out. Another quick assessment of shelter needs will need to be
carried out by the shelter cluster to ascertain numbers.

17
Education: The affected schools need to be rehabilitated and the ones occupied to
be evacuated by the IDPs. Education kits consisting of reference materials and
stationeries to be replaced.
Health and Nutrition: No outbreak has been reported but there is need for
constant surveillance. There is also need to mitigate the health hazards by
eliminating potential causal conditions like cleaning stagnant water and
garbage and provision of latrines. The nutrition situation is not worrying. It is
recommended to continue with the current nutrition intervention.
Agriculture and livelihood: As noted agriculture, business and casual labour
and self employment are the main livelihood sources of the people in
Beletweyne. The floods adversely affected this. There is need for quick after
flood intervention. Provision of seeds to the Agro pastoral households and
restocking and other sources of livelihood is recommended for the population
to recover.

18
Annexes Annex 1. List of participants
S/N Name of participant Location NO of HH Questionnaire
No of FGD Interview
Agency
1 Abdullahi Warsame Team leader – East side OCHA
2 Mohamned Ahmed Saney CeelJaale 2 1 SAMRADO Kooshin 1 0
3 Abdirahman ShIlmi HawoTako 2 0 SAMRADO 4 Mohamed Yonis Bareeg Koshin 2 0 SOMPLAN 5 Abdi Yusuf Mohamed BundiWayn 2 0 HAPOCHI
LD Ceeljaale 0 1
6 Abdiquadir Mohamed Ahmed BundiWeyne 3 1 HAPOCHILD
7 Abdurrahman Mohamed Hassan
Koshin 2 1 HW S&CBO
8 Hussein Ibrahim Nor (Qorane) HawoTako 3 1 GEELO 9 Farah Hassan Dhaqne CeelJaale 3 0 RRP 10 AbdiazizWeheliyeOfle CeelJaale 3 0 DOVE 11 Omar SabriyeOlad CeelJaale 3 0 SC 12 Mohamed AbdulleKeynan CeelJaale 3 0 HATI 13 Mustaf Farah Mohamed CeelJaale 3 1 DRC 14 Hassan Sh Mohamed Isaq CeelJaale 1 0 WFP 15 Mohamed Ahmed Abdullahi CeelJaale 1 UNICEF 16 Abdisamad Mohamud Halane CeelJaale 1 1 DONE 17 Mohamed AbdulahiAbtiyow CeelJaale 3 0 AGROCAR
E 18 Mohamed Omar Osman CeelJaale 2 0 TECHNIO
PLAN 19 MaxamedMaxamuud Cali Israac 2 0 SYPD 20 BashiirXuseenCismaan Israac 2 1 MGV 21 FaadumoMaxamudJubur Israac 0 0 DORSO 22 C/naasirCabdiXasan Israac 1 0 HARDO 23 ShamsoMacalinMaxamed Hilaac 1 0 WARDI 24 MaxamedIsaaqDiiriye Hilaac 2 1 WARDI 25 Liibaan Cali Ibrahin Hilaac 2 0 DOYALE 26 XasanCismaanHilowle Suuqaxoolah
a 2 0 HREC
27 C/raxmaanNuurJabrill Suuqaxoolaha
2 0 MGV
28 IbrahinHasanCaddow Suuqaxoolaha
1 0 WARDI
29 C/laahiGalbeedXirsi Suuqaxoolaha
3 0 HARDO
30 Noor Abdi Ali Suuqaxoolaha
0 3 WFP
31 NimcoAxmedFaarax Heegan 0 1 WFP 32 FarxiyoQoroneAxmed Heegan 1 1 WARDI 33 KhadarCabdiFaarax Heegan 1 2 DOYALE

19
Annex 2. Data collection tools (FGD and HH)
CHECKLIST – FOCUS GROUP DISCUSSION FOR COMMUNITY/VILLAGE LEVEL
Part I. Village/Community Profile
1. Number of households
2. What are the main livelihoods in the village?
3. What are the main problems faced by the households in the village IN GENERAL, before the
floods? (Poor housing, crop pest/ disease, illness/accident in the HH, livestock disease, lack of
income, lack of food, etc.)
Part II. Extent and severity of the shock
1. How does this year flood compare to previous years regarding the shock?
2. What type of damage did the shock cause this year?
3. What geographical areas are affected? (Try to verify the areas that are low, moderate and
severe damages)
4. What % of HHs is potentially affected?
5. How would you consider the damage level in your village/community (low, moderate, high)?
Why?
Part III. Impacts of shock
1. Which groups of people (women, children, farmers, etc.) are having the most problems due
to the shock(s)? Describe the people and the problems.
20
2. Food related
a. Has the shock damaged food stocks? Try to quantify (i.e. amount available before
shock, amount available after shock, how long will the food stocks last?)
b. What are the main food sources of people? Have they changed since the shocks?
c. Has the shock changed the income of some people? Are there alternative livelihoods
that people are considering as another option?
d. Is there a local/nearby market? Is there adequate food available? Are the prices
affordable (has the price gone up or down compared to before the shock)?
e. Have you observed any households that reduce number of meals or skip meals?
What % of people in the village/community does that?
f. Are there mothers who have stopped breastfeeding their child (age 0-23 months)
since the onset of the flood? What is the estimated proportion? Why?
3. Infrastructure/environment/ shelter related
a. What are the infrastructural damages
Electric poles
Water facilities (pipes, boreholes, open wells, etc.)
Bridges
Roads
Health facilities
Schools
Telephone
Administrative facilities
Other
b. What is the extent of damage?
c. What has been done already to recover the damage?
d. Map out shelter damage based on own observations

21
e. What are the local arrangements for shelter (coping)?
f. Wildlife displacements
g. Chemical leakages
h. Damage on vegetation
i. Damage to protected areas
4. Water/health/sanitation related
a. What are the main diseases in the area? Any changes in the last 3 months?
b. Do you have concerns regarding the impacts of shocks to human health condition
(mention nutrition and disease)? Explain
c. Do people in the area have access to latrines/toilets (if not what do they use now)
d. Do people in the area have access to clean water?
e. Have you observed a change in the number of cases/patients due to the shock? Can you
quantify the cases?
f. Have you observed a change in the nutritional status of patients due to the shocks? Can
you quantify the cases?
g. If there is a disease outbreak, is the health center able to cope with the situation?
Explain (damage to infrastructure and supplies). Are basic essential medicine and
supplies available?

22
5. Education and protection
a. How many schools are affected by the shock (Closed or destroyed by the floods)
b. How many schools are occupied by IDPs?
c. Are safe areas available for recreation and play for boys and girls of all ages?
d. What are the major threats for children in the area affected by floods?
e. What are the main needs and issues related to protection in this area? (child labour/un
accompanied minors)
Part V. Assistance received and/or needed
1. Has any assistance already been provided – what type, to whom, where, and by whom?
2. What immediate assistance do you need most in the short term?

23
What assistance do you need most in the medium-long term?
Annex 3. Rapid HH Questionnaire
0. To be completed by Enumerator
Please complete before the Interview
Comments:
0.1 - |__|__|__|__||__|__|__|__||__|__|__|__|
Interviewer Name
0.2 -
Date: |__|__| / |__|__| / 2012
Day Month
Beginning time of interview: |__|__| : |__|__|
0.3 -
|__|__|__|__|__|__|__|__|__|__|__|__|
Settlement Name
|__|__|__|__|__|__|__|__|__|__|__|__|
District
0.4 Type of Housing: (PLS CIRCLE – do not ask): Open area – Corrugated sheets - Stone House -
Tarpaulin/sticks

24
Unless specified otherwise, do not read the answer and circle only one answer per questions. Where writing is required, write clearly using capital letters.
SECTION 1 – DEMOGRAPHICS: Read - “I would now like to ask you a few questions on the composition of your
household”
A household is defined as a group of people currently living and eating together “under the same roof” (or in same compound if the HH has 2 structures)
1.1 How many people in total are currently living in your household? |____| people
1.2.1.
How many children are living in this household?
Male Female
0-5 years |____| |____|
6-17 years |____| |____|
1.3.
Where are you originating from: |______________________| town |______________________|
district
1.3.1 Which Clan do you below to (indicate major clan affiliation):
1.4.
Since when are you in this location? (indicate the month/year) |____| |____| /
|____||____||____||____|
Month Year
SECTION 2 –SUPPORT
2.1 Did you receive humanitarian assistance/remittances/Zakhat in the last month? 0. No 1. Yes
|__|
2.2 If yes, what did you receive? Circle all that apply
1. Food
2. Medical
3. Clothing
4. Livestock
5. Water
6. Shelter
7. Money (Amount in
US$:|________|)
8. Voucher (Value in US$:
|________|)
9. Other
specify):_______________________
_

25
Section 3 –INCOME SOURCES AND EXPENDITURES
3.1 What were your household’s main sources of income in the last
three months?
To the Interviewer: Please indicate no more than 3 major sources. The
codes should appear under each relevant column. Please underline the
type of humanitarian assistance received specified in the brackets
under Option 9. In case of Options 4 and 7 please proceed to
question Q3.2. Otherwise, move to question Q3.3.
Men Women
1. Poultry/livestock product sale
2. Farming/crop sale
3. Petty trade
4. Casual labour wage
5. Skilled/salary
6. Remittance
7. Self-employment (bush products/handicraft/water sales, etc.)
8. Gifts/zakaat
9. Humanitarian assistance (cash, food, other)
10. Fixed asset sales (house, land )
11. Other asset sales ( farming/ other productive tools, domestic
assets such as furniture, utensils, etc )
12. Other (specify)_________________________________
3.2 Can you recall how many days in total you worked in the last
three months?
Casual labour Self-
employme
nt
_________ _________
3.3 Please specify how the earned income was spent.
To the interviewer: Please ask the respondent to divide the total
expenditure in Q 3.3 into Food and Non-food expenditures. Record the
responses in percentage terms.
1. Food (%): ___________
2. Non-food (%): ___________
3.4.1 In the last 7 days, how much did you spend on food?
Food items: cereals, sugar, veg.oil, beans, milk, meat, vegetable and
fruits;
|__| |__||__| |__| SoSh

26
3.4.2 In the last 7 days, how much did you spend for Non- Food
Items?
E.g: school, health, water, electricity, social tax, clothing, utensils,
furniture, hygienic items, torches/batteries, rents, rituals and festivities,
etc
Please write the amount in thousands (‘000’), e.g. 3,450 for 3,450,000
and 1,839 for 1,838,500
|__| |__||__| |__| SoSh
3.4.3 In the last days, how much did you send for water (human
and animal use)? |__| |__||__||__| SoSh
SECTION 4 – FOOD SOURCES AND CONSUMPTION
Could you please tell me how many days in the past one week your household has eaten the following foods
and what the source was (use codes at the right hand side, write 0 for items not eaten over the last 7 days
and if several sources, write up to two)
Food item
DAYS eaten in past week
(0-7 days)
Main sources of THIS
food (use codes)
4.1 Sorghum, Maize |__| |__|
4.2 Wheat product
(Bread, Anjera Chapati,
Sabaayad)
|__| |__|
4.3: Rice |__| |__|
4.4 Pasta |__| |__|
4.5: Roots and tubers
(e.g. Potatoes) |__| |__|
4.6:Pulses (e.g. beans and
peas) |__| |__|
4.7: Meat
(sheep/goat/beef/camel/
poultry)
|__| |__|
4.8: Fish (fresh or canned) |__| |__|
4.9: Vegetable oil |__| |__|
4.10 Animal fats
(butter/ghee/etc) |__| |__|
Main Food Source
codes:
1. Purchase
2. On Credit
3. Own
production
4. Traded food
against goods or
services
5. Borrowed
6. Received as
gift
7. Food
assistance
8. Other, Specify:
_______________
________

27
4.11: Eggs |__| |__|
4.12 Fermented/Sour
Milk |__| |__|
4.13: Fresh Milk (i.e. a
GLASS NOT in tea/coffee) |__| |__|
4.14 Powder Milk (i.e. a
GLASS NOT in tea/coffee) |__| |__|
4.15: Tea/Coffee
(with/without Milk
(fresh/powder))
|__| |__|
4.16: Fresh vegetables
(incl. leafy greens and
wild plants)
|__| |__|
4.17: Fruits (including
date palm and wild fruit) |__| |__|
4.18: Sugar (or Sugary
foods) |__| |__|
4.19: Groundnuts/wild
nuts |__| |__|
4.20: other – specify |__| |__|
4.21: CSB |__| |__|
4.22: Plumpy nut/sub/doz |__| |__|

28
SECTION 5 – DEBT AND ASSET LEVEL
5.1 Does your household currently have any outstanding debt?
To the Interviewer: If there is no outstanding debt, please
encircle Option 1 and move to Q5.2. Otherwise, in Option 2
indicate the amount of debts in SoSh in thousands (‘000), e.g.
3,500 for 3,500,000, and move to Q5.2
1. No debts
2. |__| |__| |__| |__| SoSh
5.2 How many assets does your household currently own?
To the Interviewer:
Please specify the number for each asset.
Indicate zero -‘0’ for the assets not owned.
For cash and Jewellery just inquire about the ownership without specifying the amounts and encircle the asset accordingly.
Livestock assets
a. Camel ______ e. Chicken _______
b. Cow ______ d. Donkey _______
c. Sheep/goat ______
Productive tools and other assets
a. Tractor ______
b. Vehicle ______
c. Computer ______
d. Bicycles/bikes ______
e. Mobile phones ______
f. Sewing machine ______
g. Farming tools ______
h. Skilled work tools ______
(blacksmith, carpentry, masonry, etc.)
i. Donkey/Ox cart ______
j. Wheelbarrows ______
k. Other (specify) __________ a.
SECTION 6: COPING MECHANISM
6.1 In the past 30 days, if there have been times when you did
not have enough food or money to buy food, how often has
your household had to:
0=Never (zero times/week)
1=Hardly at all (<1 times/ week)
2=Once in a while (1-2 times/ week)
3= Pretty often? (3-6 times/week)
4=All the time (Every day)

29
a) Shift to less preferred (low quality, less expensive) foods (from
osolo to obo)?
b) Limit the portion/quantity consumed in a meal (Beekhaamis)?
c) Take fewer numbers of meals in a day?
d) Borrow food on credit from the shop/market (Deyn)?
e) Borrow food on credit from another household (Aamah)?
f) Restrict consumption of adults in order for small children to
eat?
g) Rely on food donations from relatives (Qaraabo)?
h) Rely on food donations from the clan/community (Kaalmo)?
i) Seek or rely on food assistance from humanitarian agencies?
j) Send household members to eat elsewhere?
k) Beg for food (Tuugsi/dawarsi)?
l) Skip entire days without eating (Qadoodi)?
m) Consume spoilt or left-over foods
6.2 What were the household’s main challenges in the last three months in accessing food and income?
1. _______________________________________________________________________________________________________
2. _______________________________________________________________________________________________________
3. _______________________________________________________________________________________________________
4. _______________________________________________________________________________________________________
End time of interview: |__|__| : |__|__|

30
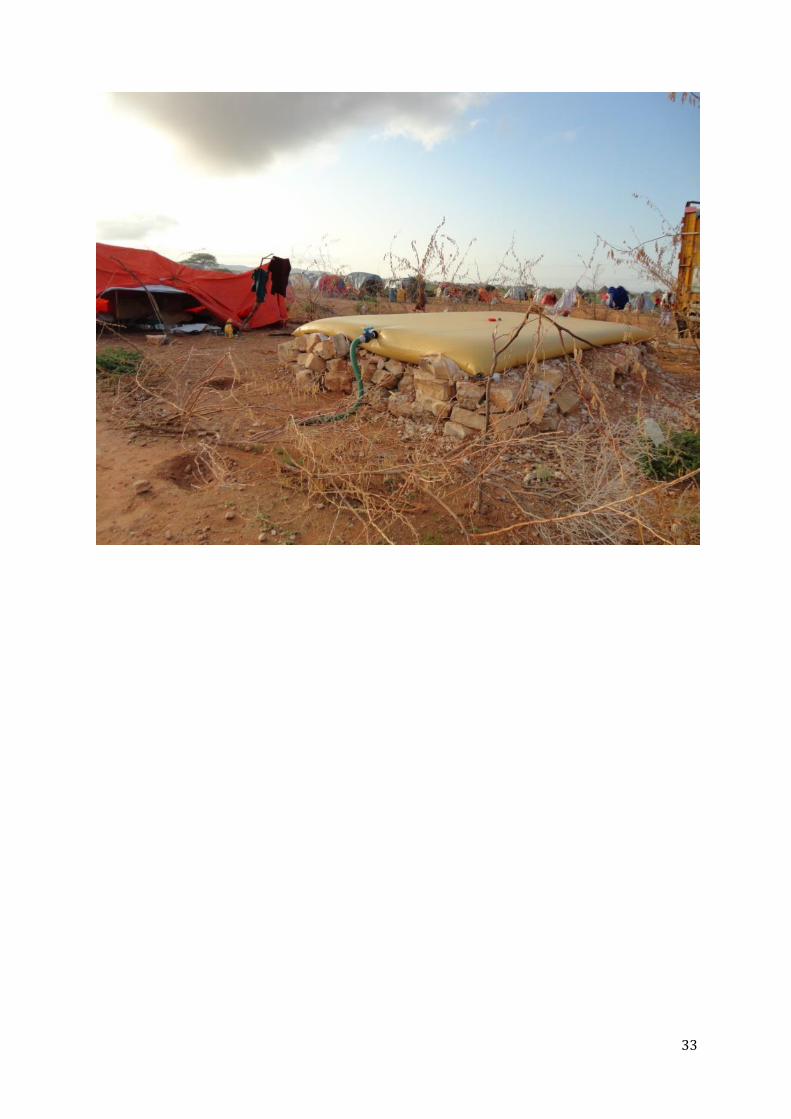
Annex 4. Pictures

31

32
33

34

35

36