MULTI-HAZARDS RISK VULNERABILITY ASSESSMENT · 2018-01-19 · multi-hazard/risk matrix landslide...
91
MULTI-HAZARDS RISK VULNERABILITY ASSESSMENT GANGTOK, EAST SIKKIM. 2012
Transcript of MULTI-HAZARDS RISK VULNERABILITY ASSESSMENT · 2018-01-19 · multi-hazard/risk matrix landslide...
MULTI-HAZARDS RISK VULNERABILITY ASSESSMENT GANGTOK, EAST SIKKIM.
2012
CONTENTS:
INTRODUCTION
LOCATION MAP
HAZARD RISK AND VULNERABILITY ASSESSMENT
GEOLOGICAL SETTING OF GANGTOK MUNICIPAL CORPORATION AREAS
HAZARDS, LANDSLIDE SLOPE MORPHOMETRY MAP OF GANGTOK
MUNICIPAL CORPORATION
GEOLOGICAL/LITHOLOGICAL MAP OF GANGTOK MUNICIPAL
CORPORATIONSOIL TYPE MAP OF GANGTOK MUNICIPAL CORPORATION
HYDROLOGICAL MAP OF GANGTOK MUNICIPAL CORPORATION
SOIL THICKNESS MAP OF GANGTOK MUNICIPAL CORPORATION
LANDSLIDE INVENTORY MAP OF GANGTOK MUNICIPAL CORPORATION
RELATIVE RELIEF MAP OF GANGTOK MUNICIPAL CORPORATION
LAND USE/LAND COVER MAP OF GANGTOK MUNICIPAL CORPORATION
LANDSLIDE HAZARD RISK AND VULNERABILITY ASSESSMENT MAP OF
GMC
GMC LANDSLIDE HAZARD STATISTICS
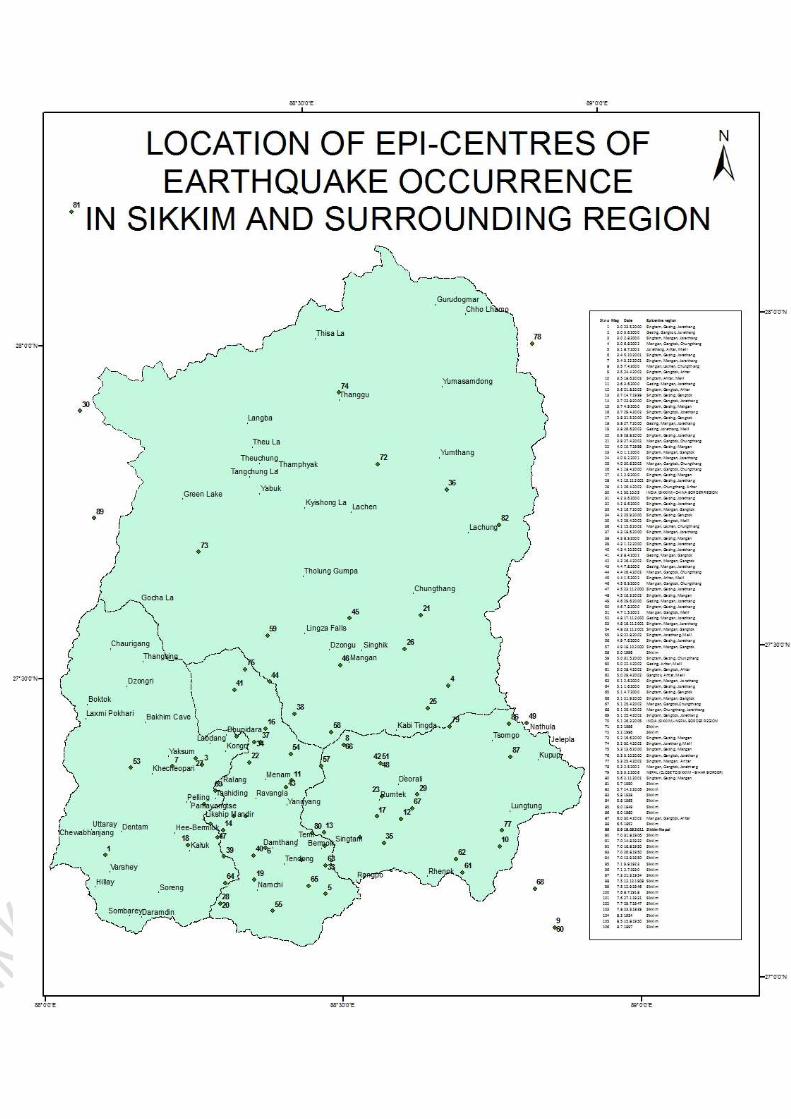
EARTHQUAKE RISK ASSESSMENT LOCATON OF EPI-CENTRES OF
EARTHQUAKE OCCURRENCE IN SIKKIM AND SURROUNDING REGION
SOIL TYPE MAP OF GANGTOK MUNICIPAL CORPORATION
SOIL LIQUIFACTION MAP OF GANGTOK MUNICIPAL CORPORATION
SUSCEPTIBILITY TO PGA MAP OF GANGTOK MUNICIPAL CORPORATION
LINEAMENT DENSITY MAP OF GANGTOK MUNICIPAL CORPORATION
GEOLOGICAL/LITHOLOGICAL MAP OF GANGTOK MUNICIPAL
CORPORATION
EARTHQUAKE HAZARD RISK AND VULNERABILITY ASSESSMENT MAP
OF GANGTOK MUNICIPAL CORPORATION
EARTHQUAKE HAZARD STATISTICS
FIRE RISK ASSESSMENT
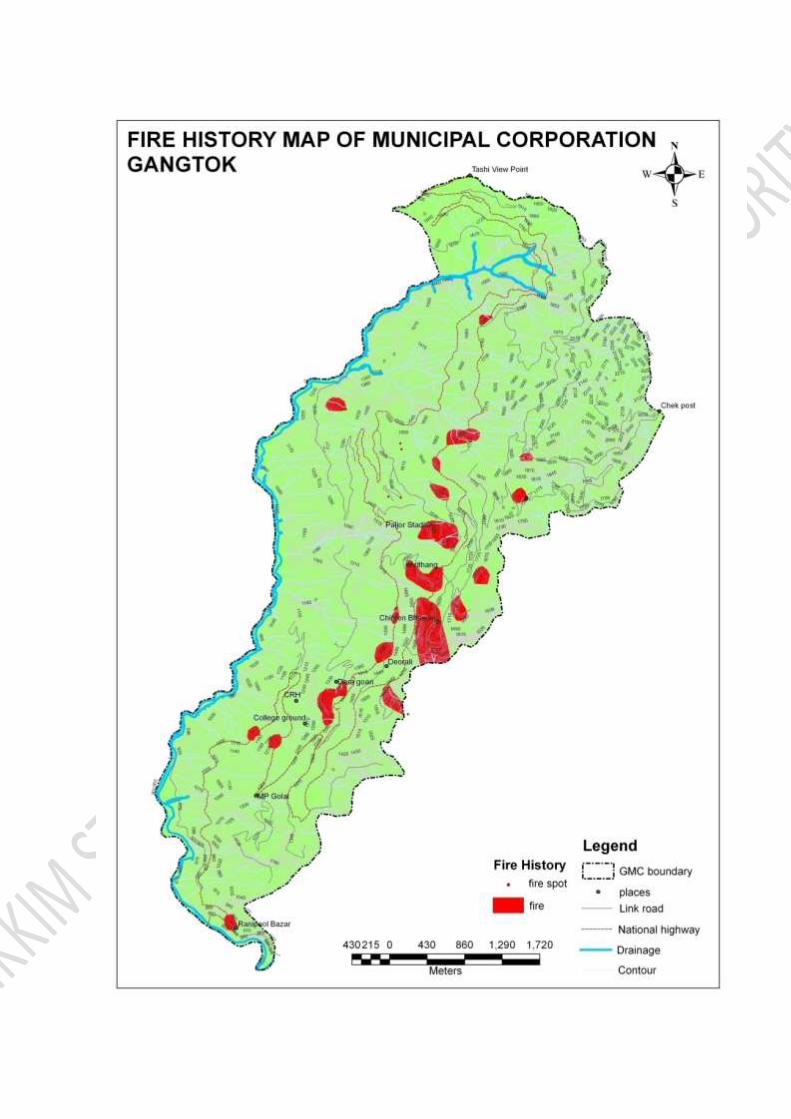
FIRE INVENTORY MAP OF GANGTOK MUNICIPAL CORPORATION
ASPECT ANALYSIS MAP OF GANGTOK MUNICIPAL CORPORATION

FOREST TYPE MAP OF GANGTOK MUNICIPAL CORPORATION
SLOPE ANALYSIS MAP OF GANGTOK MUNICIPAL CORPORATION
FIRE HAZARD RISK AND VULNERABILITY ASSESSMENT MAP OF
GANGTOK MUNICIPAL CORPORATION
FIRE HAZARD STATISTICS
FLASHFLOOD RISK ASSESSMENT
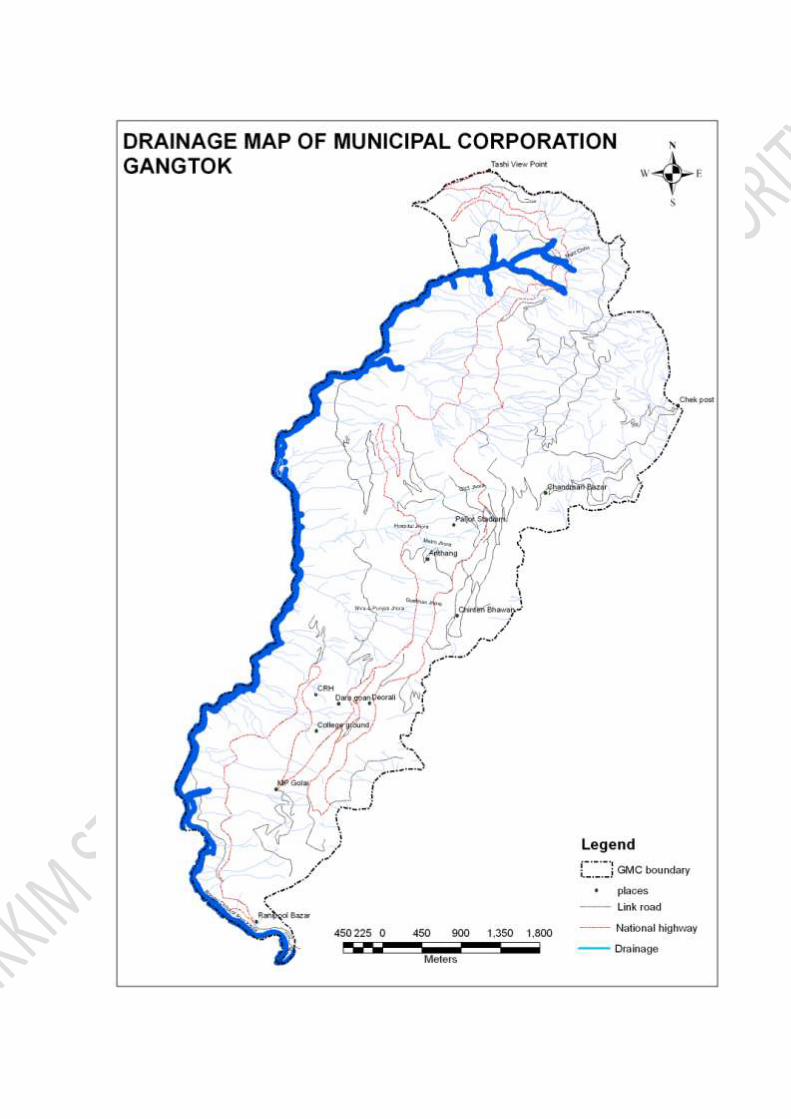
DRAINAGE MAP OF GANGTOK MUNICIPAL CORPORATION
SLOPE ANALYSIS MAP OF GANGTOK MUNICIPAL CORPORATION
FLASHFLOOD HAZARD RISK AND VULNERABILITY ASSESSMENT MAP
OF GANGTOK MUNICIPAL CORPORATION
FLASHFLOOD HAZARD STATISTICS
RIOT RISK ASSESSMENT
HOUSEHOLD DENSITY MAP OF GANGTOK MUNICIPAL CORPORATION
RIOT HAZARD RISK AND VULNERABILITY ASSESSMENT MAP OF
GANGTOK MUNICIPAL CORPORATION
RIOT HAZARD STATISTICS
MULTI-HAZARD/RISK MATRIX
LANDSLIDE HAZARD RISK AND VULNERABILITY ASSESSMENT MAP OF
GANGTOK MUNICIPAL CORPORATION
EARTHQUAKE HAZARD RISK AND VULNERABILITY ASSESSMENT MAP
OF GANGTOK MUNICIPAL CORPORATION
FIRE HAZARD RISK AND VULNERABILITY ASSESSMENT MAP OF
GANGTOK MUNICIPAL CORPORATION
FLASHFLOOD HAZARD RISK AND VULNERABILITY ASSESSMENT MAP
OF GANGTOK MUNICIPAL CORPORATION
RIOT HAZARD RISK AND VULNERABILITY ASSESSMENT MAP OF
GANGTOK MUNICIPAL CORPORATION
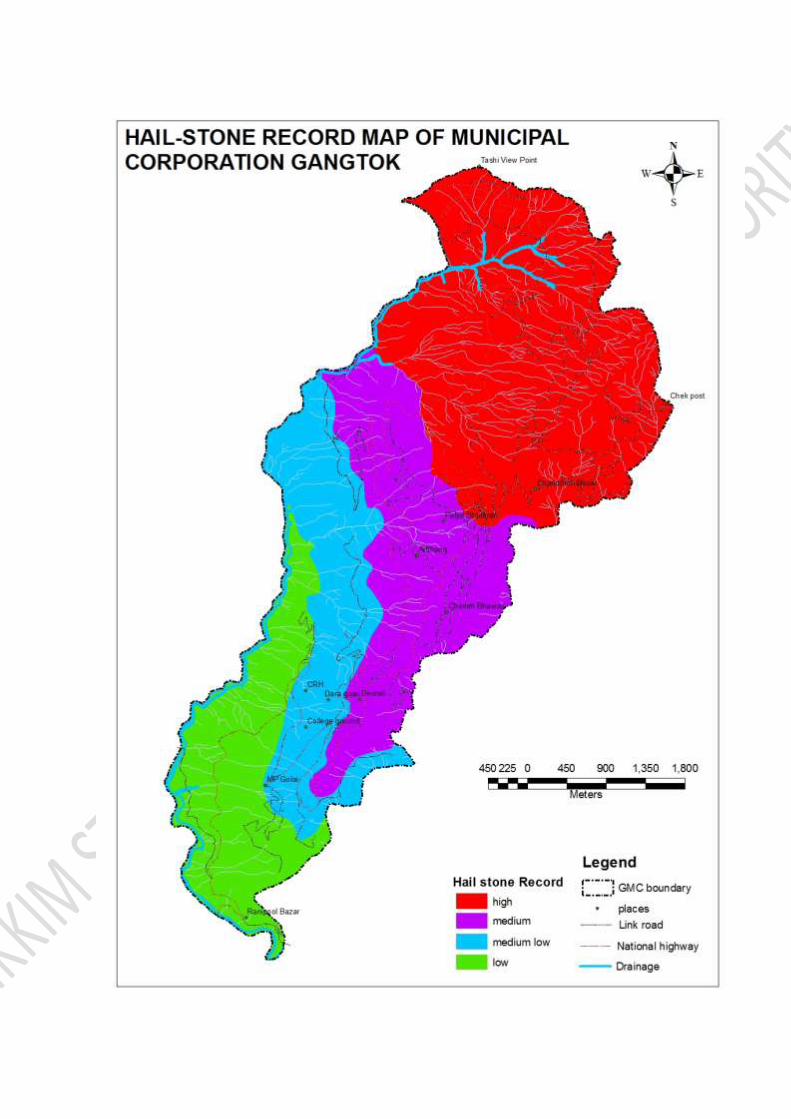
HAIL-STONE RECORDS OF GANGTOK MUNICIPAL CORPORATION
MULTI-HAZARD RISK AND VULNERABILITY ASSESSMENT MAPOF
GANGTOK MUNICIPAL CORPORATION
MULTI-HAZARD STATISTICS CONCLUSION AND SUGESTATION
PHOTOGRAPHS
REFRENCES
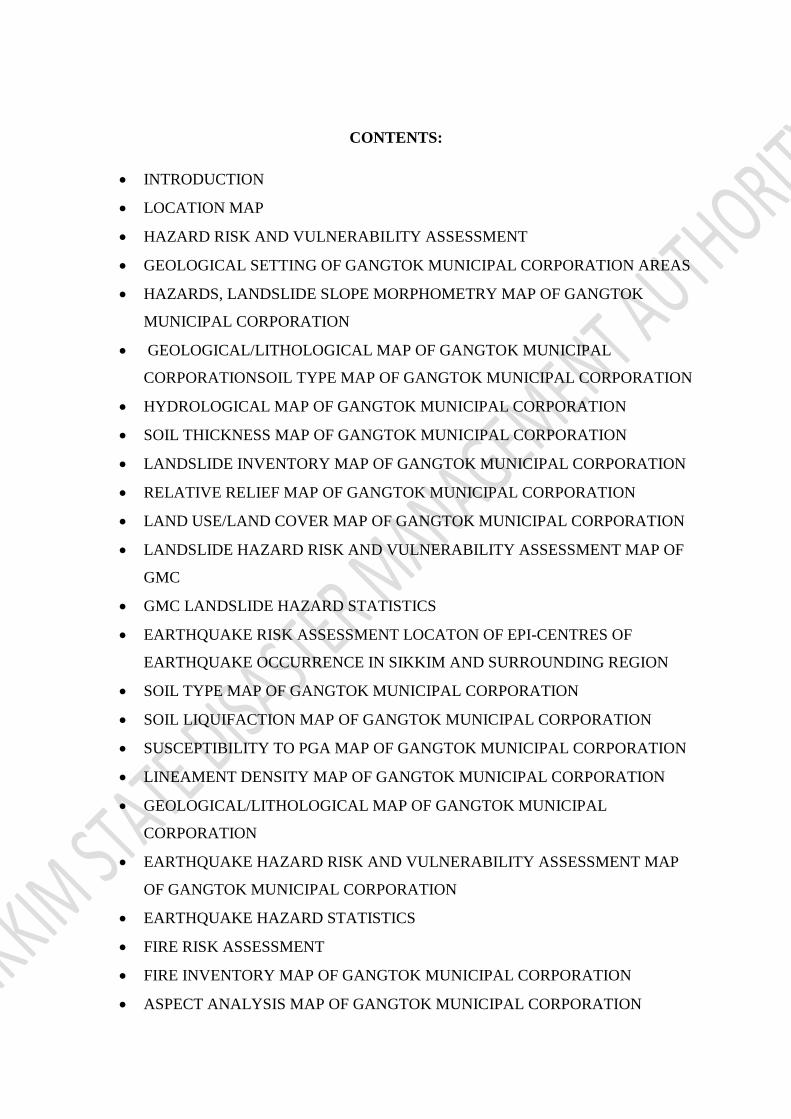
INTRODUCTION
The study area comprising of the Municipal Corporation of Gangtok is also
the Capital of Sikkim, with an area of about 1950ha. The Gangtok
Municipal Corporation divided into fifteen Wards viz. 1. Burtuk 2. Lower
Sichey 3. Upper Sichey 4. Chandmari 5. Development Area 6. Diseal
Power House 7. Arithang 8. Lower MG Marg 9. Upper MG Marg 10. Tibet
Road 11. Deorali 12.Daragoan 13. Tadong,14. Ranipool and 15.
Syari/Tathangchen. The outer boundary of Gangtok Municipal Corporation
along east runs from Tashi View Point-Himalayan Zoological Park, Bulbuley
upto 2nd mile Check Post along JN road. Along South it starts from the
Dichiling Jhora follows Roro-chu upto Seti pool steel bridge along Ranipool –
Pakyong road. Western boundary lies from the confluence point of Rorrochu
with Rani Khola runs along the Rani Khola till Takste Jhora near
Penlong. Northern boundary lies from Taktse Jhora to Tashi view point
along North Sikkim Highway.
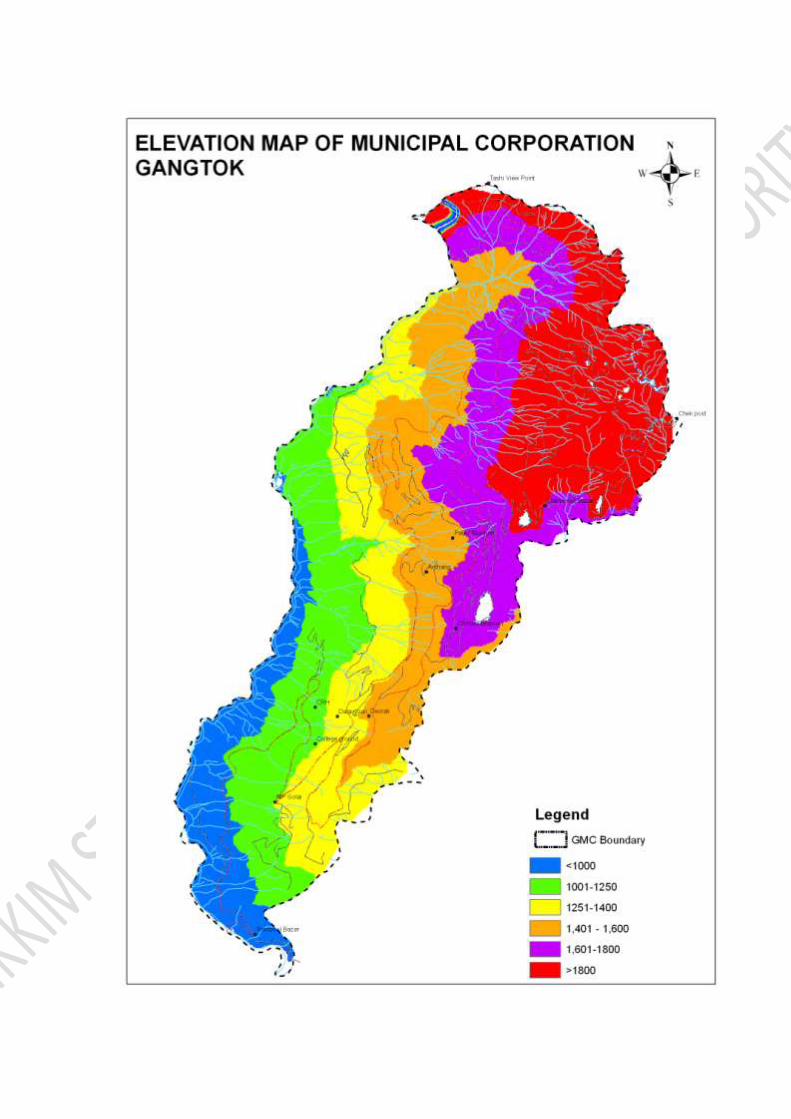
The elevation of the Gangtok Municipal Corporation (GMC) ranges from 880
mts. to 2350 mts. above mean sea level(amsl).Generally maximum of the
slope facets are Westerly facing where as few face easterly or southeasterly
direction. The average annual rainfall varies from 293 cm to 342.7 cm as
recorded from the various weather stations. The establishments along the
roadside are more and these areas are thickly populated with high building
density. The areas nearing roads are also has medium high building
establishment density with little tree cover and the remaining area far from
the road side are thickly covered with trees. Number of nalas/jhoras cut
across the slope with high discharge of water during monsoon period.
Various lineaments in form of shallow or deep seated faults are in existent
within different lithological units of Gangtok town. The slopes dip with
moderate to high degree with thin, medium thick to thick soil cover over the
existing rock units. Lot of surface/sub-surface water activities are present in
the area. These contributing forces in tandem make the slopes vulnerable
and result in failures as landslides, which creates the hazard.
GEOLOGICAL SETTING OF GANGTOK AND SUBURB AREAS
GENERAL GEOLOGY
The Darjeeling-Sikkim Himalayas have been divided into several belts
each of which is separated by major dislocations. Darjeeling-Sikkim
Himalayas has been sub-divided into four districts tectonic belts.
1. Sub-Himalaya Belt.
2. Lesser Himalayan Belt.
3. Higher Himalaya Belt.
4. Tethys Himalayan Belt.
The sub-Himalaya or the foot hill belt comprises of Siwaliks group of rocks
falling within Darjeeling Himalayas and which does not occur in the State of
Sikkim. Lesser Himalayan belt comprises lower Gondwana sediments, low
grade Meta- Sedimantaries of Buxa and Daling group of rocks. The Axial or
higher Himalayan belt is characterized by high grade metamorphic rocks viz.
high grade gneiss, mica schist, graphite schsit, calcareous gneiss, marble,
intrusives etc. is separated from lesser Himalayan belt by Main Central
Thrust (MCT). Overlying the Axial belts are the rocks Trans-Axial Belt of
Tethyan sequence consisting of fossiliferous sedimentary rocks of North
Sikkim Tethyan zone.
GEOLOGICAL AND GEO-TECTONIC SETTING OF THE AREA
The west-east or southerly facing slopes of Gangtok and suburb forms part
of inner belt with low, medium grade metamorphic rocks and few areas are
covered With Schists and Darjeeling Gneisses.The main Gangtok town stand
over the intrusive Lingtse Granite Gneiss. The main litho units of area are
gneisses, Lingtse granite gneiss, schistose rocks and medium to low grade
meta-sedimentaries.
The lower part of Gangtok from Ranipool area till 5th Mile and
Tadong comprise of the rocks of low grade meta-sedimentaries consisting of
Phyllites, Quartzite, Quartzitic phyllite and Phyllitic quartzite. The rock
shows North Easterly dip, striking NW-SE with low to moderate dip amount.
These rocks are at places rotated and attain NW dip (at 5th Mile Tadong
area). Quartzite and Phyllitic quartzites in some areas form steeper part of
slopes and show high relief.
These low grade meta-sedimentaries are overlain by medium to high
grade metamorphic rocks represented by Quartz-Mica Schist and
Garnetiferous Mica Schist and mica-schist band. The Garnetiferous mica
schist band is locally considered as a marker horizon and is exposed north
of STCS complex Deorali and can be traced upto Roro-chhu in North east
direction and towards Jhakri Falls in north-west direction. This band is
overlain by Mica Schist without garnets and which is overlain by Lintse
granite gneiss. Quartz mica schist rocks are exposed in and around
Gurudwara complex, north of Accountant General Office. Below National
Highway from ICAR Complex to Garage Jhora downslope of Indira Byepass
road. Mica schist, Garnetferous Mica Schist, Quartzitic phyllites are the
dominant country rock in this area. The rocks at all places show north
easterly dip but down-slope of Gurudwara, rocks show North Westerly dip.
Similar rocks are expected at variable depth within the veterinary complex.
A fault line present in the area from Deorali to Sokeythang (Marked on the
Structural map). These rocks are overlained by Lingtse granite gneiss and
the contact between two are suspected to be thrust contact. The contact
zone between Mica-Schist band and Lingtse Granite area is shown in the
map.
Lingtse Granite Gneiss unit is overlain by Mica Schist followed by high
grade metamorphic rocks. As discussed above, mica Schist rocks are
expected at variable depth at veterinary complex. The area at Sokethang
consists of thick blanket of slope wash material consisting of rock fragments
of variable size (derived from Lingtse granite gneiss and mica-Schist of
overlying area) followed by sandy & silt cover and fine grained organic soil at
the top. Bed rock in this area, similar to rock exposed around 5th Mile
Tadong is expected at greater depth.
The Holy Cross School area is subject to instability problems like
creep, and subsidence.This is basically because of presence of active fault
towards north of school complex. The area below Entel Motors is marked by
excessive ground water activity, swampy area and gulley erosion. The
seepage of water through fractures, cracks and fissure in slope forming
material and rock section is evident in lower part of the area. The Holy
Cross-School Complex and the adjoining buildings are facing serious cases
of slope instability in form of creep/subsidence due to rock foliations
oriented along slope direction, excessive loading, presence of an active fault,
vehicular vibrations and so on. Evidence of serious instability around this
locality is shown by presence of failure or cracks in buildings, failure of road
formations with constant subsidence of the road NH31A.
Similarly there are other such hazard zones effecting the habitation of
the capital Town of Gangtok. These are primarily due to effect of one or more
types of hazards resulting in loss of human life or property.Sikkim is also
placed in zone iv/v in earthquake vulnerability map of India.This is also
issue of concern and houses needs to be constructed in resonance with
building bye-laws for construction of earthquake resilient structures.
Similarly hazards like Fire, Flashfloods, Hailstorms and etc needs to be
cared for safe living in Gangtok.
Hazard Risk and Vulnerability assessment
This Hazard Risk and Vulnerability assessment was conducted by SSDMA
(Sikkim State Disaster Management Authority) based on the technical data
made available by Department of Mines, Minerals and Geology, Government
of Sikkim along with other Governmental and Non-governmental central and
state government organizations. The GIS mapping was prepared by Disha
Services, Gangtok.
Purpose
The purpose of Hazard, risk and vulnerability analysis (HRVA) is to
help a community and make risk-based choices to address vulnerabilities,
mitigate hazards and prepare for response to and recovery from hazard
events. Risk-based means based on informed choices of alternate unwanted
outcomes. In other words, communities make risk reduction choices based
on the acceptability of consequences and the frequency of hazards.
Hazard Risk and Vulnerability Assessment
Considering hazards alone may lead to a skewed set of priorities for action.
It is equally important to consider the severity of possible impacts from the
hazard as well as the frequency or likelihood of a hazard event occurring.
The combination of severity and likelihood is termed the level of risk. In
determining the severity of a hazard event, a community’s vulnerability
must be examined. Vulnerability is defined as people, property,
infrastructure, industry and resources, or environments that are
particularly exposed to adverse impact from a hazard event. Hazards reflects
the frequency of occurrence for a particular hazard event and can range
from rare events occurring every 50 years to more frequent events, which
usually have a high number of recorded incidents or anecdotal evidence.
Scope
This HRVA is designed to provide an assessment of the hazards that may
present risks to the region of Gangtok Municipal Corporation. The objective
of the HRVA is to:
1. Investigate prominent natural and human-caused events.
2. Identify the various hazards affected by that area and hazards likely to
occur in Gangtok Municipal Corporation area.
3. Identify any threats that may require a timely and coordinated
response to protect lives, property, and to reduce economic losses.
4. Definition of measures to be included in the mitigation plan.
5. Evaluation of the effectiveness of the mitigation and emergency plans
and implementation of training activities such as simulation,
seminars and workshops.
Components for Assessment of Multi Hazards Risk Vulnerability
Assessment (MHRVA)
MHRVA are being undertaken where the following hazards are considered
for Gangtok Municipal Corporation in East District of Sikkim located in
Lower Himalayan land mass in mountainous state of Sikkim as per IS codes
and other requisite data from the field, which is required for Multi Hazards
Risk Vulnerability Assessment Study.
a) Earthquake hazards.
b) Landslide hazards.
c) Fire hazards.
d) Flood/ flash floods hazards.
e) Snow Avalanches hazards.
f) Drought hazards.
g) Hailstorm, Thundering and lightening hazards.
h) Riots and stamped.
Vulnerability Assessment
The intent of this Hazard Risk and Vulnerability Assessment is to provide a
basis from which local planners, politicians, and responders can create or
update the Regional emergency plan, allocate resources for risk mitigation,
enhance community preparedness, and prepare budgets for cost-effective,
on-going emergency planning. This assessment is based on both primary
and secondary sources. Both quantitative and qualitative methods are used
to determine hazard ratings for the area of interest.
HRVA Risk Rating Interpretation
RISK RATING INTERPRETATION
These risks are low. Implementation of mitigation measures will enhance
emergency preparedness but it is of less urgency and highly unlikely to
occur in that area than the following hazards.
These risks are medium low. Implementation of mitigation measures will
enhance emergency preparedness. Hazards are highly unlikely to occur in
that area, but are of more urgency than low
These risks are medium. These hazards have intermediate levels of
frequency and severity. Hazards classified as moderate are more urgent than
medium low hazards and are often common place concerns. Given this,
moderate level hazards should be addressed with an appropriate level of
urgency.
These risks are medium high. These hazards warrant review and
development of mitigation actions to reduce the risk to an acceptable level.
But these hazards require immediate examination and mitigation measures
to reduce the risk to an acceptable level.
These risks are very high. These hazards are both frequent and are of high
severity. These hazards require immediate examination and mitigation
measures to reduce the risk to an acceptable level.
Hazards
This HRVA is designed to provide an assessment of the hazards that may
present risks to the region of Gangtok Municipal Corporation. However, the
following hazards are most likely to occur and may result in significant
consequences. Each hazard is examined to assess the relative risks to the
community and to highlight opportunities for mitigation and coordinated
response. In this analysis, extensive background and historical research was
compiled and considered in the context of severity and likelihood to assess
the hazard risk.

LANDSLIDE HAZARD RISK
VULNERABILITY ASSESSMENT OF
GANGTOK
Landslide Hazard:
The term landslide describes a wide variety of processes, including debris
avalanches, debris flows, and other rapid mass wasting events which result
in the rapid downward and outward movement of soil, rock and vegetation
under the force of gravity. Rock falls occur when rocks fall freely from a cliff
face. A submarine slide is the movement of materials involving water
charged and coarse-grained sediment flowing rapidly on underwater slopes
or channels. If the volume of sediment is sufficient, submarine slides can
potentially displace enough water to generate destructive surface waves, also
known as local marine tsunamis. Landslide events occur when the slope
reaches a critical level of instability and may be triggered by rains, flooding,
seismic events, and other factors. Slope instability may be variable (i.e.
caused by such factors as heavy rain and changes in ground water levels), it
may be transient, as in the case of seismic activity or it may be inherent due
to the weak composition of the soil or rock structures. New environmental
conditions such as those resulting from the removal of vegetation due to
construction may also create instability in slopes. Landslides may damage
or destroy critical infrastructure such as power and telephone lines,
municipal water facilities, waste water facilities, and hazardous materials
storage sites.
Methodology:
In the development of Landslide Hazard Risk and Vulnerability Assessment
extensive historical research was conducted along with continuous
successive field visit with the development and analysis of the following
maps:
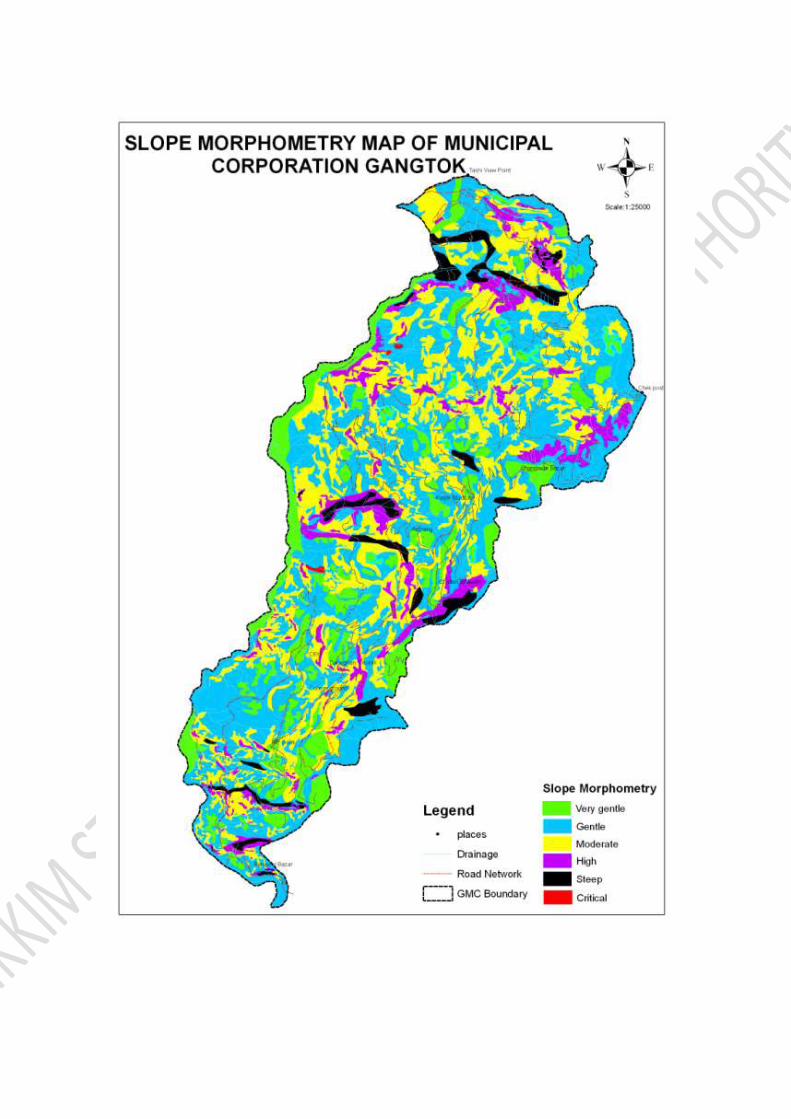
Slope Morphometry Map
Geological/Lithological Map
Soil Type Map
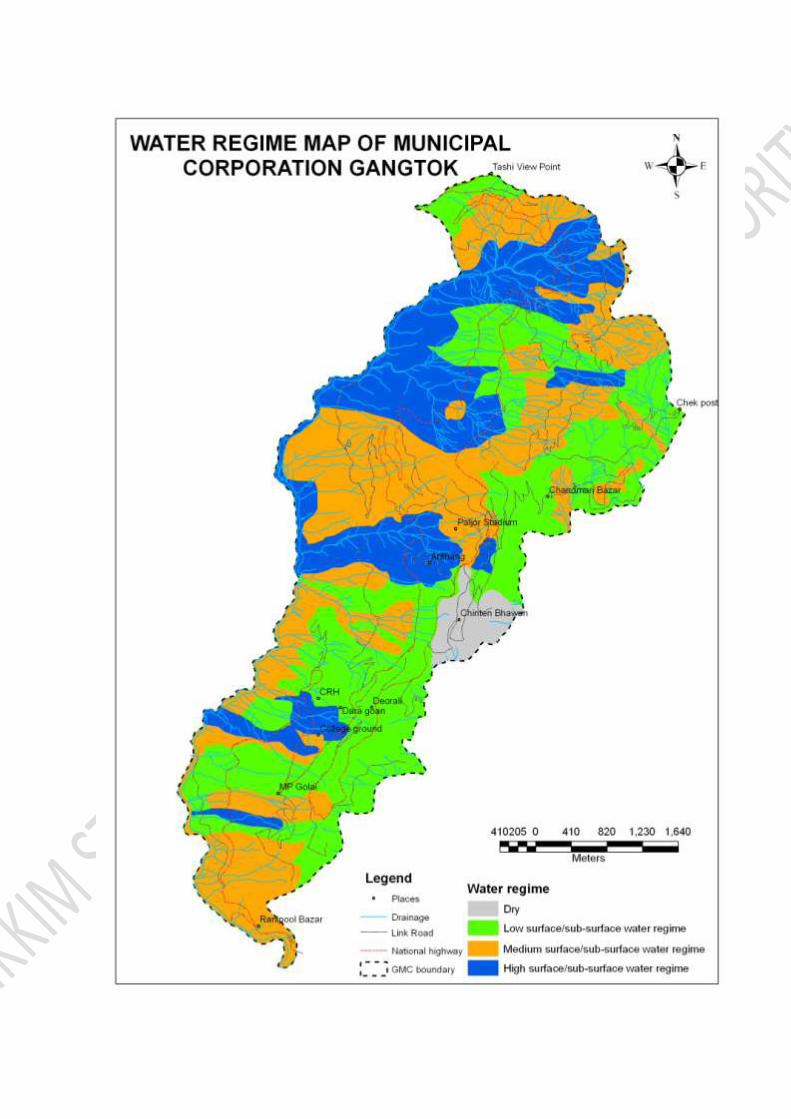
Hydrological Map
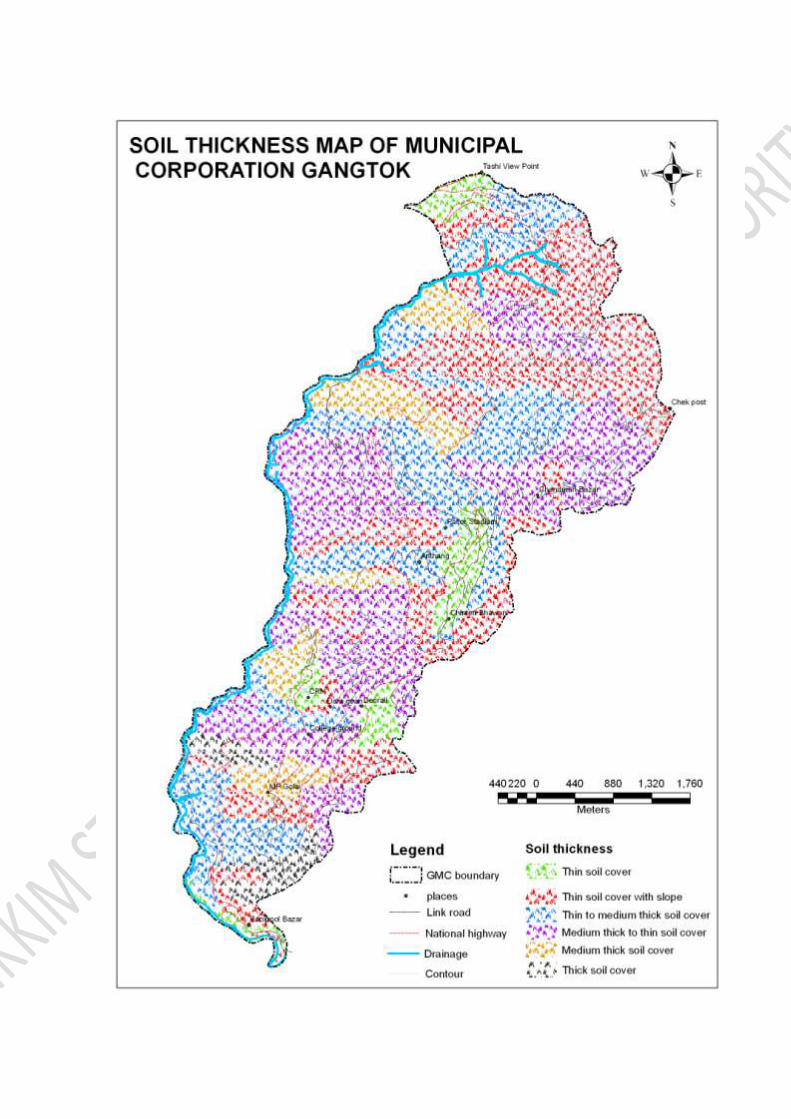
Soil Thickness Map
Landslide Inventory Map
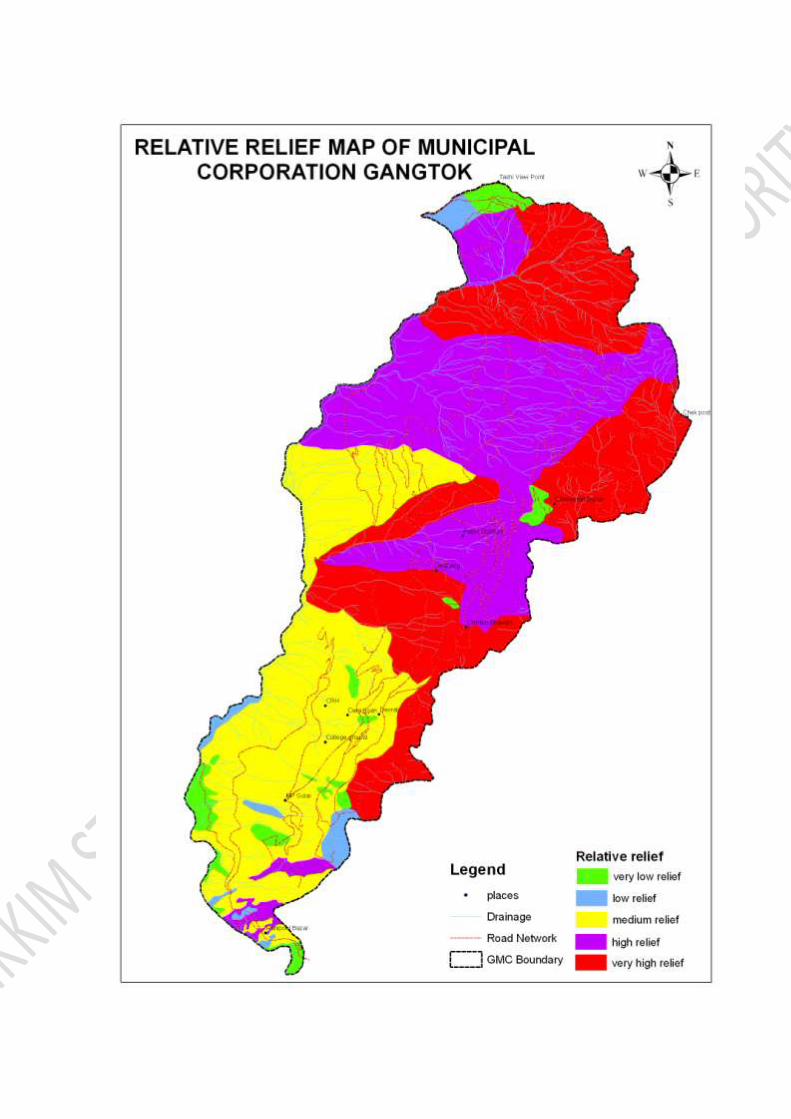
Relative Relief Map
Land Use / Land Cover Map
Rainfall Map

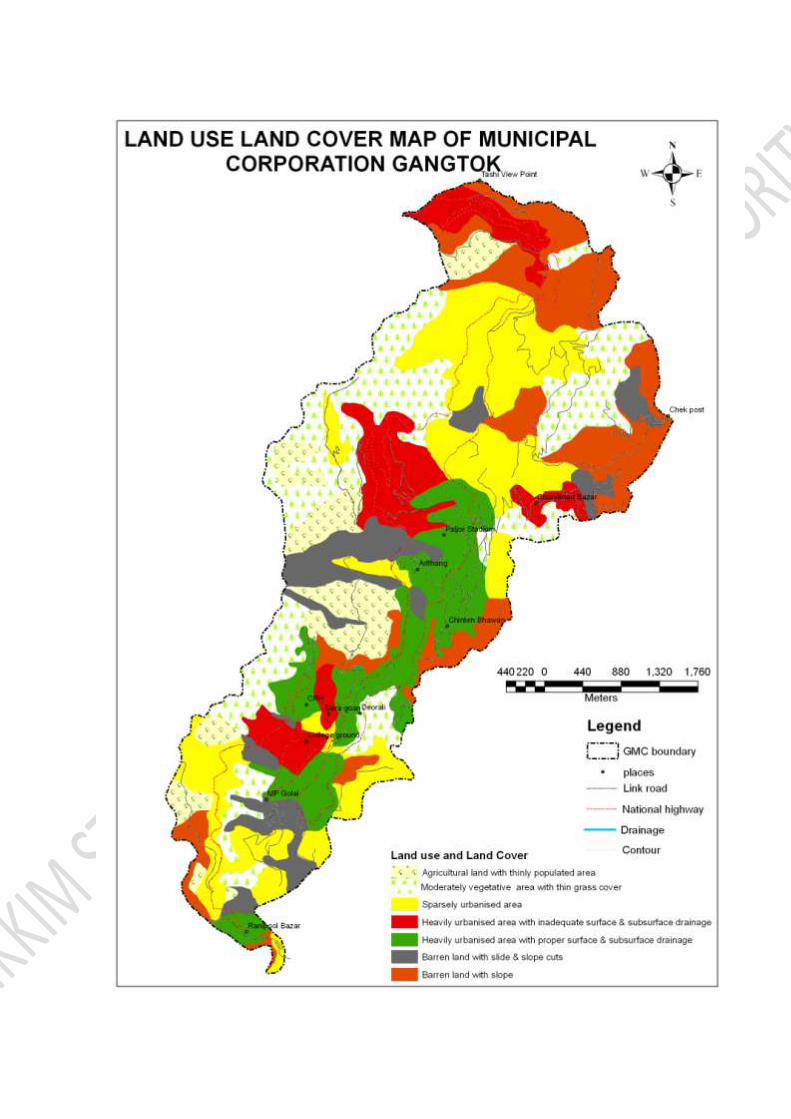


Landslide Hazards
Hazards Category % of Area % of Buildings Risk type
Very High Hazards 7.51 1.84 Very High
Medium High Hazards 24.64 18.18 High
Medium Hazards 34.10 39.27 Medium
Medium Low Hazards 32.60 39.57 Low
Low Hazards 1.13 1.12 Low
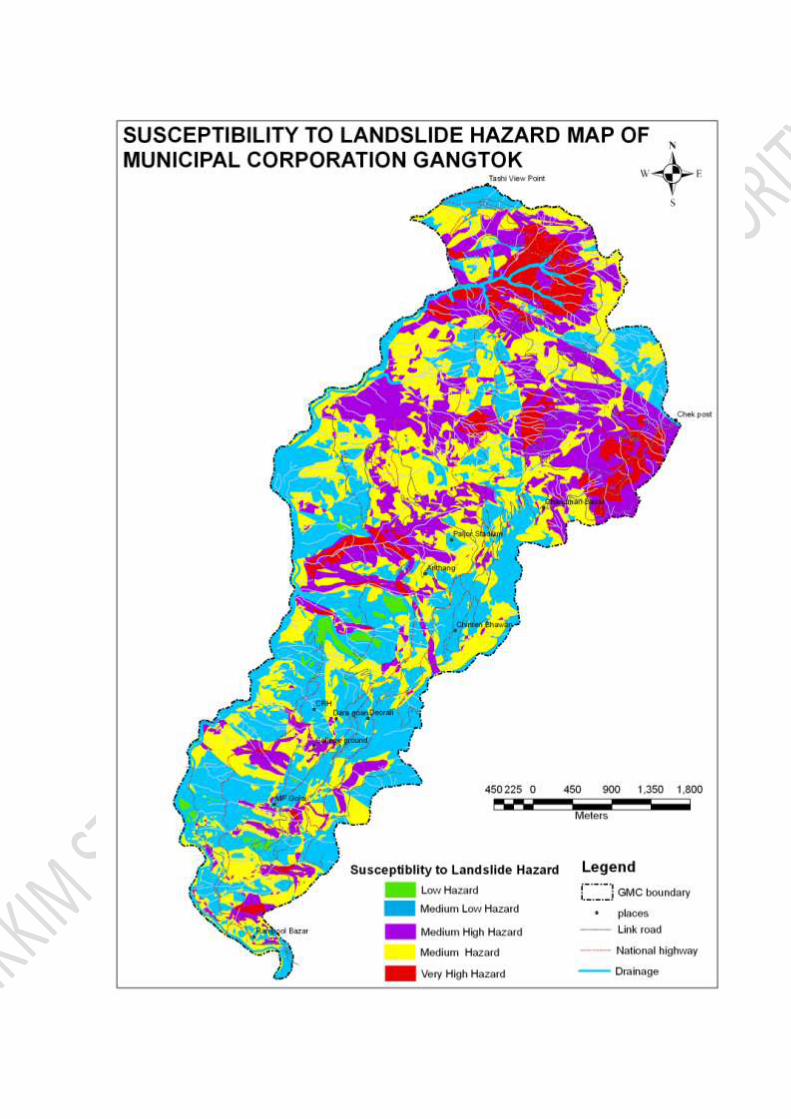
Conclusion:
After extensive study and research of various maps and data it was possible
to develop Landslide Hazard Risk and Vulnerability Map for the Gangtok
Municipal corporation. The study leads to the following conclusions:
The area’s most likely to be affected by landslide were areas in and
around 6th mile near holy cross school, along PS jhora and area
around Burtuk.
7.51% of the area fell in very high risk zone with 1.84% of the total
settlement to be affected
24.64% of the area fell in very medium high risk zone with 18.18% of
the total settlement to be affected
34.10% of the area fell in very medium risk zone with 39.17% of the
total settlement to be affected
32.60% of the area fell in very medium low zone with 39.57% of the
total settlement to be affected.
1.13% of the area fell in very low risk zone with 1.12% of the total
settlement to be affected
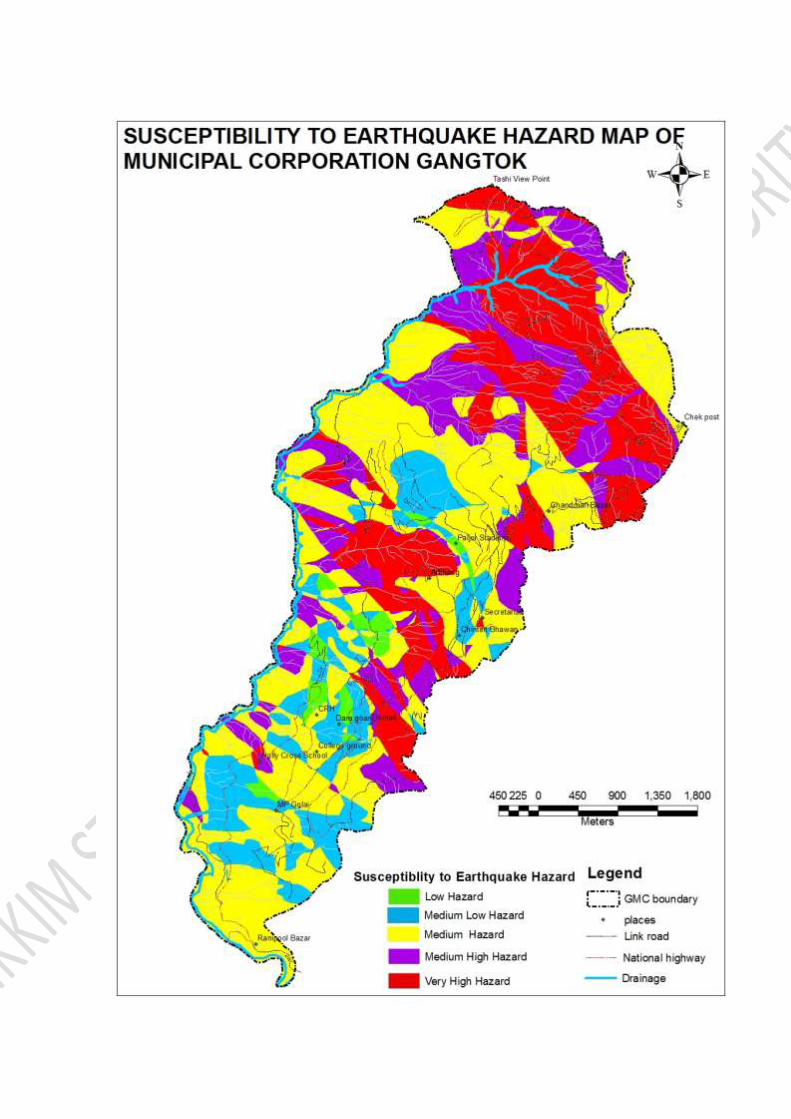
EARTHQUAKE HAZARDS RISK
VULNERABILITY ASSESSMENT OF
GANGTOK
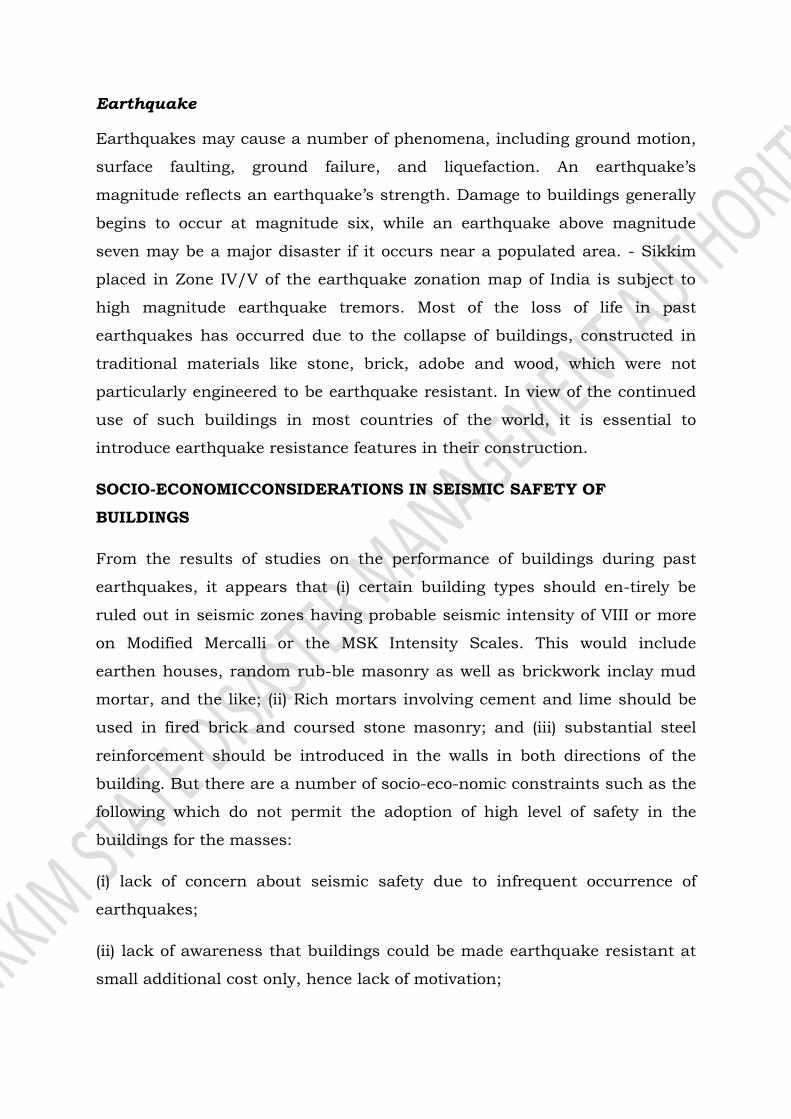
Earthquake
Earthquakes may cause a number of phenomena, including ground motion,
surface faulting, ground failure, and liquefaction. An earthquake’s
magnitude reflects an earthquake’s strength. Damage to buildings generally
begins to occur at magnitude six, while an earthquake above magnitude
seven may be a major disaster if it occurs near a populated area. - Sikkim
placed in Zone IV/V of the earthquake zonation map of India is subject to
high magnitude earthquake tremors. Most of the loss of life in past
earthquakes has occurred due to the collapse of buildings, constructed in
traditional materials like stone, brick, adobe and wood, which were not
particularly engineered to be earthquake resistant. In view of the continued
use of such buildings in most countries of the world, it is essential to
introduce earthquake resistance features in their construction.
SOCIO-ECONOMICCONSIDERATIONS IN SEISMIC SAFETY OF
BUILDINGS
From the results of studies on the performance of buildings during past
earthquakes, it appears that (i) certain building types should en-tirely be
ruled out in seismic zones having probable seismic intensity of VIII or more
on Modified Mercalli or the MSK Intensity Scales. This would include
earthen houses, random rub-ble masonry as well as brickwork inclay mud
mortar, and the like; (ii) Rich mortars involving cement and lime should be
used in fired brick and coursed stone masonry; and (iii) substantial steel
reinforcement should be introduced in the walls in both directions of the
building. But there are a number of socio-eco-nomic constraints such as the
following which do not permit the adoption of high level of safety in the
buildings for the masses:
(i) lack of concern about seismic safety due to infrequent occurrence of
earthquakes;
(ii) lack of awareness that buildings could be made earthquake resistant at
small additional cost only, hence lack of motivation;
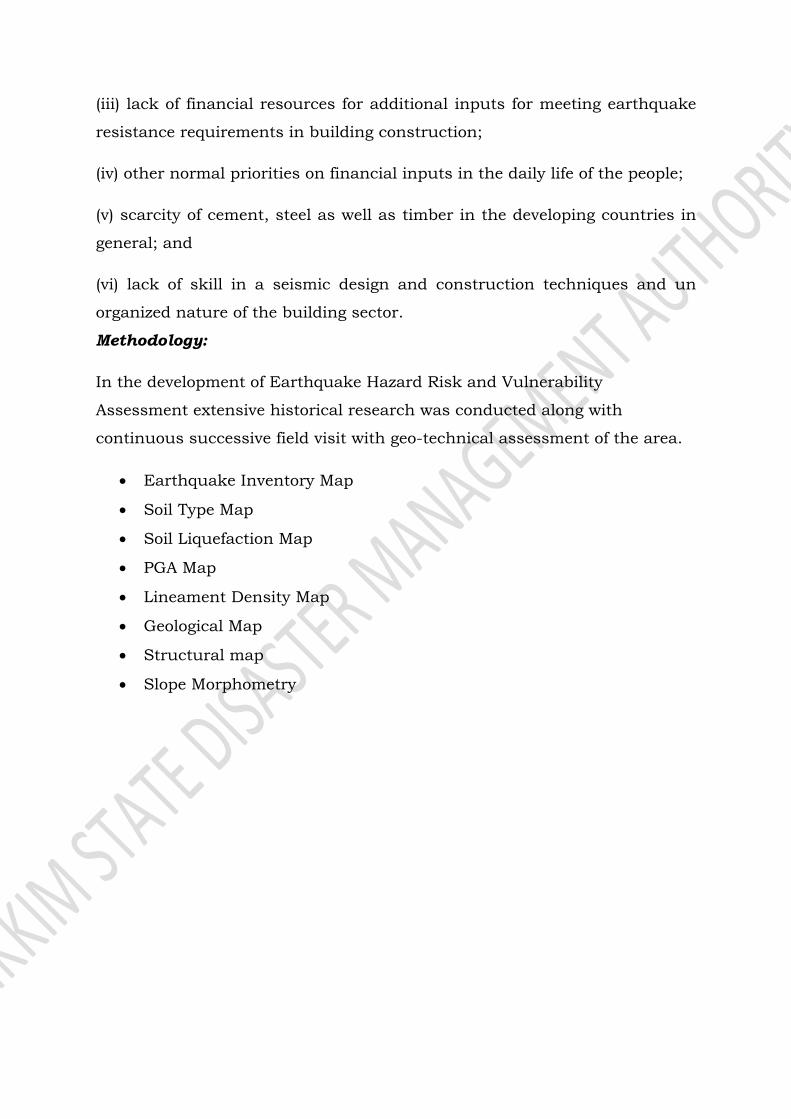
(iii) lack of financial resources for additional inputs for meeting earthquake
resistance requirements in building construction;
(iv) other normal priorities on financial inputs in the daily life of the people;
(v) scarcity of cement, steel as well as timber in the developing countries in
general; and
(vi) lack of skill in a seismic design and construction techniques and un
organized nature of the building sector.
Methodology:
In the development of Earthquake Hazard Risk and Vulnerability
Assessment extensive historical research was conducted along with
continuous successive field visit with geo-technical assessment of the area.
Earthquake Inventory Map
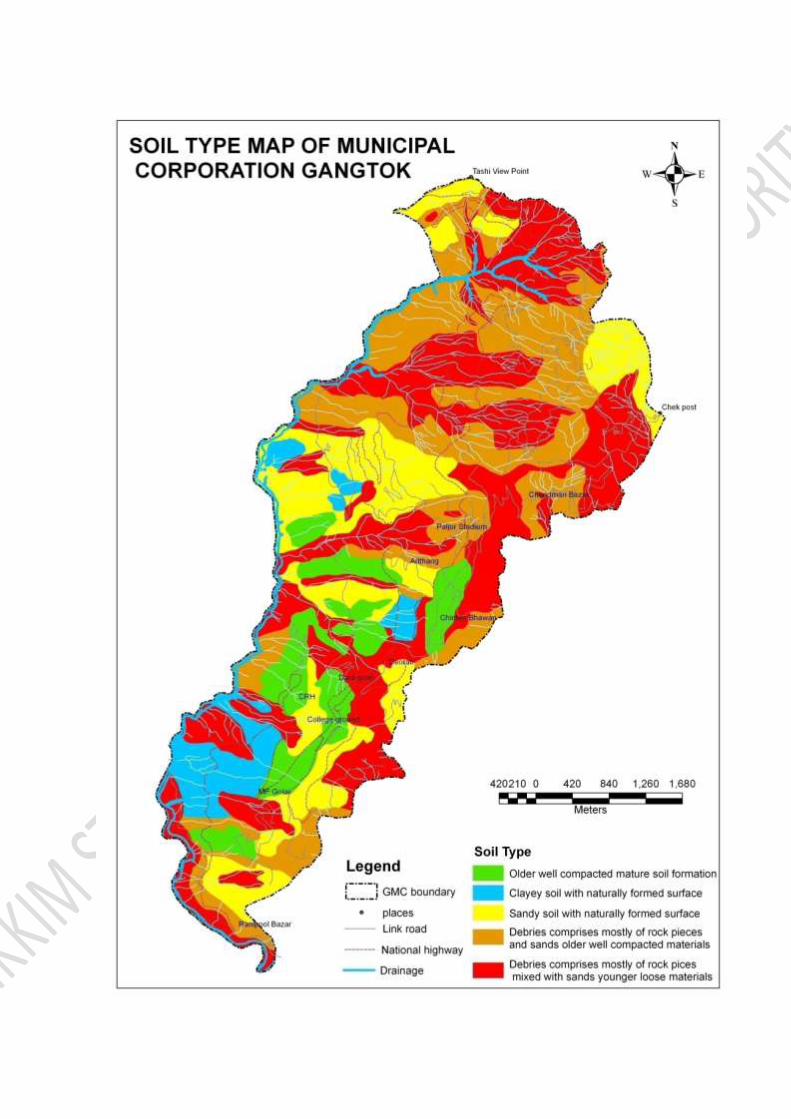
Soil Type Map
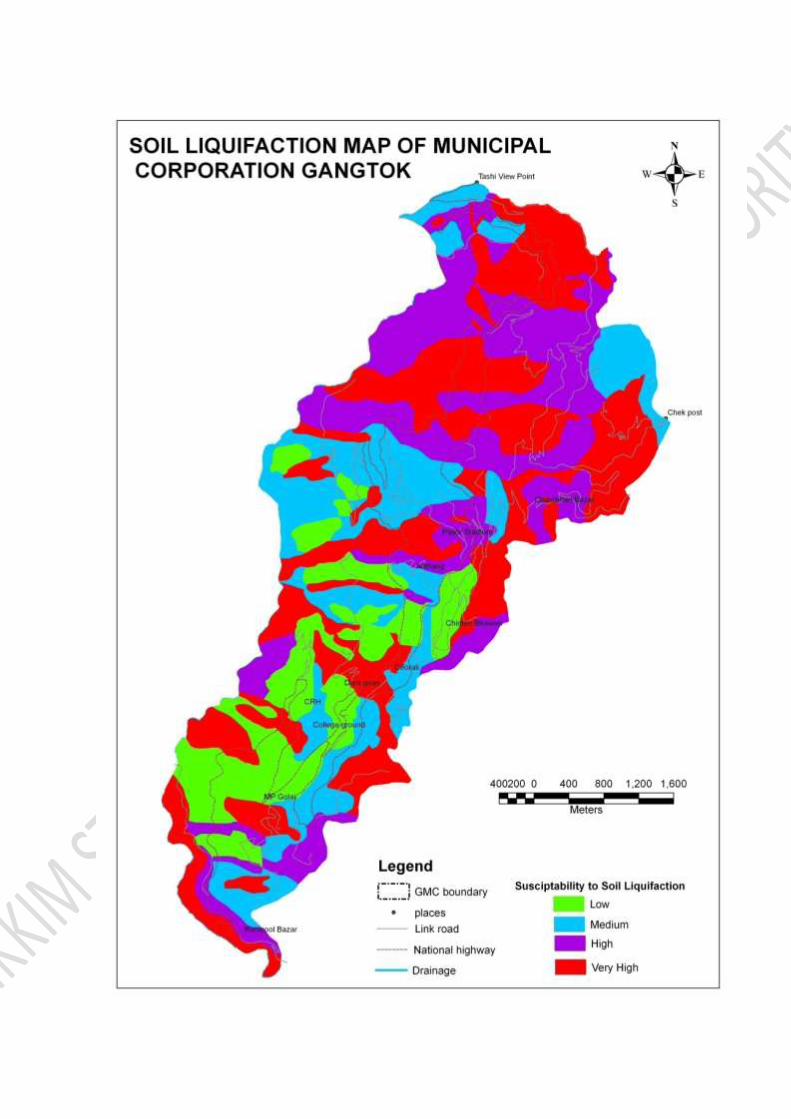
Soil Liquefaction Map
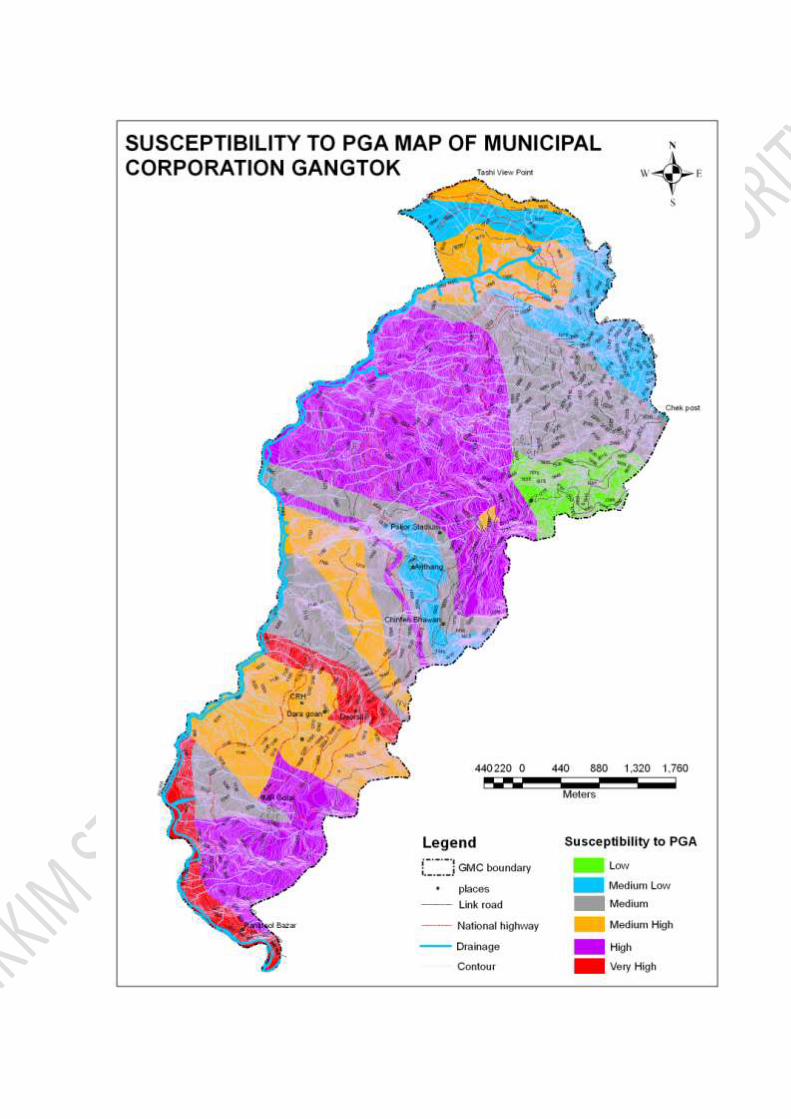
PGA Map
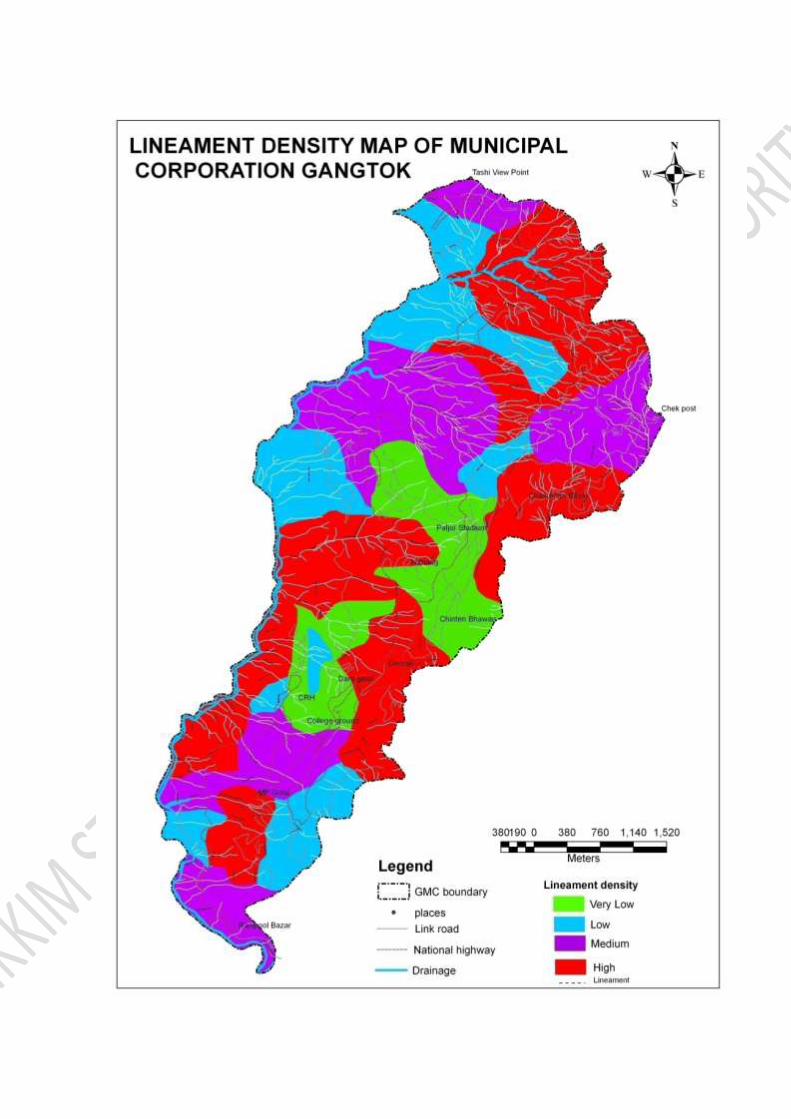
Lineament Density Map
Geological Map
Structural map
Slope Morphometry


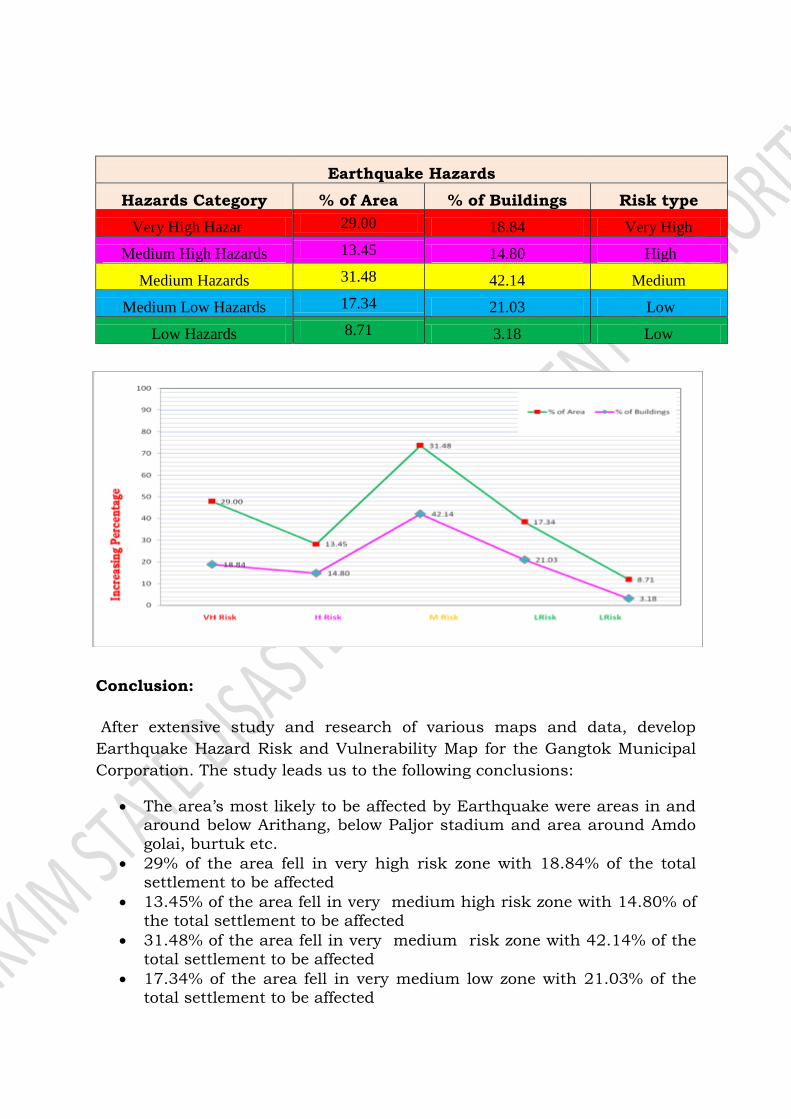
Earthquake Hazards
Hazards Category % of Area % of Buildings Risk type
Very High Hazards 29.00 18.84 Very High
Medium High Hazards 13.45 14.80 High
Medium Hazards 31.48 42.14 Medium
Medium Low Hazards 17.34 21.03 Low
Low Hazards 8.71 3.18 Low
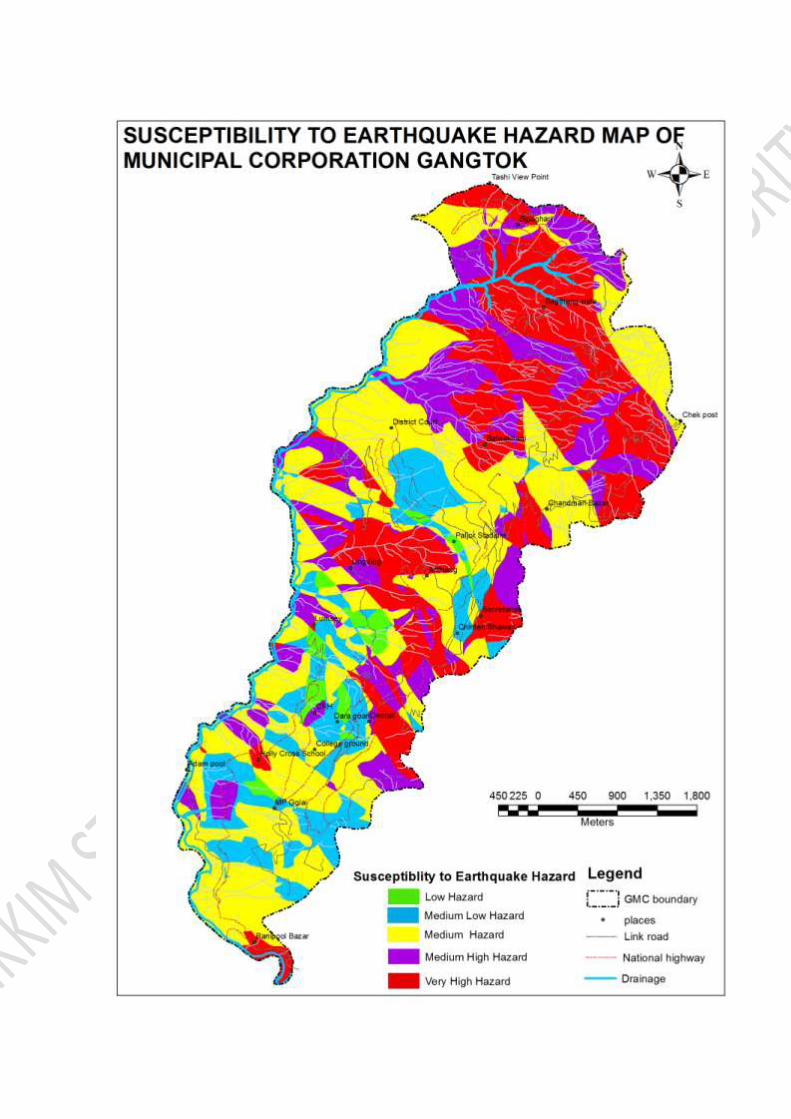
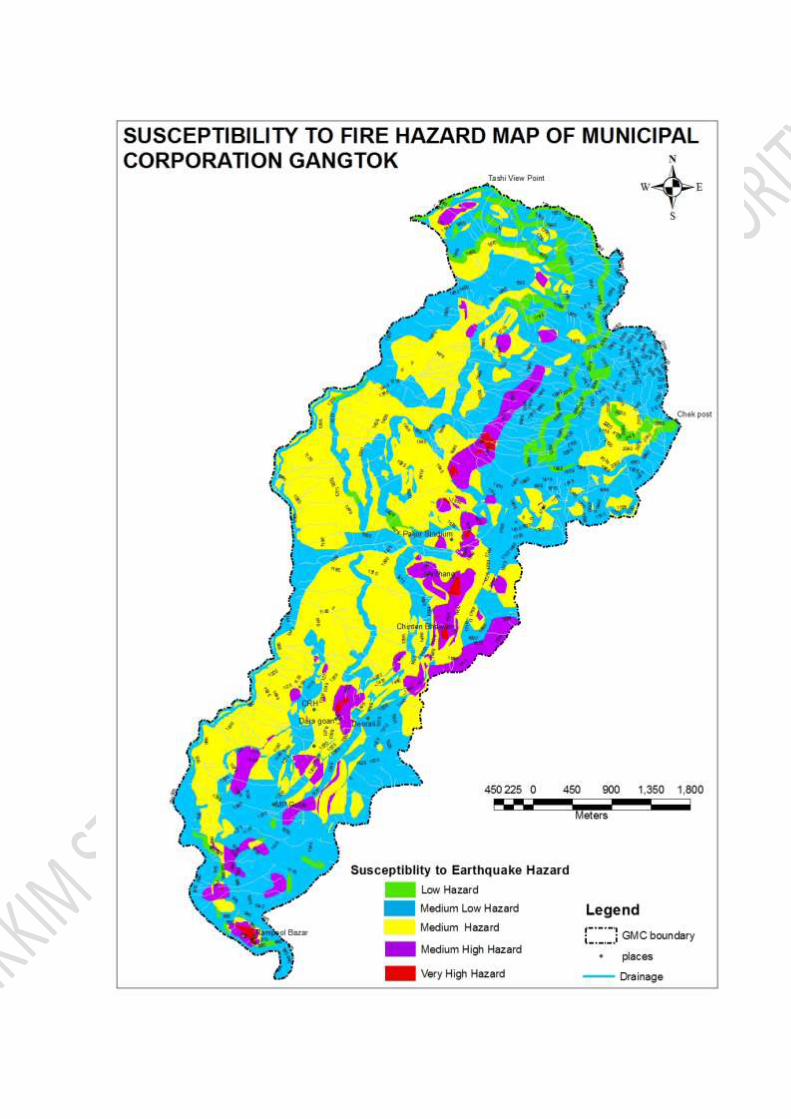
Conclusion:
After extensive study and research of various maps and data, develop
Earthquake Hazard Risk and Vulnerability Map for the Gangtok Municipal
Corporation. The study leads us to the following conclusions:
The area’s most likely to be affected by Earthquake were areas in and around below Arithang, below Paljor stadium and area around Amdo
golai, burtuk etc.
29% of the area fell in very high risk zone with 18.84% of the total
settlement to be affected
13.45% of the area fell in very medium high risk zone with 14.80% of
the total settlement to be affected
31.48% of the area fell in very medium risk zone with 42.14% of the
total settlement to be affected
17.34% of the area fell in very medium low zone with 21.03% of the
total settlement to be affected
8.71% of the area fell in very low risk zone with 3.18% of the total
settlement to be affected
FIRE ( FOREST/HUMAN INDUCED )
The most common hazard in forests is forests fire. Forests fires are as old as
the forests themselves. They pose a threat not only to the forest wealth but
also to the entire regime to fauna and flora seriously disturbing the bio-
diversity and the ecology and environment of a region. During summer,
when there is no rain for months, the forests become littered with dry
senescent leaves and twinges, which could burst into flames ignited by the
slightest spark. The Himalayan forests have been burning regularly during
the last few summers, with colossal loss of vegetation cover of that region.
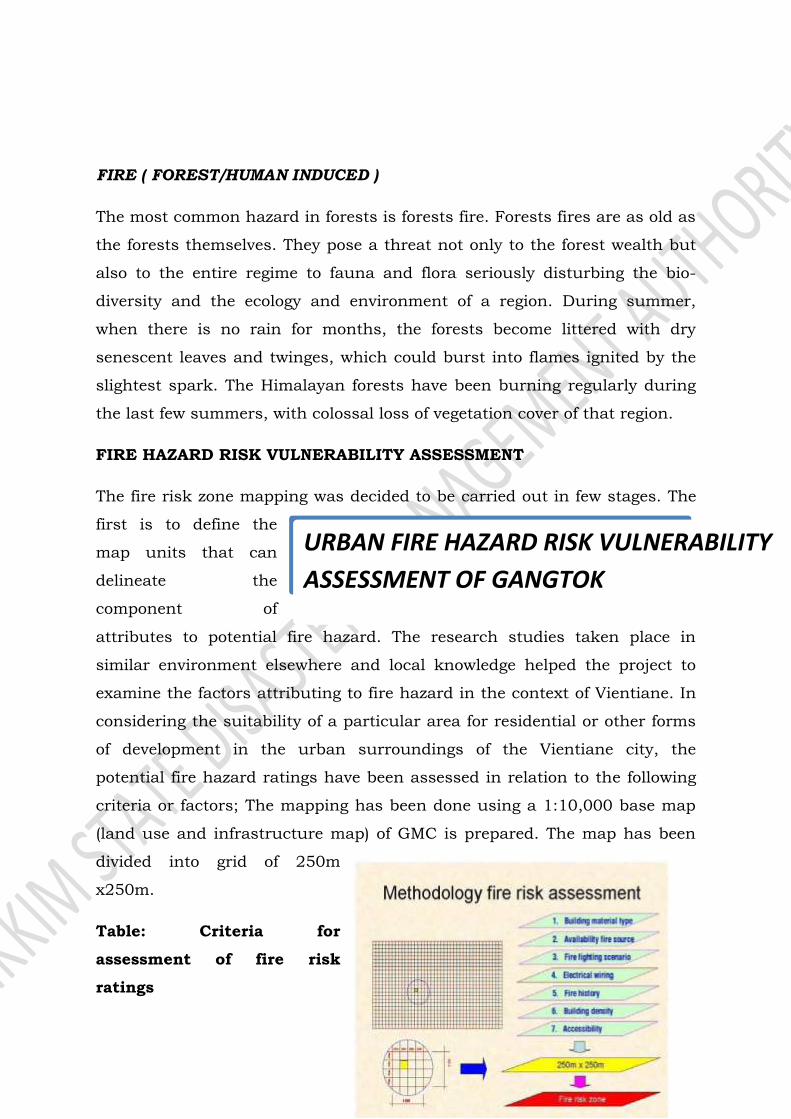
FIRE HAZARD RISK VULNERABILITY ASSESSMENT
The fire risk zone mapping was decided to be carried out in few stages. The
first is to define the
map units that can
delineate the
component of
attributes to potential fire hazard. The research studies taken place in
similar environment elsewhere and local knowledge helped the project to
examine the factors attributing to fire hazard in the context of Vientiane. In
considering the suitability of a particular area for residential or other forms
of development in the urban surroundings of the Vientiane city, the
potential fire hazard ratings have been assessed in relation to the following
criteria or factors; The mapping has been done using a 1:10,000 base map
(land use and infrastructure map) of GMC is prepared. The map has been
divided into grid of 250m
x250m.
Table: Criteria for
assessment of fire risk
ratings
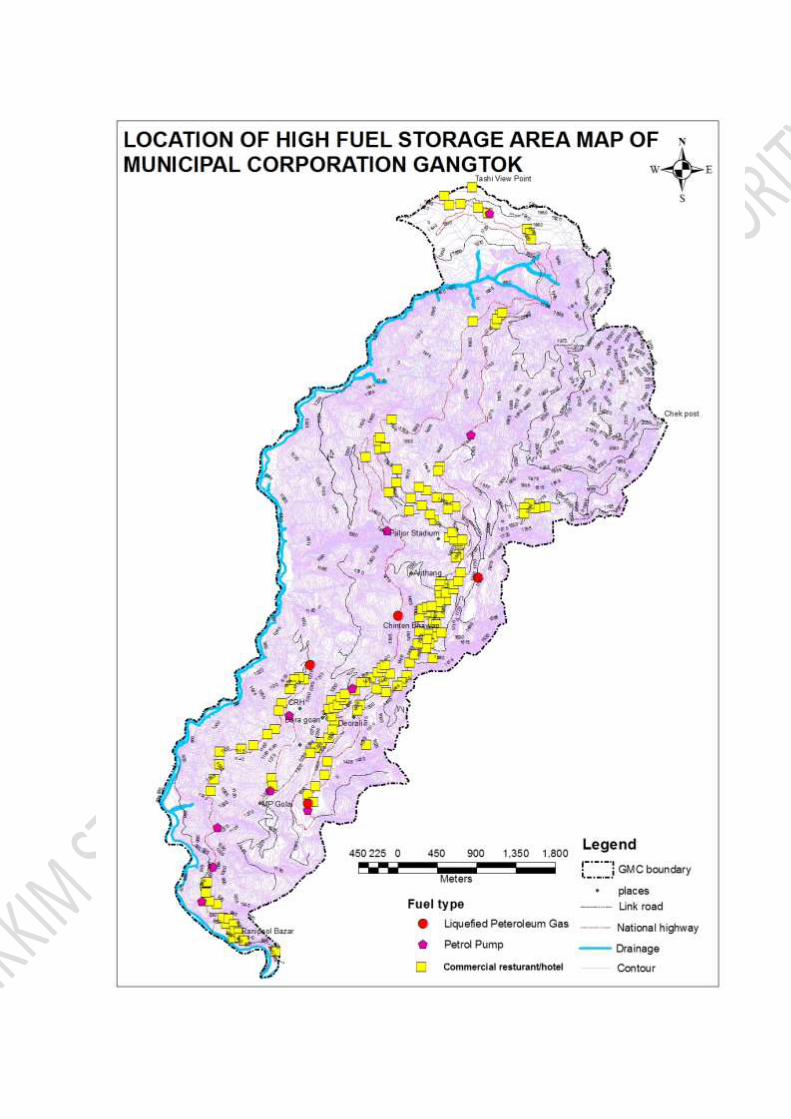
URBAN FIRE HAZARD RISK VULNERABILITY
ASSESSMENT OF GANGTOK

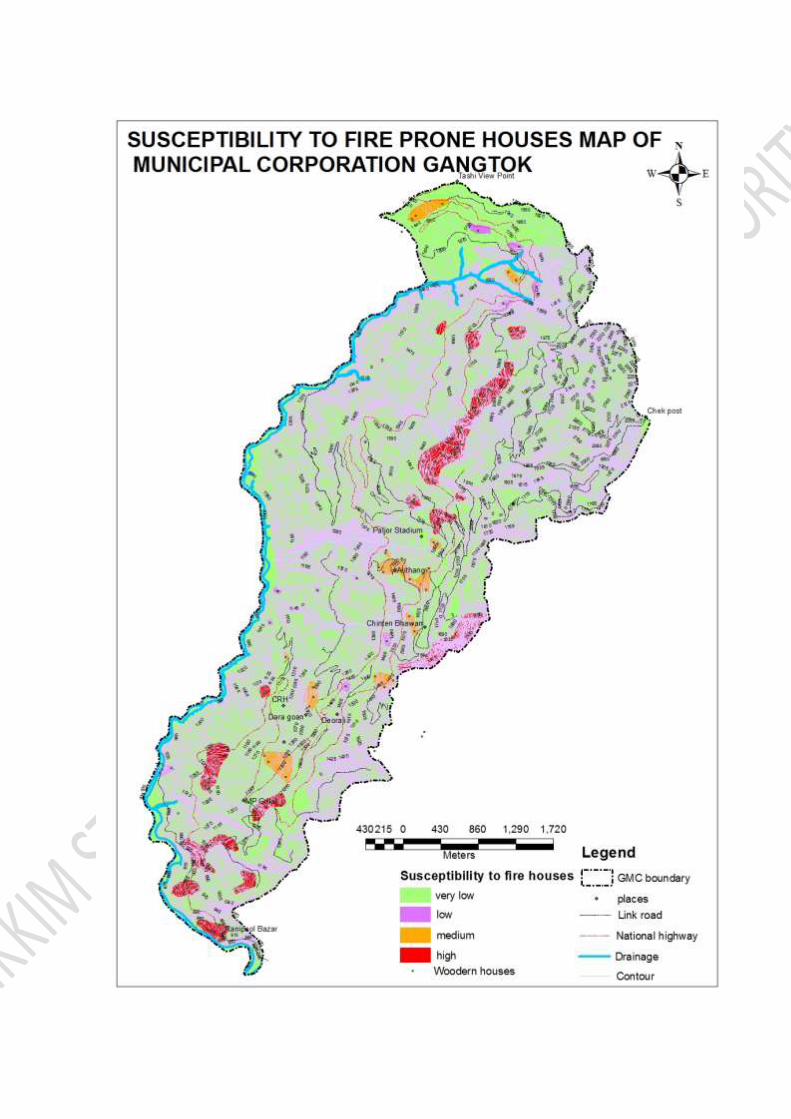
1 Building material type
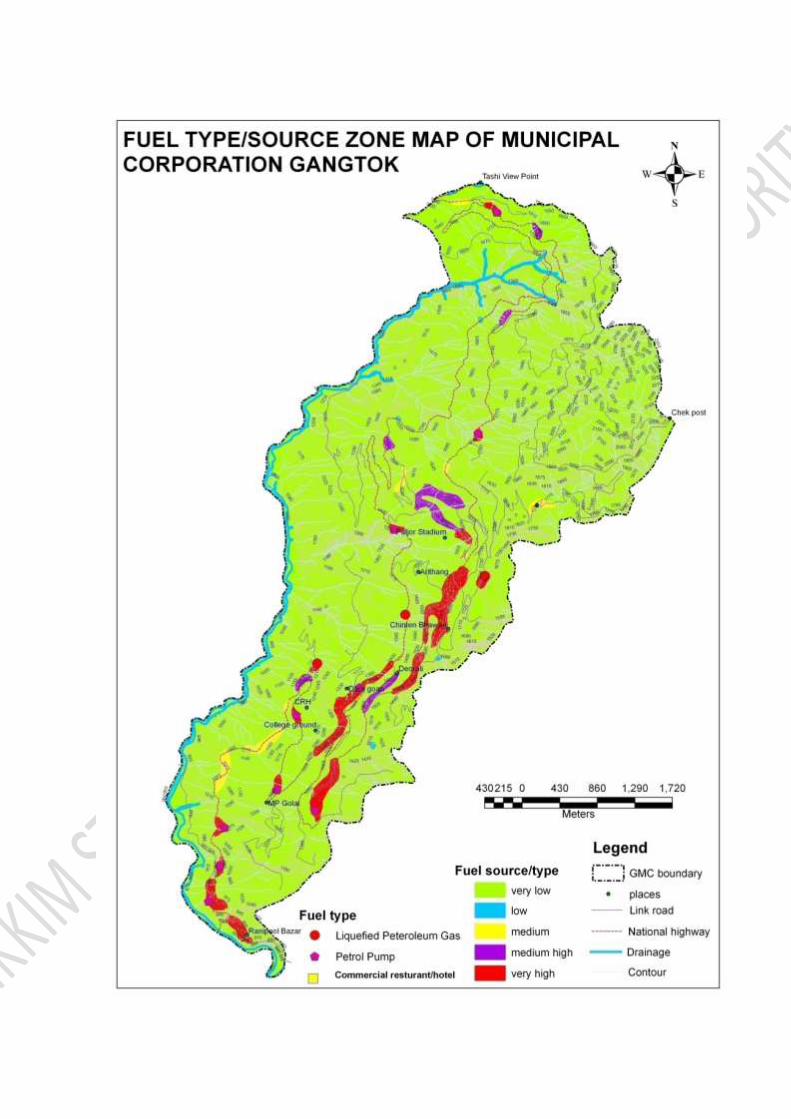
2 Availability of fire sources
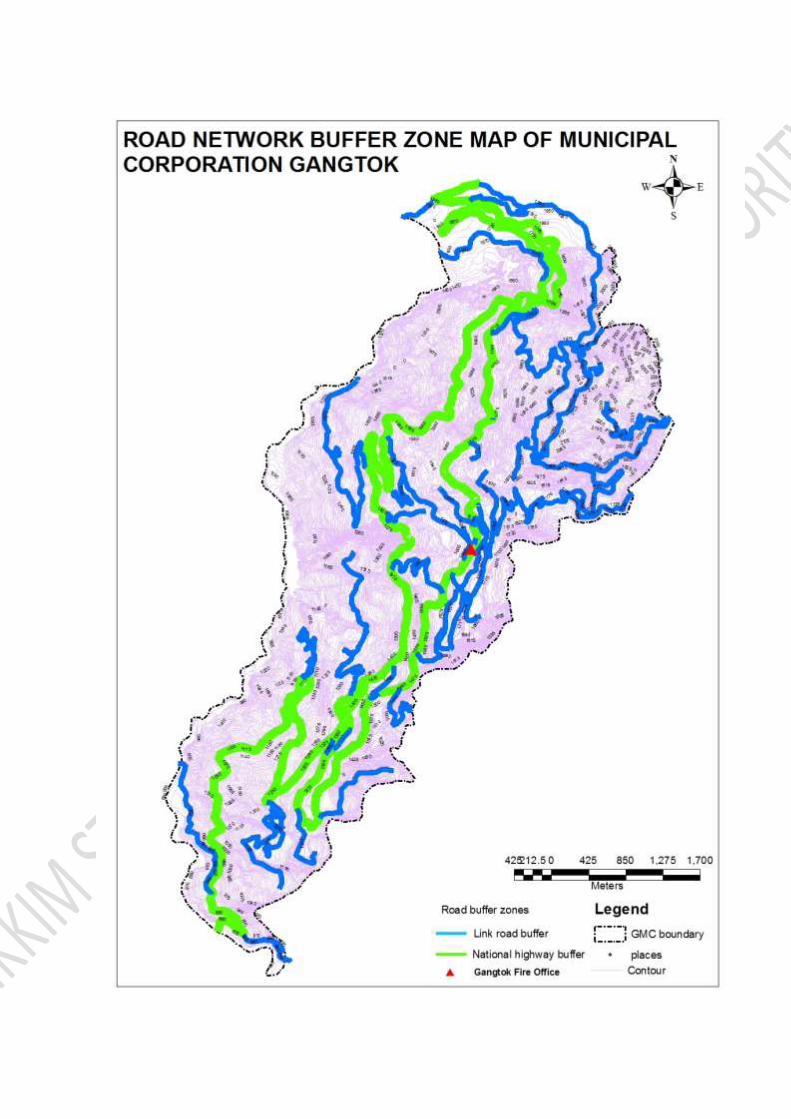
3 Fire fighting scenario
4 Electrical wiring
5 Fire history
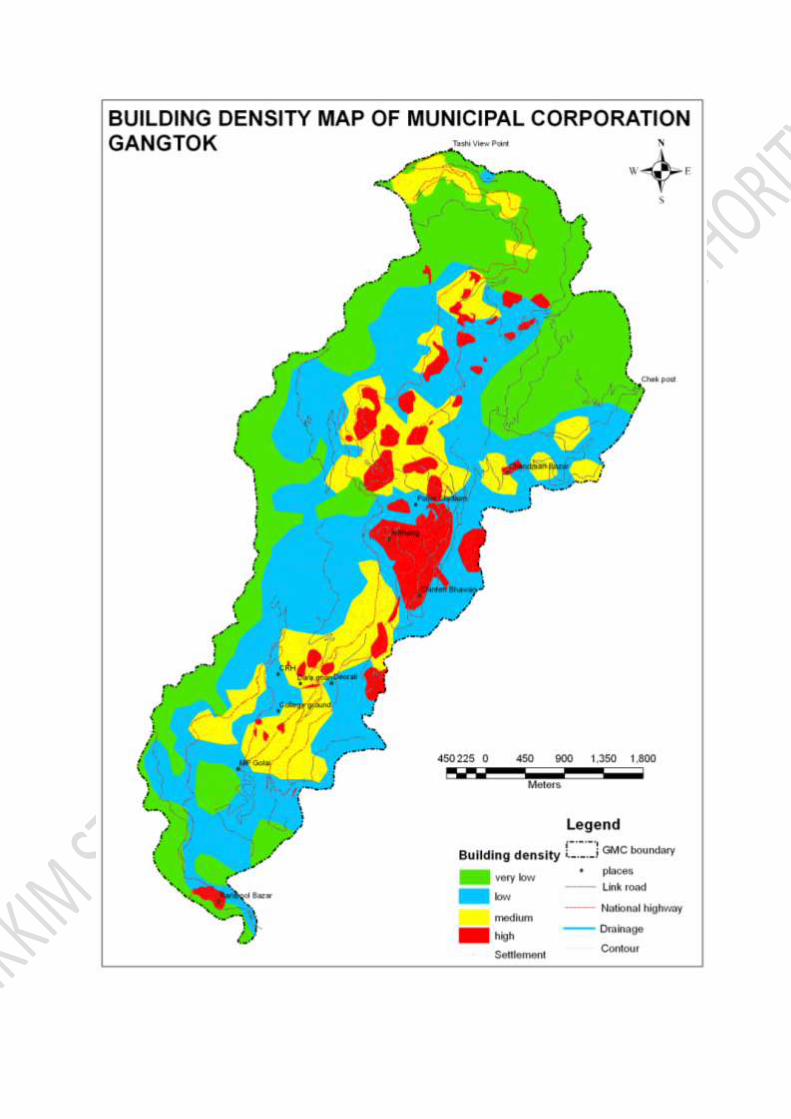
6 Building Density
7 Accessibility

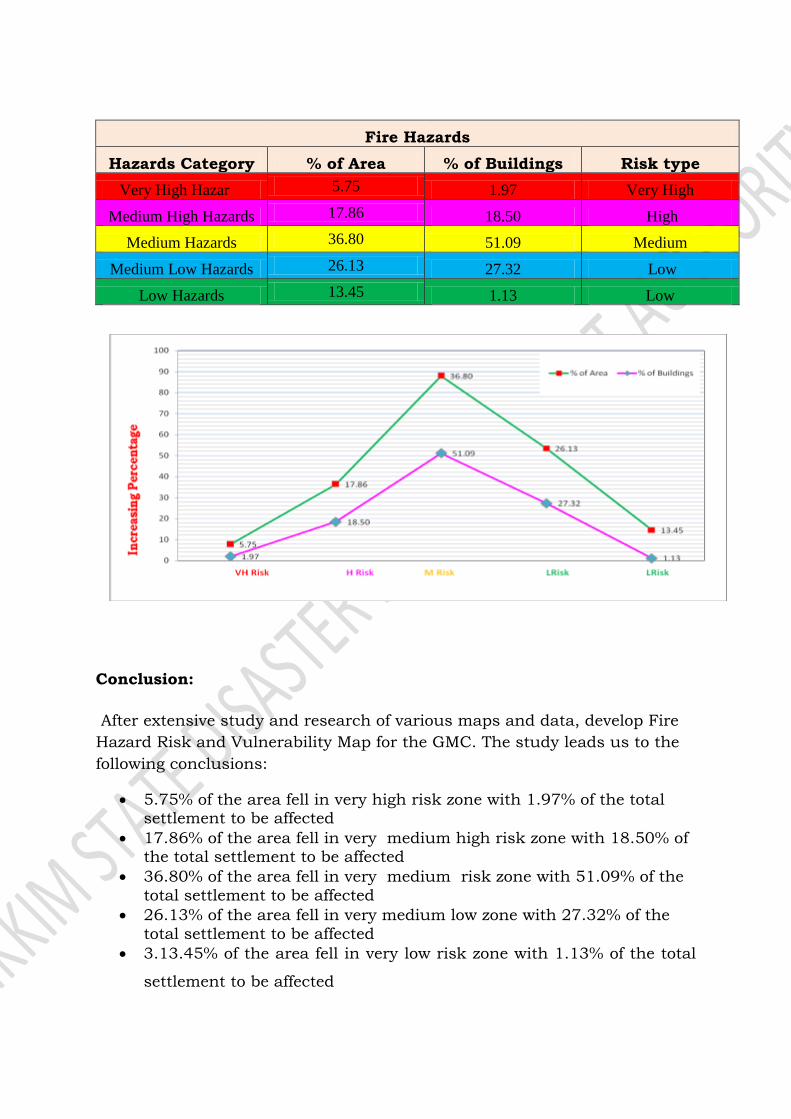
Fire Hazards
Hazards Category % of Area % of Buildings Risk type
Very High Hazards 5.75 1.97 Very High
Medium High Hazards 17.86 18.50 High
Medium Hazards 36.80 51.09 Medium
Medium Low Hazards 26.13 27.32 Low
Low Hazards 13.45 1.13 Low
Conclusion:
After extensive study and research of various maps and data, develop Fire
Hazard Risk and Vulnerability Map for the GMC. The study leads us to the
following conclusions:
5.75% of the area fell in very high risk zone with 1.97% of the total settlement to be affected
17.86% of the area fell in very medium high risk zone with 18.50% of the total settlement to be affected
36.80% of the area fell in very medium risk zone with 51.09% of the
total settlement to be affected
26.13% of the area fell in very medium low zone with 27.32% of the
total settlement to be affected
3.13.45% of the area fell in very low risk zone with 1.13% of the total
settlement to be affected
RIOTS/STAMPS HAZARD RISK
VULNERABILITY ASSESSMENT OF
GANGTOK
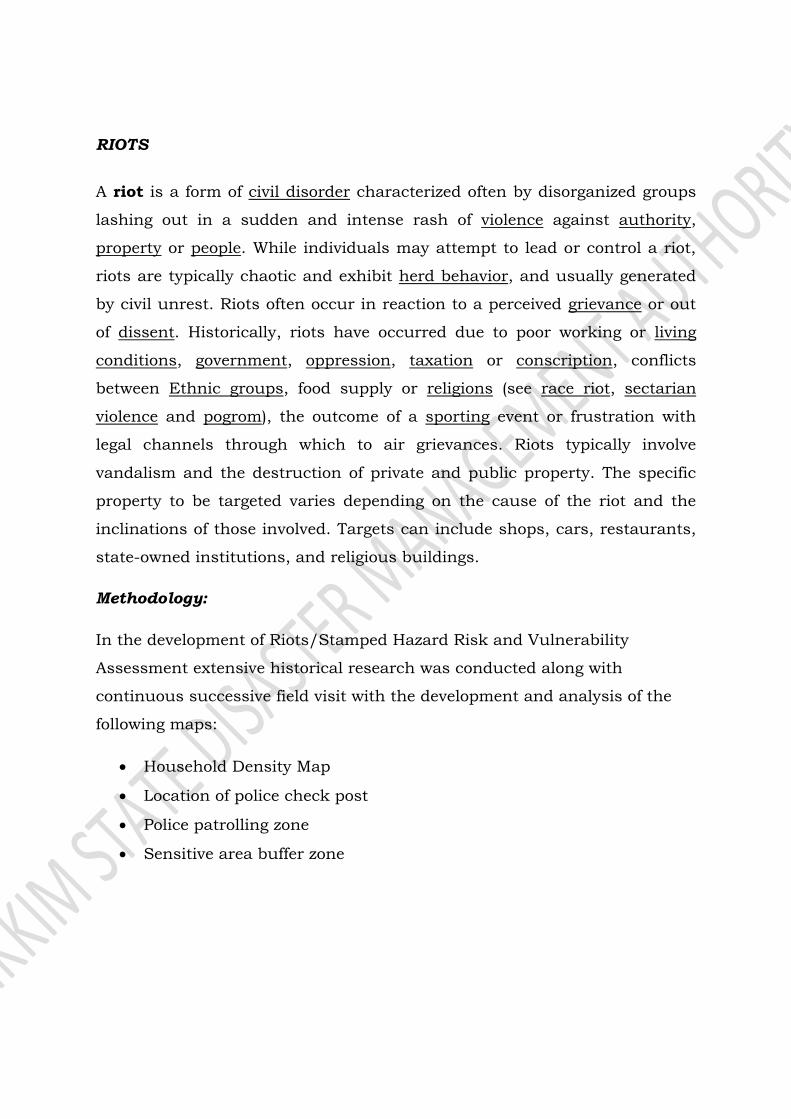
RIOTS
A riot is a form of civil disorder characterized often by disorganized groups
lashing out in a sudden and intense rash of violence against authority,
property or people. While individuals may attempt to lead or control a riot,
riots are typically chaotic and exhibit herd behavior, and usually generated
by civil unrest. Riots often occur in reaction to a perceived grievance or out
of dissent. Historically, riots have occurred due to poor working or living
conditions, government, oppression, taxation or conscription, conflicts
between Ethnic groups, food supply or religions (see race riot, sectarian
violence and pogrom), the outcome of a sporting event or frustration with
legal channels through which to air grievances. Riots typically involve
vandalism and the destruction of private and public property. The specific
property to be targeted varies depending on the cause of the riot and the
inclinations of those involved. Targets can include shops, cars, restaurants,
state-owned institutions, and religious buildings.
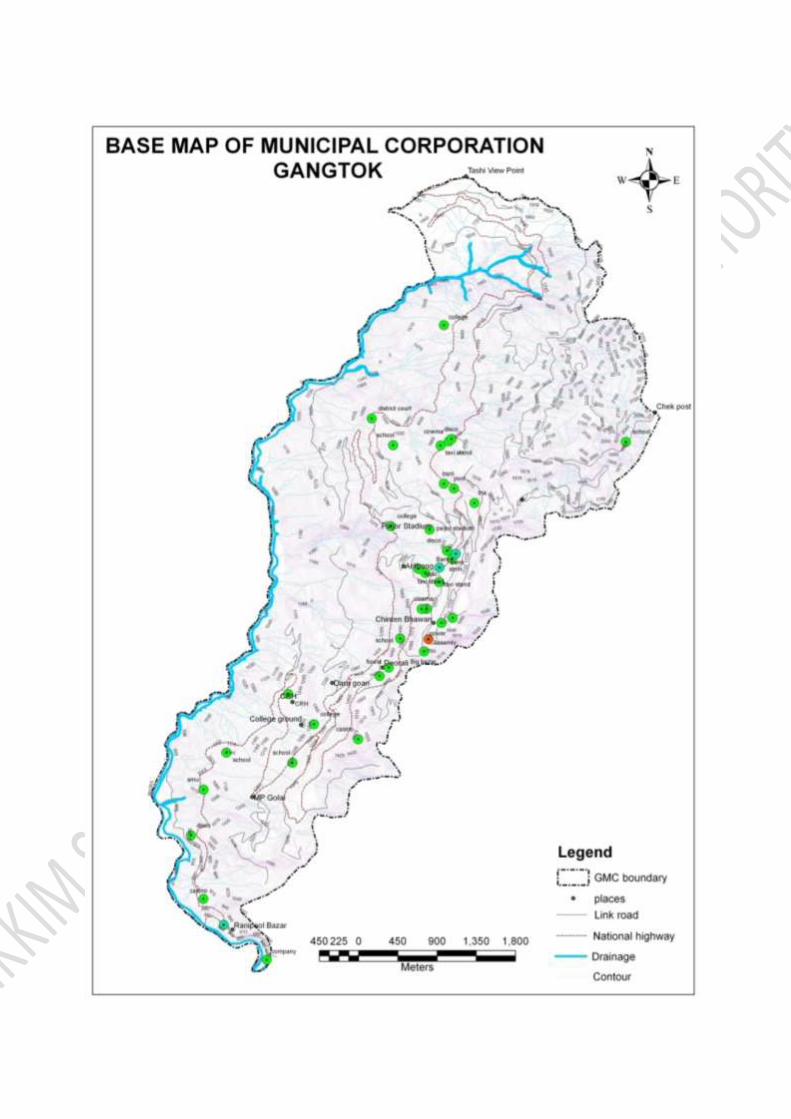
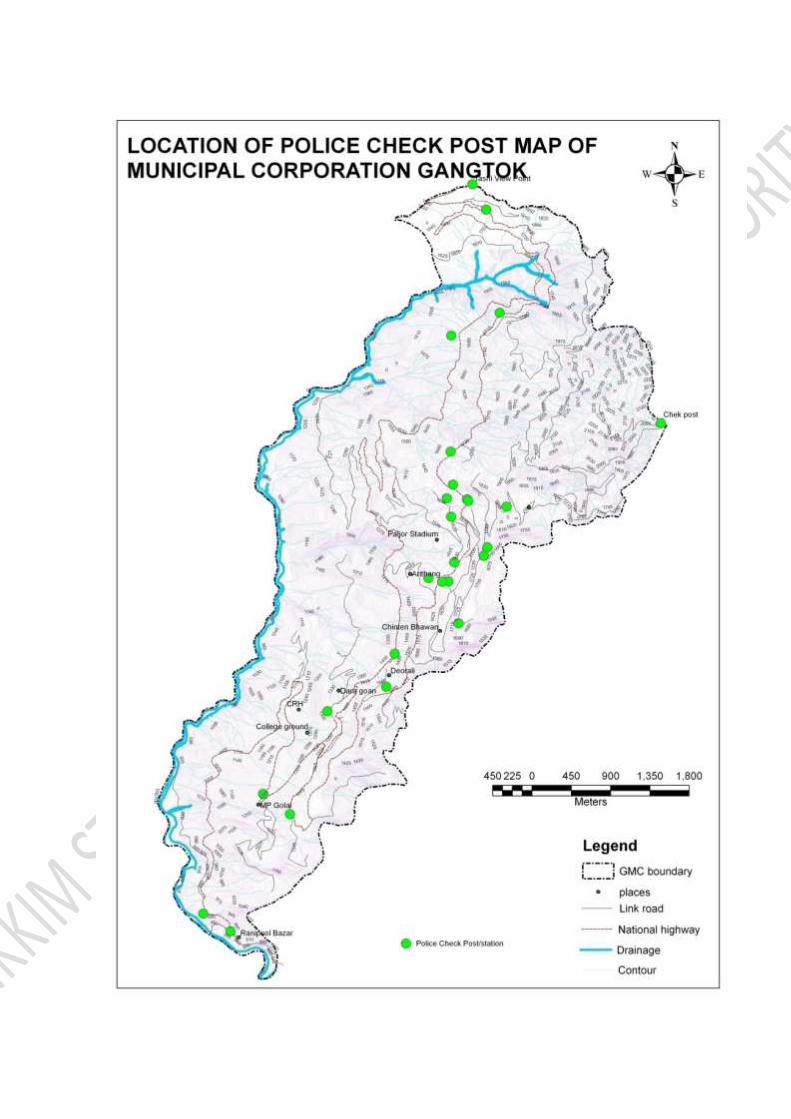
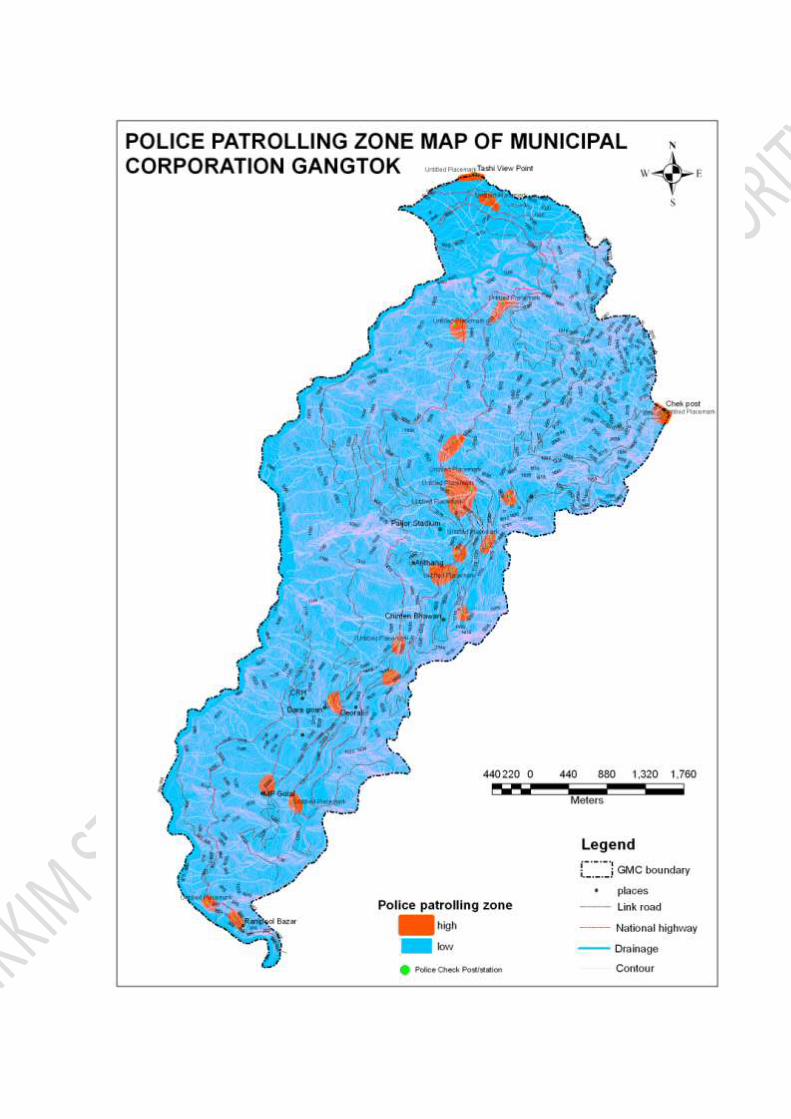
Methodology:
In the development of Riots/Stamped Hazard Risk and Vulnerability
Assessment extensive historical research was conducted along with
continuous successive field visit with the development and analysis of the
following maps:
Household Density Map
Location of police check post
Police patrolling zone
Sensitive area buffer zone

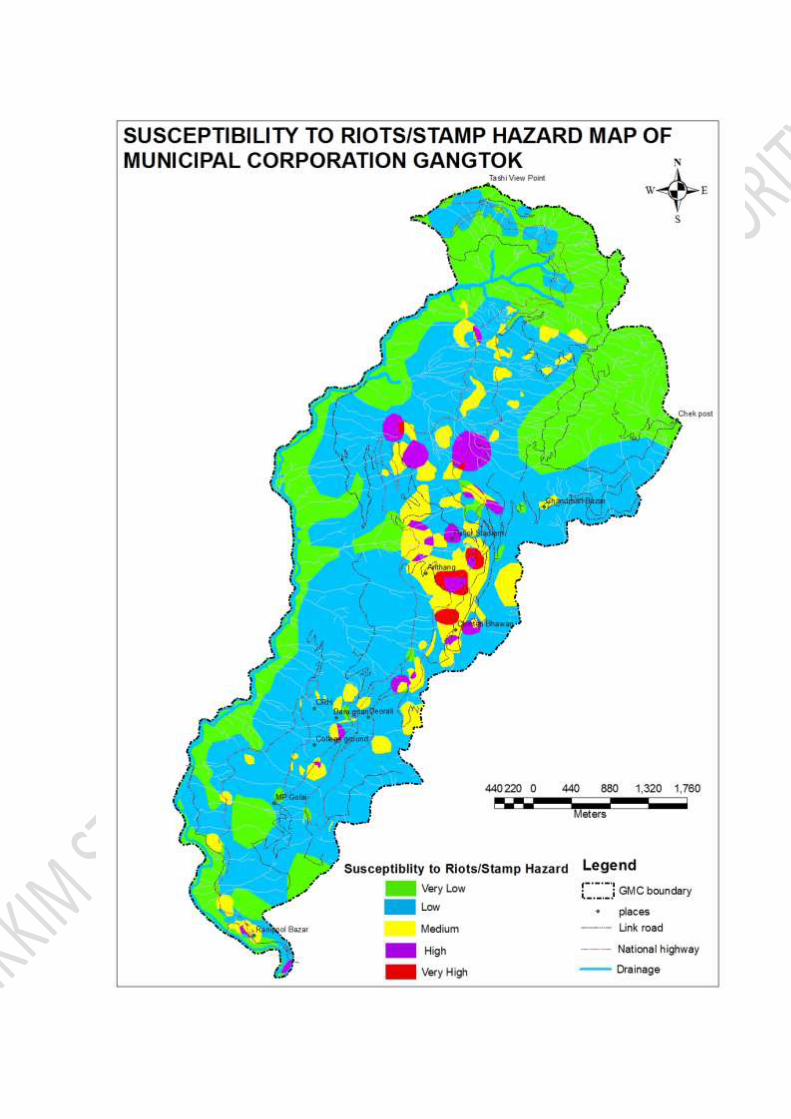
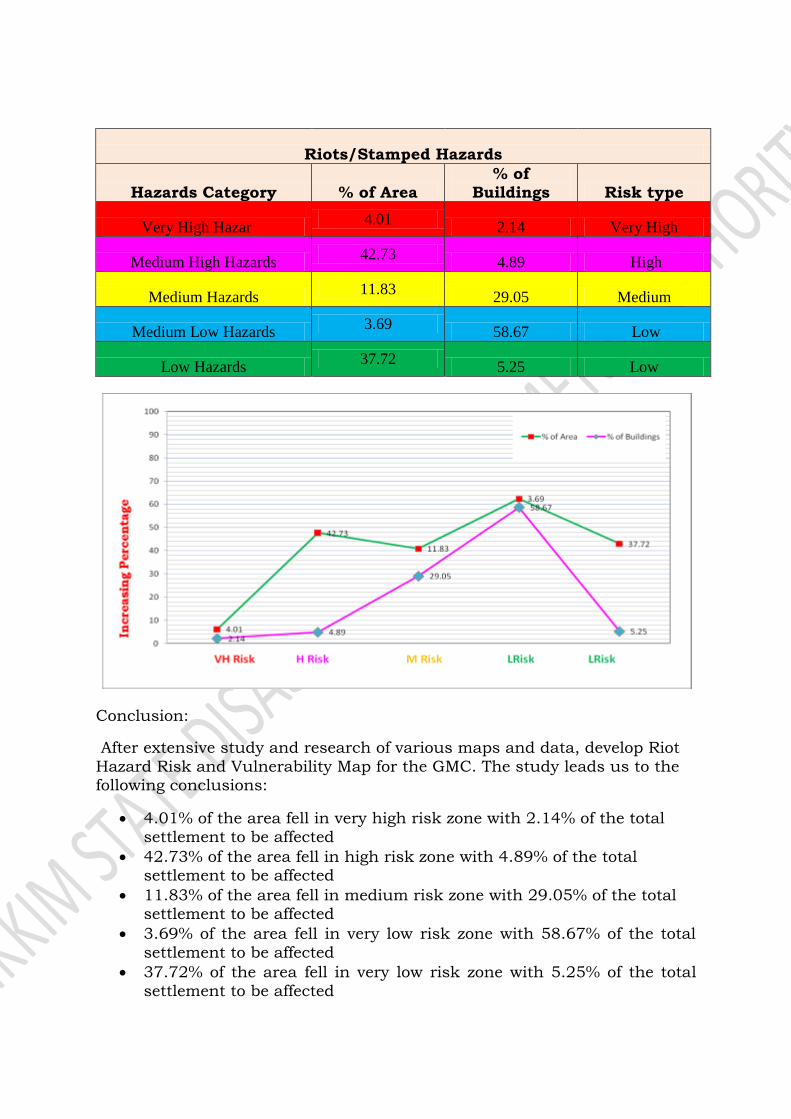
Riots/Stamped Hazards
Hazards Category % of Area % of
Buildings Risk type
Very High Hazards 4.01
2.14 Very High
Medium High Hazards 42.73
4.89 High
Medium Hazards 11.83
29.05 Medium
Medium Low Hazards 3.69
58.67 Low
Low Hazards 37.72
5.25 Low
Conclusion:
After extensive study and research of various maps and data, develop Riot
Hazard Risk and Vulnerability Map for the GMC. The study leads us to the following conclusions:
4.01% of the area fell in very high risk zone with 2.14% of the total settlement to be affected
42.73% of the area fell in high risk zone with 4.89% of the total settlement to be affected
11.83% of the area fell in medium risk zone with 29.05% of the total settlement to be affected
3.69% of the area fell in very low risk zone with 58.67% of the total
settlement to be affected
37.72% of the area fell in very low risk zone with 5.25% of the total
settlement to be affected
FLASHFLOOD HAZARD RISK
VULNERABILITY ASSESSMENT OF
GANGTOK
Flash Flood
Flash floods are dangerously fast moving floods caused by a large amount of
heavy rain in a localized area. This torrential downpour may transform a
normally calm area into a powerful river of death in only a few short
minutes. Many people are caught unprepared for the power and speed of a
flash flood, which results in dangerous situations. Flash floods are slightly
different from normal floods. Normal floods involve water rising and
overflowing from its normal path. However, flash floods appear quickly and
move swiftly across land with little warning. Flash floods occur for a variety
of reasons including concentrated rainfall during a slow moving
thunderstorm, hurricanes, and tropical storms.
The most devastating flash floods are from dam and levee failures. When
either structure breaks, an enormous amount of water is suddenly
unleashed, destroying everything in its path.
The water in a flash flood moves at such a high velocity that it can move
boulders, uproot trees, demolish buildings, and destroy bridges. The walls of
water in such a flood and be anywhere from ten to twenty feet tall and
usually carry a substantial amount of debris.
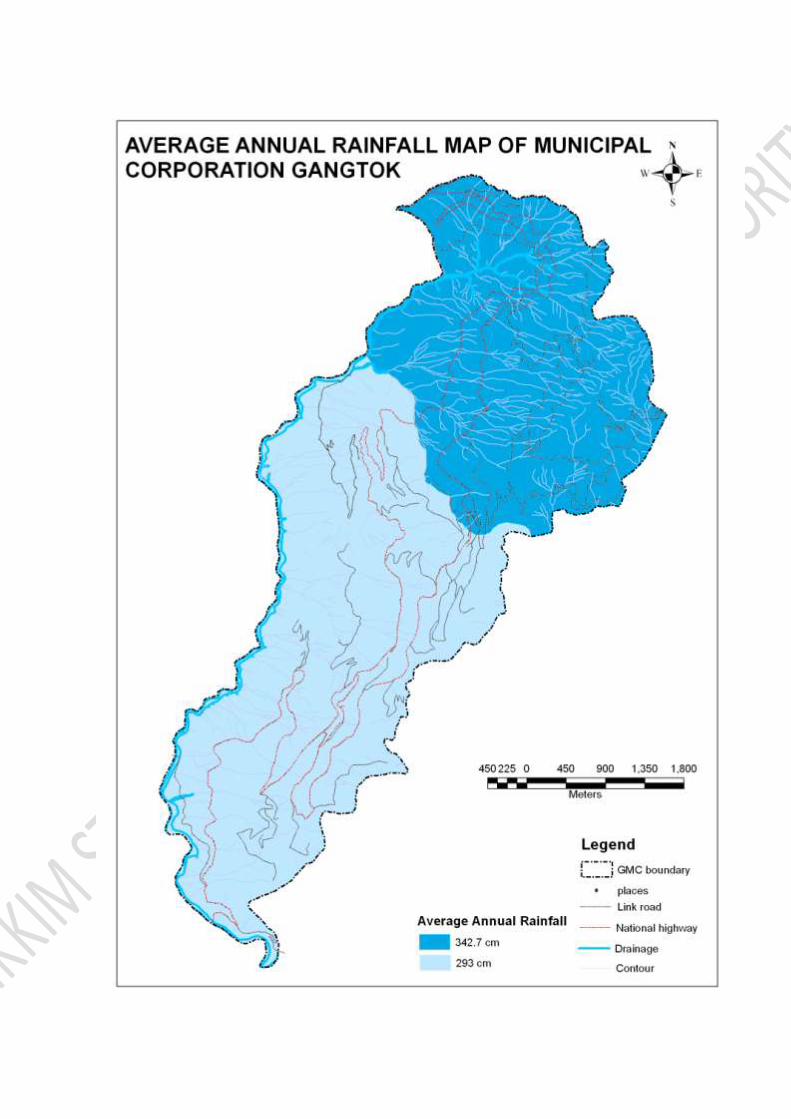
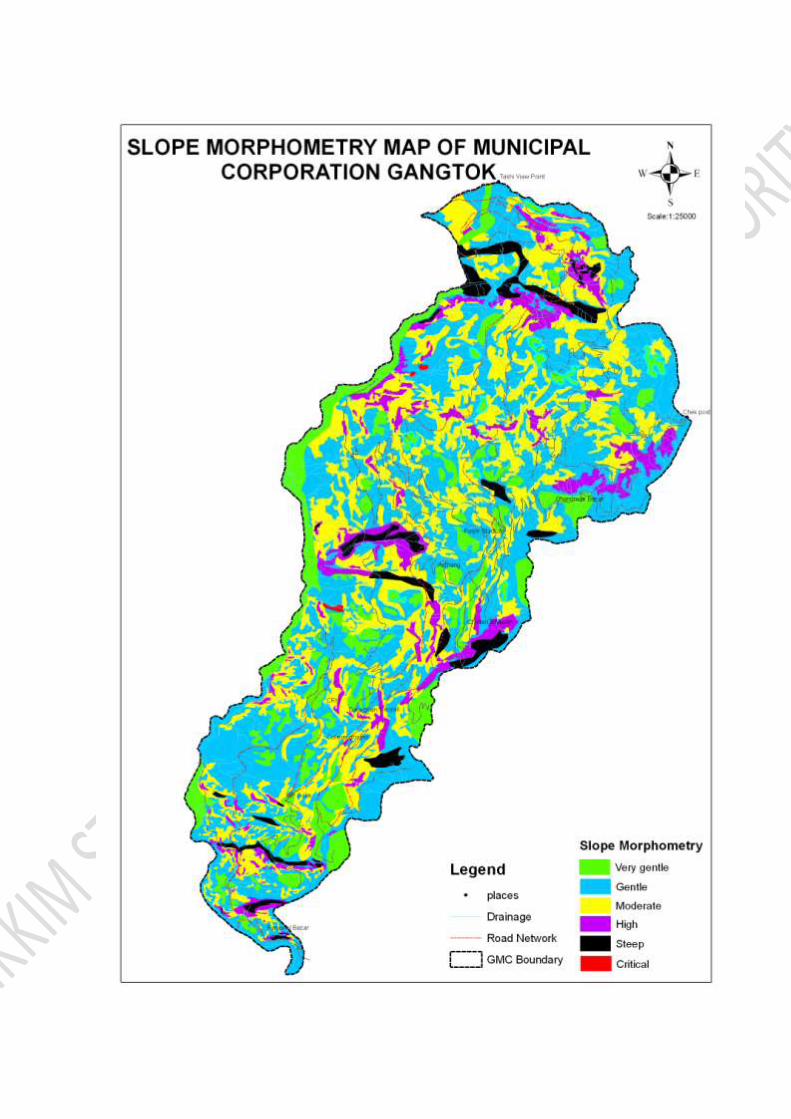
Methodology:
In the development of Flashflood Hazard Risk and Vulnerability Assessment
extensive historical research was conducted along with continuous
successive field visit with the development and analysis of the following
maps:
Drainage Map
Slope Analysis Map
Rainfall map


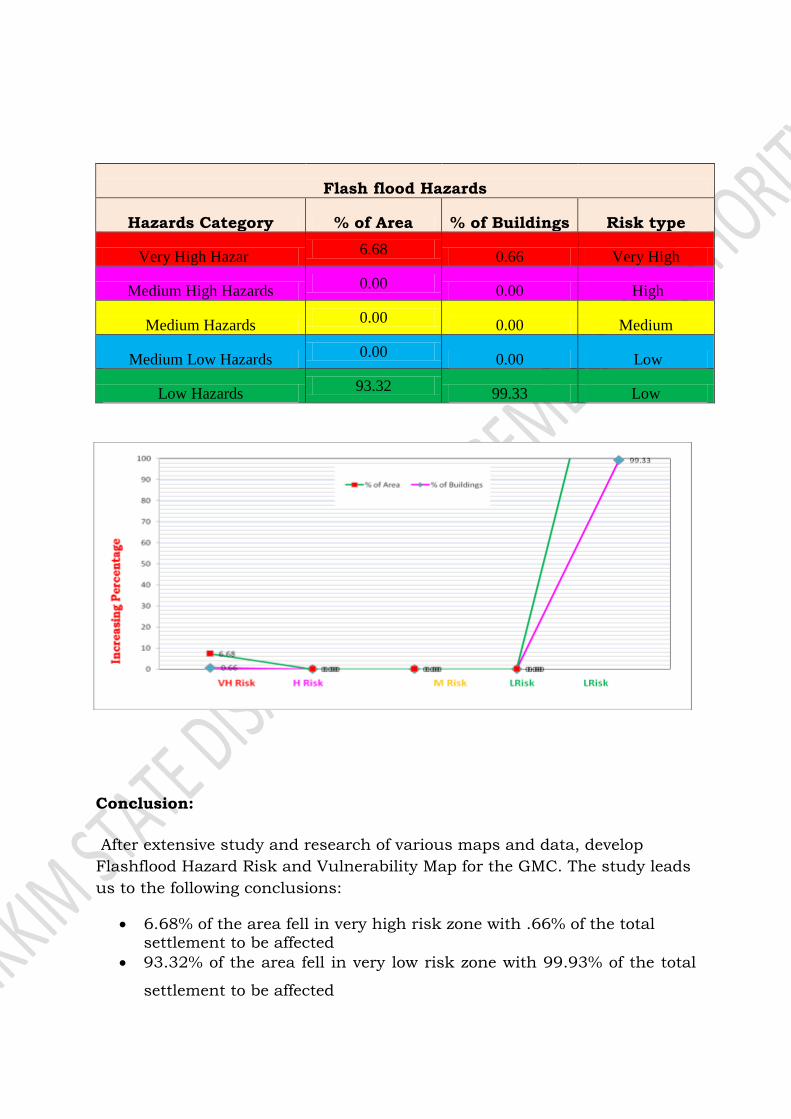
Flash flood Hazards
Hazards Category % of Area % of Buildings Risk type
Very High Hazards 6.68
0.66 Very High
Medium High Hazards 0.00
0.00 High
Medium Hazards 0.00
0.00 Medium
Medium Low Hazards 0.00
0.00 Low
Low Hazards 93.32
99.33 Low
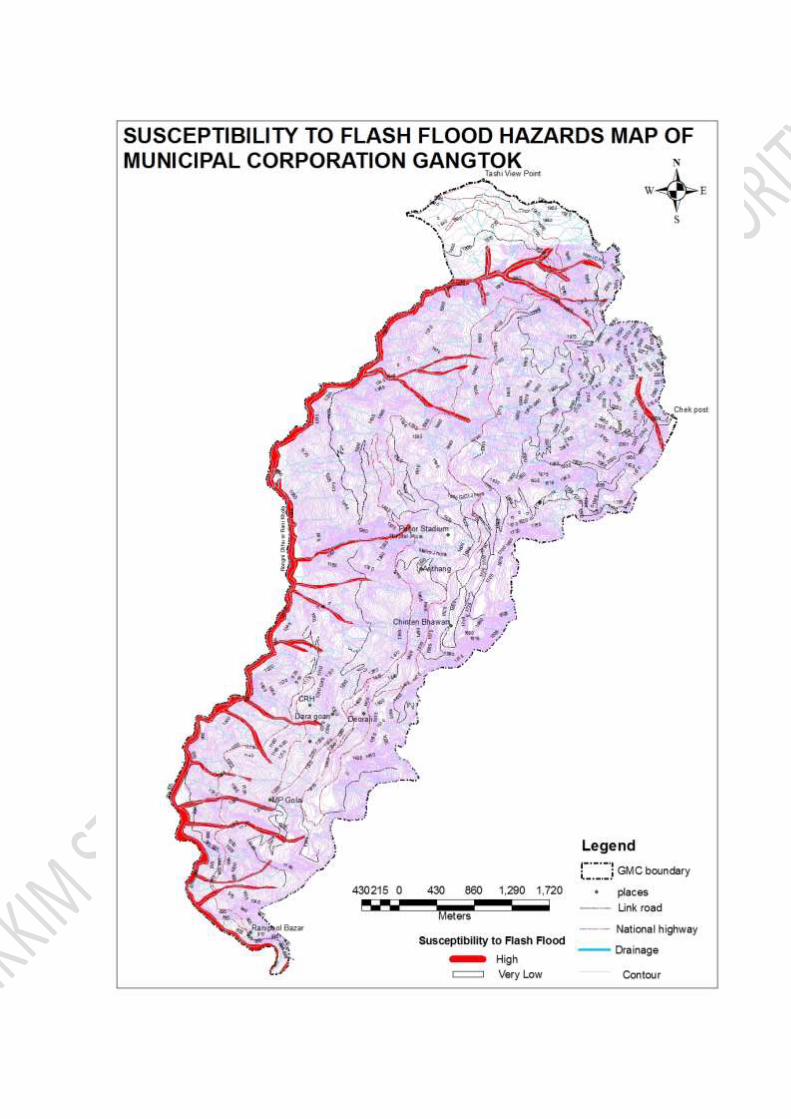
Conclusion:
After extensive study and research of various maps and data, develop
Flashflood Hazard Risk and Vulnerability Map for the GMC. The study leads
us to the following conclusions:
6.68% of the area fell in very high risk zone with .66% of the total settlement to be affected
93.32% of the area fell in very low risk zone with 99.93% of the total
settlement to be affected
HAIL-STONE HAZARD RISK VULNERABILITY
ASSESSMENT OF GANGTOK
MULTI-HAZARDS RISK VULNERABILITY
ASSESSMENT OF GANGTOK MUNICIPAL
CORPORATION
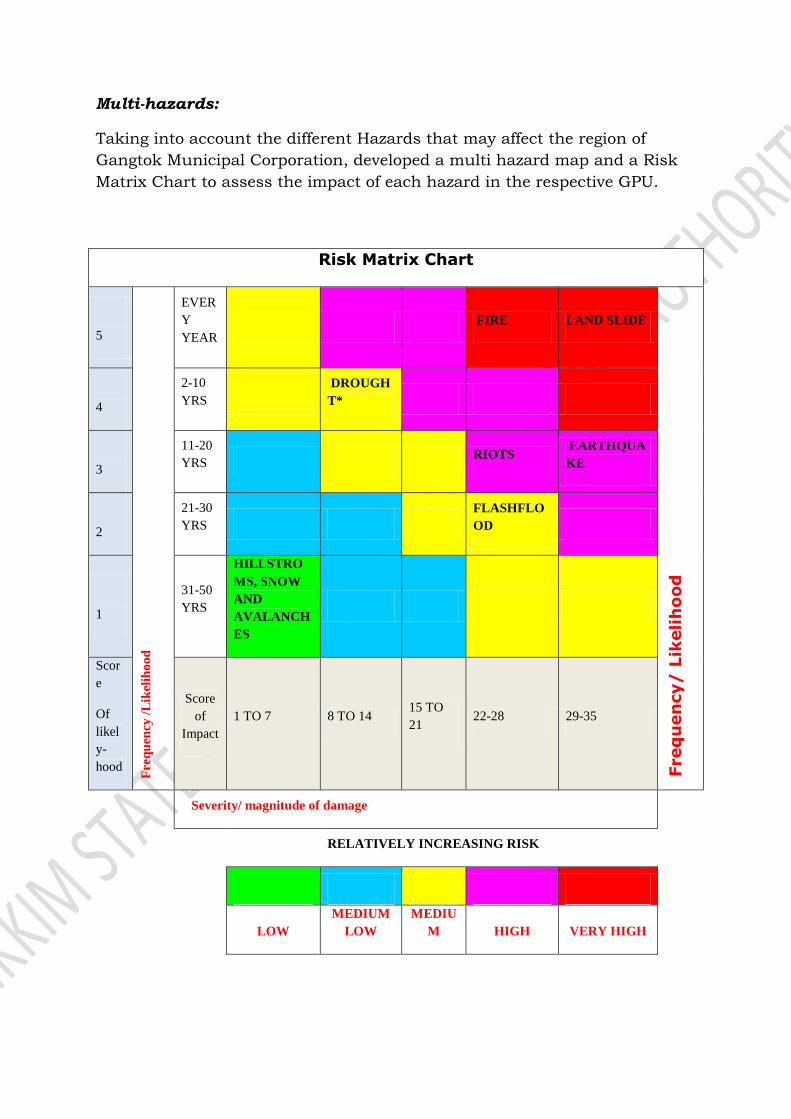
Multi-hazards:
Taking into account the different Hazards that may affect the region of
Gangtok Municipal Corporation, developed a multi hazard map and a Risk
Matrix Chart to assess the impact of each hazard in the respective GPU.
Risk Matrix Chart
5
Fre
qu
ency
/L
ikel
iho
od
EVER
Y
YEAR
FIRE LAND SLIDE
Freq
uen
cy/
Lik
eli
ho
od
4
2-10
YRS
DROUGH
T*
3
11-20
YRS RIOTS
EARTHQUA
KE
2
21-30
YRS
FLASHFLO
OD
1
31-50
YRS
HILLSTRO
MS, SNOW
AND
AVALANCH
ES
Scor
e
Of
likel
y-
hood
Score
of
Impact
1 TO 7 8 TO 14 15 TO
21 22-28 29-35
Severity/ magnitude of damage
RELATIVELY INCREASING RISK
LOW
MEDIUM
LOW
MEDIU
M HIGH VERY HIGH
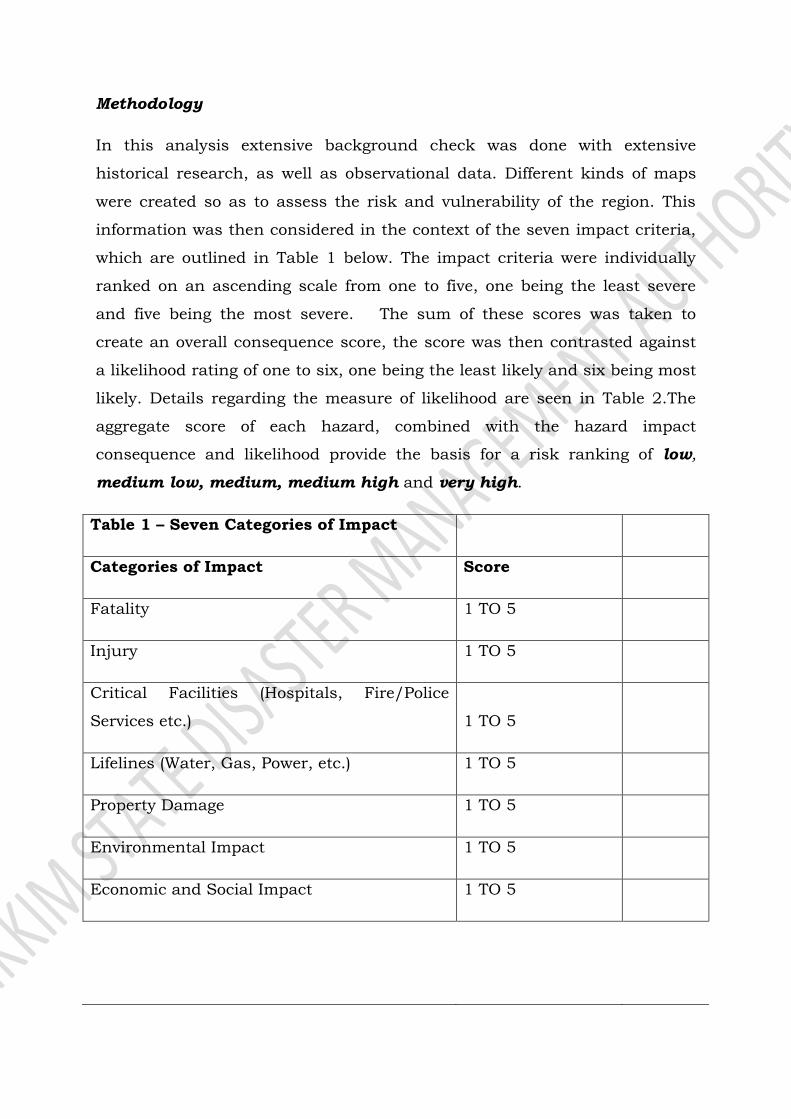
Methodology
In this analysis extensive background check was done with extensive
historical research, as well as observational data. Different kinds of maps
were created so as to assess the risk and vulnerability of the region. This
information was then considered in the context of the seven impact criteria,
which are outlined in Table 1 below. The impact criteria were individually
ranked on an ascending scale from one to five, one being the least severe
and five being the most severe. The sum of these scores was taken to
create an overall consequence score, the score was then contrasted against
a likelihood rating of one to six, one being the least likely and six being most
likely. Details regarding the measure of likelihood are seen in Table 2.The
aggregate score of each hazard, combined with the hazard impact
consequence and likelihood provide the basis for a risk ranking of low,
medium low, medium, medium high and very high.
Table 1 – Seven Categories of Impact
Categories of Impact Score
Fatality 1 TO 5
Injury 1 TO 5
Critical Facilities (Hospitals, Fire/Police
Services etc.) 1 TO 5
Lifelines (Water, Gas, Power, etc.) 1 TO 5
Property Damage 1 TO 5
Environmental Impact 1 TO 5
Economic and Social Impact 1 TO 5
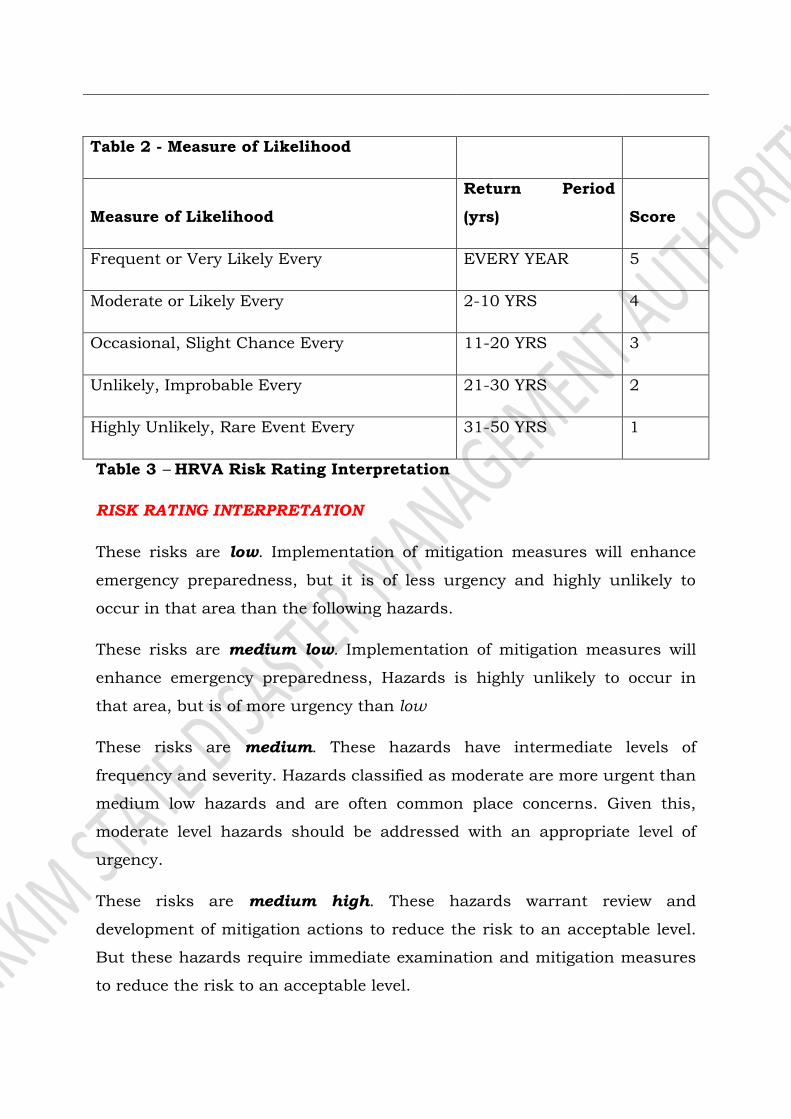
Table 2 - Measure of Likelihood
Measure of Likelihood
Return Period
(yrs) Score
Frequent or Very Likely Every EVERY YEAR 5
Moderate or Likely Every 2-10 YRS 4
Occasional, Slight Chance Every 11-20 YRS 3
Unlikely, Improbable Every 21-30 YRS 2
Highly Unlikely, Rare Event Every 31-50 YRS 1
Table 3 – HRVA Risk Rating Interpretation
RISK RATING INTERPRETATION
These risks are low. Implementation of mitigation measures will enhance
emergency preparedness, but it is of less urgency and highly unlikely to
occur in that area than the following hazards.
These risks are medium low. Implementation of mitigation measures will
enhance emergency preparedness, Hazards is highly unlikely to occur in
that area, but is of more urgency than low
These risks are medium. These hazards have intermediate levels of
frequency and severity. Hazards classified as moderate are more urgent than
medium low hazards and are often common place concerns. Given this,
moderate level hazards should be addressed with an appropriate level of
urgency.
These risks are medium high. These hazards warrant review and
development of mitigation actions to reduce the risk to an acceptable level.
But these hazards require immediate examination and mitigation measures
to reduce the risk to an acceptable level.
These risks are very high. These hazards are both frequent and are of high
severity. These hazards require immediate examination and mitigation
measures to reduce the risk to an acceptable level.


Multi- Hazards
Hazards Category % of Area % of Buildings Risk type
Very High Hazards 1.66
1.58 Very High
Medium High Hazards 22.68
19.26 High
Medium Hazards 54.57
53.55 Medium
Medium Low Hazards 19.99
24.13 Low
Low Hazards 1.08
1.48 Low

Conclusion and Recommendation
Multi-Hazard Risk Vulnerability Assessment (MHRVA) Gangtok town have
been layout in 1:25,000 scale (as base map of the area is prepared as
1:15,000 scale) in GIS platform. Various hazard components affecting the
risk of the town were taken into consideration. For a particular hazard,
various sub-components liable to increase the risk for the particular hazard
were taken into consideration. This way the stake holders could understand
the risk type creating the hazards which ultimately contribute to the
vulnerability of the area and try to carryout mitigation programmes which
can decrease the risk for the hazards types. Varieties of awareness
campaign can be carryout, right from educating the masses upto hazard
resilient construction of civil structures. For a developing town like Gangtok
the MHRVA needs to be carried out in small scale i.e in micro level with
scale of at least 1:5000 or in 1:2000.
Moreover, even with the present scale lot of understanding of the hazard
types and vulnerability of the town can be understood. A proper approach is
therefore necessary for taking up mitigation programme with the
understand as made by the preparation of this Multi-Hazard Risk
Vulnerability Assessment (MHRVA) of Gangtok.

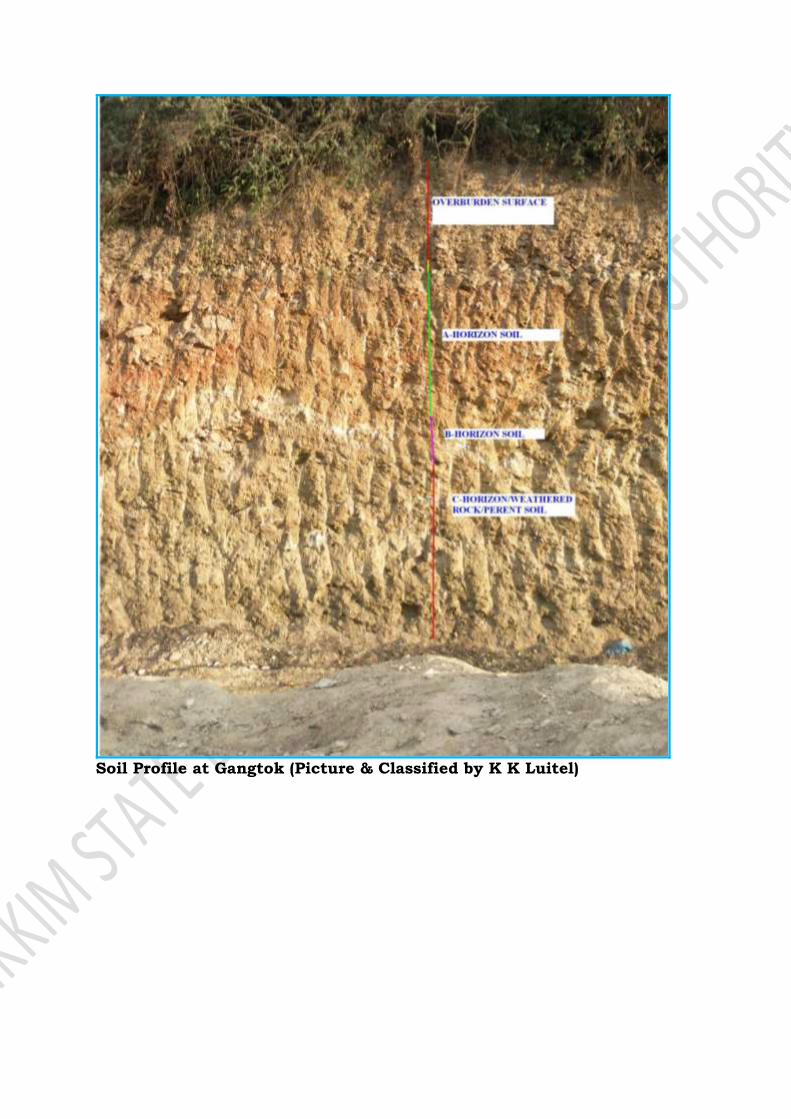
Soil Profile at Gangtok (Picture & Classified by K K Luitel)
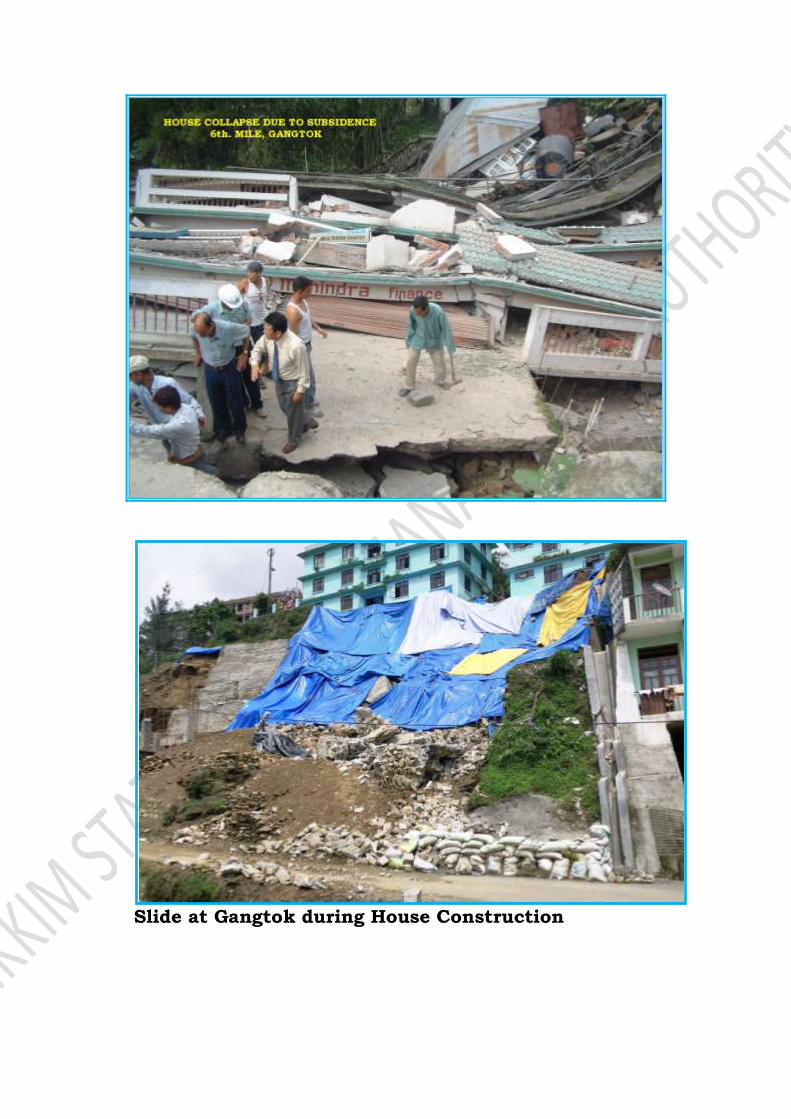
Slide at Gangtok during House Construction

Fig: Bagthang slide Gangtok, far view
Fig: Bagthang slide Gangtok, close view
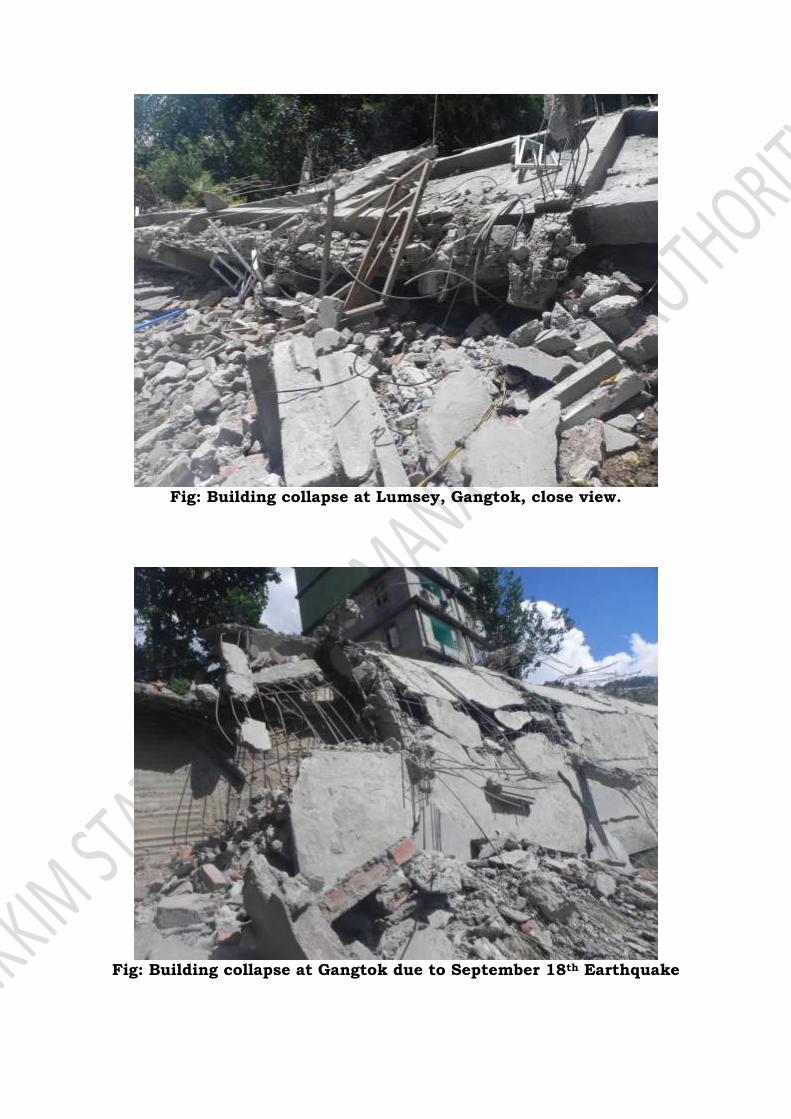
Fig: Building collapse at Lumsey, Gangtok, close view.
Fig: Building collapse at Gangtok due to September 18th Earthquake
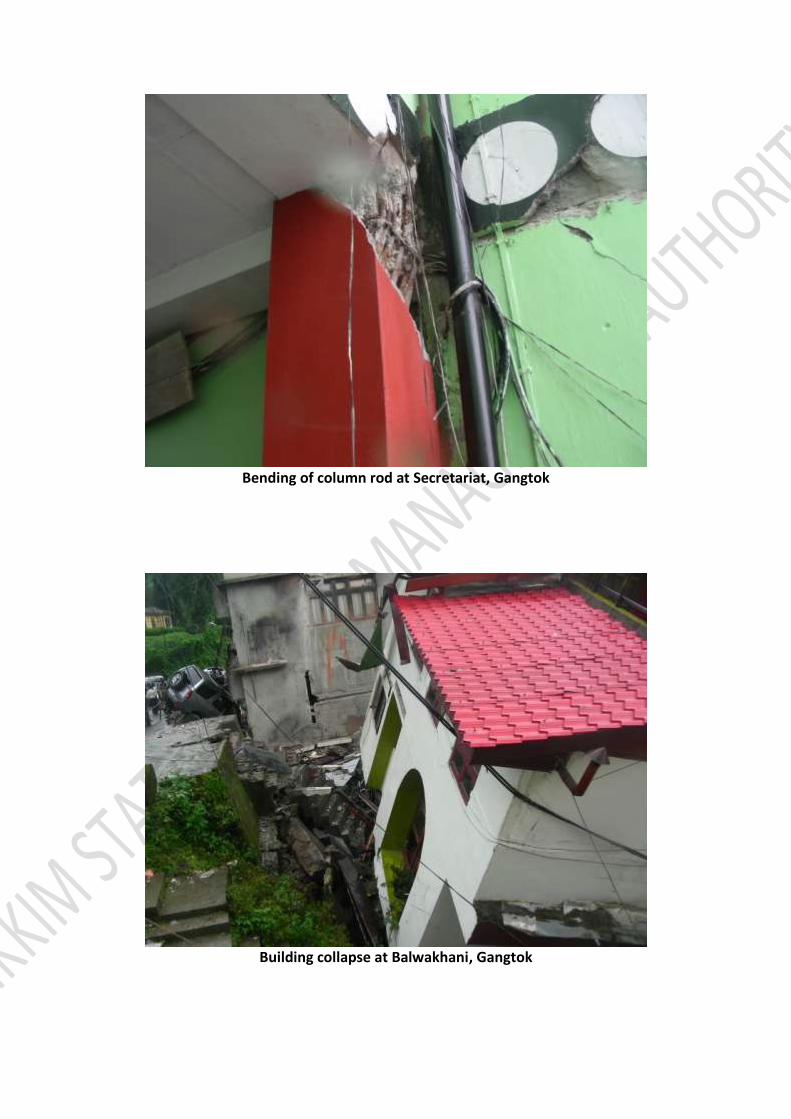
Bending of column rod at Secretariat, Gangtok
Building collapse at Balwakhani, Gangtok
References
Anbalagan R, Singh B, Chakraborty D & Kohli A, A Filed Manual For Landslide Investigation (DST, Govt. of India, New Delhi) 2007,
153p.
Anbalagan R, Landslide hazard evaluation and zonation mapping in mountainous terrain, Engineering Geology, 32 (1992), 269-
277.
BIS 14496, Preparation of Landslide hazard Zonation Maps Hills,
Kuamun Himalaya (Gyanodaya Prakashan, Nainital)
1988, 155p.
Reports from Mines, Minerals and Geology Government of
Sikkim.
Beedasyl, Jaishree and Whyatt, Duncan 1999, Diverting the
tourists, a spatial decision-support system for tourism planning
on a development island, JAG l volume l -issue3/4-1999
Brown, Arthur A., and Davis, Kenneth P., (1973). Forest Fire:
Control and Use, Mc Graw – Hill, New York.
Champion, H.G., and Seth, S.K., (1968) A revised survey of the
forest types of India. The Manager of Publications, New Delhi,
404 p.
Leblon, Brigitte, 2001. Forest Wildfire Hazard Monitoring Using
Remote Sensing: A Review. Remote Sensing Review, 2001, vol.20,
pp1-43 Burrough, P.A., 1987. Principles of geographical
information system for Land Resources Assessment, Clarendon,
Oxford Chuvieco.E. & Congalton, R.G. (1988).
Mapping and inventory of forest fires from digital processing of
TM data. Geocarto int.4:41-53. Chuvieco.E. & Congalton, R.G.
(1989).Remote Sensing Environ, 29:147-159.
Luitel., Kumar Keshar et.al.,report on forest fire mapping of
Sikkim using liss III satellite imagery of 2009, department of
science and technology 2009.
Nath.S.K. (2006); Seismic Hazard and Microzonation Atlas of the Sikkim Himalaya, published by Department of Science and Technology, Government of India, India
Aparicio, M.J. 1999. Dinamica de inundaciónes del Rio Colorado
e impacto en Turrialba, Costa Rica. Master thesis, Centro
Agronomico Tropical de Investigación y Enseñanza, Turrialba,
Costa Rica.
Cardona, M., Calzadilla, M., Sanchez, P., Barillas, M., Lira, E.,
Rodriguez, M., Molina, G., Deras, J., Rivera, J., Funes, J., Cruz,
E., Jarquin, I., Perez, C., Salgado, D., Barrantes, S., Climent, A.,
Ortega, M., & Rivera, L. (2000).
Estudio integral de amenazas naturales en la Cuenca del Rio
Turrialba, Canton de Turrialba, Republica de Costa Rica,
Centroamerica. Final assignment, International Institute for
Aerospace Survey and Earth Sciences, Enschede, The
Netherlands. In cooperation with UNESCO, TU Delft, Utrecht
University, CEPRED ENAC, University of Costa Rica, RAP-CA,
CBNDR
Cheyo, D.R. 2002. Landslide hazard, vulnerability and risk
assessment in Turrialba, Costa Rica. M.Sc Thesis, International
Institute for Geo-information science and Earth Observation
(ITC), The Netherlands.
World Meteorological Organization (WMO),1999, Comprehensive
Risk Assessment For Natural Hazards, Genewa: WMO/TD no
955, Switzerland.