Mu t a t i o n r a t e : ~1 0 - 6 n t - 1 c yc l e - 1 ( m...
11
Transcript of Mu t a t i o n r a t e : ~1 0 - 6 n t - 1 c yc l e - 1 ( m...


Translators: Wang Yui Wylan Wong1, Lin-Xing Chen 2,3
1 Institute of Molecular Biotechnology of the Austrian Academy of Sciences (IMBA), Vienna BioCenter (VBC), Dr. Bohrgasse 3, 1030 Vienna, Austria. 2 Department of Earth and Planetary Sciences, University of California, Berkeley, CA 94720, USA 3 Innovative Genomics Institute at UC Berkeley, Berkeley, CA 94720, USA Size & Content
尺寸及组成部分
Diameter: ≈100 nm
直径:≈ 100 纳米
Volume: ~106 nm3 = 10-3 fL
体积:~ 106 立方纳米 = 10-3 飞升
Mass: ~103 MDa ≈ 1fg
质量:~ 103 兆道尔顿 ≈ 1飞克
Membrane protein: ≈2000 copies (measured for SARS-CoV-1)
膜蛋白:≈ 2000 个拷贝(以 SARS-CoV-1 为样本测定)
Envelope: ≈20 copies (100 monomers, measured for TGEV coronavirus)
包膜:≈ 20 个拷贝 (100个单体,以猪传染性胃肠炎病毒为样本测定)
Nucleoprotein: ≈1000 copies (measured for SARS-CoV-1)
核蛋白:≈ 1000 个拷贝(以 SARS-CoV-1 为样本测定)
Spike trimer:
刺突:
Length: ≈10 nm
长度:≈ 10 纳米
Copies per virion: ≈100 (measured for SARS-CoV-1) (300 monomers)
每个病毒颗粒拷贝数:≈100(以 SARS-CoV-1 为样本测定)(即300个单体)
Affinity to ACE2 receptor Kd: ≈1-30 nM
与ACE2受体的亲和度 Kd: ≈ 1-30 纳摩尔
primed by TMPRSS2
编码基因:TMPRSS2
大小及組成
直径:≈ 100 奈米/納米
體積:~ 106 立方奈米(立方納米) = 10-3 毫微微升(飛升)
質量: ~103 百萬道爾頓 ≈ 1毫微微克(飛克)
膜蛋白: ≈2000 個 (此為測量SARS-CoV-1冠狀病毒的數據)
外套膜蛋白: ≈20 個 (100 個蛋白單體, 此為測量TGEV冠狀病毒的數據)
核蛋白: ≈1000 個 (此為測量SARS-CoV-1冠狀病毒的數據)
刺突(棘蛋白)三聚體:
長度: ≈10 奈米(納米)
單位病毒顆粒所含數目: ≈100 (此為測量SARS-CoV-1冠狀病毒的數據) (即300 個蛋白單體)
與ACE2受體結合的親和力 Kd: ≈1-30 奈米莫耳濃度(納米摩耳濃度)
由宿主的跨膜絲胺酸蛋白酶2 (TMPRSS2)所活化
Genome
基因组
Genome length: ≈30kb
基因组长度:≈ 3万个碱基
Number of genes: 10-14
基因数目:10-14
Number of proteins: 24-27
蛋白数目:24-27
Evolution rate: ~10-3 nt-1 yr-1 (measured for SARS-CoV-1)
进化速率:~10-3/碱基/年(以 SARS-CoV-1 为样本测定)

Mutation rate: ~10-6 nt-1 cycle-1 (measured for MHV coronavirus)
突变速率:~10-6/碱基/复制周期(以 SARS-CoV-1 为样本测定)
Nucleotide identity to SARS-CoV-2: bat CoV - 96%; pangolin CoV 91%; SARS-CoV-1 80%; MERS 55%; common cold CoV 50%
SARS-CoV-2与其他相关病毒的核酸相似度:蝙蝠冠状病毒 - 96%; 穿山甲冠状病毒 - 91%;SARS-CoV-1 - 80%;中东呼吸综合征病毒 - 55%; 普通流感病毒 -
50%。
[Taiwanese]基因組
基因組長度: ≈30千鹼基對
基因數目: 10-14
蛋白數目: 24-27
演化速率: ~10-3 /鹼基/年 (此為測量SARS-CoV-1冠狀病毒的數據)
突變率: ~10-6 /鹼基/複製週期 (此為測量MHV冠狀病毒的數據)
其他冠狀病毒的核酸序列與SARS-CoV-2一樣的程度: 蝙蝠冠狀病毒- 96%; 穿山甲冠狀病毒- 91%; SARS-CoV-1冠狀病毒- 80%; MERS冠狀病毒- 55%; 普通感冒病毒-
50%
Replication Timescales
病毒复制
In tissue-culture
组织培养环境
Virion entry into cell: ~10 min (measured for SARS-CoV-1)
病毒侵入细胞时间:~10分钟
Eclipse period: ~10 hours
隐蔽期:~10小时
Burst size: ~1000 virions (measured for MHV coronavirus)
裂解量:~1000病毒颗粒(以小鼠肝炎病毒为样本测定)
[Taiwanese]複製時程及複製量
在組織培養的環境下
病毒進入細胞所需的時間: ~10分鐘 (此為測量SARS-CoV-1冠狀病毒的數據)
隱蝕期: ~10 小時
病毒釋出數量: ~1000 病毒顆粒 (此為測量MHV冠狀病毒的數據)
Host Cells
宿主细胞
(tentative list; number of cells per person)
(暂定条目;单位:每个人的细胞数目)
Type I and Type II pneumocyte: ~1011 cells
I型和II型肺细胞:~1011个
Alveolar macrophage: ~1010 cells
肺泡巨噬细胞:~1010个
Mucous cells in nasal cavity: ~109 cells
鼻腔粘液细胞:~109个
Host cell volume: ~103 µm3 = 103 fL
宿主细胞体积:约103立方微米 = 103飞升
[Taiwanese]宿主細胞
(下列清單僅依據截至目前的研究所擬定,顯示每個人體體內該細胞的數目 )
第一型及第二型肺泡壁細胞: ~1011 個
肺泡巨噬細胞: ~1010 個
鼻腔黏膜細胞: ~109個
宿主細胞體積: ~103 立方微米= 103 毫微微升(飛升)
Concentration
病毒浓度
maximal observed values following diagnosis

临床诊断的最大观测值
Nasopharynx: 106-109 RNAs/swab
鼻腔:106-109 RNAs/拭子
Throat: 104-108 RNAs/swab
咽喉:104-108 RNAs/拭子
Stool: 104-108 RNAs/g
粪便:104-108 RNAs/克
Sputum: 106-1011 RNAs/mL
唾液:106-1011RNAs/毫升
RNA counts can markedly overestimate infectious virions
注:RNA计数会明显高估感染性病毒粒子的数据
[Taiwanese]病毒濃度
下列為病患確診後所檢測到的最大值
鼻咽: 106-109 RNAs/採檢拭子
咽喉: 104-108 RNAs/採檢拭子
糞便: 104-108 RNAs/克
痰: 106-1011 RNAs/毫升
注:利用RNA數量很可能高估具感染力的病毒顆粒數目
Antibody Response - Seroconversion
抗体响应 - 血清转化
Antibodies appear in blood after: ≈10-20 days
抗体在血液中的出现时间:≈10-20天
Maintenance of antibody response: ≈2-3 years (measured for SARS-CoV-1)
抗体在体内的持续时间:≈2-3年(以 SARS-CoV-1 为样本测定)
[Taiwanese]抗體免疫反應 - 血清轉換
抗體在血液中開始的出現時間: ≈10-20天
抗體存在於人體內的時間: ≈2-3 年(此為測量SARS-CoV-1冠狀病毒的數據)
Virus Environmental Stability
病毒在环境中的稳定性
Relevance to personal safety unclear
对人的安全系数未知
half-life time to decay 1000-fold
半衰期 千倍衰变时间
Aerosols: ≈1 hr ≈4-24 hr
气溶胶: 约1小时 约4-24小时
氣溶膠: ≈1 hr
Surfaces: ≈1-7 hr ≈4-96 hr
E.g. plastic,
cardboard
And metals
物体表面(如塑料,硬纸板,金属等):约1-7小时 约4-96小时
Based on quantifying infectious virions. Tested at 21-23°C
and 40-65% relative humidity. Numbers will vary between
conditions and surface types (ref).
Viral RNA observed on surfaces even after a few weeks (ref)
数据基于对具有感染性病毒颗粒的量化,在21-23摄氏度和40-65%空气湿度条件下测定。相关数据随环境条件和物体表明的类型而异(Otter et al., 2016)。病
毒RNA甚至在数周后都可以在物体表面被检测到(Moriarty et a., 2010)。
[Taiwanese]病毒在環境中的穩定性
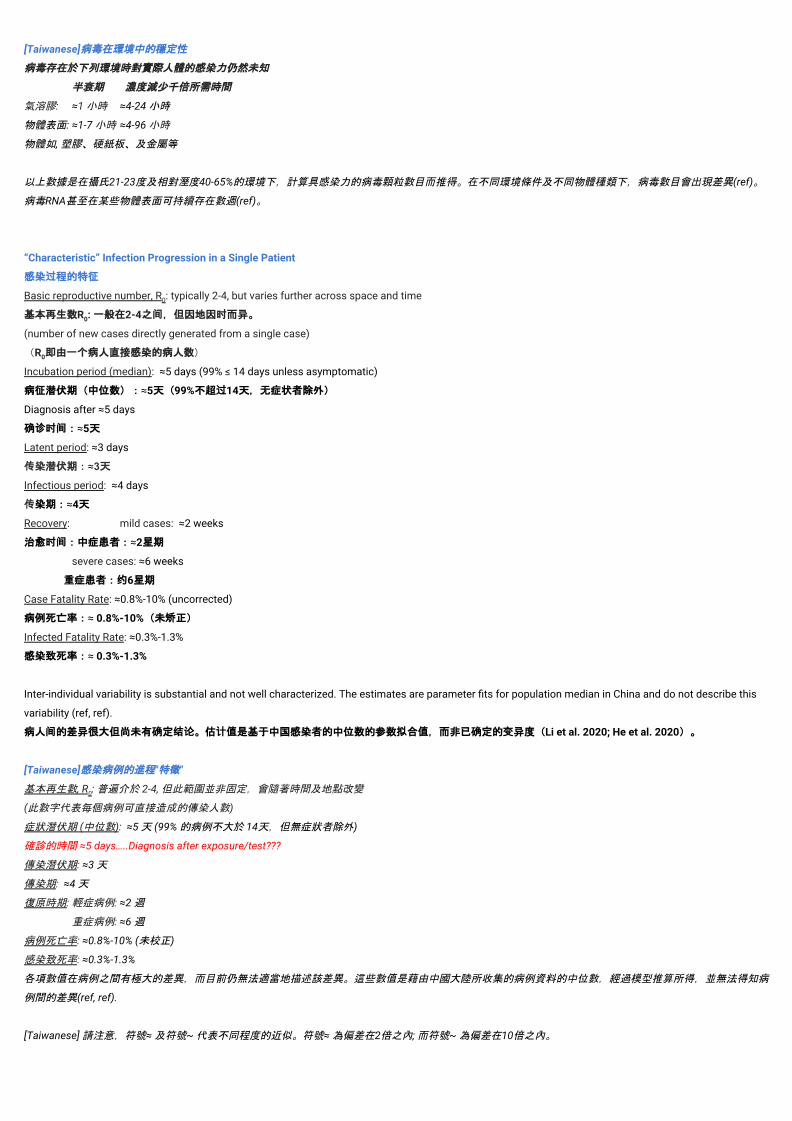
病毒存在於下列環境時對實際人體的感染力仍然未知
半衰期 濃度減少千倍所需時間
氣溶膠: ≈1 小時 ≈4-24 小時
物體表面: ≈1-7 小時 ≈4-96 小時
物體如, 塑膠、硬紙板、及金屬等
以上數據是在攝氏21-23度及相對溼度40-65%的環境下,計算具感染力的病毒顆粒數目而推得。在不同環境條件及不同物體種類下,病毒數目會出現差異(ref)。
病毒RNA甚至在某些物體表面可持續存在數週(ref)。
“Characteristic” Infection Progression in a Single Patient
感染过程的特征
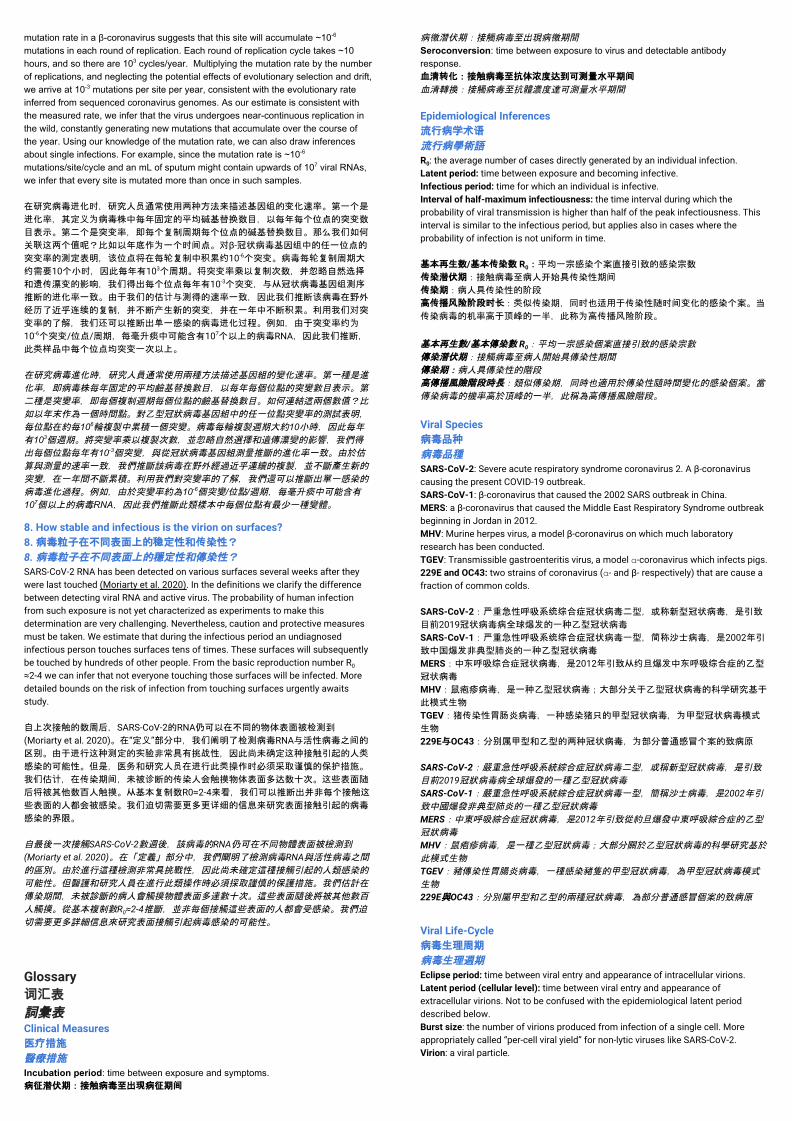
Basic reproductive number, R0: typically 2-4, but varies further across space and time
基本再生数R0: 一般在2-4之间,但因地因时而异。
(number of new cases directly generated from a single case)
(R0即由一个病人直接感染的病人数)
Incubation period (median): ≈5 days (99% ≤ 14 days unless asymptomatic)
病征潜伏期(中位数):≈5天(99%不超过14天,无症状者除外)
Diagnosis after ≈5 days
确诊时间:≈5天
Latent period: ≈3 days
传染潜伏期:≈3天
Infectious period: ≈4 days
传染期:≈4天
Recovery: mild cases: ≈2 weeks
治愈时间:中症患者:≈2星期
severe cases: ≈6 weeks
重症患者:约6星期
Case Fatality Rate: ≈0.8%-10% (uncorrected)
病例死亡率:≈ 0.8%-10%(未矫正)
Infected Fatality Rate: ≈0.3%-1.3%
感染致死率:≈ 0.3%-1.3%
Inter-individual variability is substantial and not well characterized. The estimates are parameter fits for population median in China and do not describe this
variability (ref, ref).
病人间的差异很大但尚未有确定结论。估计值是基于中国感染者的中位数的参数拟合值,而非已确定的变异度(Li et al. 2020; He et al. 2020)。
[Taiwanese]感染病例的進程"特徵"
基本再生數, R0: 普遍介於 2-4, 但此範圍並非固定,會隨著時間及地點改變
(此數字代表每個病例可直接造成的傳染人數)
症狀潛伏期 (中位數): ≈5 天 (99% 的病例不大於 14天,但無症狀者除外)
確診的時間 ≈5 days…..Diagnosis after exposure/test???
傳染潛伏期: ≈3 天
傳染期: ≈4 天
復原時期: 輕症病例: ≈2 週
重症病例: ≈6 週
病例死亡率: ≈0.8%-10% (未校正)
感染致死率: ≈0.3%-1.3%
各項數值在病例之間有極大的差異,而目前仍無法適當地描述該差異。這些數值是藉由中國大陸所收集的病例資料的中位數,經過模型推算所得,並無法得知病
例間的差異(ref, ref).
[Taiwanese] 請注意,符號≈ 及符號~ 代表不同程度的近似。符號≈ 為偏差在2倍之內; 而符號~ 為偏差在10倍之內。

Abstract 摘要 摘要 The current SARS-CoV-2 pandemic is a harsh reminder of the fact that, whether in a single human host or a wave of infection across continents, viral dynamics is often a story about the numbers. In this snapshot, our aim is to provide a one-stop, curated graphical source for the key numbers that help us understand the virus driving our current global crisis. The discussion is framed around two broad themes: 1) the biology of the virus itself and 2) the characteristics of the infection of a single human host. Our one-page summary provides the key numbers pertaining to SARS-CoV-2, based mostly on peer-reviewed literature. The numbers reported in summary format are substantiated by the annotated references below. Readers are urged to remember that much uncertainty remains and knowledge of this pandemic and the virus driving it is rapidly evolving. In the paragraphs below we provide “back of the envelope” calculations that exemplify the insights that can be gained from knowing some key numbers and using quantitative logic. These calculations serve to improve our intuition through sanity checks, but do not replace detailed epidemiological analysis. 目前在全世界流行的SARS-CoV-2警醒我们,无论是个体感染还是跨越洲际的大范围感染,我们必须利用数据了解病毒流动性。在这个简介中,我们拟通过一站式图表展示相关数据来帮助大家认识这一全球性的流行病。讨论部分主要包括两个主题:1) 病毒自身的生物学特征,和 2)单一感染病例的特征。我们的一页小结总结了来自通行评审论文中的与SARS-CoV-2有关的关键数据(详见下文)。请读者注意,关于SARS-CoV-2尚有诸多不确定的因素,并且我们对它的认识正与日俱增。接下来,我们通过粗略计算和举例说明了通过一些关键数据和定量逻辑获得的见解。这些计算可以加深我们对SARS-CoV-2的认识,但不能代替详细的流行病学分析。 目前在全世界流行的SARS-CoV-2警醒我們,無論是個體感染還是跨越洲際的大範圍感染,我們必須利用數據了解病毒流動性。在這個簡介中,我們擬通過一站式圖表展示相關數據來幫助大家認識這一全球性的流行病。討論部分主要包括兩個主題:1) 病毒自身的生物學特徵,和 2)單一感染病例的特徵。我們的一頁小結總結了來自通行評審論文中的與SARS-CoV-2有關的關鍵數據(詳見下文)。請讀者註意,關於SARS-CoV-2尚有諸多不確定的因素,並且我們對它的認識正與日俱增。接下來,我們通過粗略計算和舉例說明了通過一些關鍵數據和定量邏輯獲得的見解。這些計算可以加深我們對SARS-CoV-2的認識,但不能代替詳細的流行病學分析。 摘要[Taiwanese] SARS-CoV-2全球大流行就像一記響鐘,重重地敲在人們心上,提醒人們,無論是單一病人體內或是擴及世界各大陸的感染歷程,這些事件常常可用測量病毒本身的數據來解釋。我們收集及檢驗SARS-CoV-2的研究,將研究所得的各項關鍵數據圖像化,力求簡單清楚,幫助大家了解現在這個造成我們恐慌的敵人。討論主要包含兩大議題:一是病毒本身的生物特徵,二是病毒感染人類的過程。而大部分的關鍵數據係來自經由相關領域科學家審查過的研究文獻,文獻出處也隨文附上,方便查閱。讀者務必認知到,關於這次的全球大流行及此致
病病毒,現今的知識都會因未來研究而有所修正,許多不確定性仍然存在。我們會利用目前已知的數據,經由定量化的分析邏極,粗略計算,來呈現許多重要的觀念。我們展現的數
據計算就像是簡單的檢驗,希望加深大家的認知,而不是要用來替代任何流行病學的分析。 1. How long does it take a single infected person to yield one million infected people? 1. 从一个到一百万个感染患者需要多长时间? 1. 從一個到一百萬個感染患者需要多長時間? If everybody continued to behave as usual, how long would it take the pandemic to spread from one person to a million infected victims? The basic reproduction number, R0, suggests each infection directly generates 2-4 more infections in the absence of countermeasures like social distancing. Once a person is infected, it takes a period of time known as the latent period before they are able to transmit the virus. The current best-estimate of the median latent time is ≈3 days followed by ≈4 days of close to maximal infectiousness (Li et al. 2020, He et al. 2020). The exact durations vary among people, and some are infectious for much longer. Using R0≈4, the number of cases will quadruple every ≈7 days or double every ≈3 days. 1000-fold growth (going from one case to 103) requires 10 doublings since 210 ≈ 103; 3 days × 10 doublings = 30 days, or about one month. So we expect ≈1000x growth in one month, million-fold (106) in two months, and a billion fold (109) in three months. Even though this calculation is highly simplified, ignoring the effects of “super-spreaders”, herd-immunity and incomplete testing, it emphasizes the fact that viruses can spread at a bewildering pace when no countermeasures are taken. This illustrates why it is crucial to limit the spread of the virus by social distancing measures. For fuller discussion of the meaning of R0, the latent and infectious periods, as well as various caveats, see the “Definitions” section. 如果所有人像平常一样生活,那么从一个感染者到一百万个感染者需要多长时间呢?
基本再生数R0表明在没有采取防疫措施(如社交隔离)的情况下,一个感染者可以传
染给2-4人。任何一个人被感染之后,都需要经过一段时间(称为传染力潜伏期)才会传播病毒。拒目前的数据估计,感染者的传染力潜伏期中位值约为3天,在接下来的约4天时间里其具有接近 强的传染性(Li et al. 2020, He et al. 2020)。上述时间应人而异,有些患者的感染性可持续更长的时间。在R0=4的情况下,感染人数可在约3天内翻倍(7天内增长至4倍)。增长至1000倍大约需要连续翻番十次,因为210 ≈ 1000,那么也是说需要大概需要3天 × 10 = 30天,即大约一个月的时间。因此,我们估计1000倍增长需要一个月,百万倍增长需要两个月,而十亿倍增长则只需要三个月。虽然这是一个很粗放的计算方式,因为没有考虑到“超级传播者”的存在,同时也忽略了群体免疫力和并不充分的检测的效应,但这个结果告诉我们如果不采取适当的
防疫措施,该病毒的传播速度将会非常之快。这也说明了社交隔离对遏制病毒的扩散
和传播是多么的重要。关于如何测定R0,潜伏期和感染期,以及其他的相关内容,请
参见“定义”部分。 如果所有人像平常一樣生活,那麼從一個感染者到一百萬個感染者需要多長時間呢?
基本再生數R0表明在沒有採取防疫措施(如社交隔離)的情況下,一個感染者可以傳染給2-4人。任何一個人被感染之後,都需要經過一段時間(稱為傳染力潛伏期)才會傳播病毒。拒目前的數據估計,感染者的傳染力潛伏期中位數約為3天,接下來約4天時間裡其具有接近 強的傳染性(Li et al. 2020, He et al. 2020)。上述時間因人而異,有些患者的感染性可持續更長時間。在R0=4的情況下,感染人數可在約3天內翻倍(7天內增長至4倍)。增長至1000倍大約需要連續翻倍十次,因為210 ≈ 1000,那麼也是說需要大概需要3天 × 10 = 30天,即大約一個月的時間。因此,我們估計1000倍增長需要一個月,百萬倍增長需要兩個月,而十億倍增長則只需要三個月。雖然這是粗略估算,因為沒有考慮到“超級傳播者”的存在,同時也忽略了群體免疫力和不充分檢測的影響,但這個結果告訴我們如果不採取適當的防疫措施,該病毒的傳播
速度將會非常之快。這也說明了社交隔離對遏制病毒的擴散和傳播是多麼的重要。關
於如何測定R0,潛伏期和傳 染期,以及其他的相關內容,請參見“定義”部分。
2. What is the effect of social distancing? 2. 社交隔离的作用是什么? 2. 社交隔離對作用是甚麼? A highly simplified quantitative example helps clarify the need for social distancing. Suppose that you are infected and you encounter 50 people over the course of a day of working, commuting, socializing and running errands. To make the numbers round, let’s further suppose that you have a 2% chance of transmitting the virus in each of these encounters, so that you are likely to infect 1 new person each day. If you are infectious for 4 days, then you will infect 4 others on average, which is on the high end of the R0 values for SARS-CoV-2 in the absence of social distancing. If you instead see 5 people each day (preferably fewer) because of social distancing, then you will infect 0.1 people per day, or 0.4 people before you become less infectious. The desired effect of social distancing is to make each current infection produce < 1 new infections. An effective reproduction number (Re) smaller than 1 will ensure the number of infections eventually dwindles. It is critically important to quickly achieve Re < 1, which is substantially more achievable than pushing Re to near zero through public health measures. 上述的简单计算结果阐明了社交隔离的必要性。假设你被感染了,并且在一天的工作
和社交时间内接触了50人,让我们来估算一下,再假设在这个过程中你有2%的几率将病毒传染给他人,那么你在一天的时间内将感染一人。如果你在4天内都具有传染性,那么你将总共传染4人,这是上面描述的在没有社交隔离条件下R0值的上限。如
果你采取了社交隔离,一天只接触5个人(当然越少越好),那么你一天将只感染0.1人,4天总共0.4人。社交隔离的目的就是希望将每个感染者传染给他人的结果控制在1人以下。当有效繁殖数Re小于1的时候,那么病毒的传染就会 终趋缓。相对于通过
公共医疗措施将Re逼至接近于0来说,尽快将Re控制到小于1是至关重要的,也是更容易实现的。 上述的簡單計算結果闡明了社交隔離的必要性。假設你被感染了,並且在一天的工作
和社交時間內接觸了50人,再假設在這個過程中你有2%的機率將病毒傳染給他人,那麼你在一天的時間內將感染一人。如果你在4天內都具有傳染性,那麼你將總共傳染4人,這是上面描述的在沒有社交隔離條件下R0值的上限。如果你採取了社交隔離,一天只接觸5個人(當然越少越好),那麼你一天只感染0.1人,4天總共0.4人。社交隔離的目的就是希望將每個感染者傳染給他人的結果控制在1人以下。當有效繁殖數Re小於1的時候,那麼病毒的傳染就會 終趨緩。相對於通過公共醫療措施將Re逼至接近於0來說,盡快將Re控製到小於1更重要,也更可行。 3. Why is the quarantine period two weeks? 3. 为什么隔离期是两个星期? 3. 為甚麼隔離期是兩星期? The period of time from infection to symptoms is termed the incubation period. The median SARS-CoV-2 incubation period is estimated to be roughly 5 days (Lauer et al. 2020). Yet there is much person-to-person variation. Approximately 99% of those showing symptoms will show them before day 14, which explains the two week confinement period. Importantly, this analysis neglects infected people who never show symptoms. Since asymptomatic people are not usually tested, it is still not clear how many such cases there are or how long asymptomatic people remain infectious for.

从感染到出现症状的时间段我们称之为潜伏期。SARS-CoV-2的潜伏期中位数值约为5天(Lauer et al. 2020)。虽然这因人而异,但是99%的感染者会在14天之内出现相关症状,这也是为什么需要隔离的时间是两个星期。重要的是,该分析并不包括无症状
感染者。由于通常不会对无症状感染者进行检查,因此我们目前尚不清楚有多少无症
状感染者的存在,也不知道无症状感染者的感染性会持续多长时间。 從感染到出現症狀的時間段我們稱之為潛伏期。 SARS-CoV-2的潛伏期中位數約為5天(Lauer et al. 2020)。雖然潛伏期因人而異,但是99%的感染者會在14天之內出現相關徵狀,這也是需要隔離兩星期的原因。重要的是,該分析並不包括無徵狀感染
者。由於通常無徵狀感染者不會受到檢查,我們目前尚不清楚多少感染者沒有徵狀,
也不知道無徵狀感染者的傳染力會持續多長時間。 4. How do N95 masks block SARS-CoV-2? 4. N95口罩是如何隔离病毒的? 4. N95 口罩如何隔離病毒? N95 masks are designed to remove more than 95% of all particles that are at least 0.3 microns (µm) in diameter (NIOSH 42 CFR Part 84). In fact, measurements of the particle filtration efficiency of N95 masks show that they are capable of filtering ≈99.8% of particles with a diameter of ~0.1 μm (Regnasamy et al. 2017). SARS-CoV-2 is an enveloped virus ~0.1 μm in diameter, so N95 masks are capable of filtering most free virions, but they do more than that. How so? Viruses are often transmitted through respiratory droplets produced by coughing and sneezing. Respiratory droplets are usually divided into two size bins, large droplets (> 5 μm in diameter) that fall rapidly to the ground and are thus transmitted only over short distances, and small droplets (≤ 5 μm in diameter). Small droplets can evaporate into “droplet nuclei,” remain suspended in air for significant periods of time and could be inhaled. Some viruses, such as measles, can be transmitted by droplet nuclei (Tellier et al. 2019). At present there is no direct evidence showing SARS-CoV-2 transmission by droplet nuclei. Rather, larger droplets are believed to be the main vector of SARS-CoV-2 transmission, usually by settling onto surfaces that are touched and transported by hands onto mucosal membranes such as the eyes, nose and mouth (CDC 2020). The characteristic diameter of large droplets produced by sneezing is ~100 μm (Han J. R. Soc. Interface 2013), while the diameter of droplet nuclei produced by coughing is on the order of ~1 μm (Yang et al 2007). Therefore, N95 masks likely protect against several modes of viral transmission. N95口罩是设计用来过滤95%以上的直径大于0.3微米的颗粒的 (NIOSH 42 CFR Part 84)。实际上,对N95口罩的颗粒过滤效果的测定表明,它们能够过滤约99.8%直径约为0.1微米的颗粒 (Regnasamy et al. 2017)。SARS-CoV-2是一种直径约0.1微米的包膜病毒,因此N95口罩能够过滤大多数游离病毒体,但它们的作用实际上不止于此。这从何说起呢?病毒通常通过咳嗽和打喷嚏产生的呼吸道飞沫进行传播。呼吸
道飞沫通常按尺寸大小分为两类,大液滴(直径 > 5微米)会迅速掉落到地面,因此仅在短距离内传播,小液滴(直径 ≤ 5微米)。小液滴会蒸发成“液滴核”,可以在空气中悬浮很长一段时间,并可能被接触者吸入。一些病毒,例如麻疹,已被证实可以通
过液滴核传播 (Tellier et al. 2019)。目前,尚无直接证据表明SARS-CoV-2可以通过液滴核传播。相反,大液滴被认为是SARS-CoV-2传播的主要媒介,通常是通过手触摸落有大液滴的物体表面,继而通过手传播到人体的粘膜,如眼睛,鼻子和嘴巴等 (CDC 2020)。打喷嚏产生的大液滴的直径约为100微米 (Han J. R. Soc. Interface 2013),咳嗽产生的液滴核直径约为1微米 (Yang et al 2007)。因此,N95口罩可以针对病毒的多种传播途径和方式提供保护。 N95口罩的設計能過濾95%以上直徑大於0.3微米的顆粒 (NIOSH 42 CFR Part 84)。實際上,對N95口罩顆粒過濾效果的測試表明它們能夠過濾約99.8%直徑約為0.1微米的顆粒 (Regnasamy et al. 2017)。 SARS-CoV-2是一種直徑約0.1微米的包膜病毒,因此N95口罩能夠過濾大多數游離病毒,但它們的作用實際上不止於此。病毒通常通過咳嗽和打噴嚏產生的呼吸道飛沫傳播。呼吸道飛沫通常按尺寸大小分為兩類,大液
滴(直徑 > 5微米)會迅速掉落到地面,因此僅能短距離傳播,小液滴(直徑 ≤ 5微米)。小液滴會蒸發成類似噴霧的“液滴核”,可以在空氣中懸浮很長一段時間,並可能被接觸者吸入。一些病毒,例如麻疹,已被證實可以通過液滴核傳播 (Tellier et al. 2019)。目前,尚無直接證據表明SARS-CoV-2可以通過液滴核傳播。相反,大液滴被認為是SARS-CoV-2傳播的主要媒介,通常是通過手觸摸沾有大液滴的物體表面,繼而通過手傳播到人體的粘膜,如眼睛,鼻子和嘴巴等(CDC 2020)。打噴嚏產生的大液滴的直徑約為100微米 (Han J. R. Soc. Interface 2013),咳嗽產生的液滴核直徑約為1微米 (Yang et al 2007)。因此,N95口罩可以針對病毒的多種傳播途徑和方式提供保護。 5. How similar is SARS-CoV-2 to the common cold and flu viruses? 5. SARS-CoV-2与普通感冒和流感病毒有何相似之处? 5. SARS-CoV-2與普通感冒和流感病毒有何相似之處? SARS-CoV-2 is a beta-coronavirus whose genome is a single ≈30 kb strand of RNA. The flu is caused by an entirely different family of RNA viruses called influenza viruses. Flu viruses have smaller genomes (≈14 kb) encoded in 8 distinct strands of RNA, and they infect human cells in a different manner than coronaviruses. The “common cold” is caused by a variety of viruses, including some coronaviruses and rhinoviruses. Cold-causing coronaviruses (e.g. OC43 and 229E strains) are quite similar to SARS-CoV-2 in genome length (within 10%) and gene content, but different from SARS-CoV-2 in sequence (≈50% nucleotide identity) and infection severity. One interesting facet of coronaviruses is that they have the largest genomes of any known RNA viruses (≈30 kb). These large genomes led
researchers to suspect the presence of a “proofreading mechanism” to reduce the mutation rate and stabilize the genome. Indeed, coronaviruses have a proofreading exonuclease called ExoN, which explains their very low mutation rates (~10-6 per site per cycle) in comparison to influenza (≈3×10⁻⁵ per site per cycle (Sanjuan et al. 2010)). This relatively low mutation rate will be of interest for future studies predicting the speed with which coronaviruses can evade our immunization efforts. SARS-CoV-2是一种β冠状病毒,其基因组为单链RNA,长度约为3万个碱基。流感是由完全不同的RNA病毒家族(称为流感病毒)引起的。流感病毒的基因组较小(约1.4 万个碱基),由8个RNA片段进行编码,它们以与冠状病毒不同的方式感染人类细胞。“普通感冒”是由多种病毒引起的,包括一些冠状病毒和鼻病毒。引起普通感冒的冠状病毒(例如OC43和229E菌株)在基因组长度(差异不超过10%)和基因含量方面与SARS-CoV-2非常相似,但在序列上(≈50%核苷酸相似性)和感染严重程度上,与SARS-CoV-2上有较大差异。有趣的是,冠状病毒具有任何已知RNA病毒中 大的基
因组(约30万个碱基)。这些庞大的基因组使得研究人员怀疑它们具有“校对机制”,以降低突变率以稳定基因组。事实上,冠状病毒具有校对功能的核酸外切酶,称为
ExoN,这解释了为什么它们相比如流感病毒具有非常低的突变率(约为10-6/碱基/复制周期,流感病毒约为3×10-6/碱基/复制周期;Sanjuan et al. 2010)。相对较低的突变率会成为未来的研究兴趣点,以此来评估多快的突变速率会使得冠状病毒可以逃避
人体免疫系统的打击。 SARS-CoV-2是一種乙型冠狀病毒,其基因組為單鏈RNA,長度約為3萬鹼基對。流感則由完全不同的RNA病毒家族(稱為流感病毒)引起。流感病毒的基因組較小(約1.4 萬鹼基對),由8段不同RNA進行編碼,並與冠狀病毒以不同方式感染人類細胞。 「普通感冒」則可由多種病毒引起,包括一些冠狀病毒和鼻病毒。引起普通感冒的冠
狀病毒(例如OC43和229E菌株)的基因組長度(差異不超過10%)和基因含量與SARS-CoV-2比較相似,但基因序列(≈50%核苷酸相似性)和感染嚴重程度與SARS-CoV-2上存有一定差異。有趣的是,冠狀病毒具有任何已知RNA病毒中 大的
基因組(約30萬鹼基對)。這些龐大的基因組使得研究人員懷疑它們具有「校對機制」,以降低突變率及穩定基因組。事實上,冠狀病毒具有校對功能的核酸外切酶,
稱為ExoN,這解釋了為甚麼冠狀病毒的突變率大大低於流感病毒(約為10-6/鹼基/複製週期,流感病毒約為3×10-6/鹼基/複製週期;Sanjuan et al. 2010)。如此低的突變率將會成為未來研究題目之一,以此估算冠狀病毒逃避人體免疫系統所需的突變速
率。 6. How much is known about the SARS-CoV-2 genome and proteome? 6. 我们对SARS-CoV-2的基因组和蛋白质组了解多少? 6. 我們對SARS-CoV-2的基因組和蛋白質組有多少認識? SARS-CoV-2 has a single-stranded positive-sense RNA genome that codes for 10 genes ultimately producing 26 proteins according to an NCBI annotation (NC_045512). How is it that 10 genes code for >20 proteins? One long gene, orf1ab, encodes a polyprotein that is cleaved into 16 proteins by proteases that are themselves part of the polyprotein. In addition to proteases, the polyprotein encodes an RNA polymerase and associated factors to copy the genome, a proofreading exonuclease, and several other non-structural proteins. The remaining genes predominantly code for structural components of the virus: (i) the spike protein which binds the cognate receptor on a human or animal cell; (ii) a nucleoprotein that packages the genome; and (iii) two membrane-bound proteins. Though much current work is centered on understanding the role of “accessory” proteins in the viral life cycle, we estimate that it is currently possible to ascribe clear biochemical or structural functions to only about half of SARS-CoV-2 gene products. SARS-CoV-2具有单链正义RNA基因组,根据NCBI的注释 (NC_045512),该基因组编码10个基因, 终产生26种蛋白质。为什么10个编码基因会产生大于20种蛋白质呢?这是因为其中一个长基因,即orf1ab,可以编码一种多聚蛋白,该多聚蛋白被本身是多聚蛋白一部分的蛋白酶切割成16种蛋白。除了这个蛋白酶之外,该多聚蛋白还编码了RNA聚合酶和相关因子以复制病毒基因组,以及用于校对的核酸外切酶和其他几种非结构蛋白。其余的基因主要编码病毒的结构成分,包括(i)结合人或动物细胞上同源受体的刺突蛋白,(ii)用于包装基因组的核蛋白,和(iii)两种膜结合蛋白。尽管当前的许多研究工作都集中在了解“辅助”蛋白在病毒生命周期中的作用,但目前我们估计仅对约一半的SARS-CoV-2基因产物的生化或结构功能有明确了解。 根據NCBI的註釋 (NC_045512),SARS-CoV-2具有單鏈正義RNA基因組。該基因組編碼10個基因,產生26種蛋白質。為甚麼10個編碼基因會產生大於20種蛋白質呢?這是因為其中一個長基因,即orf1ab,可以編碼一種多聚蛋白,該多聚蛋白被自身編碼的蛋白酶切割成16種不同蛋白。除了這個蛋白酶之外,該多聚蛋白還編碼了RNA聚合酶和相關因子以複製病毒基因組,以及用於校對的核酸外切酶和其他幾種非結構蛋
白。其餘的基因主要編碼病毒的結構成分,包括(i)結合人或動物細胞上同源受體的刺突(棘蛋白),(ii)用於包裝基因組的核蛋白,以及(iii)兩種膜結合蛋白。儘管當前的許多研究工作集中了解「輔助」蛋白在病毒生命週期中的作用,但目前我們估
計僅對SARS-CoV-2約一半的基因產物的生化或結構功能有明確了解。 7. What can we learn from the mutation rate of the virus? 7. 我们可以从病毒的突变率中学到什么? 7. 病毒的突變率對我們有甚麼啟示? Studying viral evolution, researchers commonly use two measures describing the rate of genomic change. The first is the evolutionary rate, which is defined as the average number of substitutions that become fixed per year in strains of the virus, given in units of mutations per site per year. The second is the mutation rate, which is the number of substitutions per site per replication cycle. How can we relate these two values? Consider a single site at the end of a year. The only measurement of a
mutation rate in a β-coronavirus suggests that this site will accumulate ~10-6 mutations in each round of replication. Each round of replication cycle takes ~10 hours, and so there are 103 cycles/year. Multiplying the mutation rate by the number of replications, and neglecting the potential effects of evolutionary selection and drift, we arrive at 10-3 mutations per site per year, consistent with the evolutionary rate inferred from sequenced coronavirus genomes. As our estimate is consistent with the measured rate, we infer that the virus undergoes near-continuous replication in the wild, constantly generating new mutations that accumulate over the course of the year. Using our knowledge of the mutation rate, we can also draw inferences about single infections. For example, since the mutation rate is ~10-6 mutations/site/cycle and an mL of sputum might contain upwards of 107 viral RNAs, we infer that every site is mutated more than once in such samples. 在研究病毒进化时,研究人员通常使用两种方法来描述基因组的变化速率。第一个是
进化率,其定义为病毒株中每年固定的平均碱基替换数目,以每年每个位点的突变数
目表示。第二个是突变率,即每个复制周期每个位点的碱基替换数目。那么我们如何
关联这两个值呢?比如以年底作为一个时间点。对β-冠状病毒基因组中的任一位点的突变率的测定表明,该位点将在每轮复制中积累约10-6个突变。病毒每轮复制周期大
约需要10个小时,因此每年有103个周期。将突变率乘以复制次数,并忽略自然选择
和遗传漂变的影响,我们得出每个位点每年有10-3个突变,与从冠状病毒基因组测序
推断的进化率一致。由于我们的估计与测得的速率一致,因此我们推断该病毒在野外
经历了近乎连续的复制,并不断产生新的突变,并在一年中不断积累。利用我们对突
变率的了解,我们还可以推断出单一感染的病毒进化过程。例如,由于突变率约为
10-6个突变/位点/周期,每毫升痰中可能含有107个以上的病毒RNA,因此我们推断,此类样品中每个位点均突变一次以上。 在研究病毒進化時,研究人員通常使用兩種方法描述基因組的變化速率。第一種是進
化率,即病毒株每年固定的平均鹼基替換數目,以每年每個位點的突變數目表示。第
二種是突變率,即每個複制週期每個位點的鹼基替換數目。如何連結這兩個數值?比
如以年末作為一個時間點。對乙型冠狀病毒基因組中的任一位點突變率的測試表明,
每位點在約每106輪複製中累積一個突變。病毒每輪複製週期大約10小時,因此每年有103個週期。將突變率乘以複製次數,並忽略自然選擇和遺傳漂變的影響,我們得出每個位點每年有10-3個突變,與從冠狀病毒基因組測量推斷的進化率一致。由於估算與測量的速率一致,我們推斷該病毒在野外經過近乎連續的複製,並不斷產生新的
突變,在一年間不斷累積。利用我們對突變率的了解,我們還可以推斷出單一感染的
病毒進化過程。例如,由於突變率約為10-6個突變/位點/週期,每毫升痰中可能含有107個以上的病毒RNA,因此我們推斷此類樣本中每個位點有 少一種變體。
8. How stable and infectious is the virion on surfaces? 8. 病毒粒子在不同表面上的稳定性和传染性? 8. 病毒粒子在不同表面上的穩定性和傳染性? SARS-CoV-2 RNA has been detected on various surfaces several weeks after they were last touched (Moriarty et al. 2020). In the definitions we clarify the difference between detecting viral RNA and active virus. The probability of human infection from such exposure is not yet characterized as experiments to make this determination are very challenging. Nevertheless, caution and protective measures must be taken. We estimate that during the infectious period an undiagnosed infectious person touches surfaces tens of times. These surfaces will subsequently be touched by hundreds of other people. From the basic reproduction number R0 ≈2-4 we can infer that not everyone touching those surfaces will be infected. More detailed bounds on the risk of infection from touching surfaces urgently awaits study. 自上次接触的数周后,SARS-CoV-2的RNA仍可以在不同的物体表面被检测到 (Moriarty et al. 2020)。在“定义”部分中,我们阐明了检测病毒RNA与活性病毒之间的区别。由于进行这种测定的实验非常具有挑战性,因此尚未确定这种接触引起的人类
感染的可能性。但是,医务和研究人员在进行此类操作时必须采取谨慎的保护措施。
我们估计,在传染期间,未被诊断的传染人会触摸物体表面多达数十次。这些表面随
后将被其他数百人触摸。从基本复制数R0≈2-4来看,我们可以推断出并非每个接触这些表面的人都会被感染。我们迫切需要更多更详细的信息来研究表面接触引起的病毒
感染的界限。 自 後一次接觸SARS-CoV-2數週後,該病毒的RNA仍可在不同物體表面被檢測到 (Moriarty et al. 2020)。在「定義」部分中,我們闡明了檢測病毒RNA與活性病毒之間的區別。由於進行這種檢測非常具挑戰性,因此尚未確定這種接觸引起的人類感染的
可能性。但醫護和研究人員在進行此類操作時必須採取謹慎的保護措施。我們估計在
傳染期間,未被診斷的病人會觸摸物體表面多達數十次。這些表面隨後將被其他數百
人觸摸。從基本複制數R0≈2-4推斷,並非每個接觸這些表面的人都會受感染。我們迫切需要更多詳細信息來研究表面接觸引起病毒感染的可能性。
Glossary 词汇表 詞彙表 Clinical Measures 医疗措施 醫療措施 Incubation period: time between exposure and symptoms. 病征潜伏期:接触病毒至出现病征期间
病徵潛伏期:接觸病毒至出現病徵期間 Seroconversion: time between exposure to virus and detectable antibody response. 血清转化:接触病毒至抗体浓度达到可测量水平期间 血清轉換:接觸病毒至抗體濃度達可測量水平期間 Epidemiological Inferences 流行病学术语 流行病學術語 R0: the average number of cases directly generated by an individual infection. Latent period: time between exposure and becoming infective. Infectious period: time for which an individual is infective. Interval of half-maximum infectiousness: the time interval during which the probability of viral transmission is higher than half of the peak infectiousness. This interval is similar to the infectious period, but applies also in cases where the probability of infection is not uniform in time. 基本再生数/基本传染数 R0:平均一宗感染个案直接引致的感染宗数 传染潜伏期:接触病毒至病人开始具传染性期间 传染期:病人具传染性的阶段 高传播风险阶段时长:类似传染期,同时也适用于传染性随时间变化的感染个案。当传染病毒的机率高于顶峰的一半,此称为高传播风险阶段。 基本再生數/基本傳染數 R0:平均一宗感染個案直接引致的感染宗數 傳染潛伏期:接觸病毒至病人開始具傳染性期間 傳染期:病人具傳染性的階段 高傳播風險階段時長:類似傳染期,同時也適用於傳染性隨時間變化的感染個案。當傳染病毒的機率高於頂峰的一半,此稱為高傳播風險階段。 Viral Species 病毒品种 病毒品種 SARS-CoV-2: Severe acute respiratory syndrome coronavirus 2. A β-coronavirus causing the present COVID-19 outbreak. SARS-CoV-1: β-coronavirus that caused the 2002 SARS outbreak in China. MERS: a β-coronavirus that caused the Middle East Respiratory Syndrome outbreak beginning in Jordan in 2012. MHV: Murine herpes virus, a model β-coronavirus on which much laboratory research has been conducted. TGEV: Transmissible gastroenteritis virus, a model ⍺-coronavirus which infects pigs. 229E and OC43: two strains of coronavirus (⍺- and β- respectively) that are cause a fraction of common colds. SARS-CoV-2:严重急性呼吸系统综合症冠状病毒二型,或称新型冠状病毒,是引致目前2019冠状病毒病全球爆发的一种乙型冠状病毒 SARS-CoV-1:严重急性呼吸系统综合症冠状病毒一型,简称沙士病毒,是2002年引致中国爆发非典型肺炎的一种乙型冠状病毒 MERS:中东呼吸综合症冠状病毒,是2012年引致从约旦爆发中东呼吸综合症的乙型冠状病毒 MHV:鼠疱疹病毒,是一种乙型冠状病毒;大部分关于乙型冠状病毒的科学研究基于此模式生物 TGEV:猪传染性胃肠炎病毒,一种感染猪只的甲型冠状病毒,为甲型冠状病毒模式生物 229E与OC43:分别属甲型和乙型的两种冠状病毒,为部分普通感冒个案的致病原 SARS-CoV-2:嚴重急性呼吸系統綜合症冠狀病毒二型,或稱新型冠狀病毒,是引致目前2019冠狀病毒病全球爆發的一種乙型冠狀病毒 SARS-CoV-1:嚴重急性呼吸系統綜合症冠狀病毒一型,簡稱沙士病毒,是2002年引致中國爆發非典型肺炎的一種乙型冠狀病毒 MERS:中東呼吸綜合症冠狀病毒,是2012年引致從約旦爆發中東呼吸綜合症的乙型冠狀病毒 MHV:鼠疱疹病毒,是一種乙型冠狀病毒;大部分關於乙型冠狀病毒的科學研究基於此模式生物 TGEV:豬傳染性胃腸炎病毒,一種感染豬隻的甲型冠狀病毒,為甲型冠狀病毒模式生物 229E與OC43:分別屬甲型和乙型的兩種冠狀病毒,為部分普通感冒個案的致病原
Viral Life-Cycle 病毒生理周期 病毒生理週期 Eclipse period: time between viral entry and appearance of intracellular virions. Latent period (cellular level): time between viral entry and appearance of extracellular virions. Not to be confused with the epidemiological latent period described below. Burst size: the number of virions produced from infection of a single cell. More appropriately called “per-cell viral yield” for non-lytic viruses like SARS-CoV-2. Virion: a viral particle.
Polyprotein: a long protein that is proteolytically cleaved into a number of distinct proteins. Distinct from a polypeptide, which is a linear chain of amino acids making up a protein. 隐蔽期:从病毒侵入到细胞内病毒颗粒出现的时间。 潜伏期(细胞水平):从病毒侵入到细胞外病毒颗粒出现的时间。 不要与下面描述的流行病学的潜伏期混淆。 爆发量:单个细胞感染后产生的病毒颗粒数量。 对于非溶解性病毒(如SARS-CoV-2),更恰当地称为“单个细胞病毒产量”。 病毒颗粒:一个病毒单体 多蛋白:一种可以通过蛋白水解切割成许多不同的蛋白的长蛋白。 与多肽不同,多肽是构成蛋白质的氨基酸线性链。 隱蔽期:從病毒侵入至細胞內出現病毒顆粒期間 潛伏期(細胞層面):從病毒侵入至細胞外出現病毒顆粒期間。注意與文中流行病學術語「傳染力潛伏期」的區別 爆發量:單個細胞感染後產生的病毒顆粒數量。對於非溶解性病毒(如SARS-CoV-2),更恰當地稱為「單個細胞病毒產量」 病毒顆粒:一個病毒單體 多蛋白:可以通過水解切割成多個不同蛋白的長蛋白串。注意與多肽的區別,多肽是組成蛋白質的線性胺基酸鏈。
Human Biology 人体生理 人體生理 Alveolar Macrophage: immune cells found in the lung that engulf foreign material like dust and microbes (“professional phagocytes”) Pneumocytes: the non-immune cells in the lung. ACE2: Angiotensin-converting enzyme 2, the mammalian cell surface receptor that SARS-CoV-2 binds. TMPRSS2: Transmembrane protease, serine 2, a mammalian membrane-bound serine protease that cleaves the viral spike trimer after it binds ACE2, revealing a fusion peptide that participates in membrane fusion which enables subsequent injection of viral DNA into the host cytoplasm. Nasopharynx: the space above the soft palate at the back of the nose which connects the nose to the mouth. 肺泡巨噬细胞:在肺部发现的免疫细胞, 可以吞噬灰尘和微生物等异物(“专业吞噬细胞”) 肺细胞:肺中的非免疫细胞。 ACE2:血管紧张素转换酶2,SARS-CoV-2结合的哺乳动物细胞表面受体。 TMPRSS2:跨膜蛋白酶,丝氨酸2,一种与哺乳动物膜结合的丝氨酸蛋白酶,可以切割与ACE2结合的病毒突刺三聚体,释放一种参与膜融合的融合肽,从而将病毒DNA注入宿主细胞质中。 鼻咽:鼻后部软颚上方,将鼻子与嘴巴连接起来的部位。 肺泡巨噬細胞:在肺部的免疫細胞,可吞噬灰塵和微生物等異物(「專業吞噬細胞」) 肺細胞:肺部非免疫細胞 ACE2:血管緊張素轉換酶2,在哺乳類動物細胞表面與SARS-CoV-2結合的受體 TMPRSS2:跨膜蛋白酶,絲胺酸2,一種與哺乳動物細胞膜結合的絲胺酸蛋白酶,可以切割已與ACE2結合的突次蛋白三聚體,以暴露一種輔助病毒與細胞膜融合的融合肽,從而將病毒DNA(脫氧核糖核酸)注入宿主細胞質中。 鼻咽:鼻腔後及軟齶上方,連接口鼻的空腔 Notation 符号 符號 Note the difference in notation between the symbol ≈, which indicates “approximately” and connotes accuracy to within a factor 2, and the symbol ~, which indicates “order of magnitude” or accuracy to within a factor of 10. 请注意符号≈与〜之间的区别:符号≈表示“大约”,其表示精度范围在2之内;符号〜表示“量级”,其精度范围在10之内。 請注意符號≈與~之間的區別:符號≈表示「大約」,數字準確至上下兩倍;符號~表示「量級」,數字準確至上下十倍
More on definitions and measurement methods 详细解释定义与测量方式 詳細解釋定義與測量方式 What are the meanings of R0, “latent period” and “infectious period”? 什么是“基本再生数 R0”,“传染力潜伏期”和“传染期”? 甚麼是「基本再生數 R0」,「傳染力潛伏期」和「传染期」? The basic reproduction number, R0, estimates the average number of new infections directly generated by a single infectious person. The 0 subscript connotes that this refers to early stages of an epidemic, when everyone in the region is susceptible (i.e. there is no immunity) and no counter-measures have been taken. As geography and culture affect how many people we encounter daily, how much we touch them and share food with them, estimates of R0 can vary between locales. Moreover, because R0 is defined in the absence of countermeasures and immunity, we are usually only
able to assess the effective R (Re). At the beginning of an epidemic, before any countermeasures, Re ≈ R0. Several days pass before a newly-infected person becomes infectious themselves. This “latent period” is typically followed by several days of infectivity called the “infectious period.” It is important to understand that reported values for all these parameters are population averages inferred from epidemiological models fit to counts of infected, symptomatic, and dying patients. Because testing is always incomplete and model fitting is imperfect, and data will vary between different locations, there is substantial uncertainty associated with reported values. Moreover, these median or average best-fit values do not describe person-to-person variation. For example, viral RNA was detectable in patients with moderate symptoms for > 1 week after the onset of symptoms, and more than 2 weeks in patients with severe symptoms (ECDC 2020). Though detectable RNA is not the same as active virus, this evidence calls for caution in using uncertain, average parameters to describe a pandemic. Why aren’t detailed distributions of these parameters across people published? Direct measurement of latent and infectious periods at the individual level is extremely challenging, as accurately identifying the precise time of infection is usually very difficult. 基本再生数 R0 是一个估计数字,指每一宗感染个案平均能够直接引致的新感染个案数目。下标的“0”用意是此数字适用于疫症爆发初期,由于未有免疫力而所有爆发地人口都可能受感染,并且未有防疫措施的阶段。基于地理和文化因素,人与人之间接触
的频率与模式相异,基本再生数的估值随地域变化。另一方面,由于基本再生数的定
义只适用于缺乏任何防疫措施与免疫力的情况,通常只能量度有效繁殖数 Re。疫症爆
发初期,在防疫措施生效前,基本再生数与实则再生数大约相等。病人受到病毒感染
后,通常需要几天才开始具有传染性。这段时间称为传染力潜伏期。其后通常展开为
期几天的传染期,这段期间病人可能传染其他人。注意这些参数是推论自流行病学数
据模型的平均值,这些模型根据感染、出现征状,及死亡个案宗数计算。由于无法彻
底检测总人口的感染率,加上数学模型但准确性仅作参考,而且不同地域之间但数据
差异甚多,官方公布的数字存在很大的不确定性。另外,这些平均数和中位数无法表
示个体之间的差别。例如出现中度病征的病人在病发后一周以上就能检测到病毒RNA,而出现重度病征的病人则需要两周以上 (ECDC, 2020)。尽管可测量RNA不等同病毒依然活跃,上述证据表明利用这些不确定的平均数据描述疫症大流行时须格外小心。
上述参数无法表现个体之间的差异,主因是通常很难准确断定病人受到感染的时间,
因此极难直接量度传染潜伏期及传染期。 基本再生數 R0 是一個估計數字,指每一宗感染個案平均能夠直接引致的新感染個案數目。下標的「0」用意是此數字適用於疫症爆發初期,由於未有免疫力而所有爆發地人口都可能受感染,並且未有防疫措施的階段。基於地理和文化因素,人與人之間
接觸的頻率與模式相異,基本再生數的估值隨地域變化。另一方面,由於基本再生數
的定義只適用於缺乏任何防疫措施與免疫力的情況,通常只能量度有效繁殖數 Re。疫
症爆發初期,在防疫措施生效前,基本再生數與實則再生數大約相等。病人受到病毒
感染後,通常需要幾天才開始具有傳染性。這段時間稱為傳染力潛伏期。其後通常展
開為期幾天的传染期,這段期間病人可能感染其他人。注意這些參數是推論自流行病學數據模型的平均值,這些模型根據感染、出現徵狀,及死亡個案宗數計算。由於無
法徹底檢測總人口的感染率,加上數學模型但準確性僅作參考,而且不同地域之間但
數據差異甚多,官方公佈的數字存在很大的不確定性。另外,這些平均數和中位數無
法表示個體之間的差別。例如出現中度病徵的病人在病發後一週以上就能檢測到病毒
RNA,而出現重度病徵的病人則需要兩週以上 (ECDC, 2020)。儘管可測量RNA不等同病毒依然活躍,上述證據表明利用這些不確定的平均數據描述疫症大流行時須格外小
心。上述參數無法表現個體之間的差異,主因是通常很難準確斷定病人受到感染的時
間,因此極難直接量度傳染潛伏期及传染期。 What is the difference between measurements of viral RNA and infectious viruses? 测量病毒RNA和感染性病毒粒子之间有什么区别? Diagnosis and quantification of viruses utilizes several different methodologies. One common approach is to quantify the amount of viral RNA in an environmental (e.g. surface) or clinical (e.g. sputum) sample via quantitative reverse-transcription polymerase chain reaction (RT-qPCR). This method measures the number of copies of viral RNA in a sample. The presence of viral RNA does not necessarily imply the presence of infectious virions. Virions could be defective (e.g. by mutation) or might have been deactivated by environmental conditions. To assess the concentration of infectious viruses, researchers typically measure the “50% tissue-culture infectious dose” (TCID50). Measuring TCID50 involves infecting replicate cultures of susceptible cells with dilutions of the virus and noting the dilution at which half the replicate dishes become infected. Viral counts reported by TCID50 tend to be much lower than RT-qPCR measurements, which could be one reason why studies relying on RNA measurements (Moriarty et al. 2020) report the persistence of viral RNA on surfaces for much longer times than studies relying on TCID50 (van Doremalen et al. 2020). It is important to keep this caveat in mind when interpreting data about viral loads, for example a report measuring viral RNA in patient stool samples for several days after recovery (We et al. 2020). Nevertheless, for many viruses even a small dose of virions can lead to infection. For the common cold, for example, ~0.1 TCID50 are sufficient to infect half of the people exposed (Couch et al. 1966). 病毒的诊断和定量可以采用多种不同的方法。一种常见的方法是通过定量逆转录聚合
酶链式反应(即RT-qPCR)来定量环境(例如物体表面)或临床(例如痰)样品中病毒RNA的数量。该方法测量的是样品中病毒RNA的拷贝数。病毒RNA的存在并不一定意味着感染性病毒粒子的存在。病毒粒子可能有缺陷(例如,由于突变),或者可能
已因环境条件而失活。为了评估感染性病毒粒子的浓度,研究人员通常测量“ 50%组
织培养物的感染剂量”(TCID50)。测量TCID50涉及用病毒稀释液感染易感细胞的复制培养物,并记录一半复制培养物可被感染的稀释度。TCID50测定的病毒数目往往比RT-qPCR测量低得多,这可能是依赖于RNA测量的研究确定的病毒RNA在物体表面的持久性(Moriarty et al. 2020),比TCID50的研究得到的结果(van Doremalen et al. 2020)要更长的原因之一。当在解释有关病毒载量的数据时,这一点需要尤其注意,如对感染者恢复后几天内的粪便样本中病毒RNA的数目进行评估 (We et al. 2020)。然而,对于许多病毒而言,即使是小剂量的病毒颗粒也会导致感染。例如,对于普通感
冒,〜0.1 TCID50足以感染一半的暴露人群 (Couch et al. 1966)。 What is the difference between the case fatality rate and the infection fatality rate? 病例死亡率和感染致死率有什么区别? Global statistics on new infections and fatalities are pouring in from many countries, providing somewhat different views on the severity and progression of the pandemic. Assessing the severity of the pandemic is critical for policy making and thus much effort has been put into quantification. The most common measure for the severity of a disease is the fatality rate. One commonly reported measure is the case fatality rate (CFR), which is the proportion of fatalities out of total diagnosed cases. The CFR reported in different countries varies significantly, from 0.3% to about 10%. Several key factors affect the CFR. First, demographic parameters and practices associated with increased or decreased risk differ greatly across societies. For example, the prevalence of smoking, the average age of the population, and the capacity of the healthcare system. Indeed, the majority of people dying from SARS-CoV-2 have a preexisting condition such as cardiovascular disease or smoking (China CDC 2020). There is also potential for bias in estimating the CFR. For example, a tendency to identify more severe cases (selection bias) will tend to overestimate the CFR. On the other hand, there is usually a delay between the onset of symptoms and death, which can lead to an underestimate of the CFR early in the progression of an epidemic. Even when correcting for these factors, the CFR does not give a complete picture as many cases with mild or no symptoms are not tested. Thus, the CFR will tend to overestimate the rate of fatalities per infected person, termed the infection fatality rate (IFR). Estimating the total number of infected people is usually accomplished by testing a random sample for anti-viral antibodies, whose presence indicates that the patient was previously infected. As of writing, such assays are not widely available, and so researchers resort to surrogate datasets generated bytesting of foreign citizens returning home from infected countries (Verity et al. 2020), or epidemiological models estimating the number of undocumented cases (Li et al. 2020). These methods provide a first glimpse of the true severity of the disease. 来自全球诸多国家的新感染和死亡人数的统计数据,为我们对这次传染病的严重程度
和进展提供了一些不同的看法。评估传染病的严重程度对于制定相关政策至关重要,
因此人们已经投入了大量精力去量化这些数字。衡量疾病严重程度 常见的标准就是
死亡率。一项普遍报告的衡量标准是病例死亡率(CFR),即病死病例占总诊断病例的比例。不同国家/地区已报告的CFR差异很大,从0.3%到大约10%。影响CFR的关键因素有几个。首先,在不同国家,与增加或减少的风险相关的人口统计学参数和算
法存在很大差异。例如,吸烟率,人口平均年龄和医疗保健体系的容量。事实上,大
多数死于SARS-CoV-2的人患有心血管疾病等疾病或有吸烟史(China CDC 2020)。在估算CFR时也可能存在偏差。例如,识别更严重病例的趋势(选择偏向)将倾向于高估CFR。另一方面,在症状发作和死亡之间通常存在延迟,这可能导致在流行病发展的早期低估CFR。即使校正这些因素,CFR也无法提供完整无误的评估,因为许多没有轻度或无症状的病例都没有经过测试。因此,CFR将倾向于高估每个感染者的死亡率,称为感染死亡率(IFR)。通常通过对随机样本进行抗病毒抗体测试来估计感染人数,该样本的存在表明该患者先前已被感染。在撰写本文时,此类检测方法尚未广泛
使用,因此研究人员求助于替代数据集,该数据集生成了从受感染国家返回家园的外
国公民的字节数 (Verity et al. 2020),或流行病学模型估计的无证病例数 (Li et al. 2020)。这些方法提供了对该疾病真实严重程度的初步了解。
What is the burst size and the replication time of the virus? 病毒的爆发大小和复制时间是多少? Two important characteristics of the viral life cycle are the time it takes them to produce new infectious progeny, and the number of progeny each infected cell produces. The yield of new virions per infected cell is more clearly defined in lytic viruses, such as those infecting bacteria (bacteriophages), as viruses replicate within the cell and subsequently lyse the cell to release a “burst” of progeny. This measure is usually termed “burst size.” SARS-CoV-2 does not release its progeny by lysing the cell, but rather by continuous budding (Park et al. 2020). Even though there is no “burst”, we can still estimate the average number of virions produced by a single infected cell. Measuring the time to complete a replication cycle or the burst size in vivo is very challenging, and thus researchers usually resort to measuring these values in tissue-culture. There are various ways to estimate these quantities, but a common and simple one is using “one-step” growth dynamics. The key principle of this method is to ensure that only a single replication cycle occurs. This is typically achieved by infecting the cells with a large number of virions, such that every cell gets infected, thus leaving no opportunity for secondary infections. Assuming entry of the virus to the cells is rapid (we estimate 10 minutes for SARS-CoV-2), the time it takes to produce progeny can be estimated by quantifying
the lag between inoculation and the appearance of new intracellular virions, also known as the “eclipse period”. This eclipse period does not account for the time it takes to release new virions from the cell. The time from cell entry until the appearance of the first extracellular viruses, known as the “latent period” (not to be confused with the epidemiological latent period, see Glossary), estimates the duration of the full replication cycle. The burst size can be estimated by waiting until virion production saturates, and then dividing the total virion yield by the number of cells infected. While both the time to complete a replication cycle and the burst size may vary significantly in an animal host due to factors including the type of cell infected or the action of the immune system, these numbers provide us with an approximate quantitative view of the viral life-cycle at the cellular level.
References and excerpts Note that for about 10 out of 45 parameters, the literature values are from other coronaviruses. We await corresponding measurements for SARS-CoV-2. Size & Content Diameter: (Zhu et al. 2020) - “Electron micrographs of negative-stained 2019-nCoV particles were generally spherical with some pleomorphism (Figure 3). Diameter varied from about 60 to 140 nm.“ Volume- Using diameter and assuming the virus is a sphere Mass: Using the volume and a density of ~ 1 g per mL Number of surface spikes trimers: (Neuman et al. 2011) - “Our model predicts ∼90 spikes per particle.” Length of surface spikes trimers: (Zhu et al. 2020) - “ Virus particles had quite distinctive spikes, about 9 to 12 nm, and gave virions the appearance of a solar corona.“ Receptor binding affinity (Kd): (Walls et al. 2020) - Walls et al. reports Kd of ≈1 nM for the binding domain in Table 1 using Biolayer interferometry with kon of ≈1.5×10⁵ M-1 s-1 and koff of ≈1.6×10⁻⁴ s-1. (Wrapp et al. 2020) - Wrapp et al. reports Kd of ≈15 nM for the spike (Fig.3) and ≈35 nM for the binding domain (Fig.4) using surface plasmon resonance with kon of ≈1.9×10⁵ M-1 s-1 and koff of ≈2.8×10⁻³ s-1 for the spike and kon of ≈1.4×10⁵ M-1 s-1 and koff of ≈4.7×10⁻³ s-1 for the binding domain. The main disagreement between the studies seems to be on the koff. Membrane (M; 222 aa): (Neuman et al. 2011) - “Using the M spacing data for each virus (Fig.6C), this would give ∼1100 M2 molecules per average SARS-CoV, MHV and FCoV particle” Envelope (E; 75 aa): (Godet et al. 1992) - “Based on the estimated molar ratio and assuming that coronavirions bear 100 (Roseto et al., 1982) to 200 spikes, each composed of 3 S molecules (Delmas and Laude, 1990) it can be inferred that approximately 15- 30 copies of ORF4 protein are incorporated into TGEV virions (Purdue strain).” Nucleoprotein (364 aa): (Neuman et al. 2011) - “Estimated ratios of M to N protein in purified coronaviruses range from about 3M:1N (Cavanagh, 1983, Escors et al., 2001b) to 1M:1N (Hogue and Brian, 1986, Liu and Inglis, 1991), giving 730–2200 N molecules per virion.” Genome Type: (ViralZone) +ssRNA “Monopartite, linear ssRNA(+) genome” Genome length: (Wu et al. 2020) - Figure 2 Number of genes: (Wu et al. 2020) - “SARS-CoV-2 genome has 10 open reading frames (Fig. 2A).“ or (Wu et al. 2020) - "The 2019-nCoV genome was annotated to possess 14 ORFs encoding 27 proteins". Number of proteins: (Wu et al. 2020) -”By aligning with the amino acid sequence of SARS PP1ab and analyzing the characteristics of restriction cleavage sites recognized by 3CLpro and PLpro, we speculated 14 specific proteolytic sites of 3CLpro and PLpro in SARS-CoV-2 PP1ab (Fig. 2B). PLpro cleaves three sites at 181–182, 818–819, and 2763–2764 at the N-terminus and 3CLpro cuts at the other 11 sites at the C-terminus, and forming 15 non-structural proteins.” Evolution rate: (Koyama et al. 2020) - “Mutation rates estimated for SARS, MERS, and OC43 show a large range, covering a span of 0.27 to 2.38 substitutions ×10-3 / site / year (10-16).” Recent unpublished evidence also suggest this rate is of the same order of magnitude in SARS-CoV-2. Mutation rate: (Sanjuan et al. 2010) - “Murine hepatitis virus … Therefore, the corrected estimate of the mutation rate is μs/n/c = 1.9x10⁻⁶ / 0.55 = 3.5 x 10⁻⁶.” Genome similarity: For all species except pangolin: (Wu et al. 2020) - “After phylogenetic analysis and sequence alignment of 23 coronaviruses from various species. We found three coronaviruses from bat (96%, 88% and 88% for Bat-Cov RaTG13, bat-SL-CoVZXC12 and bat-SL-CoVZC45, respectively) have the highest genome sequence identity to SARS-CoV-2 (Fig. 1A). Moreover, as shown in Fig. 1B, Bat-Cov RaTG13 exhibited the closest linkage with SARS-CoV-2. These phylogenetic evidences suggest that SARS-CoV-2 may be evolved from bat CoVs, especially RaTG13. Among all coronaviruses from human, SARS-CoV (80%) exhibited the highest genome sequence identity to SARS-CoV-2. And MERS/isolate NL13845 also has 50% identity with SARS-CoV-2.” For pangolin: (Zhang et al. 2020) - Figure 3 Replication Timescales Virion entry into cell: (Schneider et al. 2012) - “Previous experiments had revealed that virus is internalized within 15 min” and (Ng et al. 2003) - “Within the first 10 min, some virus particles were internalised into vacuoles (arrow) that were just below the plasma membrane surface (Fig. 2, arrows). … The observation at 15 min postinfection (p.i.), did not differ much from 10 min p.i. (Fig. 4a)” Eclipse period: (Schneider et al. 2012) - “SARS-CoV replication cycle from adsorption to release of infectious progeny takes about 7 to 8 h (data not shown).” and (Harcourt et al. 2020) - Figure 4 shows virions are released after 12-36 hrs but because this is multi-step growth this represents an upper bound for the replication cycle. Burst size: (Hirano et al. 1976) - “The average per‐cell yield of active virus was estimated to be about 6–7× 10² plaque‐forming units.” This data is for MHV, more research is needed to verify these values for SARS-CoV-2. Host Cells Type: (Shieh et al. 2005) - “Immunohistochemical and in situ hybridization assays demonstrated evidence of SARS-associated coronavirus (SARS-CoV) infection in various respiratory epithelial cells, predominantly type II pneumocytes, and in alveolar macrophages in the lung.“ and (Walls et al. 2020) - “SARS-CoV-2 uses ACE2 to enter target cells” and (Rockx et al. 2020) - “In SARS-CoV-2-infected macaques, virus was excreted from nose and throat in absence of clinical signs, and detected in type I and II pneumocytes in foci of diffuse alveolar damage and mucous glands of the nasal cavity….In the upper respiratory tract, there was focal 5 or locally extensive SARS-CoV-2 antigen expression in epithelial cells of mucous glands in the nasal cavity (septum or concha) of all four macaques, without any associated histological lesions (fig. 2I).”
Type I and Type II pneumocyte and alveolar macrophage cell number: (Crapo et al. 1982) - Table 4 and (Stone et al. 1992) - Table 5 Epithelial cells in mucous gland cell number and volume: (ICRP 1975) - surface area of nasal cavity, (Tos & Mogensen, 1976) and (Tos & Mogensen, 1977) - mucous gland density, (Widdicombe 2019) - mucous gland volume, (Ordoñez et al. 2001) and (Mercer et al. 1994) - mucous cell volume. We divide the mucous gland volume by the mucous cell volume to arrive at the total number of mucous cells in a mucous gland. We multiply the surface density of mucous glands by the surface area of the nasal cavity to arrive at the total number of mucous glands, and then multiply the total number of mucous glands by the number of mucous cells per mucous gland. Type II pneumocyte volume: (Fehrenbach et al. 1995) - “Morphometry revealed that although inter‐individual variation due to some oedematous swelling was present, the cells were in a normal size range as indicated by an estimated mean volume of 763 ± 64 μm3“ Alveolar macrophage volume: (Crapo et al. 1982) - “Alveolar macrophages were found to be the largest cell in the populations studied, having a mean volume of 2,491 μm3” Concentration Nasopharynx, Throat, Stool, and Sputum: (Woelfel et al. 2020) - Figure 2. and (Kim et al. 2020) - Figure 1 and (Pan et al. 2020) - Figure. We took the maximal viral load for each patient in nasopharyngeal swabs, throat swabs, stool or in sputum. Antibody Response - Seroconversion Seroconversion time (time period until a specific antibody becomes detectable in the blood): (Zhao et al. 2020) - “The seroconversion sequentially appeared for Ab, IgM and then IgG, with a median time of 11, 12 and 14 days, respectively” and (To et al. 2020) - “For 16 patients with serum samples available 14 days or longer after symptom onset, rates of seropositivity were 94% for anti-NP IgG (n=15), 88% for anti-NP IgM (n=14), 100% for anti-RBD IgG (n=16), and 94% for anti-RBD IgM (n=15)” Maintenance of antibody response to virus: (Wu et al. 2007) - “Among 176 patients who had had severe acute respiratory syndrome (SARS), SARS-specific antibodies were maintained for an average of 2 years, and significant reduction of immunoglobulin G–positive percentage and titers occurred in the third year.” Virus Environmental Stability Half life on surfaces: (van Doremalen et al. 2020) - For half-lives we use Supplementary Table 1. For time to decay from ~104 to ~10 TCID50/L-1 air or mL-1 medium, we use the first time titer reached detection limit in Figure 1A for surfaces. For aerosols, we use ten half-life values (1000-fold decrease from 104 to 10, meaning 10 halvings of concentration) from Supplementary Table 1. More studies are urgently needed to clarify the implications of virion stability on the probability of infection from aerosols or surfaces. RNA stability on surfaces: (Moriarty et al. 2020) - “SARS-CoV-2 RNA was identified on a variety of surfaces in cabins of both symptomatic and asymptomatic infected passengers up to 17 days after cabins were vacated on the Diamond Princess but before disinfection procedures had been conducted (Takuya Yamagishi, National Institute of Infectious Diseases, personal communication, 2020).” “Characteristic” Infection Progression in a Single Patient Basic reproductive number, R0: (Li et al. 2020) - “Our median estimate of the effective reproductive number, Re—equivalent to the basic reproductive number (R0) at the beginning of the epidemic—is 2.38 (95% CI: 2.04−2.77)” and (Park et al. 2020) - “Our estimated R0 from the pooled distribution has a median of 2.9 (95% CI: 2.1–4.5).” Latent period (from infection to being able to transmit): (Li et al. 2020) - ”In addition, the median estimates for the latent and infectious periods are approximately 3.69 and 3.48 days, respectively.” and Table 1 and (He et al. 2020) - We use the time it takes the infectiousness to reach half its peak, which happens two days before symptom onset based on Figure 1b. As symptoms arise after 5 days (see incubation period), this means the latent period is about 3 days. Incubation period (from infection to symptoms): (Lauer et al. 2020) - “The median incubation period was estimated to be 5.1 days (95% CI, 4.5 to 5.8 days), and 97.5% of those who develop symptoms will do so within 11.5 days (CI, 8.2 to 15.6 days) of infection. These estimates imply that, under conservative assumptions, 101 out of every 10 000 cases (99th percentile, 482) will develop symptoms after 14 days of active monitoring or quarantine.” and (Li et al. 2020) - “The mean incubation period was 5.2 days (95% confidence interval [CI], 4.1 to 7.0), with the 95th percentile of the distribution at 12.5 days.” Infectious period (partially overlaps latent period): (Li et al. 2020) - ”In addition, the median estimates for the latent and infectious periods are approximately 3.69 and 3.48 days, respectively.” and Table 1 and (He et al. 2020) - We quantify the interval between half the maximal infectiousness from the infectiousness profile in Figure 1b. Disease duration: (WHO 2020) - “Using available preliminary data, the median time from onset to clinical recovery for mild cases is approximately 2 weeks and is 3-6 weeks for patients with severe or critical disease” Time until diagnosis: (Xu et al. 2020) - We used data on cases with known symptom onset and case confirmation dates and calculated the median time delay between these two dates. Case Fatality Rate: (ECDC geographic distribution of cases from 29/03/2020) - We use data from all countries with more than 50 death cases and calculate the uncorrected raw Case Fatality Rate for each country. The range represents the lowest and highest rates observed. Infected Fatality Rate: (Verity et al. 2020) - “We obtain an overall IFR estimate for China of 0.66% (0.39%,1.33%)” and (Ferguson et al. 2020) - “The IFR estimates from Verity et al.12 have been adjusted to account for a non-uniform attack rate giving an overall IFR of 0.9% (95% credible interval 0.4%-1.4%).”
Acknowledgements We thank Uri Alon, Niv Antonovsky, David Baltimore, Rachel Banks, Arren Bar Even, Naama Barkai, Molly Bassette, Menalu Berihoon, Biana Bernshtein, Pamela Bjorkman, Cecilia Blikstad, Julia Borden, Bill Burkholder, Griffin Chure, Lillian Cohn, Bernadeta Dadonaite, Emmie De wit, Ron Diskin, Ana Duarte, Tal Einav, Avigdor Eldar, Elizabeth Fischer, William Gelbart, Alon Gildoni, Britt Glausinger, Shmuel Gleizer, Dani Gluck, Soichi Hirokawa, Greg Huber, Christina Hueschen, Amit Huppert, Shalev Itzkovitz, Martin Jonikas, Leeat Keren, Gilmor Keshet, Marc Kirschner, Roy Kishony, Amy Kistler, Liad Levi, Sergei Maslov, Adi Millman, Amir Milo, Elad Noor, Gal Ofir, Alan Perelson, Steve Quake, Itai Raveh, Andrew Rennekamp, Tom Roeschinger, Daniel Rokhsar, Alex Rubinsteyn, Gabriel Salmon, Maya Schuldiner, Eran Segal, Ron Sender, Alex Sigal, Maya Shamir, Arik Shams, Mike Springer, Adi Stern, Noam
Stern-Ginossar, Lubert Stryer, Dan Tawfik, Boris Veytsman, Aryeh Wides, Tali Wiesel, Anat Yarden, Yossi Yovel, Dudi Zeevi, Mushon Zer Aviv, and Alexander Zlokapa for productive feedback on this manuscript. Figure created using Biorender.