MTN Group Limited - mtn-investor.com · MTN Group Limited Integrated Report 2015 About this report...
126
MTN Group Limited Integrated report for the year ended 31 December 2015
Transcript of MTN Group Limited - mtn-investor.com · MTN Group Limited Integrated Report 2015 About this report...

MTN Group LimitedIntegrated report for the year ended 31 December 2015

MTN Group Limited Integrated Report 2015
About this report
STRATEGY ICONS
MTN’s strategy ( 22) is driven through five
strategic themes, the icons of which are:
Creating and managing
stakeholder value
Creating a distinct customer
experience
Driving sustainable growth
Transforming our operating
model
Innovation and best practice
Reporting principles and assuranceFinancial informationIn compiling the summarised financial results and AFS, the Group applies International Financial Reporting Standards (IFRS) as issued by the International Accounting Standards Board (IASB) and interpretations as issued by the IFRS Interpretations Committee (IFRIC), and complies with the SAICA Financial Reporting Guides as issued by the Accounting Practices Committee, Financial Reporting Pronouncements as issued by the Financial Reporting Standards Council (FRSC), the JSE Listings Requirements and the requirements of the South African Companies Act, No 71 of 2008.
In parts of this report, we include data on MTN Irancell as it is a large and important operation. However, under IFRS, this business is equity accounted for, like our businesses in Botswana and Swaziland.
The audit committee advises the board, which approves the AFS. The AFS are jointly audited by PricewaterhouseCoopers Inc. (PwC) and SizweNtsalubaGobodo Inc.
Non-financial informationLocal and global standards and guidelines are used in compiling non-financial information. The key standards of reference are the JSE Listings Requirements, the Companies Act of 2008, King Code of Governance Principles for South Africa 2009 (King III), IIRC guidelines, the JSE Socially Responsible Investment Index, the United Nations Global Reporting Initiative G4 Sustainability Reporting Guidelines, the telecommunications sector supplement and the CDP standard.
Non-financial information on certain aspects of the business has been externally assured by PwC. This includes certain quality of service indicators; the outcome of the employee culture survey; CSI spend; number of whistle-blower tip-offs and net promoter score. These are included in the detailed sustainability report . The assurance statement is on
118.
This integrated report is MTN Group Limited’s (MTN, the Group or Company) primary communication to shareholders. It is also useful to other stakeholders interested in MTN’s ability to ensure a sustainable business in the future. It explains who we are, how we are governed and how we implement our strategy to create value. It gives our Group performance in 2015 and our prospects.
This year, in our effort to tell the MTN story more thoroughly, we provide a more detailed discussion of the most material issues the Company faced in the year ( 11) and what actions these prompted. This material issues section also provides details of the environment in which we operate, so to avoid duplication, we have removed the separate operating context page which had appeared in the 2014 report. Similarly, we have done away with the CFO report.
The material issues and our strategy form the golden thread that runs throughout the report. To keep our report concise, we provide supplementary information in associated reports on MTN’s website. The sustainability and corporate governance reports, as well as a full set of the annual financial statements (AFS) and a tax report, are available at
www.mtn.com/investors/FinancialReporting/Pages/IntegratedReports.aspx. A detailed stakeholder engagement table is also available online.
Scope and boundaryThe content of this report addresses key developments and material matters for the period 1 January to 31 December 2015. It provides insight into factors which influence our strategy and determine our strategic priorities. It gives commentary, performance measures and prospects for the Group’s strategy and main operations. Matters we consider most material determine the report’s content. For details on how we define our material issues, and what they are, see 11.
Our strategy is underscored by our strategic priorities, detailed on 23. Strategic priorities are further developed into specific initiatives, delivery of which is quantified and evaluated against annual targets set by the Group executive committee (exco) at the start of the year. In this report we also provide our outlook on the delivery of our priorities on 28.
When determining material issues, we consider the size of each operating company (opco). The contribution of each cluster is given on 02 and shows that MTN Nigeria and MTN South Africa collectively account for 63% of the Group’s total revenue. The CEOs of these operations therefore sit on the exco. Our large opco cluster makes up 21% of the Group’s total revenue and the executive responsible for this cluster sat on the exco in 2015. For these reasons, we include more detailed 2015 performance reports for MTN South Africa, MTN Nigeria and our large opco cluster on 32 to 41.
Given a number of changes that took effect early in 2016, we provide the composition of the board and executive committee at 2 March 2016. On
10 we also provide details of the main changes to our organisational structure which came into effect in the new financial year.
For the purposes of this report, we have included summarised financial statements. The full AFS and the external audit report can be found at .
Approval by the boardThe structure and layout of this report is based on guidance in the latest integrated reporting framework set by the International Integrated Reporting Council (IIRC). The report was prepared under the supervision of Group CFO Brett Goschen CA(SA). The audit committee ensures the integrity of the report and has applied its collective mind to its preparation and presentation. The directors are responsible for the integrated report as a whole. The report was approved by the board in March 2016.
We welcome feedback on this report at investor relations@mtn co za
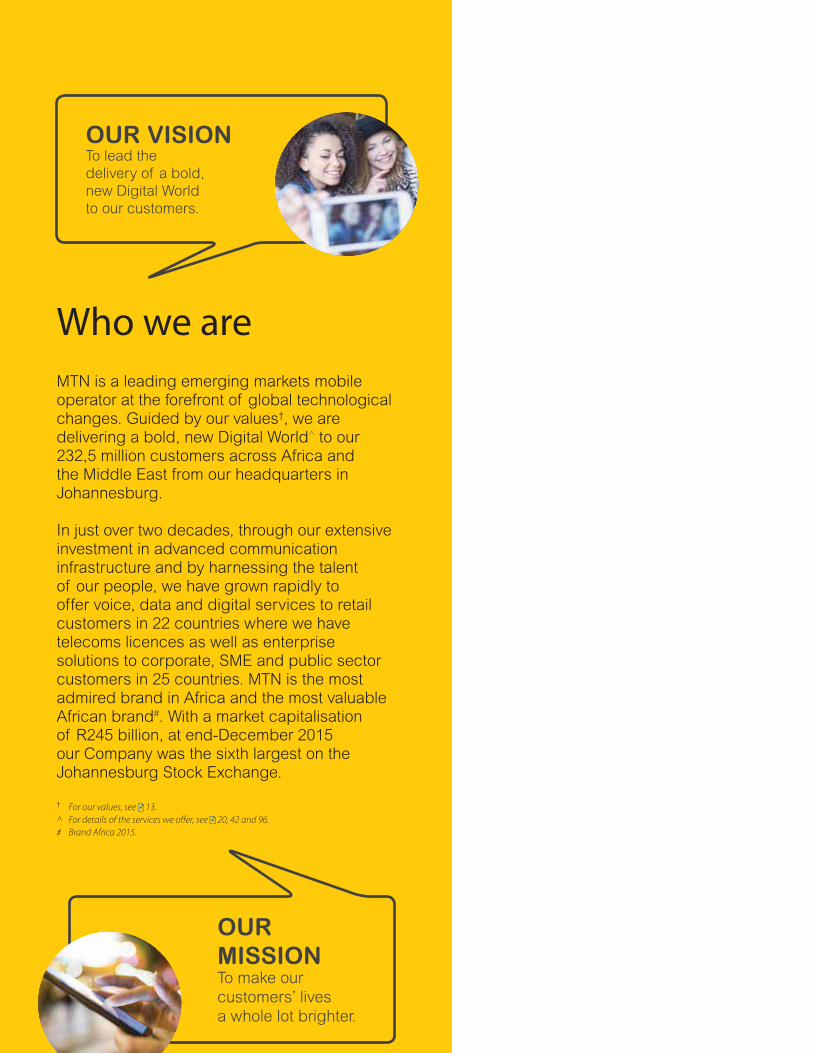
MTN is a leading emerging markets mobile operator at the forefront of global technological changes. Guided by our values†, we are delivering a bold, new Digital World^ to our 232,5 million customers across Africa and the Middle East from our headquarters in Johannesburg.
In just over two decades, through our extensive investment in advanced communication infrastructure and by harnessing the talent of our people, we have grown rapidly to offer voice, data and digital services to retail customers in 22 countries where we have telecoms licences as well as enterprise solutions to corporate, SME and public sector customers in 25 countries. MTN is the most admired brand in Africa and the most valuable African brand#. With a market capitalisation of R245 billion, at end-December 2015 our Company was the sixth largest on the Johannesburg Stock Exchange.
† For our values, see 13.
^ For details of the services we offer, see 20, 42 and 96.
# Brand Africa 2015.
OUR
MISSIONTo make our
customers’ lives
a whole lot brighter.
OUR VISIONTo lead the
delivery of a bold,
new Digital World
to our customers.
Who we are

ICON REFERENCE
To make for easier reading, navigation and cross-referencing tools
have been included to reference relevant pages within this book and
supplementary reports on the website.
www.mtn.com/Investors/FinancialReporting/Pages/
integratedReports.aspx
Refer to a page in the integrated report
LA Limited assurance
Material issue
* Constant currency (“organic”) information.** Reported – includes hyperinflation and relating goodwill impairment, tower
profits and the Nigeria regulatory fine.
Reports online
Governance report
Sustainability report
A l fi i l t t t
CONTENTS
SETTING THE SCENE 01Who we are, our vision and our mission FlapAbout this report IFCMTN’s position 01Where we operate and how we’ve done 02A word from our executive chairman 04Key changes to our operating structure 10Our material issues in 2015 11MTN’s value creation 18
DETERMINING OUR STRATEGIC PATH 22Our strategy 22Our top risks and what we are doing about them 24Our Group performance and outlook 28Financial review 30MTN South Africa’s performance and outlook 32MTN Nigeria’s performance and outlook 34Our large opco cluster and MTN Irancell’s performance and outlook 36
OUR LEADERSHIP, GOVERNANCE, REWARD
AND RECOGNITION 44Who is responsible 44
Profiles of our board of directors 44Profiles of our executive committee 46
How we are governed 47Summarised corporate governance report 47Risk management 57Social and ethics committee report 62
Our management depth 64Our people and their remuneration 66
SUMMARY CONSOLIDATED FINANCIAL STATEMENTS 98APPENDIX: CONSTANT CURRENCY,
HYPERINFLATION AND TOWER PROFIT 112NON-FINANCIAL DATA, INDEPENDENT ASSURANCE
REPORT AND SHAREHOLDER INFORMATION 116Non-financial data for which limited assurance was obtained 117Independent assurance report 118Stock exchange performance 120Shareholders’ diary 120Forward looking information 120Administration IBC

MTN’s position
Employs 21 084 people
Strong
financial
position
0,54 net
debt/EBITDA
273% growth in
dividend return
in five years
Leading emerging
markets operator with
232,5 million
subscribers
Broad range
of innovative
products and
services
Largest
market
share in
15 countries
Leading African brand
Extensive quality
infrastructure: 25 countries
across Africa
and the Middle
East
Employs
59
nationalities
R130 billion
invested in capital
projects in five years
(excluding JVs)
More than
50 licences
of various kinds
MTN Group Limited Integrated Report 2015
1
SETTING THE SCENE
ConsumerDigital
Enterprise Financial services
2
MTN Group Limited Integrated Report 2015
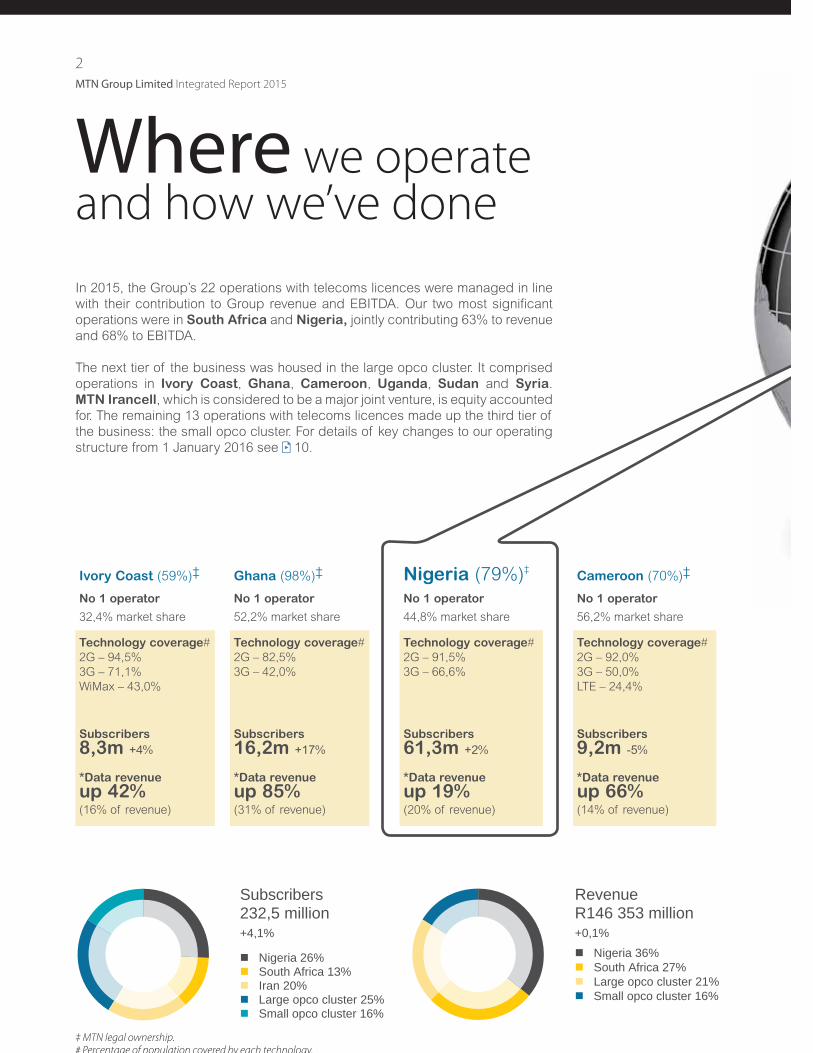
In 2015, the Group’s 22 operations with telecoms licences were managed in line
with their contribution to Group revenue and EBITDA. Our two most significant
operations were in South Africa and Nigeria, jointly contributing 63% to revenue
and 68% to EBITDA.
The next tier of the business was housed in the large opco cluster. It comprised
operations in Ivory Coast, Ghana, Cameroon, Uganda, Sudan and Syria.
MTN Irancell, which is considered to be a major joint venture, is equity accounted
for. The remaining 13 operations with telecoms licences made up the third tier of
the business: the small opco cluster. For details of key changes to our operating
structure from 1 January 2016 see 10.
Where we operate and how we’ve done
Ivory Coast (59%)‡
No 1 operator
32,4% market share
Ghana (98%)‡
No 1 operator
52,2% market share
Nigeria (79%)‡
No 1 operator
44,8% market share
Cameroon (70%)‡
No 1 operator
56,2% market share
Technology coverage#
2G – 94,5%
3G – 71,1%
WiMax – 43,0%
Technology coverage#
2G – 82,5%
3G – 42,0%
Technology coverage#
2G – 91,5%
3G – 66,6%
Technology coverage#
2G – 92,0%
3G – 50,0%
LTE – 24,4%
Subscribers
8,3m +4%Subscribers
16,2m +17%Subscribers
61,3m +2%Subscribers
9,2m -5%
*Data revenue
up 42%*Data revenue
up 85%*Data revenue
up 19%*Data revenue
up 66%(16% of revenue) (31% of revenue) (20% of revenue) (14% of revenue)
Subscribers232,5 million+4,1%
Nigeria 26%South Africa 13%Iran 20%Large opco cluster 25%Small opco cluster 16%
RevenueR146 353 million+0,1%
Nigeria 36%South Africa 27%Large opco cluster 21%Small opco cluster 16%
‡ MTN legal ownership.# Percentage of population covered by each technology.
MTN Group Limited Integrated Report 2015
3
SETTING THE SCENE
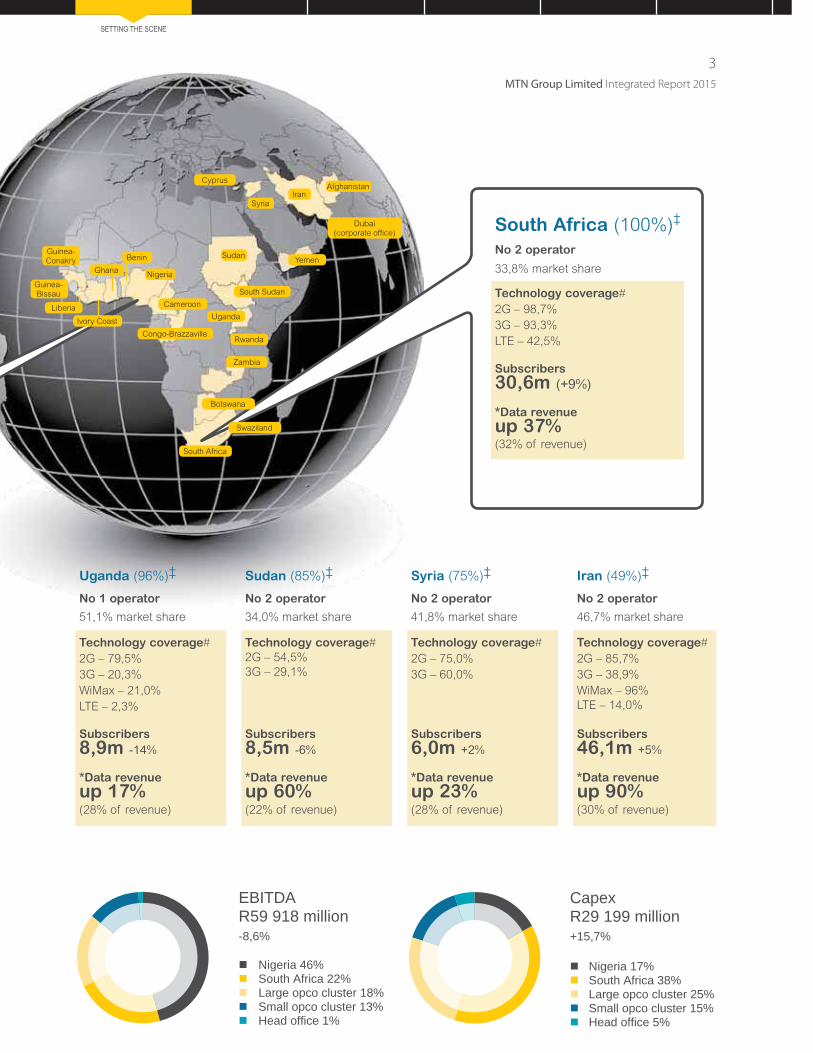
Botswana
Zambia
Yemen
Cyprus
Syria
AfghanistanIran
Rwanda
Uganda
South Sudan
Sudan
Congo-Brazzaville
Swaziland
Ghana
Guinea-Conakry
Guinea-Bissau
Benin
Cameroon
Nigeria
Ivory Coast
Liberia
Uganda (96%)‡
No 1 operator
51,1% market share
Sudan (85%)‡
No 2 operator
34,0% market share
Syria (75%)‡
No 2 operator
41,8% market share
Iran (49%)‡
No 2 operator
46,7% market share
Technology coverage#
2G – 79,5%
3G – 20,3%
WiMax – 21,0%
LTE – 2,3%
Technology coverage#
2G – 54,5%
3G – 29,1%
Technology coverage#
2G – 75,0%
3G – 60,0%
Technology coverage#
2G – 85,7%
3G – 38,9%
WiMax – 96%
LTE – 14,0%
Subscribers
8,9m -14%Subscribers
8,5m -6%Subscribers
6,0m +2%Subscribers
46,1m +5%
*Data revenue
up 17%*Data revenue
up 60%*Data revenue
up 23%*Data revenue
up 90%(28% of revenue) (22% of revenue) (28% of revenue) (30% of revenue)
South Africa (100%)‡
No 2 operator
33,8% market share
Technology coverage#
2G – 98,7%
3G – 93,3%
LTE – 42,5%
Subscribers
30,6m (+9%)
*Data revenue
up 37% (32% of revenue)
DATA TO BE
SUPPLIED
EBITDAR59 918 million-8,6%
Nigeria 46%South Africa 22%Large opco cluster 18%Small opco cluster 13%Head office 1%
CapexR29 199 million+15,7%
Nigeria 17%South Africa 38%Large opco cluster 25%Small opco cluster 15%Head office 5%
South Africa
Dubai (corporate office)

4
MTN Group Limited Integrated Report 2015
A word from our executive chairman
MTN experienced an extremely difficult 2015, particularly in the last quarter of the year
when the Nigerian Communications Commission (NCC) imposed a US$5,2 billion† fine
relating to subscriber registration requirements. Profound lessons were learned, which
precipitated a wide-ranging review of our operations, operating structure and
stakeholder management capacity, and substantial progress has been made in taking
the necessary corrective action.
A defining time for MTNAs a consequence of the unfortunate events
subsequent to the imposition of the fine in October
2015, which included the resignations of the Group
CEO and the CEO and head of regulatory for
MTN Nigeria, I agreed to assume the role of
executive chairman on an interim basis, from
December 2015. My primary tasks were to resolve
the Nigerian fine and appoint a new Group CEO. The
latter process is well under way and we expect to
identify and name a new Group CEO by the end of
June 2016.
We have sought, systematically, to remedy those
areas in which we were found to be lacking, to
ensure that the Group emerges as more resilient
than before. To this end, we have revised our
operating structure and appointed a new
management team, and improved our governance,
compliance and stakeholder management functions.
Furthermore, we are allocating the appropriate
resources to ensure that our operational platforms
are robust, our networks are competitive and the
experience we deliver to our customers is enhanced.
An important aspect of achieving all these
imperatives has been to elevate the importance of
the Group’s people and culture agenda. We are also
conducting a holistic strategic review, to ensure that
the Group is agile and responsive to the rapid
evolution of the sector from voice to higher data and
digital services revenue. Central to this effort is to
entrench our position at the cutting edge of
innovation in the sector.
The Group’s overall financial performance in 2015
reflected its resilience against a confluence of
challenging factors. Deteriorating economic
conditions, increased competition, heightened
regulatory pressure and operational issues in some
of our markets, particularly Nigeria and South Africa,
had a material negative impact on the Group’s
performance. Notwithstanding this difficult operating
environment, the Group grew its subscriber base by
4,1%, despite disconnecting 6,7 million customers
in Nigeria and 3,7 million in Uganda to comply with
subscriber registration requirements.
While overall Group revenue was flat year-on-year, an important feature of the revenue mix was the 33% increase in data revenue, in spite of effective data tariffs being 45% lower, as data traffic grew by more than 100%. This offset the 5% decline in voice revenue, which was primarily due to voice tariffs reducing by as much as a quarter. Headline earnings per share (HEPS) were down 14,3%** and reported HEPS fell 51,4%, materially impacted by the provision made for the Nigerian fine. The board declared a second half dividend of 830 cents per share (cps), to bring the total dividend for the year to 1 310cps, up 5% from the year before, having taken into consideration all matters pertinent to a cogent and sustainable dividend policy.
Understanding the dynamics in our operating contextThe Group’s experiences in 2015 brought into sharp
focus our role and responsibilities as a multinational and a major participant – in many instances a
pioneer – in the developing countries in which we operate. Our scale and reach as a leading mobile
network operator in many of our markets, and our contribution to their socio-economic development as
a provider of ICT, imposes on MTN a higher burden of national responsibility. While we are honoured
to play this role, it is crucial that we and indeed
all our stakeholders understand that it comes with demanding expectations, obligations and
challenges. It is incumbent upon us to navigate the complexities, manage the risks and balance the
often competing stakeholder expectations these
demands bring, especially in uncertain regulatory environments. We must also acknowledge the natural
inherent tension that exists between business and
regulators if markets are to operate effectively for
MTN Group Limited Integrated Report 2015
5
SETTING THE SCENE
the good of society, and find the optimal balance
necessary both to defend shareholder value and
contribute to national and regional development
objectives.
Although the regulatory landscape in our markets is
being redefined by more formalised frameworks and
more assertive regulators, inconsistencies between
different bodies of legislation and a lack of clarity
around regulatory parameters persist. This has included unpredictable tax regimes, with sudden tax increases being used to shore up fiscal positions as macro-economic pressures have intensified. More specifically, we have had to manage the impact of lower mobile termination rates, more scrutiny of network performance and associated penalties for not meeting agreed performance parameters, the renewal of licences whose terms are coming to an end, and the critical need to secure additional spectrum to ensure sufficient capacity to service customer growth and the increasing migration to data services.
In tandem with the heightened regulatory pressure, changing customer expectations and intensifying competition continue to change the competitive landscape. This has led to sharp declines in mobile communication tariffs, with irrational pricing among some players to defend their market shares. Lower pricing has in turn driven increased penetration and
traffic, while the adoption of more 3G and 4G devices has resulted in higher demand for data and improved data quality, putting pressure on available
network capacity.
As the convergence of telecommunications, IT and
adjacent industries such as banking, insurance, entertainment and publishing has continued,
delivering value-added services is providing operators with additional revenue opportunities and
an avenue to limit customer churn, even while the threat to traditional revenue streams from Over-the-
Top (OTT) providers continue to intensify. These new growth opportunities are being underpinned by
mobile being the de facto means of communication
and access point for internet-enabled services.
However, the cyclical volatility in macro-economic
conditions has continued to dampen growth prospects, with the global economy remaining weak
and characterised by a deep commodity and oil price slump. This has affected oil producing
economies in particular, although the general
weakness in global markets and heightened aversion
for higher risk emerging markets has undermined
economic growth across the board, and the financial
health of consumers and businesses alike. As
revenues have retreated, emerging market
currencies have also depreciated sharply, making it
difficult for MTN to repatriate dividends from
countries that have limited foreign exchange liquidity.
Acknowledging and addressing our challengesThe US$5,2 billion
† fine imposed by the Nigerian
Communications Commission (NCC) for the late disconnection of 5,1 million improperly registered subscribers, and its subsequent reduction at the NCC’s discretion to US$3,9 billion
†, was the most
material and multi-faceted challenge the Group faced in 2015. Months of intense engagement with the NCC led to a good faith payment of US$250 million
† to the Federal Government of
Nigeria on 24 February 2016, on the basis that this would be applied towards a settlement. Furthermore, we agreed to retract our legal action against the NCC in support of an environment conducive to reaching an amicable settlement on the matter. Negotiations are ongoing.
The Group is cognisant of the critical importance of ensuring regulatory compliance at all times. However, understanding the complexity of subscriber registration in Nigeria provides some insight into
what transpired in this instance.
From the operation’s inception in 2001, given that
some 99% of its customer base is prepaid, subscribers were almost entirely anonymous. In
2011, after a period of consultation, the NCC introduced a SIM registration process with the
enactment of formal regulations and technical specifications. Its objective was to create a central
national database of all users of telecommunication services to counter the abuse of mobile user
anonymity. Mobile network operators were tasked with rolling out facilities to register existing customers
nationwide, and in doing so encountered significant
difficulties. These included having to implement biometric standards akin to US immigration and FBI
standards in their complexity, infrastructural
constraints such as power supply and access to remote areas, as well as subscriber apathy and
social issues particularly in the north of the country. The NCC specifications also required equipment

6
MTN Group Limited Integrated Report 2015
such as fingerprint scanners that were not readily
available in the country. That said, our subsequent
engagement with the regulator has shown its
willingness to work with all operators to address the
difficulties encountered in this process.
Irrespective of these extenuating circumstances,
the board concluded that MTN Nigeria’s response to
the directives from the regulator pertaining to
improperly registered subscribers could have been handled differently and with a high sense of urgency.
Turning to some of the challenges that hampered our operational execution in the year, and linked to the subscriber registration issue, MTN Nigeria faced disruptions in the course of stringently enforcing the disconnection of 6,7 million subscribers following the imposition of the fine, which was followed by a further 4,5 million at the end of February 2016. By and large, improper registration is not a case of customers having no proof of identity but rather of incomplete forms. We continue to engage actively with subscribers to rectify this and reconnect them and this process is progressing well.
MTN Nigeria’s competitiveness was also compromised by the suspension of regulatory services in October 2015. This entailed the NCC withdrawing its approval of new tariff plans and promotions until certain tariff plans and promotions,
which were deemed to be linked to its determination of MTN as a “dominant operator”, were removed from the market.
In South Africa, management changes – some of which were effected in the prior year – and the
decisive action taken to strengthen MTN SA’s competitiveness began to bear fruit in the year.
However, the impact of the industrial action from May to July 2015 by the Communications Workers
Union (CWU) undermined these improvements. The strike, which continued for seven weeks, related to
disagreement on certain key resolutions put forward by the CWU. It caused considerable disruption to
MTN SA’s call and service centres as well as its
distribution agents and channels, in a period of heightened competition in the South African market.
Key outcomes of the agreement between MTN SA
and the CWU included a 12% bonus increase in 2016, irrespective of the Company’s performance,
the permanent employment of all casual workers and backdated payment for working on Sundays
and public holidays. MTN has subsequently taken a
decision to recognise the CWU which will enable
MTN South Africa to define a process and ensure a
constructive relationship.
The CEO of MTN SA, Ahmad Farroukh, resigned
and was succeeded by Mteto Nyati.
Decisive responses to reset the springboard for the futureTo significantly improve our ability to mitigate, to the extent possible, and manage the implications of our increasingly complex and uncertain operating context, we reviewed our operating structure with a view to strengthening operational oversight, leadership, governance and regulatory compliance across the Group. In the board’s view, a major contributory factor to the problems we faced in the year was that the Group’s reporting structure may have provided insufficient supervisory oversight of the operations.
To address this, we re-introduced the Group’s previous reporting structure, which clustered the operations according to region – West and Central Africa, South and East Africa, and Middle East and North Africa – with a senior executive responsible for each regional cluster. We also re-instated the position of Group COO, aimed at improving and optimising commercial effectiveness, while maintaining appropriate cost efficiency and consolidation, to ensure we have the operational platforms we need to
compete and grow in an increasingly revenue
constrained environment. The regional executives and the COO report directly to the Group CEO.
Re-introducing this management layer provides
narrower and concomitantly deeper executive focus across the Group’s wide geographic and operational
scope. The regional executives are tasked with operational supervision and ensuring accountability,
functional excellence and integration, specifically in the management of risk and stakeholder
relationships; in complement to the strategic, financial, human resources and stakeholder
management mandate of the Group CEO. The board
believes this structure will support a stronger culture of accountability and places the appropriate
emphasis on developing and maintaining
constructive stakeholder relationships.
A number of experienced executives with suitable track records and relevant industry and regional
A word from our executive chairman continued
MTN Group Limited Integrated Report 2015
7
SETTING THE SCENE
expertise were appointed in implementing this
structure. The CEOs of MTN South Africa,
MTN Nigeria and MTN Irancell, supported by the
respective regional executives, will retain a seat on
the MTN Group executive committee. Further senior
appointments will be made in due course to support
this structure, specifically a chief regulatory officer
who will also report directly to the Group CEO.
Our remedial actions have included redoubling our efforts to ensure that the effectiveness of our enterprise risk management is commensurate with our evolving risk universe, given the sweeping changes in our sector and in our operating environments. Furthermore, the importance of stakeholder management, and the protection of MTN’s reputation, have been elevated as part of our remedial actions – not only in terms of the new operating structure, which ensures sufficient top management focus on this crucial aspect of our sustainability, but also in including stakeholder management as a key performance indicator for the regional executives. All in all the board is confident that the operating structure and the calibre of the executives that have been appointed will ensure the depth of leadership and oversight required to regain trust and confidence, to manage risk and optimise the allocation of capital, to fulfil the expectations of our stakeholders and to make the improvements to our operational platforms from which we will be well
placed to pursue our vision, mission and strategy.
Turning our attention to our longer-term strategyWe stand at the doorway of a tectonic shift in our industry. The opportunities for growth, both for
MTN and for the countries in which we operate, are
vast as the change in the industry gathers momentum and voice gives way to data connectivity and its revolutionary implications for every aspect of
our lives.
In recognition of this opportunity, we refreshed
MTN’s vision to lead the delivery of a bold, new Digital World to our customers. We continue to refine
our strategic plans to realise this vision, compete
effectively and maintain our leadership position in our markets as the shift in the industry gathers pace.
With our digital strategy focused on three key areas
of opportunity, namely e-commerce, digital entertainment and media, and mobile financial
services, our ability to compete in these adjacent
markets is underpinned by our entrenched
differentiators.
As the largest pan-African mobile network operator,
we move from a strong position given our scale,
footprint and subscriber base. We are the biggest
operator and operate the best quality network in
many countries – we serve 232,5 million subscribers
across 22 countries, we have some 51,9 million
3G-enabled devices on the network, and over 32,4 million registered data users across the Group. Data services remain the key driver of revenue growth, and we continue to invest in expanding our 3G and LTE networks and stimulating the adoption of data-enabled devices. MTN remains a trusted brand among consumers; we know who our customers are and have well-developed distribution networks in place to reach them, which is key in the contested digital marketplace.
We have made good progress positioning our non-voice businesses, in particular through our investments in the digital services business, Africa Internet Holdings (AIH), our e-commerce venture which has been highly successful creating the largest online mall in Africa, Jumia. In 2015, AIH recorded approximately 2,3 million customers and approximately 4,4 million transactions in the year. The platform’s partner ecosystem has grown substantially with over 10 000 taxi drivers, 1 400 restaurants, 16 000 hotels, 4 000 global brands and
200 000 SMEs currently active on the marketplace
and classified properties. Our service delivery platform, which has more than 80 companies providing over 5 000 content services, makes us the
largest distributor of digital music in Africa.
MEIH, our Middle east internet venture in
Saudi Arabia, Jordan and the UAE, is one year old and is progressing well. The fastest growing parts of
the portfolio are Wadi, our e-commerce marketplace, and Easy Taxi. Average basket sizes in this region
are three to four times greater in value than those in our African operations, reflecting the higher
disposable incomes in the region. E-commerce is
projected to grow to a value of US$20 billion by 2018 in the Middle East. In Iran, our presence in
e-commerce is nascent but growing rapidly, particularly in the retail and travel sectors. This
exciting market is poised for significant growth
based on its demographics and improving macro-economic profile.
8
MTN Group Limited Integrated Report 2015
The use of mobile telephones to deliver basic
financial services and support participation in
economic systems represents a unique opportunity
for MTN to support the growth of cashless societies,
and help our customers overcome some of the
hurdles that exist in accessing and affordably using
traditional banking services. Our MTN Mobile Money
product range includes international remittances,
savings, lending and insurance, enabling customers
to access these services at lower costs. In the year we grew our customer base in this business by 56% to over 34 million customers in 15 markets. The business now contributes 17% to MTN Uganda’s total revenue and 6% each to MTN Ghana and MTN Rwanda’s total revenue. We continue to invest in upgrading our systems to ensure flexibility as services in this area expand, and are engaging closely with regulators as they tighten the relevant regulatory frameworks in some of our markets.
Our Enterprise Business Unit, which is present in 25 countries in Africa, continues to execute its strategy to become the ICT partner of choice to corporate, SME and public sector customers. Notwithstanding the constraints of challenging operating conditions, particularly in Nigeria and against fierce competition in South Africa, the business continues to gain traction. During the year it made good progress with the launch of Internet of Things and our Global Multiple Protocol Label Switching.
As we accelerate our digital strategy, building on the positive progress we have made, we will need to
systematically recalibrate the allocation of our capital and human resources. It is essential that we
understand the shift will not be peripheral but fundamentally transformative – not only will it involve
growing our data offerings to customers, but it will require that we become a fully digitally enabled
enterprise. In navigating this transformation, we cannot be bound by traditional telco thinking, but we
will need to think like a digital enterprise in capturing new and diversified revenue streams and in
leveraging new and profound operational
efficiencies, not least in managing risk and compliance more effectively.
Looking forwardWe are in the process of evolving the composition of the board as some long serving directors will not be
availing themselves for re-election. The succession
process will allow us to strike a balance in retaining
the institutional memory of existing board members,
with the fresh perspectives of new members
appointed specifically in view of the strategic
transformation of MTN and the skills and experience
required for the future. Mr Fani Titi (South African)
resigned as a non-executive director with effect from
31 December 2015, and the board thanks him for
his service to the Group over the three years of
his tenure.
A key priority for management in the coming months will be to embed the new operating structure and changes to the Group executive committee across the organisation. With the additional oversight and supervision made possible by the operating structure, we expect to be able to resolve many of the operational challenges we faced in the last year, while ensuring stringent compliance with regulatory requirements across all our operations, in particular with subscriber registration requirements.
The re-registering of the disconnected subscribers in Nigeria is ongoing. Given the complexity of this process, MTN Nigeria has invested significantly in the infrastructure and resources required – we are employing in excess of 16 000 devices and over 10 000 additional contract staff to complete the exercise, and buses are being used to access remote communities. We have also identified structural issues in the validation process used by the NCC and are engaging with the regulator to
address these through regular workshops, which will continue until the process is completed.
Also in Nigeria, we expect to improve our
competitiveness and operational performance in the year ahead. We expect the pressure on US dollar
liquidity to remain a challenge in the short to medium term, but are putting contingency plans in place to
ensure we are able to continue with the planned rollout of our network.
In South Africa, we expect the positive trend in
operational performance shown during the second
half of 2015 to continue. This will be underpinned by the strength of the leadership team, leveraging an
enhanced 3G/LTE device strategy, as well as a
concentrated focus on improving customer service.
The easing of sanctions in Iran and its related
economic uplift offers significant opportunities to expand our services in the country, particularly in
the digital space where we have a strong market
A word from our executive chairman continued
MTN Group Limited Integrated Report 2015
9
SETTING THE SCENE
position. We are working towards the remittance of
R15 billion during the first half of 2016.
Improving network quality and capacity in our key
markets remains a priority. Preparing for broadband
services, such as video on demand and music
streaming, will continue to be an important
consideration as we accelerate our digital strategy.
This will be done through the rollout of LTE and LTE
advanced in Nigeria, South Africa, Ghana and Cameroon. Improving quality and throughput in homes and fixed locations through the rollout of fibre-to-the-home in South Africa, Nigeria, Ghana and Iran, will be a focus in 2016.
The new operating structure, together with our strong platform, positions the Group well to take advantage of the paradigm shift in the mobile telecommunications sector. We are confident that our operations will continue to benefit from the strong growth trend in data, as well as from our investment in AIH and MEIH and related activities in the digital space.
Ensuring that we have the right skills and organisational culture to resource the Group’s strategic direction is paramount to our success in the years ahead. This will require that we recruit people who have experience in digital services, as well as equipping our people with the skill sets
needed to become a leading digital player. MTN’s culture, which is defined by innovation and “can do”, will serve us well in the digital era.
While 2015 was a difficult year for the Group we are cautiously optimistic that we will see improvements
in operating performance during 2016. The Group will continue to generate strong cash flows, and we
will seek to diversify our funding sources and increase the financial headroom available to us to
manage the liquidity risk that stems from not being able to repatriate dividends from certain of our
operations. Currency risk will continue to be actively managed.
In the year ahead, we will look to declare a minimum dividend of 700cps, taking the uncertainty regarding
the Nigerian fine and the US dollar liquidity situation
in Nigeria into consideration. This cautious approach to the dividend outlook aims to accommodate the
interests of shareholders and lenders, and the imperative of maintaining an investment grade credit
rating. This minimum dividend level remains at the
discretion of the board and, should operating
conditions improve, a higher dividend level will be
considered.
Although the Group operates in 22 countries, our
earnings remain highly concentrated in a few
markets with the associated volatility and risks as
has been evident over the last few years and
particularly in 2015. We will continue to explore
opportunities to address this over the medium term.
A true test of our characterIt is important that MTN’s people take on board the lessons of this time, that we do not allow negativity to cloud our judgement or take our eyes off business as usual. My thanks go to all of our people for demonstrating the true character of this organisation in this defining time.
We appreciate the ongoing support of our employees, shareholders, regulators and governments notwithstanding the disappointment you must feel after the last year. The MTN Group remains committed to maintaining solid partnerships with all of our stakeholders to build a sustainable business that delivers competitive long-term value.
Our ability to acknowledge and address the failures of the last year, in a way that ensures our readiness for the strategic journey we envisage in the years ahead, has given us the opportunity to affirm that we
are an organisation that is able to face its challenges, address its failures and do what is necessary to remedy these in a way that makes us stronger than
we were before.
Phuthuma Nhleko
Group executive chairman2 March 2016
10
MTN Group Limited Integrated Report 2015
Key changes to our operating structure
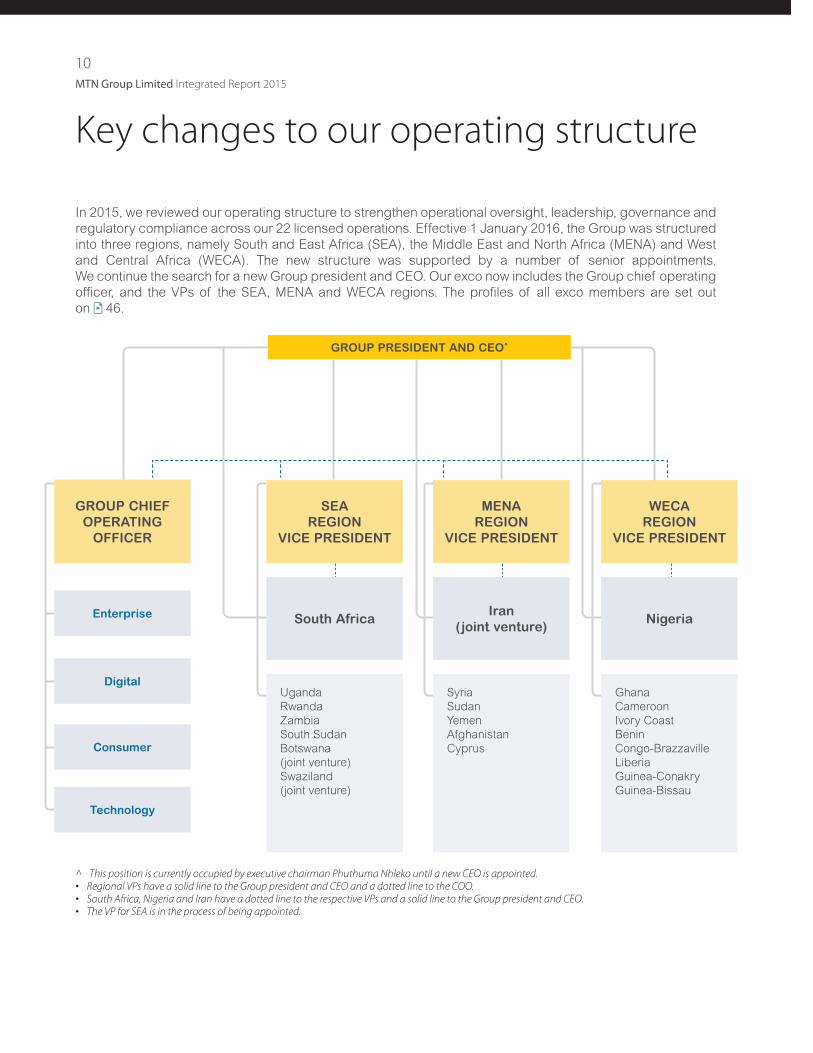
In 2015, we reviewed our operating structure to strengthen operational oversight, leadership, governance and
regulatory compliance across our 22 licensed operations. Effective 1 January 2016, the Group was structured
into three regions, namely South and East Africa (SEA), the Middle East and North Africa (MENA) and West
and Central Africa (WECA). The new structure was supported by a number of senior appointments.
We continue the search for a new Group president and CEO. Our exco now includes the Group chief operating
officer, and the VPs of the SEA, MENA and WECA regions. The profiles of all exco members are set out
on 46.
^ This position is currently occupied by executive chairman Phuthuma Nhleko until a new CEO is appointed.• Regional VPs have a solid line to the Group president and CEO and a dotted line to the COO.• South Africa, Nigeria and Iran have a dotted line to the respective VPs and a solid line to the Group president and CEO.• The VP for SEA is in the process of being appointed.
SEA
REGION
VICE PRESIDENT
Uganda
Rwanda
Zambia
South Sudan
Botswana
(joint venture)
Swaziland
(joint venture)
Enterprise
Digital
Consumer
Technology
Syria
Sudan
Yemen
Afghanistan
Cyprus
Ghana
Cameroon
Ivory Coast
Benin
Congo-Brazzaville
Liberia
Guinea-Conakry
Guinea-Bissau
GROUP CHIEF
OPERATING
OFFICER
MENA
REGION
VICE PRESIDENT
WECA
REGION
VICE PRESIDENT
GROUP PRESIDENT AND CEO^
South AfricaIran
(joint venture)Nigeria
MTN Group Limited Integrated Report 2015
11
SETTING THE SCENE
Our material issues in 2015
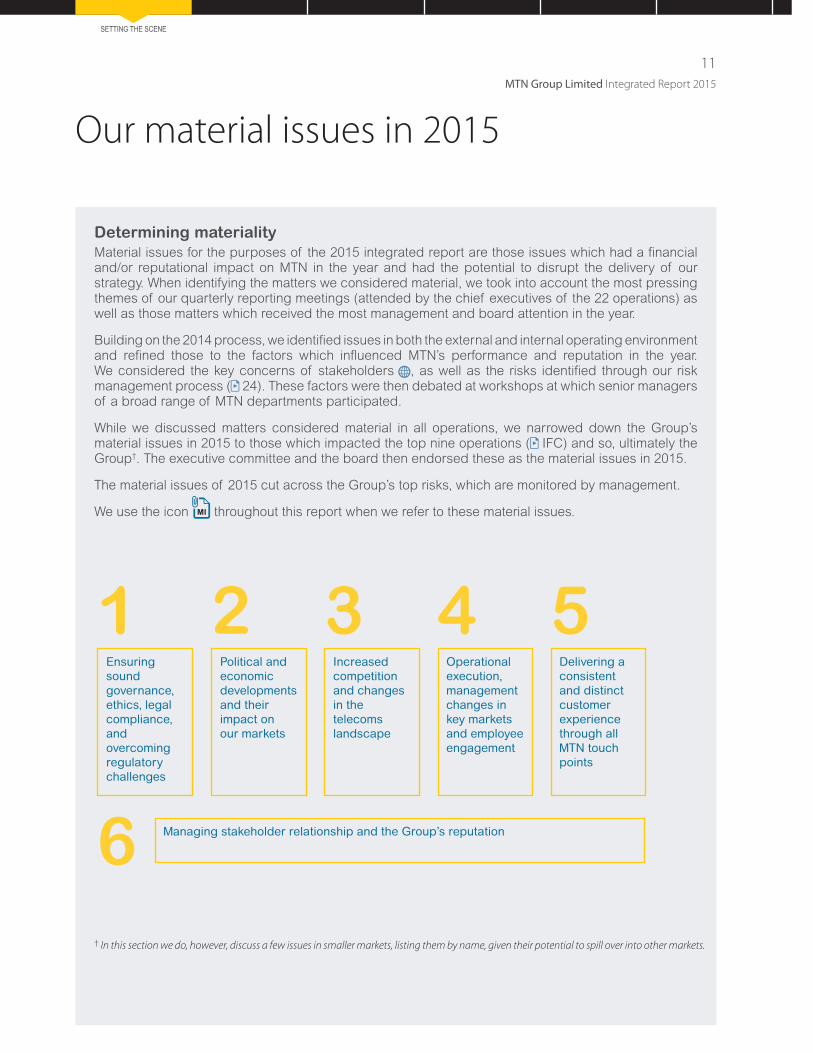
Determining materiality
Material issues for the purposes of the 2015 integrated report are those issues which had a financial and/or reputational impact on MTN in the year and had the potential to disrupt the delivery of our strategy. When identifying the matters we considered material, we took into account the most pressing themes of our quarterly reporting meetings (attended by the chief executives of the 22 operations) as well as those matters which received the most management and board attention in the year.
Building on the 2014 process, we identified issues in both the external and internal operating environment and refined those to the factors which influenced MTN’s performance and reputation in the year. We considered the key concerns of stakeholders , as well as the risks identified through our risk management process ( 24). These factors were then debated at workshops at which senior managers of a broad range of MTN departments participated.
While we discussed matters considered material in all operations, we narrowed down the Group’s material issues in 2015 to those which impacted the top nine operations ( IFC) and so, ultimately the Group†. The executive committee and the board then endorsed these as the material issues in 2015.
The material issues of 2015 cut across the Group’s top risks, which are monitored by management.
We use the icon throughout this report when we refer to these material issues.
1
6
2 3 4 5Ensuring sound governance, ethics, legal compliance, and overcoming regulatory challenges
Managing stakeholder relationship and the Group’s reputation
Political and economic developments and their impact on our markets
Increased competition and changes in the telecoms landscape
Operational execution, management changes in key markets and employee engagement
Delivering a consistent and distinct customer experience through all MTN touch points
† In this section we do, however, discuss a few issues in smaller markets, listing them by name, given their potential to spill over into other markets.
12
MTN Group Limited Integrated Report 2015
Across our markets, regulatory pressure continued to increase. This included greater customer SIM card registration requirements. MTN Nigeria disconnected 6,7 million subscribers in 2015. In November and December 2015 MTN Uganda disconnected 3,7 million subscribers who did not fully comply with the subscriber registration requirements.
Impact on MTN in 2015Subscriber net additions for the year were impacted negatively, eroding the market share of MTN Nigeria and MTN Uganda.
Action taken by MTN We worked to improve our relations with regulators, and all stakeholders. We focused on enhancing our regulatory compliance processes, including greater use of biometrics to improve subscriber registration. In Nigeria, we set up additional registration points and invested approximately US$20 million in new systems and hardware in the year.
During October 2015, the Nigerian regulator imposed a N1,040 trillion fine on MTN Nigeria, subsequently reduced to N780 billion (equivalent to approximately US$3,9 billion using the exchange rate prevailing at the time). This related to the late disconnection of the 5,1 million subscribers whose registration documents were considered incomplete. The factors related to the disconnection of these Nigerian subscribers and the fine provided an opportunity to review the implementation of our policies and procedures.
Impact on MTN in 2015The imposed fine eroded investor confidence in MTN Nigeria and the Group as a whole, and negatively impacted the reputation of MTN across our stakeholder groups. Between 26 October and 31 December 2015, MTN Group’s market capitalisation declined by 20%. The Group CEO, MTN Nigeria’s CEO and MTN Nigeria’s regulatory head left the Group in 2015.
MTN Nigeria recorded a R9 287 million provision for the fine at the end of the reporting period, negatively impacting reported EBITDA by 13,6%** and HEPS by 402 cents. Management has applied its judgement in determining the provision in accordance with IFRS.
Action taken by MTN We continue to engage with the Nigerian authorities to ensure an amicable resolution in the best interests of the Company, its stakeholders and the Nigerian authorities. On 24 February 2016, MTN Nigeria made an agreed, without prejudice, good faith payment of 50 billion naira (US$250 million) to the Federal Government of Nigeria on the basis that this will be applied towards a settlement, when one is eventually, hopefully arrived at. MTN also agreed to withdraw the matter from the Federal High Court in Lagos. In early December we announced a change in the Group’s operating structure, recognising the need for stronger Group oversight over the operations. The new structure, effective in 2016, combined with new leadership, endeavours to provide that ( 10). The Group appointed PF Nhleko ( 44) as executive chairman in a temporary capacity upon the resignation of the Group CEO with a mandate to resolve the Nigerian fine issue and appoint a new CEO. In addition the Group has also implemented a new regulatory and compliance structure ( 54). We worked to re-inforce the Group culture and values ( 13) which encompass complete accountability and candour, as well as the escalation of material issues to MTN Group and Group board level.
Our material issues in 2015 continued
Ensuring sound governance, ethics, legal compliance and overcoming regulatory challenges1}
MTN Group Limited Integrated Report 2015
13
SETTING THE SCENE
The Nigerian regulator’s 2013 ruling declaring MTN Nigeria a “dominant operator” continued to impact MTN Nigeria’s commercial success.
Impact on MTN in 2015This continued to limit MTN’s commercial success, hampering our ability to be competitive in Nigeria in 2015 ( 34). In October 2015, the regulator suspended regulatory services to MTN Nigeria. Under this suspension the regulator could use its discretion on services provided to MTN Nigeria until certain tariff plans and promotions were removed from the market. The regulator has subsequently, in March 2016, re-instated services to MTN Nigeria.
Action taken by MTN We continued to engage with regulatory authorities to determine the parameters of the “dominant operator” ruling and to ensure that it does not further impact growth of MTN, which has invested significantly in the Nigerian network over the past 15 years.
In some markets, requirements for foreign companies to broaden local ownership of their subsidiaries through listings on local stock exchanges remained a feature.
Impact on MTN in 2015Any listing of a large MTN operation could lead to a dilution of MTN earnings. However, this needs to be weighed up against the benefits that greater local representation could bring.
Action taken by MTN We continued to evaluate opportunities and appropriate mechanisms to ensure broader local ownership, including in key markets such as Nigeria. However, market conditions and the operating environment need to be conducive before any listing is pursued. MTN Ghana must have a minimum of 35% Ghanaian ownership in place by January 2017. This is a requirement of it winning the auction for a 4G/LTE licence. MTN South Africa is committed to supporting transformation in the country by, among others, partnering with black economic empowerment entities in our sourcing activities.
Media reports questioned MTN’s compliance with new international tax rules issued by the Organisation for Economic Co-operation and Development in October. These rules seek to change the tax system that is seen to allow multinationals to reduce their effective tax rate in a jurisdiction without corresponding reduction in value-creating economic activities.
Impact on MTN in 2015This has caused the Group some reputational damageand increased regulatory scrutiny, influenced by mediainterpretation.
Action taken by MTNWe conducted an independent assessment and are confident of our compliance with these tax legislations. In 2015, we made further improvements in our tax disclosure, providing stakeholders with more transparency. A full tax report is available on .
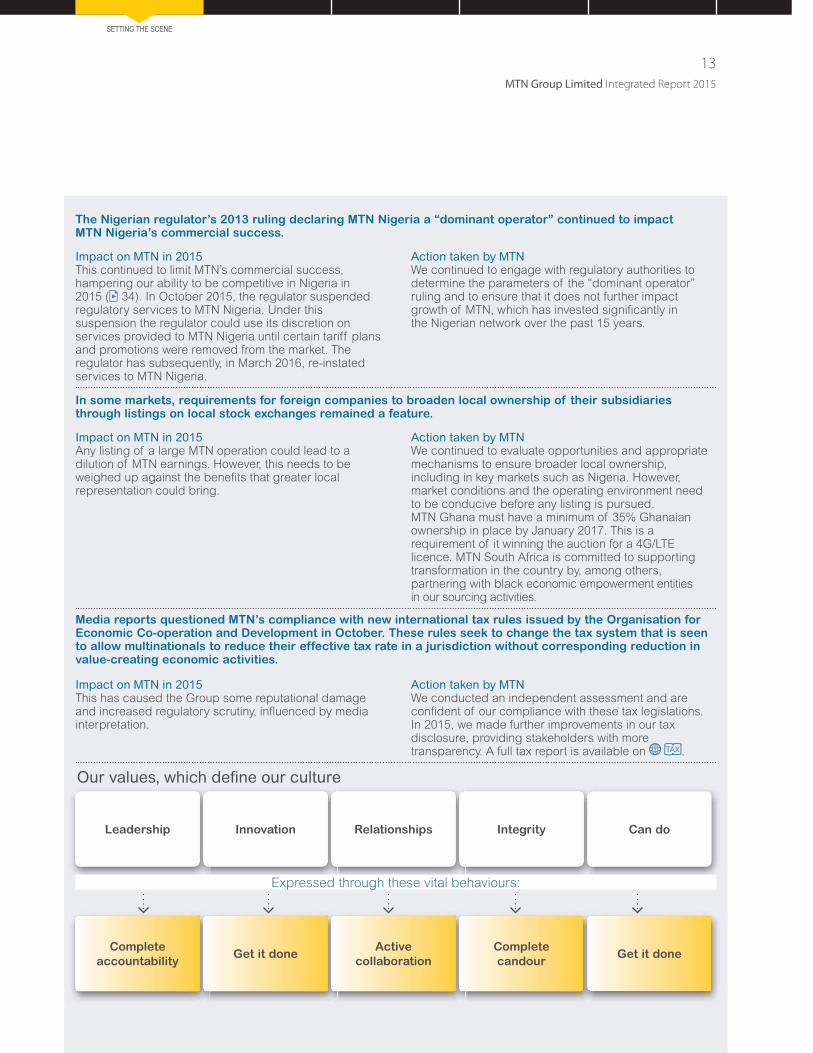
Our values, which define our culture
Complete
accountabilityGet it done
Active
collaboration
Complete
candourGet it done
Leadership Innovation Relationships Integrity Can do
Expressed through these vital behaviours:

14
MTN Group Limited Integrated Report 2015
Our material issues in 2015 continued
The global economy remained weak, with slower demand for commodities and an oil surplus hurting the economies and currencies of commodity and oil exporters, including South Africa, Nigeria, Iran, Sudan and Ghana. Currencies across our footprint depreciated in the year. In some markets, authorities introduced more taxes to make up for declining oil and commodity income . (For the economic landscape in key MTN markets see graphic on 15.)
Impact on MTN in 2015The decline in disposable incomes and consumer expenditure impacted growth in MTN revenue and margins. Foreign exchange market volatility made MTN’s US dollar-denominated debt more expensive and had a negative impact on the translation of reported results ( 30). It increased the cost of capital equipment, and also affected our ability to remit dividends to the Group.
Action taken by MTN We continued to prioritise prudent financial management, and to endeavour to repatriate earnings from operations while taking into account their capital structure as well as local regulations. In addition, MTN continued to raise funding in local currency where possible as a natural hedge against moves in the US dollar. We also continued to work hard to shift US-dollar capex and opex into local currency.
We endeavoured to persuade authorities that increased taxes are a short-term remedy, and could harm the continued growth of the sector which is a major contributor to the fiscus of many of these countries.
Elections in Nigeria led to the peaceful handover of power to a new president. The sharp fall in oil revenues put pressure on the naira and reduced the availability of hard currency.
Impact on MTN in 2015The peaceful transition was good for the country, and our business, although uncertainty over the extent of the naira’s depreciation, along with currency restrictions, led to difficulties in repatriating funds from Nigeria, and made it hard to make payments on US dollar-denominated debt ( 30).
Action taken by MTN We engaged constructively with Nigerian authorities in support of the new government’s national priorities relating to the telecommunications industry. We continued to engage with the Central Bank of Nigeria regarding the availability of hard currency and explored, and are still exploring, alternatives to solve this issue.
In July, Iran reached a landmark nuclear deal with six world powers, opening the way for a phased lifting of nuclear-related economic and financial sanctions from January 2016.
Impact on MTN in 2015The deal should assist the economy broadly. It increased the potential for MTN Group to repatriate dividends and outstanding loan funding from our operation in Iran, with due consideration to capital and forex requirements. At year end, MTN held cash of R15 860 million in Iran ( 37).
Action taken by MTN We continued to participate in high-level engagements with the relevant authorities regarding sanctions and the repatriation of dividends and outstanding loan funding. We also expanded our offerings, including the establishment of an enterprise business unit in Iran.
In December, the rand depreciated significantly against the US dollar.
Impact on MTN in 2015This impacted MTN’s share price negatively.
Action taken by MTN MTN continued to monitor the fluctuation in the rand and its impact on the economy, with appropriate actions taken to minimise the impact on the Group.
The civil war in Syria escalated and unrest continued in parts of Nigeria, Sudan, Cameroon, Yemen and Afghanistan, among others.
Impact on MTN in 2015This continued to impact MTN’s financial and operating metrics in these markets.
Action taken by MTN Without compromising the safety of our employees, we continued to offer telecoms services in challenging environments, even amid conflict, with careful contingency planning and business continuity management ( 57).
Political and economic developments and their impact on our markets2}

MTN Group Limited Integrated Report 2015
15
SETTING THE SCENE
With increased pressure on consumer spending and the non-conventional players competing for a greater share of the consumer wallet, traditional telecommunications players continued to cut their tariffs in an effort to increase their market share. In many markets competitors cut their tariffs to below cost.
Impact on MTN in 2015Voice tariffs declined by 25% across MTN’s operations in the year (average price per minute in US dollar terms). The Group’s effective data tariff (in US dollar terms) declined by 45%. This put pressure on growth in revenue and profitability in many markets.
Action taken by MTN To remain relevant to customers, as well as competitive, we reduced tariffs. We pursued various other revenue-generating opportunities to make up for revenue foregone as a result of this. We continued work to diversify our earnings through developing new opportunities in digital, enterprise and financial services. Dedicated Group Consumer, Group Digital Services and Group Enterprise divisions are now fully functional to ensure that we are well positioned to participate in the rapidly evolving industry and to effectively meet our customers’ needs with regards to digital, financial and enterprise services. We partnered with various content providers and continued to focus on expanding our e-commerce venture. During the year we appointed various new specialists to drive these new initiatives. We invested a total of R29 billion in capex ( 20, 42, 96 and 22).
As the demand for data services increases so too does the need for additional spectrum. The biggest challenge we faced was in the South African market, where additional spectrum is required for the rollout of LTE services. 800MHz and 2,6GHz spectrum is currently not available to telecommunications operators. In the year we secured additional spectrum to drive LTE/4G services in Nigeria and Ghana.
Impact on MTN in 2015Spectrum shortages limit our ability to provide more customers with broadband services and faster data speeds, and so limit profitability.
As a short-term solution MTN has embarked on re-farming its existing spectrum in South Africa to provide improved LTE services to customers although this is more costly and caused disruptions in the network in the year ( 32).
Action taken by MTN Additional spectrum is crucial to the long-term growth of the operation. In an effort to better utilise available spectrum MTN South Africa entered into a bilateral roaming agreement with Telkom Limited, South Africa’s fixed-line operator. However, this was blocked by the Competition Commission. The regulator ICASA has issued an information memorandum on auctioning 700MHz, 800MHz and 2,6GHz spectrum, which we support. We are also working with relevant authorities to shape South Africa’s broadband policy. In Nigeria, MTN acquired Visafone. This, along with the acquisition of a 4G/LTE licence and digital TV spectrum, will provide us with access to sufficient spectrum to roll out LTE services. In Ghana, in an auction process we bought a 15-year 4G/LTE licence in the 800MHz spectrum band which enables us to offer 4G/LTE services.
30
20
10
1,5 1,36,3
2,9 4,30,8
4,0 3,65,5 5,2
7,9 8,44,9 5,9
23
5,2
19
2,0
20
9,013
4,6
15,1
27
17,219
1,4
0CameroonGhanaIranSouth
AfricaNigeria UgandaIvory
Coast
GDP growth 2014 (%)
GDP growth 2015 (%)
Inflation (%)Change in
average forex rate against USD (%)
The economic landscape in key MTN markets
12
Source: Various
Increased competition and changes in the telecoms landscape3}
16
MTN Group Limited Integrated Report 2015
Our material issues in 2015 continued
As competition intensified in the year and the business continued to evolve towards more data-related services, MTN faced lower than expected performance in parts of the business, particularly Nigeria. However, actions taken to address poor operational performance in South Africa in 2014 bore fruit.
Impact on MTN in 2015In Nigeria, growth in data services and consequently data revenue was constrained as a result of an uncompetitive data network. MTN Nigeria data revenue increased only 18,8%* in the year, limiting growth in overall MTN Nigeria and MTN Group revenue. MTN South Africa improved its operational performance, with increases in revenue, supported by a number of management changes – some in 2014 – as well as increased capital expenditure with a key focus on improving its 3G and LTE network. In South Africa, data revenue increased 37% as a result of better quality 3G and LTE networks ( 32).
Action taken by MTN To strengthen operational oversight, in December we announced that we would re-implement our previous reporting structure, with vice presidents for each of the three regions, and the re-instatement of the Group chief operating officer ( 10). In Nigeria, MTN made a number of management changes to address the lower than expected performance. This includes the creation of a chief operations officer role. We increased capex in South Africa by 92,9% to R10,9 billion, rolling out 966 2G, 1 593 co-located 3G and 3 148 co-located LTE sites. In July 2015, we appointed a new MTN South Africa CEO. More detail on operational performance can be found on 32.
In the year, members of the Communications Workers Union went on an extended strike in South Africa over bonuses and salary adjustment policies.
Impact on MTN in 2015The functioning of MTN South Africa’s call centres was disrupted, affecting customer service. Employee morale and Group reputation were adversely affected. However, the result of the resolution of the industrial action was ultimately good, with greater staff engagement and recognition of trade unions.
Action taken by MTN We recognised that the prioritisation of the people and culture agenda was required, and that performance management needed to be more effective, and employee development strengthened. Acknowledging the need to ensure that talent management processes evolve to support MTN’s core and new businesses, we embarked on transforming our approach to hiring, developing, leading and managing performance of our people at all levels and cultivating a culture and environment of innovation throughout the business ( 66). The Company has also taken a decision to recognise the Communications Workers Union which will enable MTN South Africa to define a process and to ensure a constructive relationship going forward.
Operational execution, management changes in key markets and employee engagement4}
MTN Group Limited Integrated Report 2015
17
SETTING THE SCENE
Customer experience was negatively affected by slow data network speeds in MTN Nigeria, and disruptions in the network in South Africa, while upgrades were being made. The increase in the out-of-bundle data tariff by MTN South Africa led to customer complaints of incorrect billing. Customer registration requirements in a number of markets were considered an inconvenience by many subscribers. The subsequent disconnection of unregistered subscribers (in Nigeria and Uganda in particular) also impacted customer experience.
Impact on MTN in 2015Increased customer churn and greater use by customers of multiple SIM cards affected growth in MTN’s revenues and profitability. This also caused some damage to MTN’s reputation.
Action taken by MTN We continued to work at improving the customer experience at all touch points, improving communication with customers through the introduction of notifications and alerts when they incur data costs and once their data bundles are depleted. We implemented an evolved operating structure to harness opportunities in innovation, and to increase our focus to ensure that our business grows and meets the needs of customers. We continued to invest in rolling out infrastructure and improving coverage across our markets, ensuring that we provide quality and capacity to our customers ( 10). In nine opcos, including Nigeria, we outsourced call centres and introduced new systems to improve their performance.
Delivering a consistent and distinct customer experience through all MTN touch points5}
Managing stakeholder relationships and the Group’s reputation6}
In 2015, each of the events detailed in material issues 1 to 5 had an adverse impact on the reputation and the stakeholders of the Company in one way or another. This was seen in various measures, including media commentary, the Group’s share price, customer and employee feedback and action, as well as interactions with governments and regulators.
Impact on MTN in 2015The perception of MTN as a company was impacted by various reports in the media concerning some of the challenges faced by management during the year. This had an adverse effect on the Group’s reputation and share price.
MTN’s stakeholder universe includes Group and operations shareholders, governments, regulators, customers, communities and civil societies, suppliers, media, industries and employees.
Our key relationships.
Action taken by MTN In the year, we introduced a new quarterly reporting protocol aligned to the AA1000SES Stakeholder Engagement Standard. We grouped our stakeholders into 10 groups, and in each opco the corporate affairs manager implemented greater monitoring and measurement of our stakeholder engagements. However, events later in the year – in particular the Nigerian fine – showed that stakeholder reporting lines did not facilitate enough hands-on guidance to operations, impacting information flow to the Group.
Acknowledging the real role that stakeholder management plays in sustaining our business, the Group heightened stakeholder engagement and provided operations with closer supervision through regional reporting and support under three vice presidents ( 10). In addition, reputation and stakeholder management will, from 2016, be included as key performance indicators of these three positions.
For details on how we engage with our stakeholders, see Online stakeholder engagement.
18
MTN Group Limited Integrated Report 2015
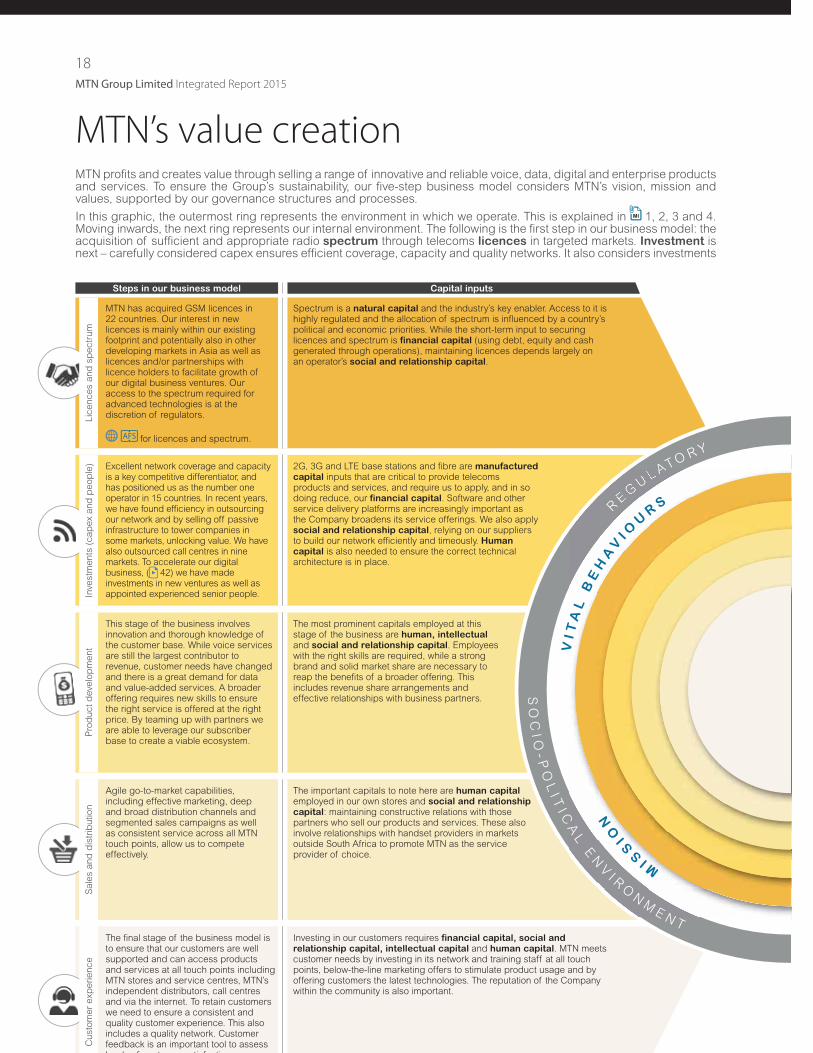
MTN’s value creation
Steps in our business model Capital inputs
MTN has acquired GSM licences in 22 countries. Our interest in new licences is mainly within our existing footprint and potentially also in other developing markets in Asia as well as licences and/or partnerships with licence holders to facilitate growth of our digital business ventures. Our access to the spectrum required for advanced technologies is at the discretion of regulators.
for licences and spectrum.
Spectrum is a natural capital and the industry’s key enabler. Access to it is highly regulated and the allocation of spectrum is influenced by a country’s political and economic priorities. While the short-term input to securing licences and spectrum is financial capital (using debt, equity and cash generated through operations), maintaining licences depends largely on an operator’s social and relationship capital.
Agile go-to-market capabilities, including effective marketing, deep and broad distribution channels and segmented sales campaigns as well as consistent service across all MTN touch points, allow us to compete effectively.
The important capitals to note here are human capital employed in our own stores and social and relationship
capital: maintaining constructive relations with those partners who sell our products and services. These also involve relationships with handset providers in markets outside South Africa to promote MTN as the service provider of choice.
The final stage of the business model is to ensure that our customers are well supported and can access products and services at all touch points including MTN stores and service centres, MTN’s independent distributors, call centres and via the internet. To retain customers we need to ensure a consistent and quality customer experience. This also includes a quality network. Customer feedback is an important tool to assess l l f t ti f ti
Investing in our customers requires financial capital, social and
relationship capital, intellectual capital and human capital. MTN meets customer needs by investing in its network and training staff at all touch points, below-the-line marketing offers to stimulate product usage and by offering customers the latest technologies. The reputation of the Company within the community is also important.
Excellent network coverage and capacity is a key competitive differentiator, and has positioned us as the number one operator in 15 countries. In recent years, we have found efficiency in outsourcing our network and by selling off passive infrastructure to tower companies in some markets, unlocking value. We have also outsourced call centres in nine markets. To accelerate our digital business, ( 42) we have made investments in new ventures as well as appointed experienced senior people.
2G, 3G and LTE base stations and fibre are manufactured capital inputs that are critical to provide telecoms products and services, and require us to apply, and in so doing reduce, our financial capital. Software and other service delivery platforms are increasingly important as the Company broadens its service offerings. We also apply social and relationship capital, relying on our suppliers to build our network efficiently and timeously. Human
capital is also needed to ensure the correct technical architecture is in place.
This stage of the business involves innovation and thorough knowledge of the customer base. While voice services are still the largest contributor to revenue, customer needs have changed and there is a great demand for data and value-added services. A broader offering requires new skills to ensure the right service is offered at the right price. By teaming up with partners we are able to leverage our subscriber base to create a viable ecosystem.
The most prominent capitals employed at this stage of the business are human, intellectual
and social and relationship capital. Employees with the right skills are required, while a strong brand and solid market share are necessary to reap the benefits of a broader offering. This includes revenue share arrangements and effective relationships with business partners.
RE
GU
L AT O R Y
EG
UL AT
RE
MIS
SIO
N V
IT
AL
B
EH
AV
I OU
RS
IS
SI O
SO
CIO
-P
OL
I TI C
AL
EN
V
I RO
NM
E N T
Inve
stm
en
ts (
ca
pex a
nd
pe
op
le)
Pro
du
ct
deve
lop
me
nt
Sale
s a
nd
dis
trib
ution
Custo
me
r exp
eri
en
ce
Lic
en
ce
s a
nd
sp
ec
tru
m
MTN profits and creates value through selling a range of innovative and reliable voice, data, digital and enterprise products and services. To ensure the Group’s sustainability, our five-step business model considers MTN’s vision, mission and values, supported by our governance structures and processes.
In this graphic, the outermost ring represents the environment in which we operate. This is explained in 1, 2, 3 and 4. Moving inwards, the next ring represents our internal environment. The following is the first step in our business model: the acquisition of sufficient and appropriate radio spectrum through telecoms licences in targeted markets. Investment is next – carefully considered capex ensures efficient coverage, capacity and quality networks. It also considers investments

MTN Group Limited Integrated Report 2015
19
SETTING THE SCENE
Capital outputs and outcomes 2015 data**
The telecoms sector is an important facilitator of economic development. It contributes directly through regulatory fees and taxes (financial capital) and indirectly by providing access to services which keep people connected (social capital), support entrepreneurship (human capital) and economic activity. By facilitating the growth of a myriad of new services, it also supports intellectual capital.
A wide distribution network ensures that the majority of the population has access to our products and services. It also means employment for people: either directly or through entrepreneurs who we often assist financially at start up. Both these enhance the stock of human and social and
relationship capital.
In many countries, mobile operators provide the only means of telecommunications. By providing this, MTN allows people to enhance the quality of their lives and businesses to improve their opportunities. By helping to close the digital divide (including through our CSI work) we boost stocks of human, social and financial capital. At a micro-economic level, our products and services (including telemetry) help businesses manage costs, improve efficiencies and reduce their environmental impact. This has a positive impact on manufactured and natural capital and ultimately financial capital.
By establishing a high quality network, MTN has been able to offer its subscribers a range of innovative products and services and has built its brand, boosting the stocks of intellectual
capital. The trade-off for this manufactured
capital is financial capital although some of this has been returned with the sale of towers in various markets. Infrastructure sharing helps mitigate our impact on the stock of natural
capital (land, air and water).
Developing the right product at the right price is critical to ensure a profitable business. Although this has negative implications for the stock of financial
capital in the short term, ultimately this increases. MTN is often one of the largest employers in the countries where we operate (social and relationship capital and human capital) and provides training to ensure that staff is adequately equipped with the right skills. This increases the stock of intellectual capital.
Regulators with whom we interact 22
Value of licences R19,100 million
Regulatory fees paid R3,673 million
Taxes paid R13,506 million
Countries in which we have a presence 25
Total dividends declared R24 billion
Net finance cost R3,0 billion
Interest-bearing liabilities R75,171 million
Market capitalisation on the JSE R245 billion (31 December)
Commissions and distribution costs R11,8 billion
Other operating expenses R11,4 billion
E-waste re-cycled 534,5 tonnes
Voice subscribers 232,5 million
Data users 108,3 million
Mobile Money subscribers 34,7 million
CSI spend R335,4 million
Intangible assets R55,9 billion
Net promoter score South Africa 78%
Net promoter score Nigeria 14%
E N V I R ON
ME
N
T
R ON
MEE
N
T
Licences and sp
ectrum
G OV
ER
NA
NC
E V
AL
UE
S V
ISION
Licencesand
spec
A
N
Investments (c
ap
ex a
nd
peop
le)
Investments
Product d
evelo
pm
ent
Produ
Sale
s and
dis
tri butio
n
Custo
mer e
xp
erience
EC
O
NO
MI C
EN
VIR
ON
ME
NT
made to facilitate the expansion of new revenue streams, while investment in people ensures we have the appropriate skills to deliver our strategy. The next step is product development: ensuring the right products at the right prices. Sales and distribution is the subsequent step: we establish and maintain a wide and deep distribution network and foster sound partnerships.
Ultimately, all these lead to the heart of our business model: creating a distinct customer experience – we work to attract and retain our customers. By optimising each step in this business model, which involves some capital trade-offs, MTN is able to generate profits and do so in a sustainable way, with positive financial implications for providers of capital, including through dividends and share buy-backs.
Rolled out 3 116 2G sites
Rolled out 7 891 3G sites
Rolled out 5 241 LTE sites
Rolled out 1 469km of fibre
Carbon emissions 1 589 888
Emissions avoided/reduced 7 947 tonnes
Capex R29,6 billion
Cash generated through operations R57,6 billion
Value of property, plant and equipment R106,7 billion
Employee numbers 21 084
Staff costs R8,6 billion
Spending on training R223 million
Investments in JVs and associates R35,6 billion
Most admired brand in Africa 1
Most valuable African brand 1
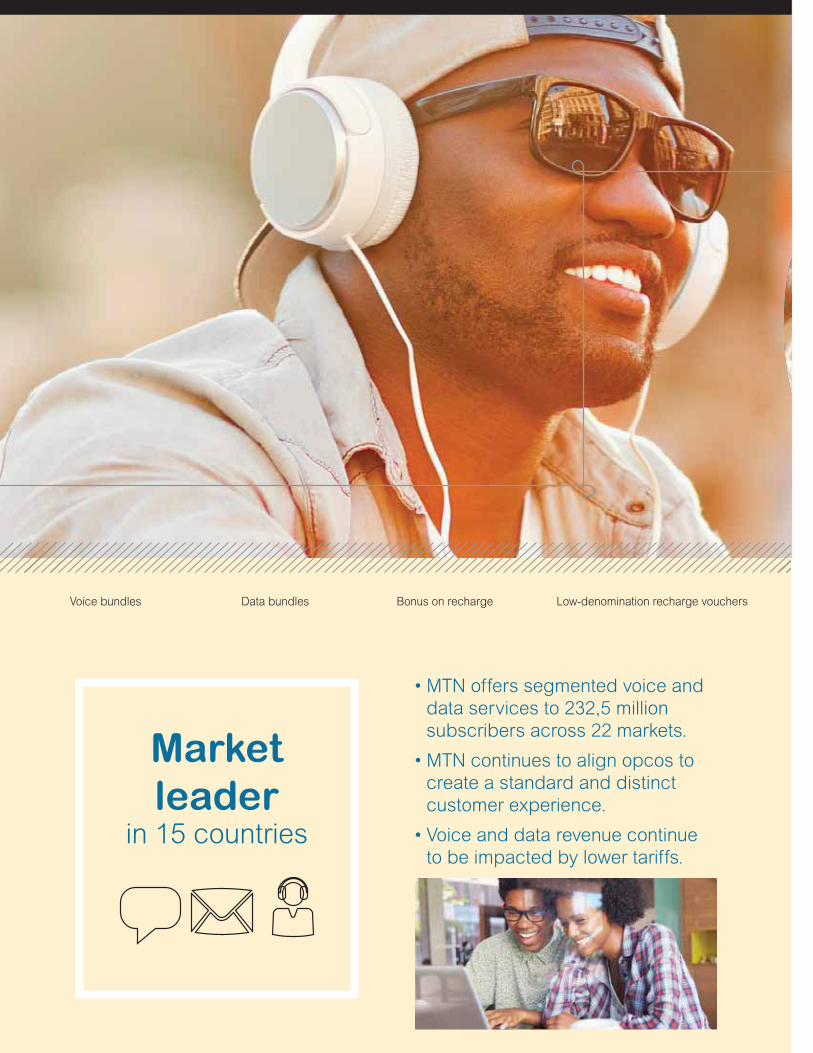
Low-denomination recharge vouchers
• MTN offers segmented voice and
data services to 232,5 million
subscribers across 22 markets.
• MTN continues to align opcos to
create a standard and distinct
customer experience.
• Voice and data revenue continue
to be impacted by lower tariffs.
Market
leader in 15 countries
Voice bundles Data bundles Bonus on recharge
MTN Group Limited Integrated Report 2015
21
DETERMINING OUR STRATEGIC PATH
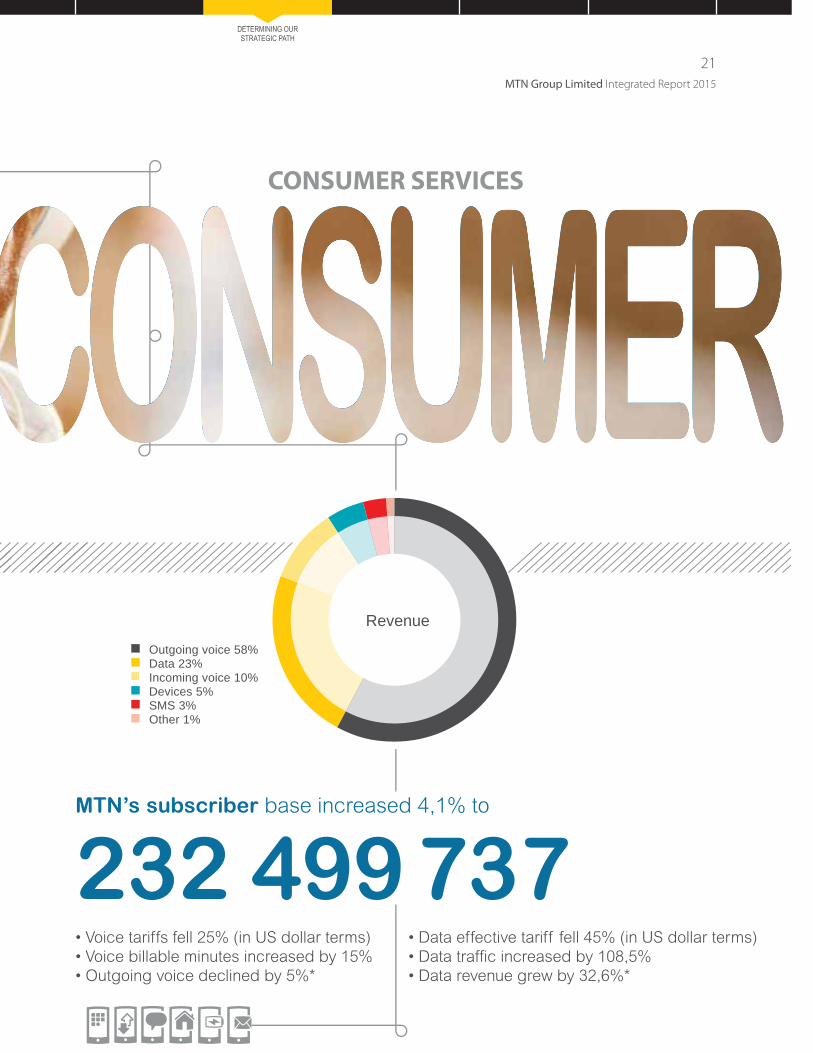
CONSUMER SERVICES
MTN’s subscriber base increased 4,1% to
232 499 737• Data effective tariff fell 45% (in US dollar terms)
• Data traffic increased by 108,5%
• Data revenue grew by 32,6%*
• Voice tariffs fell 25% (in US dollar terms)
• Voice billable minutes increased by 15%
• Outgoing voice declined by 5%*
Revenue
Outgoing voice 58%Data 23%Incoming voice 10%Devices 5%SMS 3%Other 1%

22
MTN Group Limited Integrated Report 2015
Our strategy
MTN’s strategy is built around five strategic themes: Creating and managing stakeholder value and
innovation and best practice sharing describe our approach to our work, people and other stakeholders.
Tangible priorities under creating a distinct customer experience, driving sustainable growth
and transforming our operating model define how we strive to secure a sustainable competitive advantage
and deliver superior shareholder returns.
Transforming
our operating
model
Creating a distinct
customer experience
Driving sustainable
growth
Innovation and best practice
Creating and managing
stakeholder value
Creating value for our shareholders, employees and communities in a sustainable way in
accordance with the values of MTN
Operating under the principle of innovation in everything we do and looking for opportunities to share
and apply best practice
A unique customer experience based on knowing and
segmenting our customers
Driving growth in voice while developing new opportunities in
data, enterprise, financial services and content
Allow for operations to be more customer-focused
through responsive, supportive and efficient back office functions

MTN Group Limited Integrated Report 2015
23
DETERMINING OUR STRATEGIC PATH
We further develop our strategic themes into strategic priorities, which have a three- to five-year time horizon.
We measure progress against these priorities through the KPIs of the Group executive committee (exco)
( 46) which are reviewed annually. These are used to determine bonuses, if any, of the exco. We detail the
bonus calculation process ( 77) and analyse performance against KPIs in 2015, as well as give details of
executives primarily responsible for each one of these on 28.
Strategic themeStrategic priorities over
three to five yearsKPI target in 2015
Creating and managing
stakeholder value
Sustainable shareholder
returns
Responsible corporate
citizenship
Creating a great place
to work
Instilling sound
governance and values
5% to 15% dividend growth
Opportunistic share buy-backs
Increase in positive media sentiment
by 4% from 2014 baseline
Statistical improvement on vital
behaviours in the Group culture audit
Creating a distinct customer
experience
Brand leadership
Customer experience
Customer analytics
Network quality and
coverage
Net Promoter Score improvements
17,5 million net additions
Implement core managed services
Driving sustainable
growth
MTN in digital space
Adjacent sectors
Enterprise strategy
Voice and data evolution
M&A and partnerships
Grow MTN Mobile Money (smaller
operations)
Increase new revenue streams
(enterprise, digital and MFS) – target
of US$2,4 billion
Grow Enterprise Business Unit (EBU)
revenue 30% YoY
M&A and partnerships
Transforming our operating
model
Asset optimisation
Supply chain
management
Process standardisation
and optimisation
Group EBITDA margin of 44,6%
Realisation of transformation benefits
Improve procurement savings by more
than 7%
Improve capex efficiency and
effectiveness in South Africa
Improve capex efficiency and
effectiveness in Nigeria
Innovation and best practice
Innovation
Best practice sharing
Security framework rollout and adoption
into standard applications
ICT: Enterprise BSS standardisation
and M2M strategy
Digital readiness (services migration
and deployment)

24
MTN Group Limited Integrated Report 2015
Our top risks and what we are doing about themUsing a combined assurance methodology ( 58), in 2015 we considered the following to be MTN’s most material risks based on each residual risk rating. This takes into account the probability of the occurrence of the risk, the impact of the risk should it materialise and the mitigation strategies in place. The fact that we disclose details of these top risks means
Risk name, context and impact if not managed Mitigation strategiesLink to
strategy
Create and maintain a competitive advantage
The telecommunications and IT industry is characterised by rapid
technological changes. Our commercial success depends on
providing services at competitive prices as well as differentiating
our product offerings. Lack of agility to respond to changing market
conditions may affect our market share and revenue streams, as
well as profits.
MTN is moving into a new phase of its journey, where commercial
and operational excellence, as well as innovation, are becoming
more critical.
5
• Implementing a digital strategy with
broader service offerings.
• Driving critical mass in our operations and
leveraging on our extensive footprint in
Africa. Replicating successful experiences
in other markets and launching global
commercial initiatives in data, digital and
customer value management.
• Ensuring we have the appropriate skills to
deliver the right products and services at
the right price.
• Expanding our IT service catalogue.
Financial performance targets
Slowing global demand for commodities is putting pressure on
economic growth in the emerging markets in which we operate.
A reduction in industry tariffs, regulator-imposed disconnections
of subscribers and increased competition are impacting revenue
growth significantly.
Our new revenue streams are at an early stage of development and
we need to invest capital to build capacity, maintain and grow market
share and position the Group for future growth.
Exposure to currencies other than our reporting currency (the rand)
impacts our reported results, the cost of servicing foreign-
denominated obligations and operational costs denominated in hard
currencies.
2 3 5
• We nurture our traditional revenue streams
and identify and develop new revenue
streams.
• We are selling non-core assets (such as
towers).
• We have a local currency funding strategy.
• We actively manage foreign-denominated
assets and liabilities to minimise the impact
of translation effects.
Adverse regulatory changes or non-compliance with
laws and regulations
We have business ventures in a large number of jurisdictions and
must comply with an extensive range of laws and regulations.
Increased regulatory or legal changes/requirements may negatively
impact our business model, and affect revenues and profits.
1 6
• Systems in place to monitor and track new
legislation and regulations as well as
changes to current legislation and
regulations.
• Compliance management framework
developed and rolled out to MTN’s
operating companies.
• Written statement of commitment to
compliance.
• A local board member is appointed to
oversee compliance within each operating
company.
• A Compliance Management Checklist
(CMC) is in place for the management of
compliance with local laws and regulations.

MTN Group Limited Integrated Report 2015
25
DETERMINING OUR STRATEGIC PATH
that each is important to MTN and, even though rankings change during the year, each of these risks receives equal management attention. We also include opportunities associated with each risk. For our approach to risk management, see 57.
MTN’s achievements in 2015 Opportunities Risk ranking
2015 2014
• Appointed a dedicated Group chief consumer officer and a
Group chief digital officer, and honed our focus on customer
experience initiatives.
• The enterprise business unit launched a number of new
services including: Pan-African “Internet of Things”; MTN
Business Cloud; Azure ExpressRoute; Microsoft Office 365;
Amazon Web Services; switching capability; and a new MTN
business website.
• Bridging the digital divide through
innovative offerings including e-commerce
services through our partnership with
Rocket Internet, as well as MTN Mobile
Money, mHealth and mInsurance.
• Creating greater efficiencies that allow
the Company to remain profitable.
• Increased focus on the end-customer
experience provides a competitive
advantage.
1 2
• Achievements in this regard were overshadowed by the fine
imposed by the Nigerian regulator.
• Maintained revenue levels despite pressure on tariffs.
• Invested in the development of new revenue streams.
• Implemented a strong revenue assurance measurement
and governance framework.
• Realised a gain of R8 billion on the sale of towers in Nigeria.
• Completed focused capex deployment in growth markets.
• Realised some operational efficiencies and cost savings
through outsourcing of non-core functions and review of
sourcing models.
• Managed the consequences of the Nigerian fine on providers
of funding.
• Contained forex losses despite a significantly stronger dollar.
• Growth in data revenue and new revenue
streams from digital businesses.
• Driving cost efficiencies in existing core
business and through the Group’s back
office transformation project.
• Refinement of capital allocation principles.
• Selective share buy-backs when
opportunities arise.
• A positive impact of a weaker rand
exchange rate on foreign-denominated
earnings.
2 4
• Rolled out CMC to 19 operating companies, providing them
with a tool to manage compliance.
• Carried out training at all operating companies on compliance
processes, policies and systems.
• Strengthening and increasing capacity to
manage regulatory changes and key
stakeholders.
• Increasing regulatory audits.
• Obtaining third-party assurance on
processes, systems and policies.
• Increasing training of senior management
and executives on regulatory compliance.
3 3

26
MTN Group Limited Integrated Report 2015
Our top risks and what we are doing about them continued
Risk name, context and impact if not managed Mitigation strategiesLink to
strategy
Network performance
We depend on the uninterrupted operation of our networks to
provide our services. From time to time, customers experience data
quality issues because of network constraints. Lack of timeous,
effective and efficient capital investments to cater for greater
subscriber numbers and traffic could lead to a loss of customers,
and in turn a loss in revenue and a reduction in our EBITDA margin.
1 4 5
• By outsourcing network operations MTN
is able to leverage off the scale, expertise
and tools of the managed services vendor.
Moving to the next level of managed
services, MS2.0 – where the focus is on
customer experience – will ensure the best
network experience.
• Upgrading networks to LTE means that we
provide the best mobile broadband service
to our subscribers.
• By sharing infrastructure through the
establishment of tower companies, we
reduce our rollout costs, as well as the
ongoing costs of operating MTN’s passive
infrastructure.
• By installing energy-efficient solutions
such as hybrid power, we ensure higher
availability of our networks and reduce our
diesel costs. This also reduces our reliance
on national grid electricity.
Compromised information security
Lack of an effective Group-wide information security programme
may compromise our information as a result of an increase in
cyber-attacks worldwide. This could lead to reputational damage and
the loss of customers, and in turn impacting revenue and margins.
5
• Implementing an information security
governance framework.
• Increasing focus on reduction of cyber
security risks.
• Embedding information security
requirements into key processes.
• Raising awareness with staff and vendors.
Stakeholder management
Lack of an effective strategy to engage stakeholders on their material
concerns, resulting in the gradual loss of trust and confidence in
MTN. In particular, key stakeholders such as governments, investors
and staff feel they are not sufficiently engaged and informed about
MTN’s governance and operational challenges.
6
• Segmenting MTN’s stakeholders into
10 groups in order to focus on their material
concerns through structured engagements;
understand their impact on MTN’s
reputation; and improve our reporting on
stakeholder management.
• Gradually introduced issue management
councils which serve to co-ordinate issue
mitigation activities across the operations
and the Group.
Liquidity and currency volatility
Adverse changes in interest rates could result in higher costs of
funding and reduced returns.
A shortage of foreign currency, stringent exchange laws and adverse
regulations governing repatriation of earnings in a number of
markets could limit MTN’s ability to repatriate earnings timeously.
Volatility in the exchange rates of many of the countries in which we
operate may have an adverse impact on net income. The limited
availability of foreign currency in these countries may also result
in local MTN operations being unable to obtain forex to pay
suppliers/banks.
• Maintain a liquidity buffer in the form
of cash or committed facilities.
• Encourage borrowing in local currency
for opco funding requirements.
• Active management of foreign currency
exposures.

MTN Group Limited Integrated Report 2015
27
DETERMINING OUR STRATEGIC PATH
MTN’s achievements in 2015 Opportunities Risk ranking
2015 2014
• Progressed with network managed services in 13 countries.
These include South Africa, Nigeria, Ghana, Cameroon and
Uganda. Three more networks will be transitioned in early 2016.
• Launched LTE in Iran, Cameroon, Uganda, the Ivory Coast and
Benin. Introduced 3G in Guinea-Bissau, Cameroon and Iran.
• Rolled out LTE aggressively in South Africa.
• Carried out quarterly network benchmarking drive tests on all
networks.
• Incurred capital expenditure of R29 billion.
• Careful capital investment in key markets
to maintain leading market share position.
• Launching of LTE in main markets where
MTN has a licence to enhance our mobile
broadband offering.
• Broadening network infrastructure sharing
to include RAN, backbone transmission and
data centres.
• Use of energy-efficient infrastructure, which
saves on diesel costs and ensures high
network availability.
• Revenue sharing with vendors, where the
vendors provide all the capex, to roll out
networks in remote rural regions gives us
an opportunity to service lower-income
segments of the market.
4 1
• Implemented a management system based on the worldwide
ISO 27001 standard.
• Conducted cyber security risk and vulnerability assessments,
commissioned “white hat” hacking experts and assisted our
vendors to close holes on key systems.
• Included security compliance requirements into key vendor
contracts.
• Security of information policies and
procedures give comfort to stakeholders
and enhance our reputation.
• Improved security places MTN as a
preferred service provider for security-
conscious investors, business partners
and customers.
• Reduction of electronic fraud and revenue
leakage.
5 5
• The imposition of a significant fine by the Nigerian authorities
highlighted the need for the Group to treat stakeholder
management as a key business imperative.
• Improved reporting on reputation-building activities, with the
most engaged stakeholders in 2015 being governments,
employees and the media.
• Profiled MTN’s corporate citizenship activities and the work
of MTN Foundations.
• Developed situational analysis and integrated response (SAIR)
capability with an online real-time market intelligence
aggregator to track issues that have a potential to influence
MTN’s reputation.
• Heightened employee engagement through face-to-face
interactions between leadership and staff on performance, values,
organisational change and growth opportunities and threats.
• The re-introduction of MTN’s regional
structure will allow for tighter monitoring
and management of material stakeholder
issues through closer escalation points
between the Group and MTN markets via
the regional vice presidents structure.
• The rollout of the new SAIR capability will
add impetus to the segmented stakeholder
management approach.
• Intensify the activities of the Group and
opco issue management councils to inform
and drive MTN’s engagement with priority
stakeholders, especially governments,
regulators and the media.
• Conduct a global MTN corporate reputation
audit during the first half of 2016.
6 new in
2015
• Concluded various new credit facilities at opco levels.
• Extended Group facilities to manage refinancing risks.
• Increased the intercompany loan between the MTN Group
and MTN South Africa.
• Hedged the Group’s currency exposure out of MTN Nigeria.
• Successfully concluded local currency funding for various
opcos thus reducing foreign currency exposure.
• Increase and extend the headroom facilities
and domestic medium-term note
programme.
• New strategy for repatriating cash from all
operations.
• Diversify sources of funding.
• Reduce foreign currency debt exposure.
• Apply active currency management
strategy.
7 new in
2015

28
MTN Group Limited Integrated Report 2015
Our Group performance and outlook
Strategic themeWhat we measure (KPIs)
and 2015 target2015 performance
Creating and
managing
stakeholder
value
• 5% to 15% dividend growth
• Opportunistic share buy-backs• Grew dividend by 5,2% 1 32 4
• Increase in positive media
sentiment by 4% from 2014
baseline
• An improved plan to increase positive media sentiment showed encouraging results
although negative sentiment spiked in Q2 2015 and Q4 2015 as a result of the
industrial strike action in MTN South Africa and the MTN Nigeria regulatory fine. Issue
management councils have been set up in 10 operations
6
• Statistical improvement on vital
behaviours in the Group culture
audit
• 2% improvement in vital behaviours in the Group culture audit 6
Creating a
distinct
customer
experience
• Net Promoter Score improvements • Improved 5% from the 2014 base 3 5
• 17,5 million net additions • 9 million net additions, affected by the disconnection of subscribers related to
registration requirements
3 4
• Implement core managed services • Network managed services rolled out in seven opcos 3
Driving
sustainable
growth
• Grow MTN Mobile Money (smaller
operations)• 9,3 million active subscribers 3 4
• Increase new revenue streams
(enterprise, digital and MFS) –
Target of US$2,4 billion
• New revenues of US$1,8 billion 3 4
• Grow Enterprise Business Unit
(EBU) revenue 30% YoY• Exceeded target – growth of 33% YoY 3 4
• M&A and partnerships • Further investment in Africa Internet Holdings; acquisition of Autopage’s subscriber
base and SmartVillage and disposal of MTN Ivory Coast shareholding (8%) to fulfil
licence requirement
• Entered into Telefonica strategic partnership agreement 4 65
Transforming
our operating
model
• Group EBITDA margin of 44,6% • Achieved margin of 34,6%, including Nigeria fine adjustment 3
• Realisation of transformation
benefits • Three opcos are live on the shared services platform 3
• Improve procurement savings by
more than 7%• Procurement savings improved by 25% YoY 3
• Improve capex efficiency and
effectiveness in South Africa
• Improve capex efficiency and
effectiveness in Nigeria
• Increased capex 92,9% in South Africa 3 54
• Sold towers in Nigeria and retained a stake in TowerCo
Innovation and
best practice
• Security framework rollout and
adoption into standard
applications
• 80% of countries rolled out security framework and key internal audit issues closed
• ICT: Enterprise BSS
standardisation and M2M strategy
• Business Support Systems: Low-level design sign-off
• M2M platform ready for services
• Digital readiness (services • Digital readiness platforms implemented and rolled out to four opcos

MTN Group Limited Integrated Report 2015
29
DETERMINING OUR STRATEGIC PATH
Here we provide an analysis of the Group’s performance against strategic themes in the year. Using some of the main key performance indicators (KPIs) that we measure, we rate the Group’s 2015 performance against targets set for the year and indicate the material issues, capitals and stakeholders that are most relevant to each KPI. We also provide information on the focus in the years ahead, and list the executives whose primary responsibility it was to deliver on each KPI in 2015.
2015
StatusRelevant capital Relevant stakeholders
Primary executive
responsibility
in 2015
Short to medium-term focus
Financial Shareholders Brett Goschen • A minimum dividend of 700 cents per share is intended for 2016, depending on the outcome of the Nigeria issue and is at the discretion of the board. This takes into consideration the Nigeria regulatory fine and the dollar liquidity situation in Nigeria
• Opportunistic share buy-backs
Social and relationship All Paul Norman • Improve corporate reputation through the
continued establishment of issue
management councils, improved
stakeholder management and media
engagement
Human Employees Paul Norman • Further embed vital behaviours across the
Group
Social and relationship Customers Jyoti Desai
Michael Ikpoki^
Mteto Nyati
Zunaid Bulbulia^
• Improvement in all markets relative to
competitors
• Focus on customer experience, value,
service and billing
Social and relationship Customers Jyoti Desai
Michael Ikpoki^
Mteto Nyati
Zunaid Bulbulia^
• Improve subscriber registration processes.
Diversify products and deliver excellent
services
• 12,5 million net additions guidance for
2016
Social and relationship Customers Jyoti Desai • Continue the rollout of managed services
and improve network customer experience
with vendors
Financial Customers Jyoti Desai
Michael Ikpoki^
Mteto Nyati
Zunaid Bulbulia^
• Improve Mobile Money revenues in key
markets
• Focus on systems
Financial Shareholders, customers Jyoti Desai
Michael Ikpoki^
Mteto Nyati
Zunaid Bulbulia^
• Focus on growing non-voice revenues
Financial Shareholders, customers Jyoti Desai
Michael Ikpoki^
Mteto Nyati
Zunaid Bulbulia^
• Grow ICT revenues in key markets
Financial Business partners Karel Pienaar^ • Explore adjacent business opportunities
Financial Shareholders, employees Brett Goschen
Sifiso Dabengwa^
• Improve Group EBITDA margin by driving
cost efficiency initiatives
Human Shareholders, employees,
suppliers, social and
relationship
Brett Goschen
Jyoti Desai
• Improve efficiencies in HR, finance and
supply chain
Financial Suppliers Brett Goschen • Leverage established procurement
companies and continue to ensure the best
quality at the best price
Financial,
Environmental
Shareholders, communities Mteto Nyati
Michael Ikpoki^
• Monitor profitability of capex
• Improve quality of networks
Financial Shareholders, customers Jyoti Desai • Ensure the adoption of the Group
information security policy controls
Financial Customers, shareholders Jyoti Desai • Continue platform and opco deployments
Financial Customers, shareholders Jyoti Desai • Continued rollout across footprint for digital

30
MTN Group Limited Integrated Report 2015
Financial review
Operating in a challenging environmentMTN Group’s 2015 financial results reflect the
challenging operating environment the business
experienced in the year, details of which are
discussed fully in the material issues section of this
report ( 11). Weak macro-economic conditions,
increased market competition, heightened regulatory
pressures, notably in Nigeria, and operational
challenges in some of our markets resulted in a
lower than expected performance.
Reported basic headline earnings per share (HEPS)
declined by 51,4%** to 746 cents**. This was largely
a result of the provision for the Nigeria regulatory
fine (R9 287 million), which had a 402 cents negative
impact on HEPS. Excluding this, HEPS declined
25,3%. In addition, HEPS was negatively impacted
by hyperinflation of 54 cents (positive impact of
69 cents in 2014) and losses from our investment in
African Internet Holdings (AIH) and Middle East
Internet Holdings (MEIH) of 34 cents (versus 7 cents
in 2014) and from the tower companies of 39 cents
(versus 16 cents in 2014).
While these investments are a short-term drag on
reported earnings, they remain key elements in the
long-term strategy of the Group. Excluding the
impact of the Nigeria regulatory fine provision,
hyperinflation and the impact of AIH, MEIH and the
towers, on a like-for-like basis, HEPS declined 14,3%.
Notwithstanding the challenging operating
environment, MTN continued to benefit from its
significant scale and footprint. The Group’s
subscriber base increased by 4,1% to 232,5 million,
despite the disconnection of 10,4 million subscribers
to ensure compliance with subscriber regulatory
registration requirements in Nigeria and Uganda.
MTN Nigeria and MTN Uganda disconnected
6,7 million and 3,7 million subscribers respectively.
Subscriber growth was achieved through attractive
segmented below-the-line campaigns and an
increased focus on the customer experience
enabling the Group to maintain its leadership
position in 15 markets.
Revenue
H1-13 H2-13 H1-14* H2-14* H1-15 H2-15
RSA Nigeria OtherPercentage revenue
Data revenue (ZAR million)
9 14711 357 12 218
13 806 15 013
18 86114%
16% 17%19%
22%24%
Revenue growthOrganic
(%)Reported
(%)
South Africa 37 37Nigeria 19 16Ghana 85 80Cameroon 66 65Ivory Coast 41 39Uganda 17 12Syria 23 (11)Sudan 60 82Small opco cluster (SOC) 34 34
Iran 90 102
Group revenue remained flat in the year largely due to a decline in voice revenue in Nigeria and a reduction in handset revenue in South Africa following the industrial action experienced in the first half of the year which led to the lower distribution of handsets. This was, however, largely offset by an increase in data revenue across the business.
Reported Hyperinflation Tower profitNigerian
regulatory fineOperational
Revenue 0% to R147 063m R710m 0% to R146 353m
EBITDA 19% to R59 125m R231m R8 263 R9 287m 9% to R59 918m
EBITDA margin
9,6pp to 40,2% 0,0pp 5,6pp 6,3pp 3,9pp to 40,9%
Effective tax rate
6,2pp to 32,4% 0,8pp 12,1pp 11,1pp 1,5pp to 32,6%
Positive impact on reported results Negative impact on reported results
Financial snapshot
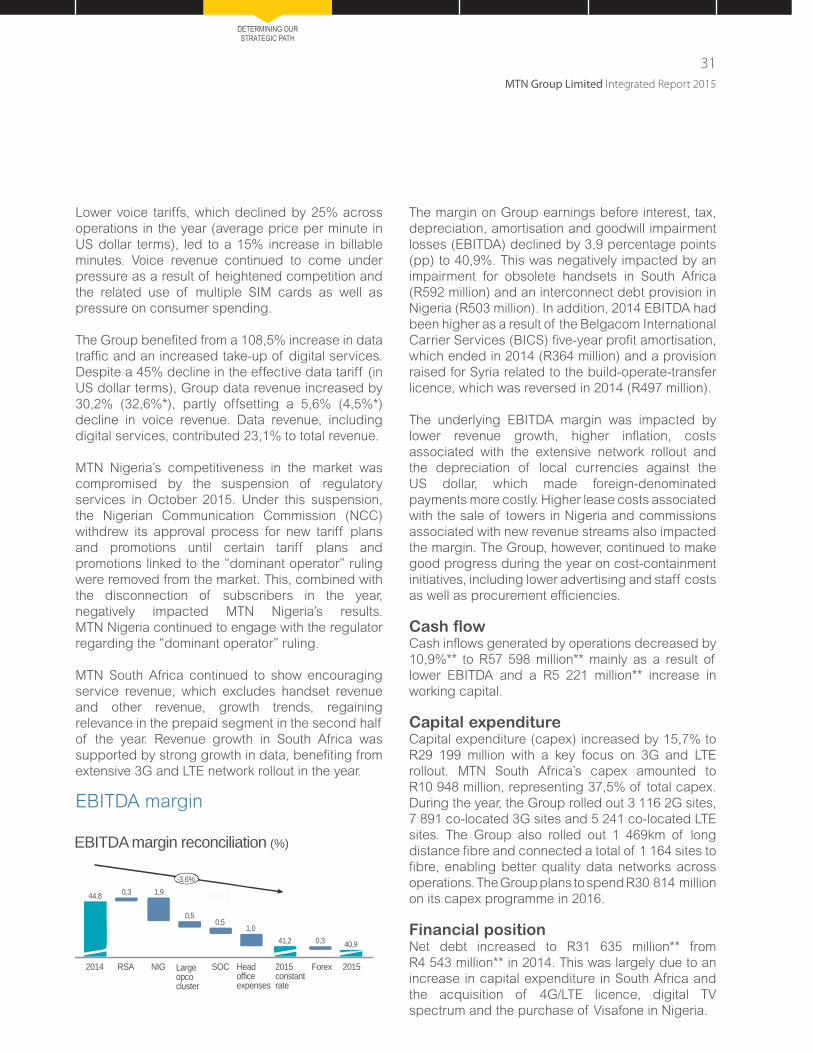
MTN Group Limited Integrated Report 2015
31
DETERMINING OUR STRATEGIC PATH
Lower voice tariffs, which declined by 25% across
operations in the year (average price per minute in
US dollar terms), led to a 15% increase in billable
minutes. Voice revenue continued to come under
pressure as a result of heightened competition and
the related use of multiple SIM cards as well as
pressure on consumer spending.
The Group benefited from a 108,5% increase in data
traffic and an increased take-up of digital services.
Despite a 45% decline in the effective data tariff (in
US dollar terms), Group data revenue increased by
30,2% (32,6%*), partly offsetting a 5,6% (4,5%*)
decline in voice revenue. Data revenue, including
digital services, contributed 23,1% to total revenue.
MTN Nigeria’s competitiveness in the market was
compromised by the suspension of regulatory
services in October 2015. Under this suspension,
the Nigerian Communication Commission (NCC)
withdrew its approval process for new tariff plans
and promotions until certain tariff plans and
promotions linked to the “dominant operator” ruling
were removed from the market. This, combined with
the disconnection of subscribers in the year,
negatively impacted MTN Nigeria’s results.
MTN Nigeria continued to engage with the regulator
regarding the “dominant operator” ruling.
MTN South Africa continued to show encouraging
service revenue, which excludes handset revenue
and other revenue, growth trends, regaining
relevance in the prepaid segment in the second half
of the year. Revenue growth in South Africa was
supported by strong growth in data, benefiting from
extensive 3G and LTE network rollout in the year.
EBITDA margin
2014
-3,6%
44,8 0,3 1,9
0,50,5
1,041,2 0,3 40,9
RSA NIG Largeopcocluster
SOC Headofficeexpenses
2015constantrate
Forex 2015
EBITDA margin reconciliation (%)
The margin on Group earnings before interest, tax,
depreciation, amortisation and goodwill impairment
losses (EBITDA) declined by 3,9 percentage points
(pp) to 40,9%. This was negatively impacted by an
impairment for obsolete handsets in South Africa
(R592 million) and an interconnect debt provision in
Nigeria (R503 million). In addition, 2014 EBITDA had
been higher as a result of the Belgacom International
Carrier Services (BICS) five-year profit amortisation,
which ended in 2014 (R364 million) and a provision
raised for Syria related to the build-operate-transfer
licence, which was reversed in 2014 (R497 million).
The underlying EBITDA margin was impacted by
lower revenue growth, higher inflation, costs
associated with the extensive network rollout and
the depreciation of local currencies against the
US dollar, which made foreign-denominated
payments more costly. Higher lease costs associated
with the sale of towers in Nigeria and commissions
associated with new revenue streams also impacted
the margin. The Group, however, continued to make
good progress during the year on cost-containment
initiatives, including lower advertising and staff costs
as well as procurement efficiencies.
Cash flowCash inflows generated by operations decreased by
10,9%** to R57 598 million** mainly as a result of
lower EBITDA and a R5 221 million** increase in
working capital.
Capital expenditureCapital expenditure (capex) increased by 15,7% to
R29 199 million with a key focus on 3G and LTE
rollout. MTN South Africa’s capex amounted to
R10 948 million, representing 37,5% of total capex.
During the year, the Group rolled out 3 116 2G sites,
7 891 co-located 3G sites and 5 241 co-located LTE
sites. The Group also rolled out 1 469km of long
distance fibre and connected a total of 1 164 sites to
fibre, enabling better quality data networks across
operations. The Group plans to spend R30 814 million
on its capex programme in 2016.
Financial positionNet debt increased to R31 635 million** from
R4 543 million** in 2014. This was largely due to an
increase in capital expenditure in South Africa and
the acquisition of 4G/LTE licence, digital TV
spectrum and the purchase of Visafone in Nigeria.
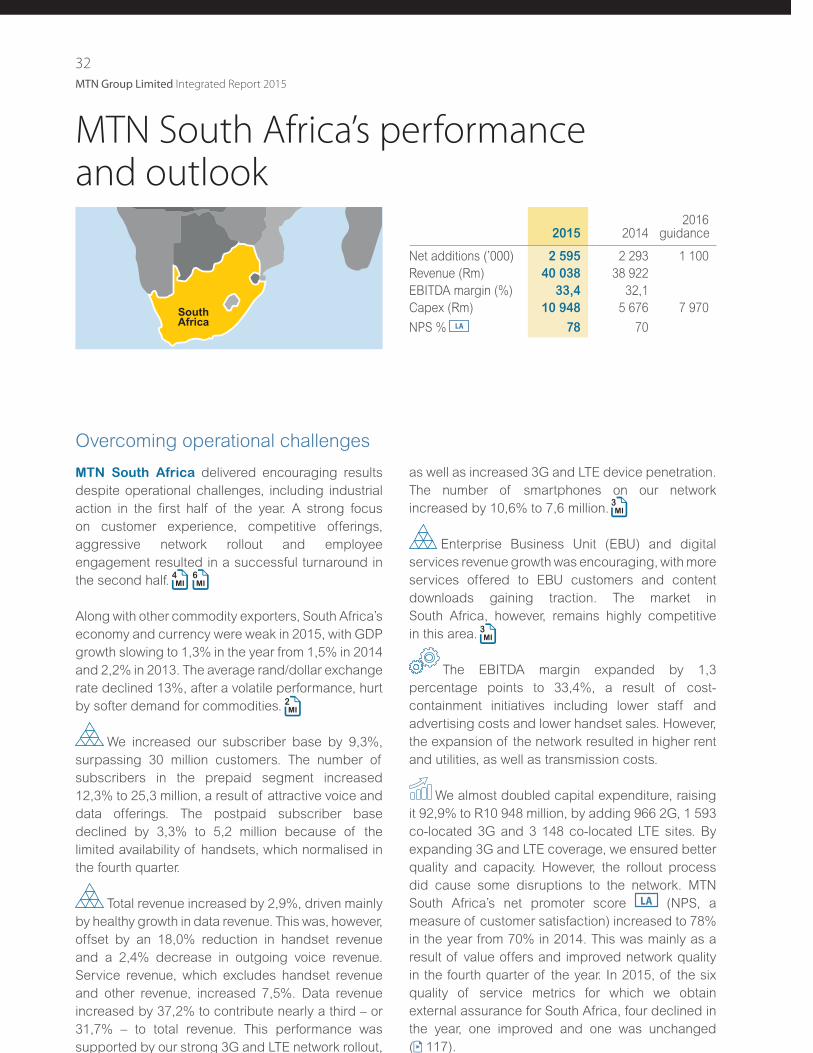
32
MTN Group Limited Integrated Report 2015
MTN South Africa’s performance and outlook
Overcoming operational challenges
MTN South Africa delivered encouraging results
despite operational challenges, including industrial
action in the first half of the year. A strong focus
on customer experience, competitive offerings,
aggressive network rollout and employee
engagement resulted in a successful turnaround in
the second half.
Along with other commodity exporters, South Africa’s
economy and currency were weak in 2015, with GDP
growth slowing to 1,3% in the year from 1,5% in 2014
and 2,2% in 2013. The average rand/dollar exchange
rate declined 13%, after a volatile performance, hurt
by softer demand for commodities.
We increased our subscriber base by 9,3%,
surpassing 30 million customers. The number of
subscribers in the prepaid segment increased
12,3% to 25,3 million, a result of attractive voice and
data offerings. The postpaid subscriber base
declined by 3,3% to 5,2 million because of the
limited availability of handsets, which normalised in
the fourth quarter.
Total revenue increased by 2,9%, driven mainly
by healthy growth in data revenue. This was, however,
offset by an 18,0% reduction in handset revenue
and a 2,4% decrease in outgoing voice revenue.
Service revenue, which excludes handset revenue
and other revenue, increased 7,5%. Data revenue
increased by 37,2% to contribute nearly a third – or
31,7% – to total revenue. This performance was
supported by our strong 3G and LTE network rollout,
4 6
2
as well as increased 3G and LTE device penetration.
The number of smartphones on our network
increased by 10,6% to 7,6 million.
Enterprise Business Unit (EBU) and digital
services revenue growth was encouraging, with more
services offered to EBU customers and content
downloads gaining traction. The market in
South Africa, however, remains highly competitive
in this area.
The EBITDA margin expanded by 1,3
percentage points to 33,4%, a result of cost-
containment initiatives including lower staff and
advertising costs and lower handset sales. However,
the expansion of the network resulted in higher rent
and utilities, as well as transmission costs.
We almost doubled capital expenditure, raising
it 92,9% to R10 948 million, by adding 966 2G, 1 593
co-located 3G and 3 148 co-located LTE sites. By
expanding 3G and LTE coverage, we ensured better
quality and capacity. However, the rollout process
did cause some disruptions to the network. MTN
South Africa’s net promoter score LA (NPS, a
measure of customer satisfaction) increased to 78%
in the year from 70% in 2014. This was mainly as a
result of value offers and improved network quality
in the fourth quarter of the year. In 2015, of the six
quality of service metrics for which we obtain
external assurance for South Africa, four declined in
the year, one improved and one was unchanged
( 117).
3
3
2015 2014 2016
guidance
Net additions (’000) 2 595 2 293 1 100
Revenue (Rm) 40 038 38 922
EBITDA margin (%) 33,4 32,1
Capex (Rm) 10 948 5 676 7 970
NPS % LA 78 70
SouthAfrica

MTN Group Limited Integrated Report 2015
33
DETERMINING OUR STRATEGIC PATH
MTN South Africa continues to actively engage
with the authorities regarding the planned auction of
2,6GHz and 3,5GHz spectrum frequency, which we
need to further expand and enhance our LTE
network. However, as a short-term solution, we have
re-farmed existing spectrum to cater for LTE
technology.
Looking aheadSouth Africa’s economic outlook for 2016 remains
weak with GDP estimated to grow at 0,9%. The
depreciation of the rand, constrained infrastructure
as well as higher food prices as a result of the severe
drought of 2015 is expected to increase inflation
levels in 2016.
Notwithstanding this, we expect our operational
performance to extend the positive momentum of
the second half of 2015 into 2016, supported by
competitive voice and data offerings as well as the
expansion of digital and EBU services. We expect to
add 1,1 million subscribers in 2016.
We expect to benefit from our focused work to
improve 3G and LTE network quality and capacity as
well as an enhanced 3G/LTE device plan
implemented towards the end of 2015. The operation
will also continue to roll out fibre-to-the-home,
thereby improving customer experience. We expect
to commit approximately R8,0 billion in capex
in 2016.
3
We continue to work towards improving our
cost structures and creating efficiencies. In 2016,
MTN South Africa will implement Project Next!, the
Group’s back office transformation programme.
Among other priorities in the year ahead are
investing in strong and experienced executive
leadership; engaging with our employees, and
continuing to work with the regulator to obtain much
needed 4G spectrum. 4 5
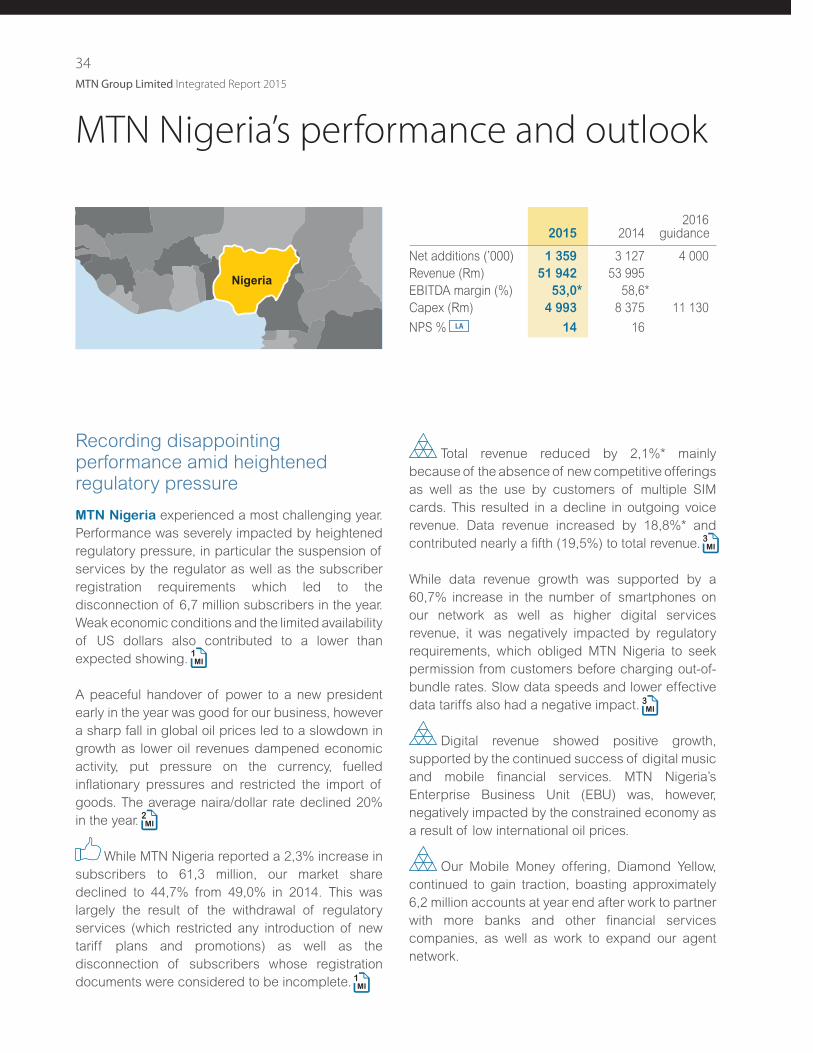
34
MTN Group Limited Integrated Report 2015
MTN Nigeria’s performance and outlook
2015 2014 2016
guidance
Net additions (’000) 1 359 3 127 4 000
Revenue (Rm) 51 942 53 995
EBITDA margin (%) 53,0* 58,6*
Capex (Rm) 4 993 8 375 11 130
NPS % LA 14 16
Recording disappointing performance amid heightened regulatory pressure
MTN Nigeria experienced a most challenging year.
Performance was severely impacted by heightened
regulatory pressure, in particular the suspension of
services by the regulator as well as the subscriber
registration requirements which led to the
disconnection of 6,7 million subscribers in the year.
Weak economic conditions and the limited availability
of US dollars also contributed to a lower than
expected showing.
A peaceful handover of power to a new president
early in the year was good for our business, however
a sharp fall in global oil prices led to a slowdown in
growth as lower oil revenues dampened economic
activity, put pressure on the currency, fuelled
inflationary pressures and restricted the import of
goods. The average naira/dollar rate declined 20%
in the year.
While MTN Nigeria reported a 2,3% increase in
subscribers to 61,3 million, our market share
declined to 44,7% from 49,0% in 2014. This was
largely the result of the withdrawal of regulatory
services (which restricted any introduction of new
tariff plans and promotions) as well as the
disconnection of subscribers whose registration
documents were considered to be incomplete.
1
2
1
Total revenue reduced by 2,1%* mainly
because of the absence of new competitive offerings
as well as the use by customers of multiple SIM
cards. This resulted in a decline in outgoing voice
revenue. Data revenue increased by 18,8%* and
contributed nearly a fifth (19,5%) to total revenue.
While data revenue growth was supported by a
60,7% increase in the number of smartphones on
our network as well as higher digital services
revenue, it was negatively impacted by regulatory
requirements, which obliged MTN Nigeria to seek
permission from customers before charging out-of-
bundle rates. Slow data speeds and lower effective
data tariffs also had a negative impact.
Digital revenue showed positive growth,
supported by the continued success of digital music
and mobile financial services. MTN Nigeria’s
Enterprise Business Unit (EBU) was, however,
negatively impacted by the constrained economy as
a result of low international oil prices.
Our Mobile Money offering, Diamond Yellow,
continued to gain traction, boasting approximately
6,2 million accounts at year end after work to partner
with more banks and other financial services
companies, as well as work to expand our agent
network.
3
3
Nigeria

MTN Group Limited Integrated Report 2015
35
DETERMINING OUR STRATEGIC PATH
The EBITDA margin narrowed by 5,6
percentage points to 53,0%*. This was largely due to
increased use of build-to-suit towers; higher lease
costs following the sale of towers; the impact of a
weaker naira on US dollar expenditure relating to
managed services and network rollout costs; higher
digital services revenue share; and an increase in
debt provisions and in marketing spend. We
completed the transfer of the final tranche of 4 696
towers to the tower company on 1 July 2015. During
the year, 597 new 2G sites and 1 856 co-located 3G
sites were added.
Capex declined by 40,4% to a below budget
R4 993 million, impacted by the tower transaction as
well as the increased use of build-to-suit towers.
Improving the quality and data speeds of the
network in some parts of the country remains a
priority. We are engaging with suppliers to resolve
the challenges we have experienced and we expect
to ramp up the rollout by the end of the first half of
2016. MTN Nigeria’s net promoter score LA (NPS, a
measure of customers’ willingness to recommend
MTN’s products and services to others) declined to
14% from 16% in 2014. Of the six quality of service
metrics for which we obtain external assurance for
Nigeria, all but one improved in the year. 3G network
availability declined ( 117). 4 5
On 3 November 2015, the regulator approved
the renewal until 31 August 2021 of MTN Nigeria’s
operating spectrum in the 900MHz and 1 800MHz
frequency bands. In addition, on 31 December 2015,
MTN Nigeria concluded the acquisition of Visafone
Communications Limited. This, combined with the
acquisition of a 4G/LTE licence and digital TV
spectrum, will provide us with access to sufficient
spectrum to roll out LTE services.
Looking ahead
We anticipate an improvement in MTN Nigeria’s
overall operational performance. However, net
additions in the first quarter are expected to be
impacted by the disconnection of 4,5 million
subscribers at the end of February 2016. These
disconnections were related to the ongoing
subscriber registration process and we are
working to complete the registration process with
disconnected subscribers. For the year as a
whole, we expect net additions of four million
subscribers.
We expect the economic challenges in Nigeria,
including the pressure on US dollar liquidity, to
remain a challenge in the short to medium term.
However, we are establishing contingency plans to
ensure that we can continue with the planned
network rollout, including more than doubling of our
capex in 2016 to some R11,1 billion.
The operational priority for 2016 is to improve
our 3G and LTE coverage as well as our fibre-to-the-
home offering. In this way, we will ensure that we
create a distinct customer experience.
3
1 6
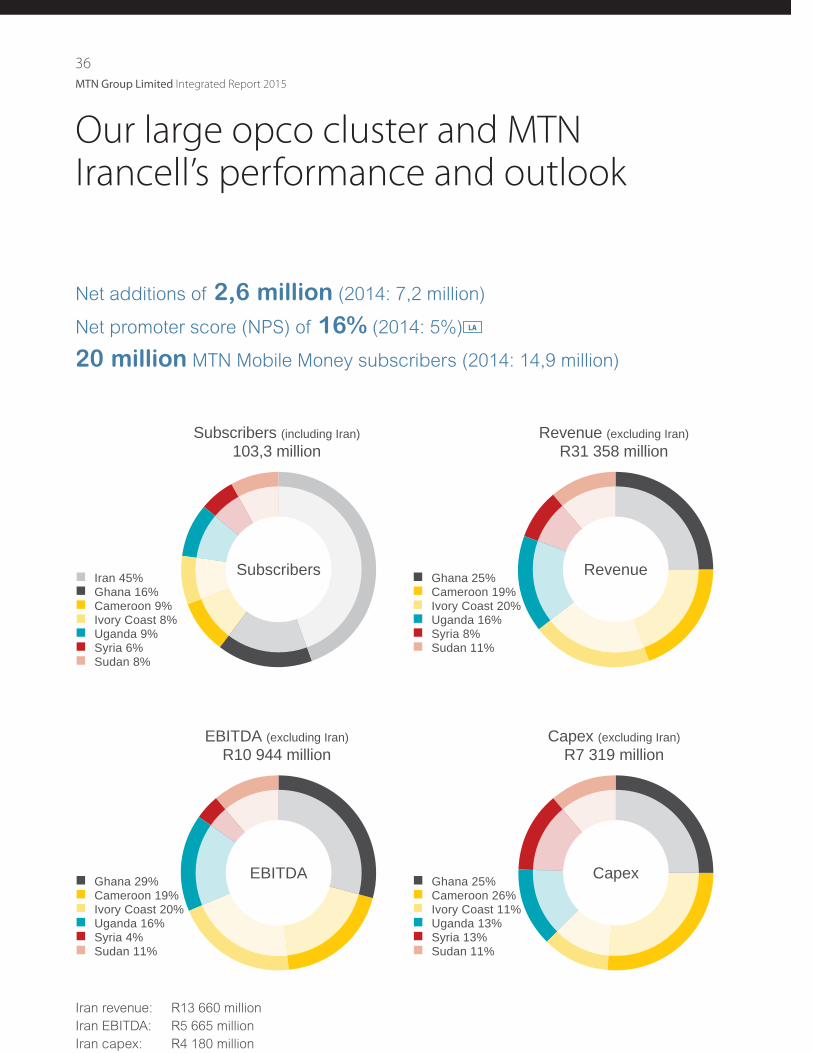
36
MTN Group Limited Integrated Report 2015
Our large opco cluster and MTN Irancell’s performance and outlook
Net additions of 2,6 million (2014: 7,2 million)
Net promoter score (NPS) of 16% (2014: 5%) LA
20 million MTN Mobile Money subscribers (2014: 14,9 million)
SubscribersIran 45%Ghana 16%Cameroon 9%Ivory Coast 8%Uganda 9%Syria 6%Sudan 8%
Subscribers (including Iran) 103,3 million
EBITDAGhana 29%Cameroon 19%Ivory Coast 20%Uganda 16%Syria 4%Sudan 11%
EBITDA (excluding Iran) R10 944 million
RevenueGhana 25%Cameroon 19%Ivory Coast 20%Uganda 16%Syria 8%Sudan 11%
Revenue (excluding Iran) R31 358 million
CapexGhana 25%Cameroon 26%Ivory Coast 11%Uganda 13%Syria 13%Sudan 11%
Capex (excluding Iran) R7 319 million
Iran revenue: R13 660 million
Iran EBITDA: R5 665 million
Iran capex: R4 180 million

MTN Group Limited Integrated Report 2015
37
DETERMINING OUR STRATEGIC PATH
Benefiting from strong data revenue growth
MTN Irancell delivered a strong performance in
2015 despite sluggish economic activity related to
lower world oil prices and continued sanctions
against Iran. Supported by the continued adoption
of 3G and LTE services by Iranian youth,
MTN Irancell’s subscriber numbers increased by
5,0% to 46,1 million in a highly penetrated market.
Lower oil revenues took a toll on the economy,
reducing government revenues and the availability
of foreign currency. The average rial/US dollar rate
declined 12% in the year. In July, Iran reached a
landmark nuclear deal with six world powers,
opening the way for a phased lifting of nuclear-
related economic and financial sanctions from
January 2016.
MTN Irancell’s total revenue increased by
11,6%*, driven by a 90,2%* acceleration in data
revenue. This performance was achieved despite a
steep fall in data prices and brought data’s
contribution to total revenue to just under a third
(30,2%).
This offset a 4,0%* decline in outgoing voice revenue
as a result of aggressive competition in the market
and data substitution. Data revenue was supported
by a strong 3G and LTE network as well as a 52,7%
increase in the number of smartphones on the
network to 26,4 million, representing more than half
of the subscriber base.
2
3
In the year, MTN Irancell launched its Enterprise
Business Unit (EBU) ahead of the easing of
sanctions in the country to provide dedicated ICT
and business-to-business (B2B) services to
business customers.
MTN Irancell’s EBITDA margin decreased by
1,3 percentage points to 41,5%* as a result of an
increase in regulatory fees and transmission costs
associated with 3G and LTE network rollout.
Capex for the year amounted to R8 531 million
(100%) with a focus on network modernisation and
the continued expansion of the 3G and LTE networks.
In the year, the operation rolled out 432 2G sites,
2 443 co-located 3G sites and 1 266 co-located LTE
sites.
Looking ahead
Following the easing of financial sanctions in
January 2016, we are working on repatriating funds
from Iran. This offers significant opportunities to
expand services, particularly in the digital space,
where we command a strong market position. We
also expect economic growth to accelerate, inflation
to reduce and the exchange rate to normalise
somewhat. The renewal of MTN Irancell’s WiMax
licence to TDD-LTE at the end of 2015 will support a
nationwide expansion of fixed LTE services in the
year ahead. MTN Group’s share of MTN Irancell’s
1
2015 2014 2016
guidance
Net additions (’000) 2 200 2 566 1 100
Revenue (Rm) 13 660 11 631
EBITDA margin (%) 41,5* 42,8*
Capex (Rm) 4 180 3 112 3 518
MTN Irancell (joint venture, equity accounted, financial numbers reflected at 49%)
Iran

38
MTN Group Limited Integrated Report 2015
Progressing thanks to robust data growth
MTN Ghana delivered a solid performance despite
a challenging economic environment. The operation
increased its subscriber base by 17,3% to
16,2 million, largely because of attractive voice and
data offers aimed at subscriber acquisition and
churn management as well as digital and mobile
financial services offerings.
The Ghanaian economy, until recently a top performer
due to its political stability and rapid growth through
commodity exports, is under a three-year IMF
programme to restore fiscal balance. Its currency,
the cedi, fell sharply in 2015 and it faced a prolonged
energy crisis.
MTN Ghana’s total revenue increased by
15,9%*, supported by a 85,2%* growth in data
revenue, which contributed 30,6% to total revenue.
This was due to appealing data bundle packages,
an improved device plan and an increased focus on
3G quality and coverage. The number of smartphones
on the network increased by 40,8% to 3,2 million in
the year.
Mobile financial services showed healthy
growth with the number of MTN Mobile Money
customers expanding by 68,1% to 5,7 million.
The EBITDA margin increased 3,1 percentage points
to 40,5%* despite an increase in US dollar-
denominated expenses associated with the sharp
depreciation of the cedi against the US dollar. The
increase in margin was mainly due to well-maintained
costs and no management fees paid to the Group in
the year.
MTN Ghana invested R1 831 million in the
network, adding 73 2G and 233 co-located 3G sites
in the year. In December, the operation won a 4G/LTE
licence in the 800MHz spectrum band, enabling
MTN Ghana to improve the quality and capacity of
its data network. Of the six quality of service metrics
for which we obtain external assurance for Ghana,
four improved in the year, and two ebbed ( 117). 1
3
We expect to commit some R901 million in
capex to Ghana in 2016, when we expect to add a
net 800 000 subscribers to our network.
2015 2014 2016
guidance
Net additions (’000) 2 403 923 800
Revenue (Rm) 7 903 7 149
EBITDA margin (%) 40,5* 37,4*
Capex (Rm) 1 831 1 400 901
MTN Mobile Money subscribers (m) 5,7 3,4
Our large opco cluster and MTN Irancell’s performance and outlook continued
MTN Ghana
Ghana
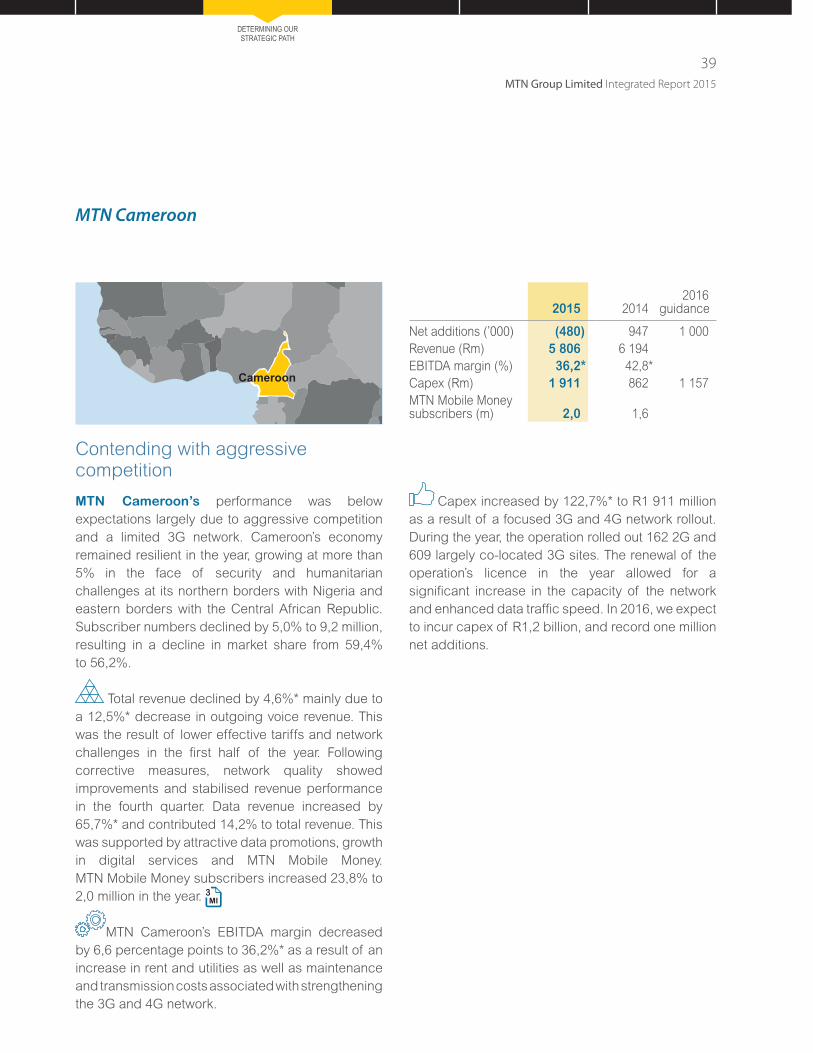
MTN Group Limited Integrated Report 2015
39
DETERMINING OUR STRATEGIC PATH
Capex increased by 122,7%* to R1 911 million
as a result of a focused 3G and 4G network rollout.
During the year, the operation rolled out 162 2G and
609 largely co-located 3G sites. The renewal of the
operation’s licence in the year allowed for a
significant increase in the capacity of the network
and enhanced data traffic speed. In 2016, we expect
to incur capex of R1,2 billion, and record one million
net additions.
Contending with aggressive competition
MTN Cameroon’s performance was below
expectations largely due to aggressive competition
and a limited 3G network. Cameroon’s economy
remained resilient in the year, growing at more than
5% in the face of security and humanitarian
challenges at its northern borders with Nigeria and
eastern borders with the Central African Republic.
Subscriber numbers declined by 5,0% to 9,2 million,
resulting in a decline in market share from 59,4%
to 56,2%.
Total revenue declined by 4,6%* mainly due to
a 12,5%* decrease in outgoing voice revenue. This
was the result of lower effective tariffs and network
challenges in the first half of the year. Following
corrective measures, network quality showed
improvements and stabilised revenue performance
in the fourth quarter. Data revenue increased by
65,7%* and contributed 14,2% to total revenue. This
was supported by attractive data promotions, growth
in digital services and MTN Mobile Money.
MTN Mobile Money subscribers increased 23,8% to
2,0 million in the year. 3
MTN Cameroon’s EBITDA margin decreased
by 6,6 percentage points to 36,2%* as a result of an
increase in rent and utilities as well as maintenance
and transmission costs associated with strengthening
the 3G and 4G network.
2015 2014 2016
guidance
Net additions (’000) (480) 947 1 000
Revenue (Rm) 5 806 6 194
EBITDA margin (%) 36,2* 42,8*
Capex (Rm) 1 911 862 1 157
MTN Mobile Money subscribers (m) 2,0 1,6
MTN Cameroon
Cameroon
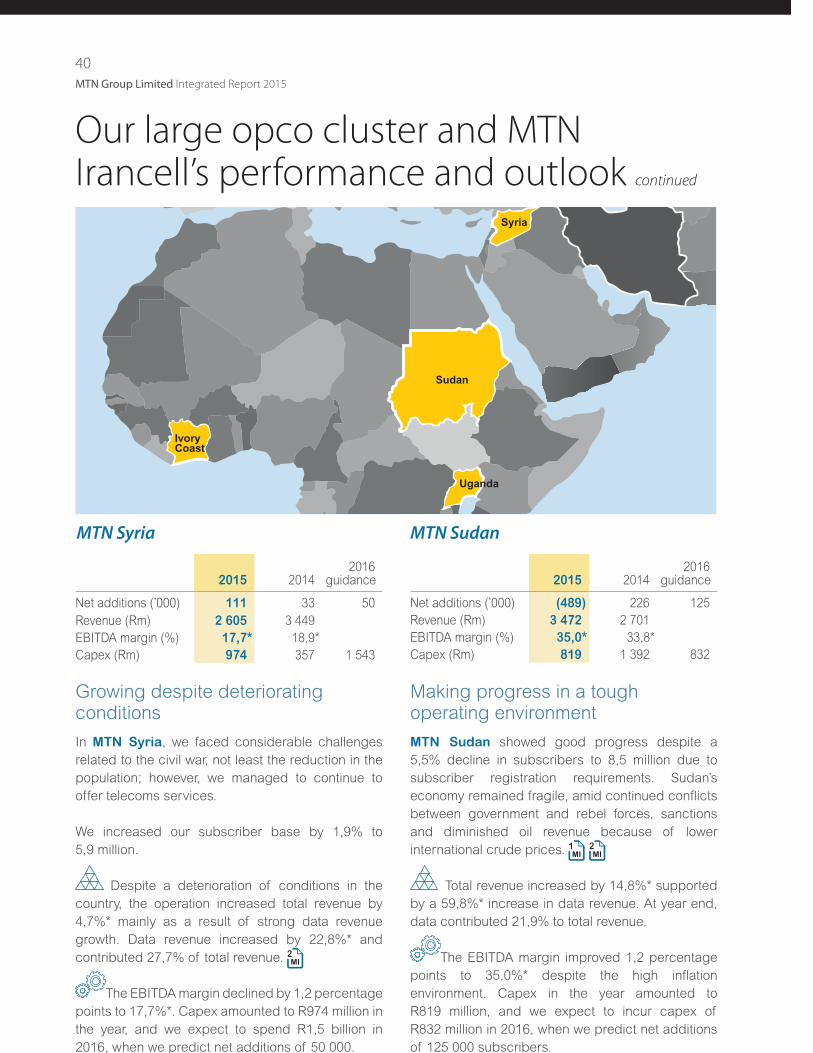
40
MTN Group Limited Integrated Report 2015
Making progress in a tough operating environment
MTN Sudan showed good progress despite a
5,5% decline in subscribers to 8,5 million due to
subscriber registration requirements. Sudan’s
economy remained fragile, amid continued conflicts
between government and rebel forces, sanctions
and diminished oil revenue because of lower
international crude prices.
Total revenue increased by 14,8%* supported
by a 59,8%* increase in data revenue. At year end,
data contributed 21,9% to total revenue.
The EBITDA margin improved 1,2 percentage
points to 35,0%* despite the high inflation
environment. Capex in the year amounted to
R819 million, and we expect to incur capex of
R832 million in 2016, when we predict net additions
of 125 000 subscribers.
1 2
Growing despite deteriorating conditions
In MTN Syria, we faced considerable challenges
related to the civil war, not least the reduction in the
population; however, we managed to continue to
offer telecoms services.
We increased our subscriber base by 1,9% to
5,9 million.
Despite a deterioration of conditions in the
country, the operation increased total revenue by
4,7%* mainly as a result of strong data revenue
growth. Data revenue increased by 22,8%* and
contributed 27,7% of total revenue. 2
The EBITDA margin declined by 1,2 percentage
points to 17,7%*. Capex amounted to R974 million in
the year, and we expect to spend R1,5 billion in
2016, when we predict net additions of 50 000.
Our large opco cluster and MTN Irancell’s performance and outlook continued
2015 2014 2016
guidance
Net additions (’000) 111 33 50
Revenue (Rm) 2 605 3 449
EBITDA margin (%) 17,7* 18,9*
Capex (Rm) 974 357 1 543
2015 2014 2016
guidance
Net additions (’000) (489) 226 125
Revenue (Rm) 3 472 2 701
EBITDA margin (%) 35,0* 33,8*
Capex (Rm) 819 1 392 832
MTN Syria MTN Sudan
Syria
Sudan
Uganda
IvoryCoast
MTN Group Limited Integrated Report 2015
41
DETERMINING OUR STRATEGIC PATH
Feeling the impact of subscriber disconnections
MTN Uganda’s subscriber base declined by 14,1%
to 8,9 million, impacted by the disconnection of
3,7 million subscribers in the fourth quarter who did
not fully comply with regulatory subscriber
registration requirements. 1
Uganda’s economy
grew, but inflation accelerated and the currency lost
value. 2
Total revenue increased by 2,8%*, supported
by a 17,4%* increase in data revenue that contributed
28,3% to total revenue. This was attributable to the
launch of LTE services in the year, an increase in 3G
and LTE devices and the continued success of
MTN Mobile Money. Voice revenue continued to be
impacted by high excise duties and the One Network
Area initiative implemented in the region. Outgoing
voice revenue decreased by 2,1%* mainly due to
lower effective voice tariffs. Outgoing voice revenue,
excluding roaming, decreased by 0,7%*. 1 3
MTN Mobile Money recorded a 30,2% increase in
registered subscribers to 9,5 million.
The EBITDA margin decreased by
4,7 percentage points to 34,5%*, negatively
impacted by US dollar-denominated expenses.
Capex in the year amounted to R951 million
with 161 new 2G sites and 100 co-located 3G sites
rolled out, improving quality and capacity on the
network. We expect to incur capex of R807 million in
2016, when we predict the net addition of two million
subscribers.
2015 2014 2016
guidance
Net additions (’000) (1 467) 1 588 2 000
Revenue (Rm) 5 148 5 289
EBITDA margin (%) 34,5* 39,2*
Capex (Rm) 951 667 807
MTN Mobile Money subscribers (m) 9,5 7,3
MTN Uganda
2015 2014 2016
guidance
Net additions (’000) 330 939 75
Revenue (Rm) 6 424 6 418
EBITDA margin (%) 34,2* 38,6*
Capex (Rm) 833 1 185 815
MTN Mobile Money subscribers (m) 2,9 2,5
Rolling out 3G aggressively
MTN Ivory Coast increased its subscriber base by
4,1% to 8,3 million in a competitive market. This was
supported by segmented offerings and bonus
bundle promotions.
Presidential elections in Ivory Coast in October were
peaceful, allowing the country to move on after years
of turmoil. The economy continued to expand in an
extended revival since the end in 2011 of a decade-
long crisis.
Total revenue increased by 2,2%*, supported
by encouraging growth in data revenue. Data
revenue increased by 41,5%* to contribute 15,6% to
total revenue. The increased uptake of digital
services, MTN Mobile Money offerings and an
aggressive rollout of 3G sites contributed to data
growth. MTN Mobile Money subscribers increased
12,8% to 2,9 million. The focus ahead is on the
expansion of distribution channels and the
introduction of new products.
The operation’s EBITDA margin declined by
4,4 percentage points to 34,2%*. This was a result
of high maintenance costs and an increase in rent
and utilities associated with network rollout.
MTN Ivory Coast spent R833 million on its
capex programme and rolled out 132 2G and 339
co-located 3G sites in the year. We expect to incur
capex of R815 million in 2016, when we predict net
additions of 75 000 subscribers.
2
MTN Ivory Coast
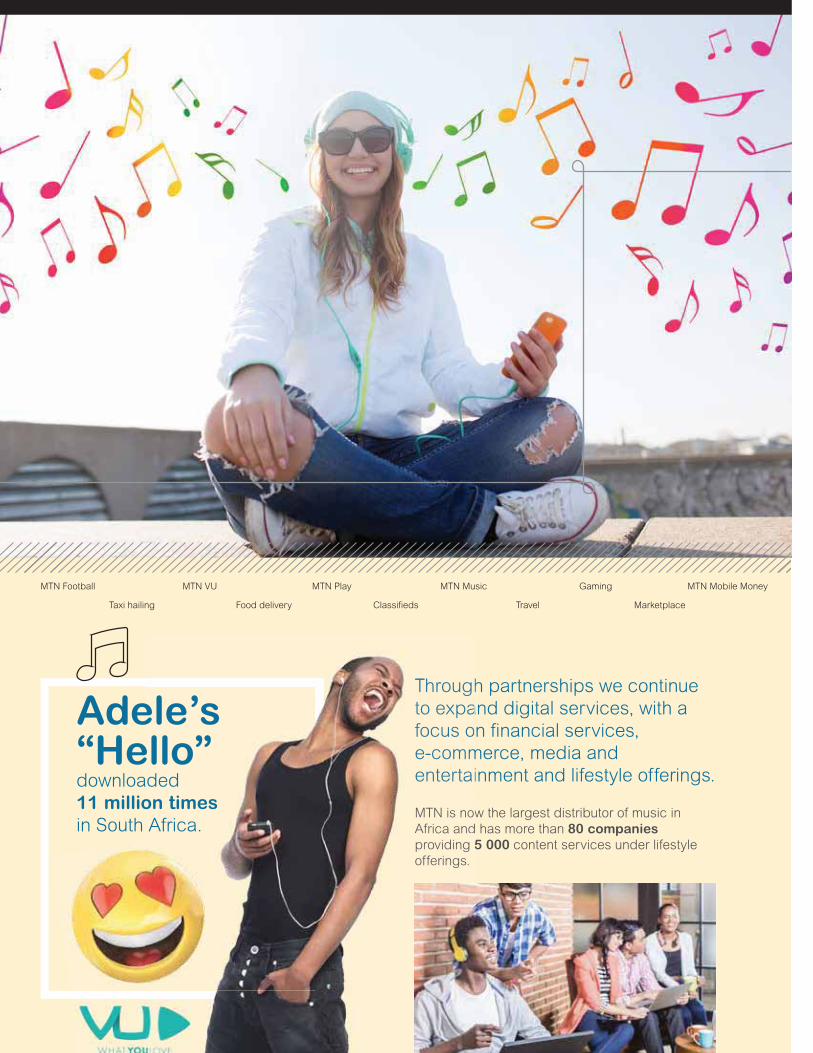
42
MTN Group Limited Integrated Report 2015
MTN Football MTN VU MTN Play MTN Music Gaming MTN Mobile Money
Taxi hailing Food delivery Classifieds Travel Marketplace
Through partnerships we continue
to expand digital services, with a
focus on financial services,
e-commerce, media and
entertainment and lifestyle offerings.
MTN is now the largest distributor of music in
Africa and has more than 80 companies
providing 5 000 content services under lifestyle
offerings.
Throug
to expa
focus o
e-comm
enterta
MTN is no
Africa and
providing
offerings.
Adele’s “Hello”downloaded
11 million times
in South Africa.

MTN Group Limited Integrated Report 2015
43
OUR LEADERSHIP, GOVERNANCE, REWARD AND RECOGNITION
DATA AND DIGITAL SERVICES
MTN Mobile Money
subscribers increased to
35 millionacross 15 countries.
Ringback tones Lira JumiaZando
mAgriculture mHealthmEducation
Top five contributors:Uganda 29%Ghana 14%South Africa 13%Rwanda 12%Ivory Coast 10%
MobileMoney
subscribers
Our e-commerce joint ventures AIH and
MEIH continued to make good progress.
AIH recorded 2,3 million customers and
4,4 million transactions in 2015. MEIH
reported higher average basket sizes.

44
MTN Group Limited Integrated Report 2015
Who is responsible
Profiles of our board of directors1. PF Nhleko (55)
Executive chairman^
BSc (Civil Eng), MBA
Appointed: 28 May 2013
Board committee membership: Chairman: Nominations committee; member: remuneration and human resources committee.
Other directorships: Chairman of various companies in MTN Group, chairman of Pembani Group (Pty) Limited, director of BP Plc, Anglo American Plc, Afrisam (South Africa) (Pty) Limited, Opiconsivia Investments 230 (Pty) Limited.
Skills, expertise and experience: Strategic leadership and finance.
2. BD Goschen (51)Executive director, Group chief financial officer
BCom, BCompt (Hons), CA(SA)
Appointed: 22 July 2013
Board committee membership: Various board committee meetings by invitation.
Other directorships: Director of various companies in MTN Group.
Skills, expertise and experience: Accounting, finance and operations.
3. A Harper (59) (British)Independent non-executive director
BA (Hons)
Appointed: 1 January 2010
Board committee membership: Chairman: Remuneration and human resources committee; member: nominations committee.
Other directorships: Director of various companies in MTN Group, Azuri Technologies Limited and Gigabit Fibre Limited.
Skills, expertise and experience: General business and telecommunications.
4. KP Kalyan (61)Independent non-executive director
BCom (Law) (Hons) Economics, Senior Executive Management Programme (London Business School)
Appointed: 13 June 2006
Board committee membership: Chairman: Social and ethics committee; member: risk management, compliance and corporate governance committee.
Other directorships: Director of various companies in MTN Group, non-executive chairman of Edgo Merap, director of AOS Orwell Energy, Aker Solutions, Anglo American South Africa and Petmin Mining, member of the Thabo Mbeki Foundation Advisory Council and President Faure Gnassingbe Advisory Investment Council.
Skills, expertise and experience: Economics and the energy sector.
5. S Kheradpir (55) (American)Independent non-executive director
Bachelors, Masters and Doctorate in Electrical Engineering
Appointed: 8 July 2015
Board committee membership: Member: Risk management, compliance and corporate governance committee.
Other directorships: Director of various companies in MTN Group and Coriant International Group.
Skills, expertise and experience: Business leadership and business operations, engineering and information technology.
6. NP Mageza (61) Independent non-executive director
FCCA
Appointed: 1 January 2010
Board committee membership: Chairman: Risk management, compliance and corporate governance committee; member: audit committee; social and ethics committee.
Other directorships: Director of various companies in MTN Group, Remgro Limited, Sappi Limited, RCL Group, Eqstra Holdings Limited and Ethos Private Equity Limited.
Skills, expertise and experience: A ti b ki d fi
The board is responsible for the adoption of strategic plans, the monitoring of operational performance and management, and the development of appropriate and effective risk management policies and processes. The full extent of the board’s responsibilities is available in the board charter.
7. MLD Marole (56)Independent non-executive director
BCom (Acc), Dip Tertiary Education, MBA, Executive Leadership Development Programme
Appointed: 1 January 2010
Board committee membership: Member: Risk management, compliance and corporate governance committee; social and ethics committee.
Other directorships: Director of various companies in MTN Group, Richards Bay Mining (Pty) Limited, Santam Limited, The South African Post Office and the Development Bank of Southern Africa.
Skills, expertise and experience: Financial services.
8. AT Mikati (43) (Lebanese)Non-executive director
BSc
Appointed: 18 July 2006
Board committee membership: Member: Nominations committee; remuneration and human resources committee.
Other directorships: Director of Orascom Construction Limited, Director of various companies in MTN Group, CEO of the M1 Group Limited (an international investment group with a strong focus on the telecommunications industry) and director of various companies in the M1 Group. He also serves on the boards of the Children Cancer Centre, the International College and Columbia University board of visitors.
Skills, expertise and experience: General business and telecommunications.
^ Effective 9 November 2015.
^^ Profiles for these directors are set out in the

MTN Group Limited Integrated Report 2015
45
OUR LEADERSHIP, GOVERNANCE, REWARD AND RECOGNITION
9. MJN Njeke (57)Independent non-executive director
BCom, BCompt (Hons), CA(SA), H Dip Tax Law
Appointed: 13 June 2006
Board committee membership: Member: Audit committee; risk management, compliance and corporate governance committee.
Other directorships: Director of various companies in MTN Group, chairman of MMI Holdings Limited, Resilient Property Income Fund, Adcorp Holdings Limited, Silver Unicorn Coal and Mineral (Pty) Limited, Serengethi Properties (Pty) Limited, Sameh Properties (Pty) Limited and Sasol Limited.
Skills, expertise and experience: General finance and tax.
10. KC Ramon (48)Independent non-executive director
BCompt, BCompt (Hons), CA(SA), Senior Executive Programme
Appointed: 1 June 2014
Board committee membership: Chairman: Audit committee.
Other directorships: Director of various companies in MTN Group, AngloGold Ashanti Limited, Lafarge and deputy chair of the Financial Reporting Standards Council of South Africa.
Skills, expertise and experience: Accounting, finance and general management.
11. JHN Strydom (77)Non-executive director
MCom (Acc), CA(SA)
Appointed: 11 March 2004
Board committee membership: Member: Risk management, compliance and corporate governance committee; nominations committee; remuneration and human resources committee.
Other directorships: Director of various companies in MTN Group and director and deputy chairman of Afrisam Group (Pty) Limited and Afrisam South Africa (Pty) Limited.
Skills, expertise and experience: General business, accounting and taxation.
12. AF van Biljon (68)Lead independent non-executive director
BCom, CA(SA), MBA
Appointed: 1 November 2002
Board committee membership: Member: Nominations committee.
Other directorships: Director of various companies in MTN Group, chairman and trustee of Standard Bank Group Retirement Fund.
Skills, expertise and experience: General business, accounting and finance.
13. J van Rooyen (66)Independent non-executive director
BCom, BCompt (Hons), CA(SA)
Appointed: 18 July 2006
Board committee membership: Member: Remuneration and human resources committee; audit committee; social and ethics committee.
Other directorships: Director of various companies in MTN Group, various companies in the Uranus Group, Pick n Pay Stores Limited, Pick n Pay Holdings Limited, Exxaro Resources Limited.
Skills, expertise and experience: Accounting and finance.
RS Dabengwa (58)^^
Executive director, Group president and CEO
BSc (Eng), MBA
Appointed: 1 April 2011 as CEO and to the board in 2001
Resigned: 9 November 2015
Board committee membership: Chairman: Attended various board committee meetings by invitation.
F Titi (53)^^
Independent non-executive director
BSc Hons (Mathematics), MA (Mathematics), MBA
Appointed: 1 July 2012
Resigned: 31 December 2015
Board committee membership: Member: Remuneration and human resources committee
10
2 4 9
7
61381
3512
11

46
MTN Group Limited Integrated Report 2015
Who is responsible continued
Profiles of our executive committee1. PF Nhleko (55)
Executive chairman
BSc (Civil Eng), MBA
Executive since 9 November
2015 in an interim capacity until
a new CEO is appointed.
2. JA Desai (58)
Group chief operating officer
(since 1 December 2015)
BA (Hons), BCom
Executive since 2009
3. M Fleischer (55)
Group chief legal counsel
BProc, Advanced Tax Certificate
Executive since 2014
4. BD Goschen (51)
Group chief financial officer
5. I Jaroudi (45)
Group vice president for the
Middle East and North Africa
BA, Executive Education
Certificate
Executive since 2015
6. F Moolman (52)
CEO: MTN Nigeria
BCom, BCompt (Hons), Theory
of Accounting Dip, CA(SA)
Executive since 2015
7. PD Norman (50)
Group chief human resources
and corporate affairs officer
MA (Psych), MBA
Executive since 1997
8. M Nyati (51)
CEO: MTN South Africa
BSc (Eng), Yale World Fellow
Executive since 2014
9. K Toriola (44)
Group vice president for West
and Central Africa
BSc (Elec Eng), MSc (Comm
Systems)
Executive since 2015
The executive committee facilitates the effective control of the Group’s operational activities in terms of its delegated authority, approved by the board. It is responsible for recommendations to the board on the Group’s policies and strategies, and for monitoring their implementation in line with the board’s mandate. It meets at least monthly, and more often as required.
12
493 65 7 8
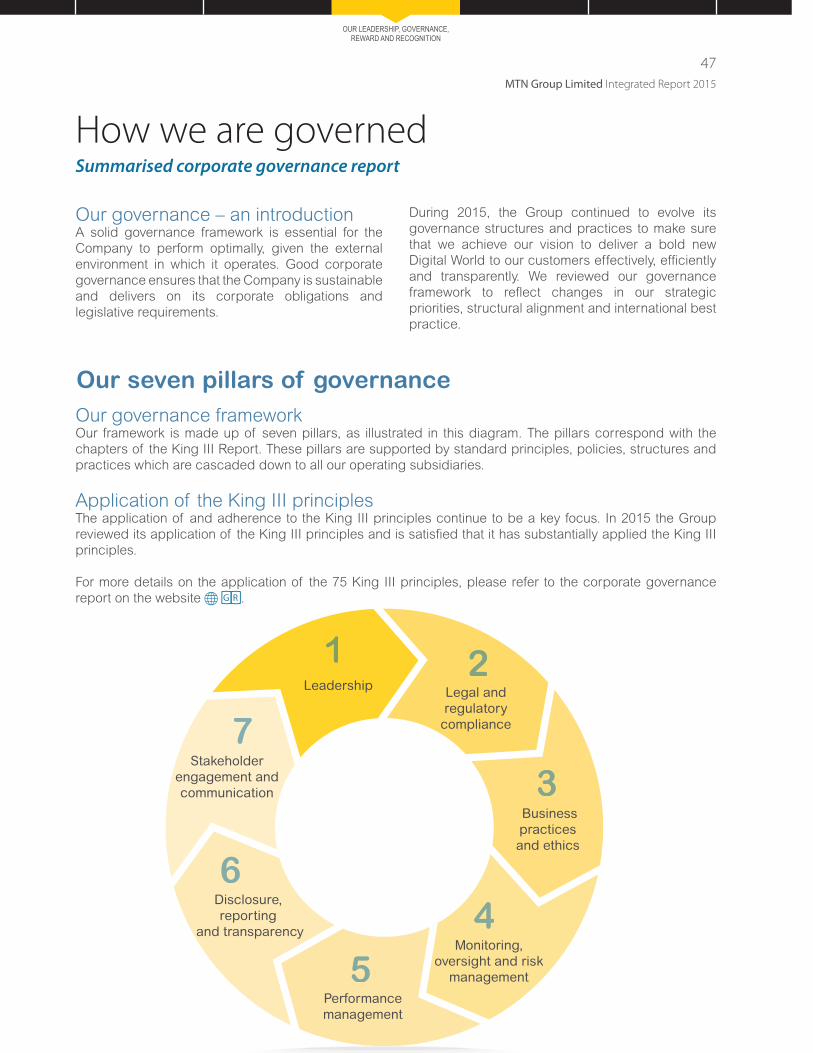
MTN Group Limited Integrated Report 2015
47
OUR LEADERSHIP, GOVERNANCE, REWARD AND RECOGNITION
1 2
3
4
5
6
7
Leadership Legal and regulatory
compliance
Business practices and ethics
Monitoring, oversight and risk
management
Performance management
Disclosure, reporting
and transparency
Stakeholder engagement and communication
How we are governed
Our governance – an introductionA solid governance framework is essential for the
Company to perform optimally, given the external
environment in which it operates. Good corporate
governance ensures that the Company is sustainable
and delivers on its corporate obligations and
legislative requirements.
Our governance frameworkOur framework is made up of seven pillars, as illustrated in this diagram. The pillars correspond with the
chapters of the King III Report. These pillars are supported by standard principles, policies, structures and
practices which are cascaded down to all our operating subsidiaries.
Application of the King III principlesThe application of and adherence to the King III principles continue to be a key focus. In 2015 the Group
reviewed its application of the King III principles and is satisfied that it has substantially applied the King III
principles.
For more details on the application of the 75 King III principles, please refer to the corporate governance
report on the website .
Summarised corporate governance report
Our seven pillars of governance
During 2015, the Group continued to evolve its
governance structures and practices to make sure
that we achieve our vision to deliver a bold new
Digital World to our customers effectively, efficiently
and transparently. We reviewed our governance
framework to reflect changes in our strategic
priorities, structural alignment and international best
practice.
48
MTN Group Limited Integrated Report 2015
How we are governed continued
These pillars are supported by standard principles,
policies, structures and practices which are
cascaded down to all our operating subsidiaries.
This report outlines each of these pillars and shows
how the Company implemented them in 2015 in an
effort to ensure an effective governance process.
Pillar 1: Our leadership: board of directors, board committees and executive management
Role of the boardThe board remains committed to good governance
and to ensuring an unequivocal tone from the top
that requires commitment by all to the values of
integrity, transparency and uninterrupted oversight
over the Company. This is to ensure that MTN
scrutinises and addresses all issues within its
operating units.
During the year, the board became more vigilant of
the accuracy of identified risks and placed greater
emphasis on ensuring compliance with regulatory
requirements.
In the current operating environment, the Company’s
culture and ethics are of paramount importance.
The board is focused on governance practices that
are in sync with all legal and regulatory requirements
and on making sure that the Company’s culture is
one which highlights the values of MTN ( 13). It is
also focused on the systematic implementation of
the cultural operating system and ensuring a robust
process for strategic decision making to address
inherent ethical challenges.
Role of the chairman and Group president and chief executive officerThe chairman of the board is PF Nhleko who has
demonstrated good leadership throughout 2015
and ensured that management was accountable to
the board. The duties and responsibilities of the
chairman include, but are not limited to the following:
providing impartial advice and guidance to the
Group president and CEO;
monitoring and managing new challenges and
opportunities faced by the Company and
management; and
ensuring that the directors are provided with
appropriate information, allowing them to make
sound decisions.
During the year under review, the chairman adopted
an open-minded approach to business and to
resolution of challenges. In board discussions, he
ensured that board members were encouraged to
provide their views, raise concerns and take any
conflicting opinions into consideration. This meant
that meetings were managed efficiently, and board
members applied their minds to decisions, while
taking the interests and sustainability of the business
into account.
RS Dabengwa, the Group president and CEO since
April 2011, resigned from the Company on
9 November 2015, leaving the position of Group
president and CEO vacant in the last two months
of 2015.
Following the resignation of the Group president
and CEO, PF Nhleko was appointed as executive
chairman on 9 November 2015, tasked with the day-
to-day management of the Group, for an interim
period of six months until a new Group president
and CEO is appointed.
The executive chairman is supported by the
executive committee, which was restructured to
achieve better alignment with the Company’s
strategic priorities and to provide a better reporting
platform to the board. The Group has always
maintained the roles and duties of a non-executive
chairman and the Group president and CEO as
separate and clearly defined, however, due to the
extenuating circumstances that exist since
November 2015, these roles have been merged for
an interim period until a Group president and CEO is
appointed by the end of June 2016. In order to
ensure that there is impartiality and no conflict of
interest on the part of the executive chairman, the
Company relies on the lead independent director for
his leadership and guidance, where necessary
( 44).
Summarised corporate governance report continued
MTN Group Limited Integrated Report 2015
49
OUR LEADERSHIP, GOVERNANCE, REWARD AND RECOGNITION
Board appointments and resignationsThe Company acknowledges that an effective board
must have the expertise and competence to promptly
and appropriately address current and emerging
issues to ensure the delivery of the Company’s
strategic objectives. Accordingly, the board
endeavours to attract and appoint members who
have relevant academic qualifications, technical
expertise and industry knowledge and who will
enhance diversity on the board.
During 2015, S Kheradpir was appointed as a
director. His appointment, effective 8 July 2015, was
conducted through a formal and transparent
process in line with the policy on the appointment of
directors and recommended by the nominations
committee ( 44). The board will also focus on filling
the current vacancies on the board.
RS Dabengwa and F Titi resigned as directors on
9 November and 31 December 2015, respectively.
Board evaluation The nominations committee, with the assistance of
the Group secretary, is responsible for assessing the
performance and effectiveness of the board, its
committees and individual directors. In line with this
practice, in 2015 an external board evaluation was
conducted by Heidrick and Struggles. Heidrick and
Struggles has recently presented the evaluation,
which is currently being considered by the board.
Diversity and composition of the board The Company acknowledges that diversity gives the
board the benefit of different perspectives and
ideas. The Group has a unitary board, consisting of
executive and non-executive directors who represent
a broad spectrum of demographic attributes and
characteristics. To promote objectivity and reduce
the possibility of conflict of interests, the majority of
directors are independent non-executive directors.
The competence and views of individual directors,
as well as their interaction during board meetings,
allows strategic oversight. Since gender is one of
attributes that contribute to a balanced composition
of the boardroom, the board is focused on improving
the representation of women on the board and
introducing new skill sets to achieve the board’s
objectives.
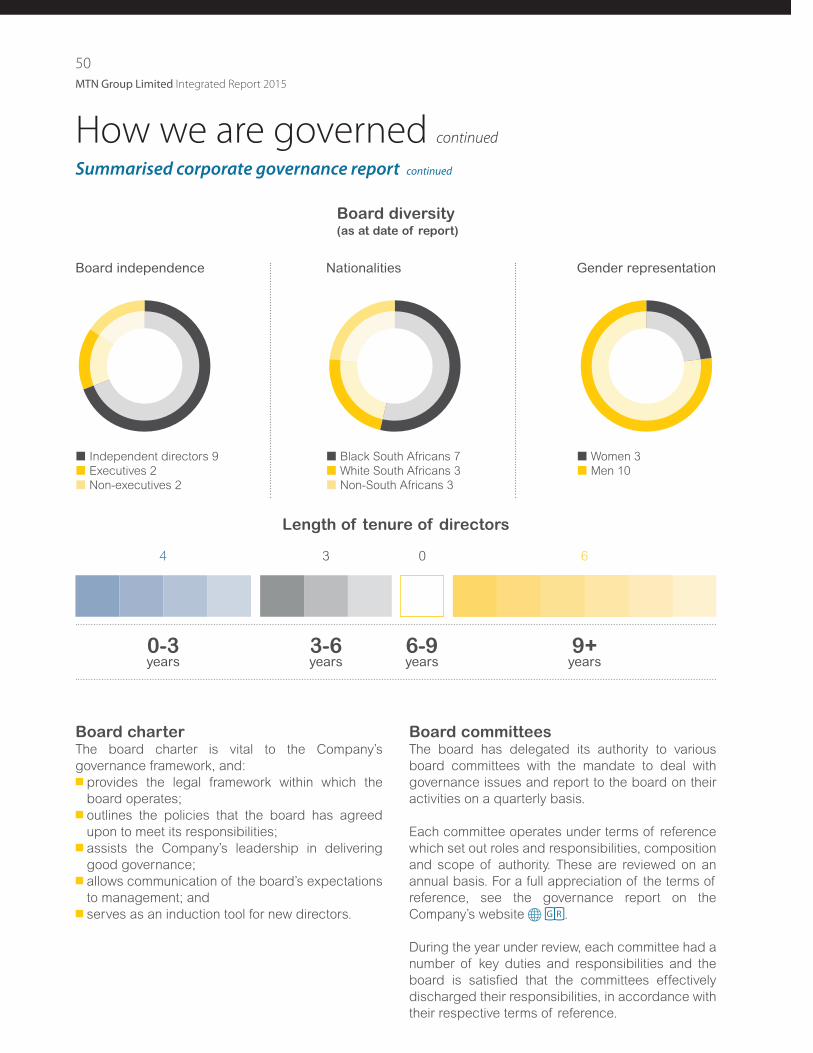
50
MTN Group Limited Integrated Report 2015
Summarised corporate governance report continued
How we are governed continued
Board charter The board charter is vital to the Company’s
governance framework, and:
provides the legal framework within which the
board operates;
outlines the policies that the board has agreed
upon to meet its responsibilities;
assists the Company’s leadership in delivering
good governance;
allows communication of the board’s expectations
to management; and
serves as an induction tool for new directors.
Board committeesThe board has delegated its authority to various
board committees with the mandate to deal with
governance issues and report to the board on their
activities on a quarterly basis.
Each committee operates under terms of reference
which set out roles and responsibilities, composition
and scope of authority. These are reviewed on an
annual basis. For a full appreciation of the terms of
reference, see the governance report on the
Company’s website .
During the year under review, each committee had a
number of key duties and responsibilities and the
board is satisfied that the committees effectively
discharged their responsibilities, in accordance with
their respective terms of reference.
Board independence
Independent directors 9
Executives 2
Non-executives 2
Black South Africans 7
White South Africans 3
Non-South Africans 3
Women 3
Men 10
Nationalities Gender representation
Board diversity (as at date of report)
0-3years
4
3-6years
3
6-9years
0
9+years
6
Length of tenure of directors
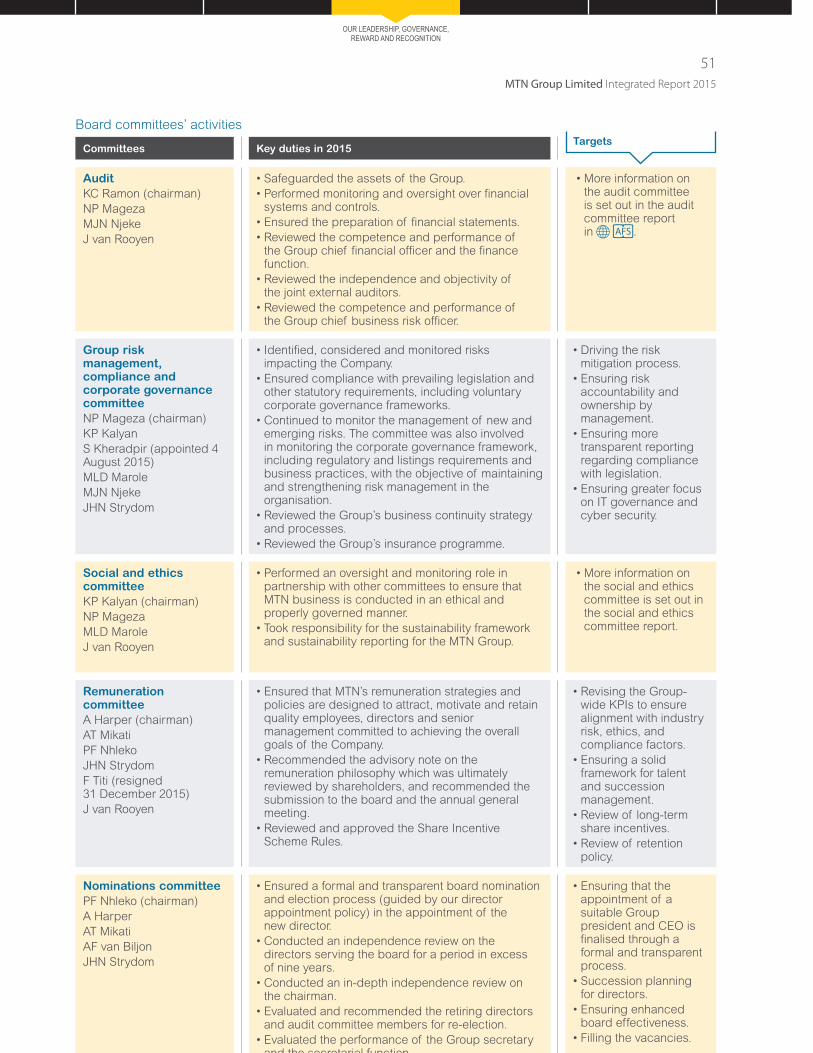
MTN Group Limited Integrated Report 2015
51
OUR LEADERSHIP, GOVERNANCE, REWARD AND RECOGNITION
Board committees’ activities
Committees Key duties in 2015Targets
Audit
KC Ramon (chairman)
NP Mageza
MJN Njeke
J van Rooyen
• Safeguarded the assets of the Group.
• Performed monitoring and oversight over financial systems and controls.
• Ensured the preparation of financial statements.
• Reviewed the competence and performance of the Group chief financial officer and the finance function.
• Reviewed the independence and objectivity of the joint external auditors.
• Reviewed the competence and performance of the Group chief business risk officer.
• More information on the audit committee is set out in the audit committee report in .
Group risk management, compliance and corporate governance committee
NP Mageza (chairman)
KP Kalyan
S Kheradpir (appointed 4 August 2015)
MLD Marole
MJN Njeke
JHN Strydom
• Identified, considered and monitored risks impacting the Company.
• Ensured compliance with prevailing legislation and other statutory requirements, including voluntary corporate governance frameworks.
• Continued to monitor the management of new and emerging risks. The committee was also involved in monitoring the corporate governance framework, including regulatory and listings requirements and business practices, with the objective of maintaining and strengthening risk management in the organisation.
• Reviewed the Group’s business continuity strategy and processes.
• Reviewed the Group’s insurance programme.
• Driving the risk mitigation process.
• Ensuring risk accountability and ownership by management.
• Ensuring more transparent reporting regarding compliance with legislation.
• Ensuring greater focus on IT governance and cyber security.
Social and ethics committee
KP Kalyan (chairman)
NP Mageza
MLD Marole
J van Rooyen
• Performed an oversight and monitoring role in partnership with other committees to ensure that MTN business is conducted in an ethical and properly governed manner.
• Took responsibility for the sustainability framework and sustainability reporting for the MTN Group.
• More information on the social and ethics committee is set out in the social and ethics committee report.
Remuneration committee
A Harper (chairman)
AT Mikati
PF Nhleko
JHN Strydom
F Titi (resigned 31 December 2015)
J van Rooyen
• Ensured that MTN’s remuneration strategies and policies are designed to attract, motivate and retain quality employees, directors and senior management committed to achieving the overall goals of the Company.
• Recommended the advisory note on the remuneration philosophy which was ultimately reviewed by shareholders, and recommended the submission to the board and the annual general meeting.
• Reviewed and approved the Share Incentive Scheme Rules.
• Revising the Group-wide KPIs to ensure alignment with industry risk, ethics, and compliance factors.
• Ensuring a solid framework for talent and succession management.
• Review of long-term share incentives.
• Review of retention policy.
Nominations committee
PF Nhleko (chairman)
A Harper
AT Mikati
AF van Biljon
JHN Strydom
• Ensured a formal and transparent board nomination and election process (guided by our director appointment policy) in the appointment of the new director.
• Conducted an independence review on the directors serving the board for a period in excess of nine years.
• Conducted an in-depth independence review on the chairman.
• Evaluated and recommended the retiring directors and audit committee members for re-election.
• Evaluated the performance of the Group secretary and the secretarial function
• Ensuring that the appointment of a suitable Group president and CEO is finalised through a formal and transparent process.
• Succession planning for directors.
• Ensuring enhanced board effectiveness.
• Filling the vacancies.

52
MTN Group Limited Integrated Report 2015
How we are governed continued
Summarised corporate governance report continued
Delegation of authority The board reserves all decision-making authority to
itself, unless such power and authority is delegated
to the Group president and CEO, with the intention
of ensuring that the correct balance of responsibility
is struck between the board and executive
management, in the interest of all stakeholders.
While the board plays an oversight role over the
Company, the Group president and CEO and his
executive management are empowered to manage
and lead the business on a day-to-day basis, guided
by an approved delegation of authority.
The Company’s delegated structures, which include
the board committees, encourage and promote
open discussion which enhances the board’s
monitoring function over all areas of the Company.
Director developmentIn order to ensure that all directors on both the board
and committees of the Company are adequately
equipped with the latest information and knowledge
relating to the business of the Company and to
continuously support them in their role as directors,
the Company provides ongoing training relating to
general management, corporate governance, any
updates in laws and regulations and best practices
affecting the business. One of the key objectives
for 2016 is to provide the board with a more robust
and interactive training programme that tackles
matters directly linked to managing the business’s
key priorities.
Group secretaryThe board is assisted by a competent and suitably qualified Group secretary, Bongi Mtshali, who has over 30 years of company secretarial experience. The Group secretary is not a director of the Company and has an arm’s-length relationship with the board. Further details of her qualifications and her assessment are on the Company’s website .
Directors engage with the Group secretary regularly for governance and regulatory advice. She also ensures the proper administration of the board and adherence to sound ethical practices.
The performance of the Group secretary, as well as her relationship with the board, is assessed on an annual basis by the board and the nominations committee. The assessment considers the competency, qualifications and experience of the Group secretary and whether she maintains an arm’s-length relationship with the board. For the reporting period the board is satisfied that she is suitably qualified and her relationship with the board is adequate to ensure her independence from
director influence or conflict of interest.

MTN Group Limited Integrated Report 2015
53
OUR LEADERSHIP, GOVERNANCE, REWARD AND RECOGNITION
Attendance register
Names Scheduled
board
Special
board
Risk Audit Nomina-
tions
Remco Social and
ethics
Number of meetings (7) (12) (4) (6) (1) (6) (4)
PF Nhleko 7 12 1 5
A Harper 7 12 1 6
KP Kalyan 7 10 4 4
S Kheradpir^ 4 8 1
NP Mageza 6 8 4 6 4
MLD Marole 7 11 4 4
AT Mikati 7 12 1 5
MJN Njeke 5 11 3 3
KC Ramon 7 11 6
F Titi~ 6 10 6
JHN Strydom 6 12 4 1 6
AF van Biljon 7 12 1
J van Rooyen 7 12 6 6 4
RS Dabengwa# 5 3 3^^ 5^^ 1^^ 4^^ 3^^
BD Goshen 7 9 4^^ 6^^ 4^^
^ Appointed 8 July 2015.
# Resigned 9 November 2015.
~ Resigned 31 December 2015.^^ By invitation.
The board annual meeting cycle The board works to an annual plan, with a number of matters reserved for board deliberation at each
regular scheduled meeting.
Ad hoc meetings A number of special and ad hoc committee meetings were held in 2015 in order to address various issues at a board level. Ad hoc meetings are convened at short notice and directors are not always available to attend the meetings.
The ad hoc committee meetings are not included in the register; however they have been accounted for in the fee schedule set out on 88 of the integrated report.

54
MTN Group Limited Integrated Report 2015
How we are governed continued
Pillar 2: Legal and regulatory compliance As a telecommunications company operating in a
number of environments that are governed by various
laws and regulations, the board places great
emphasis on compliance with all laws and regulations,
under any and all circumstances. MTN Group takes
compliance issues seriously, investigates all
compliance breaches and where a breach has
occurred, revisits all operational controls and ensures
that the Company continues to operate in line with
established law.
The Company’s policies set out expectations that all
employees comply with all laws and regulations
governing the Company’s business.
The board also tasks management with identifying the
laws and regulatory obligations applicable to the
Company, implementing a comprehensive compliance
policy and regularly monitoring compliance risk
through the established risk management processes.
The Company has implemented a new regulatory and
compliance organisational structure which will be
responsible for undertaking the following initiatives:
overseeing the implementation of internal
processes and policies;
ensuring timeous compliance with laws and
regulations;
providing oversight on regulatory compliance;
promoting awareness and training; and
ensuring proper records management and
document retention.
Summarised corporate governance report continued
BOARD OF DIRECTORS
GROUP RISK MANAGEMENT, COMPLIANCE AND
CORPORATE GOVERNANCE COMMITTEE
COMPLIANCE COMMITTEE
REGIONAL
VICE
PRESIDENTS
GROUP CHIEF
LEGAL COUNSEL
GROUP
REGULATORY
AND
COMPLIANCE
OFFICER
REGIONAL
COMPLIANCE
OFFICER
OPERATING COMPANY COMPLIANCE OFFICERS
OPERATING
COMPANY CEOs
GROUP
FINANCE
GROUP CHIEF OPERATING OFFICER
GROUP
BUSINESS RISK MANAGEMENT
GROUP HR AND
CORPORATE
AFFAIRS
GROUP EXCO
GROUP COMPANY
SECRETARY
The compliance structure will be as follows:
MTN Group Limited Integrated Report 2015
55
OUR LEADERSHIP, GOVERNANCE, REWARD AND RECOGNITION
Pillar 3: Business practices and ethicsIn 2015, the board continued to strive to ensure that
ethics is the foundation of how the Company
operates and that corporate governance best
practices were entrenched. Accordingly, the
directors recognise their responsibility to set the
tone from the top, by avoiding instances of conflict
of interest and having the interests of the Company
at the forefront of all decision making.
Although the foundation for ethics has been
embedded in the past two years, the operating
companies faced obstacles which staggered their
progress in ethics management. These included the
lack of resources, language and cultural barriers
and the mindset of some employees.
Despite the setbacks highlighted above, each
operating company continues to strive to further
entrench ethics through a systemic methodology.
Each company is supported by ethics champions
who provide effective guidance, encourage
employees to report all instances of fraud through
the whistle-blowing “hotline” and ensure that the
Company’s ethics is efficiently implemented and
reported to the Group’s social and ethics committee
on a quarterly basis.
The Company also continues to safeguard the
interests of stakeholders, such as the community,
employees, customers and suppliers, by monitoring
the Company’s activities with regard to social and
economic development, corporate citizenship,
consumer relationships, the environment, health and
public safety and labour and employment matters.
Pillar 4: Monitoring, oversight and risk managementThe Company’s corporate governance structure
ensures effective internal controls and monitors the
management of significant matters. The audit
committee, as well as the risk management,
compliance and corporate governance committee
provide an environment in which challenging issues
can be considered and monitored.
The strategic and operational risk management
framework of the Company focuses on various risks
that could affect the Company’s customer
experience, operational agility, cost competitiveness
and stakeholder confidence. This is done through a
robust risk methodology that analyses not only what
the Company does, but also how it is done, to
guarantee sustainable economic viability, make the
most of market opportunities and serve a rapidly
changing market.
Subsequent to the challenges faced by the Company
in 2015, the board is eager to enhance the proficiency
of the risk management process and will continue to
guide the Company towards better risk mitigation,
through ascertaining and appreciating significant
risks, investing resources in alleviating existing risks
that are critical to the Company and driving the risk
accountability and ownership through management.
56
MTN Group Limited Integrated Report 2015
Pillar 5: Performance managementThe board stresses the importance of promoting a
healthy workplace environment which includes
ethics and compliance through established policies
based on the values of integrity, leadership,
innovation, relationships and “can do” as well as the
vital behaviours. It promotes targeted results in a
transparent and systematic manner which ensures
that the Company’s employees are productive,
provide efficient services and demonstrate the
required knowledge, skills, behaviour, competencies
and engagement to perform their duties to the best
of their ability.
Like any organisation, there are instances of
unsatisfactory employee performance, however, the
Company endeavours to address such issues
expeditiously through internal Company procedures
in line with the disciplinary process and its
performance management system.
Pillar 6: Disclosure, reporting and transparencyDisclosure, reporting and transparency are
fundamental components of the Company’s
corporate governance framework to provide
accountability to stakeholders and support them in
making informed decisions.
MTN endeavours to be transparent, especially
regarding material issues. Since the imposition of
the Nigeria regulatory fine, the Company has
enhanced its policies and procedures that govern
the provision of timeous, correct and complete
information to stakeholders, in a manner which gives
all stakeholders equal access to information and
ensures that there is no stakeholder that is
treated favourably over others. The Company has
also re-emphasised that all matters must be provided
to stakeholders in compliance with the law and
applicable regulations.
Pillar 7: Stakeholder engagement and communicationThe board values the Company’s stakeholders and
strives to take their concerns and interests into
account when making business decisions. This not
only enables it to anticipate and manage risk
effectively, but also helps it identify new business
opportunities and improve MTN’s relationship with
its stakeholders. It also makes it easier for the
Company to deliver on its objectives and benefit
from ideas for products or services that address
stakeholder needs, and at the same time allows the
Company to reduce costs and maximise value. In
order to ensure greater accountability, the Company
has a stakeholder-conscious governance model
which places emphasis on dialogue and responding
to stakeholder concerns and interests.
How we are governed continued
Summarised corporate governance report continued
MTN Group Limited Integrated Report 2015
57
Risk management, compliance and corporate governance committee chairman’s report
The role of the committee is to oversee risk
management, compliance and corporate governance
across MTN Group’s 22 operations and jurisdictions
and make recommendations in this regard to the
board for consideration and approval.
Among its responsibilities (more details of which are
on 51), the committee assists the board in ensuring
that the risk profile of the Group is acceptable and is
within the Group’s risk appetite, its assets are
protected, and that the Company is compliant with
legislative and regulatory requirements. It also
assists the board in ensuring that MTN’s identification
and management of risks is comprehensive, timely
and relevant.
While regulatory risk was considered one of the
Group’s top risks in both 2014 and 2015 (see
the top risk table on 24), the events of 2015
showed that closer monitoring of compliance with
laws across all markets was necessary.
Indeed, the imposition by the Nigerian regulator in
October 2015 of a significant fine on MTN Nigeria
put regulatory risk and compliance at MTN under
the spotlight. It provided the committee with an
opportunity to review the robustness of its structures
and improve management processes and training
on compliance and regulation throughout the Group.
We noted the deleterious consequences of some
aspects of some Group policies, recognising that
the drive for revenue growth must not be at the
expense of compliance with rules and regulations.
It also led to the creation of a more formalised
MTN Group compliance function, which will ensure
adherence to laws and regulations in each operation
and facilitate the unhindered flow of information
between operations and the Group, particularly in
matters regarding legal compliance and risk. In this
way, we put structural safeguards in place, making
the Group better able to monitor compliance
timeously throughout its operations.
The executive committee and the board approved
the new compliance operating model and structure
in February 2016. For more details, see 54.
Apart from the focus on compliance prompted by
the Nigerian fine, the committee’s work in 2015
involved monitoring the rollout of Project Next!
(MTN’s back office transformation programme), IT
and treasury governance as well as close attention
to business continuity management and crisis risk
management. In particular, the committee provided
advice to management during the Ebola crisis and in
war-torn countries like Syria, Yemen and Afghanistan.
We worked to implement a plan to develop a
sustainable, manageable and effective capability to
respond to business disruption, such as that which
arose during industrial action in South Africa.
While the Ebola outbreak continued in early 2015,
MTN’s operations in Liberia and Guinea-Conakry
continued unhindered. Several MTN opcos were
impacted by adverse security situations, yet
employees ensured that services remained
operational except for some isolated closures of
service centres. In the instances of outages
impacting towers, opcos called on disaster
recovery and business continuity plans to implement
re-routing to make up for site failures. Continuing
work in this regard remains a priority.
In 2016, the committee will focus on:
implementing an integrated approach to
compliance, governance, reputation and ethics
management, including more rigorous training at
board and opco level on these;
aligning the objectives of operations to ensure a
balance between financial performance and risk
management, compliance and ethical business
practices;
enhancing business continuity activities to ensure
readiness as and when the need arises amid a
deteriorating security situation in some markets;
improving information security practices; and
monitoring the rollout of Project Next! and the
benefits realised by each operational unit.
MTN is committed to sound risk management,
compliance, governance and internal controls to
facilitate the delivery of the Group strategy. The
committee will continue to ensure robust and relevant
structures, processes and systems are in place to
enable the close monitoring of risk and compliance
across operations.
Peter Mageza
2 March 2016
OUR LEADERSHIP, GOVERNANCE, REWARD AND RECOGNITION
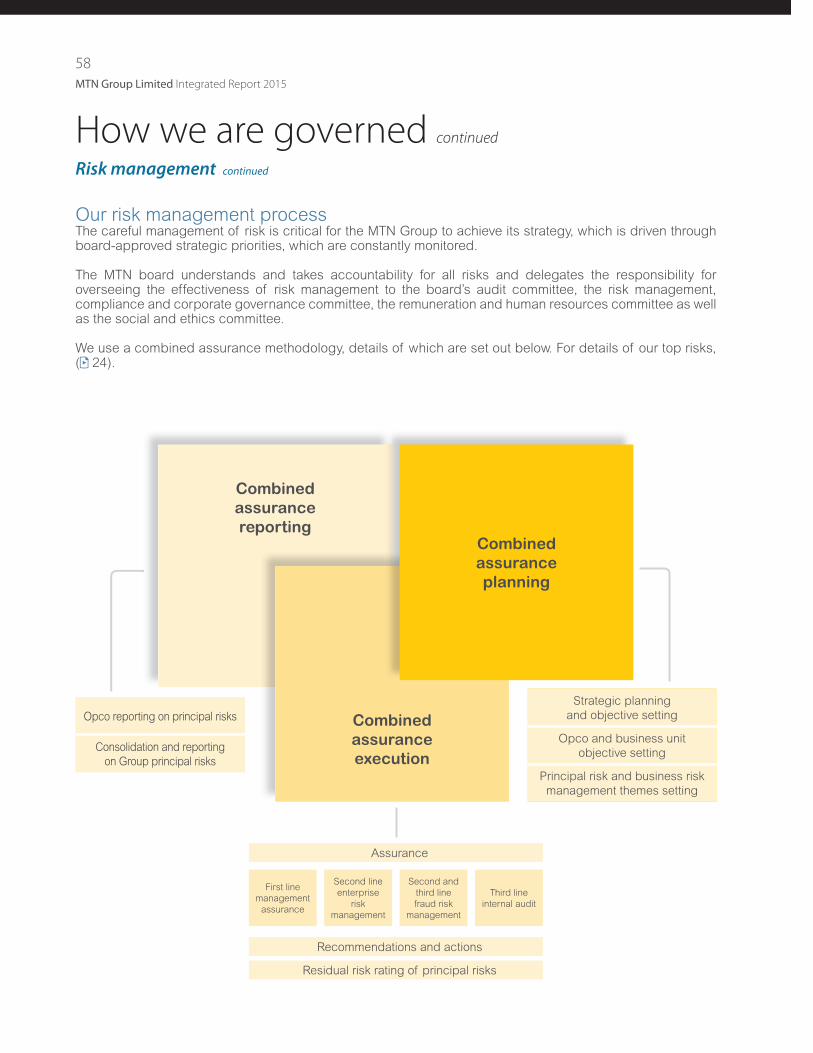
58
MTN Group Limited Integrated Report 2015
Risk management continued
How we are governed continued
Our risk management processThe careful management of risk is critical for the MTN Group to achieve its strategy, which is driven through board-approved strategic priorities, which are constantly monitored.
The MTN board understands and takes accountability for all risks and delegates the responsibility for overseeing the effectiveness of risk management to the board’s audit committee, the risk management, compliance and corporate governance committee, the remuneration and human resources committee as well as the social and ethics committee.
We use a combined assurance methodology, details of which are set out below. For details of our top risks, ( 24).
Assurance
Residual risk rating of principal risks
Recommendations and actions
First line
management
assurance
Second line
enterprise
risk
management
Second and
third line
fraud risk
management
Third line
internal audit
Strategic planning
and objective setting
Opco and business unit
objective setting
Principal risk and business risk
management themes setting
Opco reporting on principal risks
Consolidation and reporting
on Group principal risks
Combined
assurance
reporting
Combined
assurance
execution
Combined
assurance
planning
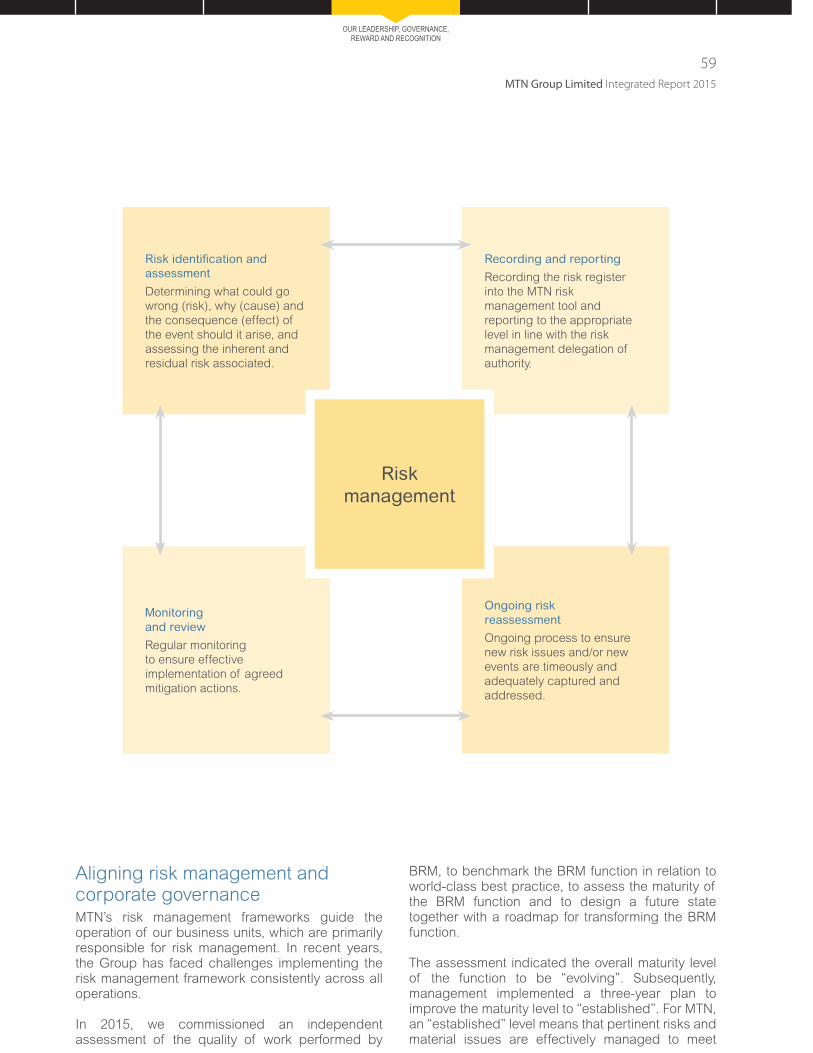
MTN Group Limited Integrated Report 2015
59
OUR LEADERSHIP, GOVERNANCE, REWARD AND RECOGNITION
Risk identification and assessment
Determining what could go
wrong (risk), why (cause) and
the consequence (effect) of
the event should it arise, and
assessing the inherent and
residual risk associated.
Monitoring and review
Regular monitoring
to ensure effective
implementation of agreed
mitigation actions.
Recording and reporting
Recording the risk register
into the MTN risk
management tool and
reporting to the appropriate
level in line with the risk
management delegation of
authority.
Ongoing risk reassessment
Ongoing process to ensure
new risk issues and/or new
events are timeously and
adequately captured and
addressed.
Risk management
Risk management
Aligning risk management and corporate governanceMTN’s risk management frameworks guide the operation of our business units, which are primarily responsible for risk management. In recent years, the Group has faced challenges implementing the risk management framework consistently across all operations.
In 2015, we commissioned an independent assessment of the quality of work performed by
BRM, to benchmark the BRM function in relation to world-class best practice, to assess the maturity of the BRM function and to design a future state together with a roadmap for transforming the BRM function.
The assessment indicated the overall maturity level of the function to be “evolving”. Subsequently, management implemented a three-year plan to improve the maturity level to “established”. For MTN, an “established” level means that pertinent risks and material issues are effectively managed to meet
60
MTN Group Limited Integrated Report 2015
Risk management continued
How we are governed continued
stakeholder expectations to both protect and enhance value.
We set up working groups to drive the implementation of the roadmap. These focus on:
Revising BRM’s current purpose; Defining a new BRM operating model (inclusive of a new skills set); Enhancing processes, incorporating revised methodologies, reporting lines, quality assurance, and knowledge sharing; Implementing a new technology tool; and Integration and change management of the function.
Critical success factors will include, among others:The right tone at the top, both at the Group level and all operating units and entities;Clear measures of success and regular and robust monitoring of performance; andStrong relationships at all levels of the business.
Business continuity management
(BCM) and crisis risk management
(CRM)Some of the major events which occurred in the past year highlighted gaps in our Group-wide BCM programme. To ensure that these gaps are addressed, we initiated a Group-wide BCM project to revamp and streamline our BCM approach and ensure that the Group has an effective structure to respond to disruptions in our business.
Our BCM approach leverages on industry best practice and standards, including ISO 22301 standards for BCM and the Business Continuity Institute Good Practice Guidelines, and ensures that we put in place adequate measures to protect our business brand and reputation and comply with statutory, regulatory and contractual obligations.
We enhanced and supported our BCM programme by introducing a Group-wide crisis management programme, which aims to improve our capability to respond to and manage crisis events across the MTN Group.
Insurance and risk transferThe MTN insurance programme is built around the close connection between risk management and insurance using an annual assessment of risk management at each operating company.
To achieve this, there is a strong commitment to the risk management assessment process, improving operational management’s adoption of risk management best practices and to reduce risks across the entire insurance programme.
MTN has an insurance programme in place that covers perils such as physical/material damage, business interruption, political risk, public liability, directors’ and officers’ liability, crime and professional indemnity. The limits of indemnity for these covers have been structured so that MTN has adequate cover for its risks, but also gets maximum value from the programme and that premium spend is efficient. We also believe that risk retention and self-insurance are necessary to keep premiums at reasonable levels and show commitment towards risk management. MTN’s retention levels differ from policy to policy, guided by the nature of the risk being transferred.
MTN has a cell captive structure in place to support the insurance programme. In 2015, we continued to build the captive’s capacity for additional risks which may best reside within it.
This includes financial lines (fidelity guarantee, professional indemnity, and directors’ and officers’ liability) cover for Iran, Sudan and Syria which are uninsurable due to sanction constraints and/or political violence. We have no political violence cover in place for Syria and Sudan and no political risk cover in place for Syria, Sudan or South Sudan. Other operations that are not covered under this placement are South Africa, Botswana, Cyprus and Swaziland, as risk is perceived as low in these countries. Afghanistan is covered under a Multilateral Investment Guarantee Agency placement and Iran is covered under an Export Credit Insurance Guarantee Agency.
Information and technology governanceMTN acknowledges information and technology as integral strategic assets to the business in delivering a bold new Digital World to its customers. MTN’s commitment to sound governance is supported by the ongoing activities and efforts in embedding the King III Code of Corporate Governance principles and recommendations, with specific focus on technology governance through the establishment of various responsibilities, processes and supporting governance structures.
MTN Group Limited Integrated Report 2015
61
OUR LEADERSHIP, GOVERNANCE, REWARD AND RECOGNITION
The Group information security function monitors the rollout of the security framework as per the deployment plan. Compliance to the framework will be independently assessed. Further, a new cyber strategy is being developed to ensure threats and vulnerabilities are proactively managed.
Adequate effort at all levels and proper risk management practices will continue to ensure that technology governance is fully integrated across all MTN operations and that current and emerging information security risks, such as cyber security and data privacy, are proactively addressed.
Fraud risk managementMTN Group’s fraud risk management strategy continues to evolve to meet the dynamic shifts in international fraud risk trends. Historically, MTN has been focused on fraud detection and response, however greater emphasis is now being placed on proactive fraud prevention strategies. The significant components of MTN’s fraud prevention strategy are the effective integration of fraud risk management within a combined assurance environment, the rollout of the MTN Group ethics framework and greater organisational fraud awareness.
Thirteen MTN operations have dedicated forensic personnel. The rest of the operations are supported through the local internal audit and enterprise risk management functions or the Group fraud risk management function.
The majority of identified fraud incidents are reported via internal channels with employees preferring to report potential fraud incidents directly to the investigation team. However, MTN continues to provide employees and relevant stakeholders with access to an anonymous reporting facility managed by Deloitte. All whistle-blowing reports received are investigated and feedback is provided to the Group’s audit and risk committee structures to ensure that independent governance is maintained.
The MTN Group’s current top fraud risks are:Procure-to-pay associated fraud risks;Products and services-related fraud risks (including distribution channels);Financial services-related fraud risks; andCyber crime and confidential information leakage.
Internal auditThe MTN Group and all its subsidiaries embrace the principles of King III and recognise the significant opportunities that present themselves to companies that do so.
Internal audit’s role is that of an objective and independent value-adding assurance provider that embraces a risk-based auditing approach, in line with King III, to the Group’s exco and board. It considers the risks that may hamper the achievement of strategic priorities and further determines the effectiveness of MTN’s systems of internal control and risk management.
MTN’s internal audit has adopted a combined assurance model as a co-ordinated approach to all assurance activities. MTN has dedicated teams that perform internal audits across the Group. The internal audit function is being transformed in line with the recommendations of the evaluation that was undertaken during the year. At a Group level, internal audit reports functionally to the audit committee and administratively to the Group president and CEO. Internal audit coverage is extended to all operations and high-risk processes in line with the internal audit methodology.
In 2015, more than 201 370 hours were spent on internal audit.

62
MTN Group Limited Integrated Report 2015
Committee terms of engagementThe board delegates the oversight of MTN’s ethics
management to the social and ethics committee,
through which the board holds the CEO accountable
for MTN’s ethics performance. As a statutory
committee of the Company and its subsidiaries, the
committee fulfils its duties in terms of sections 72(4)
and (5) of the Companies Act, 2008 and regulation 43
of the Companies Regulations, 2011.
Committee members and their attendance at meetingsAll committee members are independent non-
executive directors:
Members Attendance
KP Kalyan (chairperson) 4/4
NP Mageza 4/4
MLD Marole 4/4
J van Rooyen 4/4
The remuneration of members in 2015 is set out on
86 and the fees for 2016 are disclosed in the
notice of the annual general meeting.
Role of the committee and the execution of its mandateThe committee works in partnership with the risk
management, compliance and corporate
governance committee to ensure that MTN, as a
responsible corporate citizen, conducts its business
in a sustainable manner, with an ethical corporate
culture at its core. The committee remains committed
to developing and reviewing policies and governance
structures and practices to guide the Company’s
approach to emerging social and ethics challenges,
in line with its terms of reference.
In 2015, the committee placed further emphasis on
reviewing the material risks relating to the provisions
of the code of ethics. The committee also ensured
that such risks were managed as part of the
Company’s risk management programme in order to
drive the values of integrity and ethical conduct
across all operations.
In line with the Group’s value of integrity, MTN joined
the Alliance for Integrity, a business-driven
multistakeholder initiative run by the Deutsche Gesellschaft für Internationale Zusammenarbeit (GIZ) on behalf of the German Federal Ministry for
Economic Co-operation and Development (BMZ).
The alliance promotes anti-corruption and integrity
among companies, their business partners and
other relevant players in the economic system.
Through this initiative, MTN shares best practice with
multinational companies all over the world and learns
new approaches to dealing with ethics-related
challenges.
While we recorded progress across MTN operations
in terms of select elements of the ethics programme,
we devoted special attention to the implementation
of ethics risk assessments and risk mitigation plans.
These ensure that substantive regulatory
developments, relevant legislation and other legal
requirements are taken into account.
Governance of ethicsWith the oversight of the committee, the Company
continued with its long-term ethics management
intervention which is aligned with the Company’s
ethics risk profile. We also strengthened our ethics
governance and management capabilities for
improved delivery against the expanded terms of
reference of in-country audit and risk committees in
the following ways:
We equipped in-country audit and risk committee
chairpersons with an understanding of their ethics
governance roles and responsibilities; and
We developed an ethics governance toolkit for all
ethics role-players, including an ethics management
reporting framework to direct internal ethics
reporting.
Codes and policiesWe rolled out online declarations regarding conflicts
of interest and gifts and facilitated training:
In line with good corporate governance practices,
MTN Group’s conflict of interest policy makes it
compulsory for all employees and directors to
declare annually any conflicts of interest. We
concluded the first annual online declarations in
February 2015.
Ethics governance structuresMTN’s ethics governance structures continued to
assist with various aspects of ethics management in
2015 These structures comply with specific internal
Social and ethics committee report
How we are governed continued
MTN Group Limited Integrated Report 2015
63
and/or legislated requirements for skill, purpose and
constitution. They include:
MTN Group board’s social and ethics committee,
which continued to ensure collaboration between
its own activities and those of other board
committees and operational structures;
The in-country audit and risk board committees;
MTN opco ethics management task teams, which
are non-formal, multidisciplinary structures
established to drive the management of ethics in
each opco;
Ethics champions, who are CEO-nominated senior
managers in each opco who manage the ethics
agenda within each opco with the help of the opco
ethics task teams;
Cultural operating system influencers. Through
their demonstrated interest in and passion for
defined, positive culture change, these individuals
have been selected and trained to drive the
development of the MTN culture. These “MTNers”,
the details of whom are recorded in the MTN
Group’s influencer database, have been called
upon to assist in specific initiatives to drive the
evolving culture;
Five certified ethics officers registered with the
Ethics Institute of South Africa; and
An ethics senior manager at the Group’s
head office.
Institutionalisation and reportingWe continued to implement the MTN Group reporting
framework, which is designed to drive the quality of
ethics reporting, with due cognisance of the ethics
management maturity level of each opco. This
included:
Internal and external reporting on ethics
performance;
Developing a Group-wide ethics communications
campaign;
In addition to MTN’s fraud policy, which helps to
address fraud before it happens, and as part of
the MTN anti-fraud training programme, the Group
marked “International Fraud Awareness Week”.
The Group’s business risk management team ran
an internal campaign “Be the voice, keep it ethical”
during which employees were encouraged to
report suspected incidences of fraud, bribery,
and/or corruption. The week’s activities helped
create a clear understanding of the negative
impact of fraud, bribery and corruption and
reminded employees about the whistle-blowing
facility and their role when they suspect
wrongdoing;
Employee Fraud and Credit Wellness Day formed
part of the Fraud Awareness Week and gave
“MTNers” the opportunity to get a free credit
check, understand the importance of regular
credit report reviews and learn more about debt
counselling and debt review;
We launched an e-learning module on MTN’s anti-
bribery and corruption policy, which is designed to
guide employees through various MTN-specific
scenarios and appropriate conduct; and
We rolled out to MTN operations both mandatory
and recommended ethics e-learning offerings for
line managers, ethics role-players and employees.
A total of 2 126 ethics-related programmes were
completed during the period under review. The
majority of learners (84,5%) were non-managerial
employees while 15,5% were managers.
2016 prioritiesDevelop DVD-based learning materials to deepen
the competence of ethics champions and provide
ongoing support to ethics role-players.
Roll out of an officer certification programme to
select opcos in collaboration with the Ethics
Institute of South Africa.
Provide more oversight on opco social and ethics
matters, including holding some social and ethics
committee meetings at the opcos.
CEOs and their direct reports to attend ongoing
ethics training workshops.
MTN to participate in the South African business
ethics survey 2016, conducted by the Ethics
Institute.
Detailed ethics management KPAs for all ethics
role-players in the Group.
Drive ethics risk assessments and ethics risk
mitigation plans in all MTN operations.
Conduct independent ethics risk assessments in
MTN Nigeria and MTN South Africa.
Roll out extensive ethics communication campaigns
across the Group.
Develop and implement the human rights toolkit to
support human rights policy implementation
across the Group.
Analyse opco ethical challenges as identified by
CEOs for inclusion in opco action plans.
More information on the social and ethics committee
is set out on ( ).
KP Kalyan
2 March 2016
OUR LEADERSHIP, GOVERNANCE, REWARD AND RECOGNITION

64
MTN Group Limited Integrated Report 2015
To illustrate the depth of our management
team, here we give details of the senior
managers who run our operations as at
2 March 2016.
Our management depth
CameroonIvory Coast Ghana Uganda
Brian GouldieCEO
Mike BlackburnCFO
Denys WebbActing CFO
Freddy TchalaCEO
Ebenezer AsanteCEO
Modupe KadriCFO
Philisiwe SibiyaCEO
Ferdinand MoolmanCEO
Olusegun AkinfenwaActing CFO
di d M l
OlusActin
Nigeria
Ebenezer BodylawsonCFO
Modupe Kadri
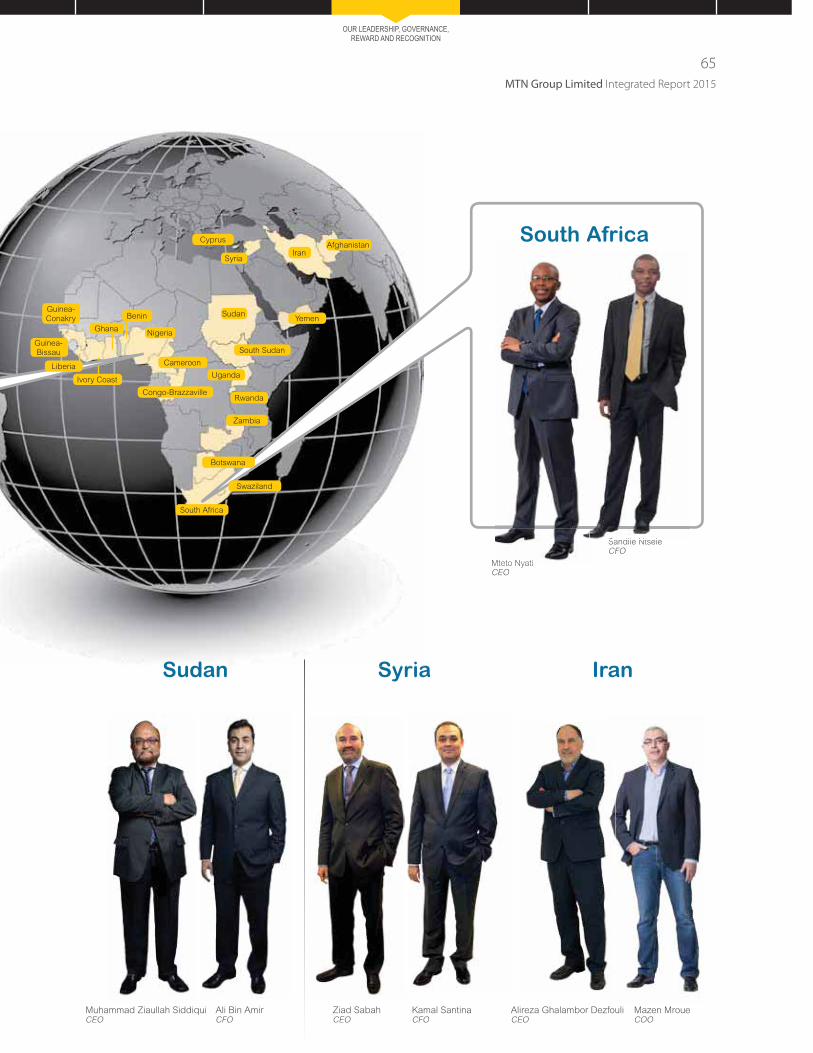
MTN Group Limited Integrated Report 2015
65
OUR LEADERSHIP, GOVERNANCE, REWARD AND RECOGNITION
Syria Iran Syria
South Africa
Botswana
Zambia
Yemen
Cyprus
Syria
AfghanistanIran
Rwanda
Uganda
South Sudan
Sudan
Congo-Brazzaville
Swaziland
South Africa
Ghana
Guinea-Conakry
Guinea-Bissau
Benin
Cameroon
Nigeria
Sudan
Ivory Coast
Ali Bin AmirCFO
Ziad SabahCEO
Kamal SantinaCFO
Alireza Ghalambor DezfouliCEO
Muhammad Ziaullah SiddiquiCEO
Mteto NyatiCEO
Sandile NtseleCFO
Mazen MroueCOO
South A
Mteto Nyati
S dil Nt l
Liberia
66
MTN Group Limited Integrated Report 2015
It is my pleasure to present our people and their
remuneration report for 2015. This year, we have
included a section on our people as part of the
remuneration report to provide more detail on how
we manage our people and the context for the
remuneration decisions we took given some of the
challenges we faced in the year.
Review of 2015In 2015, the remuneration committee felt the impact
of the challenging operating environment across our
markets. A key challenge in the year was the
industrial strike action in MTN South Africa related to
employees not receiving bonuses as a result of the
operation not meeting its bonus criteria for the 2014
financial year.
Unfavourable economic conditions, continued price
competition, a tough regulatory environment and a
rapidly evolving sector required a comprehensive
review of our people management. The key initiatives
taken in light of these challenges in 2015 included:
A reduction in the pool of funds for incentive
schemes as a result of lower returns from our
investments coupled with cost pressures;
For the first time, most of our operations did not
meet their minimum financial targets resulting in no
incentives being paid;
A review of compliance and regulatory
requirements across our operations; and
Impactful, transparent and simplified engagements
with various stakeholders including employees,
governments and social partners.
Despite these challenges, we achieved a moderate
year-on-year improvement in people management
indicators including voluntary staff turnover rates,
engagement scores, and positive signs of culture
change. We also made progress in the development
and investment commitments to our talent. To drive
accountability at key managerial levels, we reviewed
our performance management rules to better align
the setting and measurement of performance with
the corresponding reward to include other levels
below the executive line.
Delivering on our new digital plans required revised
governance and we made a number of executive
appointments to enable optimum governance across
our operations.
Outlook for 2016We expect to feel the impact of decisions taken in
the year in 2016 and the years ahead. Some of the
planned initiatives which will redefine how we work,
where we work, and – more importantly – how we
drive productivity, incentivise employees and boost
staff morale include:
Reviewing our incentives for robustness to foster
higher performance and filter poor performance
through the appropriate exit channels;
We will continue to emphasise to our entire
workforce the importance of customer service
delivery as a non-negotiable expectation in all
customer dealings;
We will look into alternative sourcing tactics to
bolster our talent pipeline with those skills
necessary to execute business strategy;
Effective cost-saving measures will remain a
priority; and
We will engage in regular and honest
communication with our people on pertinent
business topics, including regular company
performance updates, incentive model reviews,
and regulatory changes, and a holistic employee
value proposition for talent attraction and retention.
Critical to our success will be to keep employee
morale high in 2016 and beyond, while we transform
our operating model. As we execute on our 2016
people plans, the wellbeing of our employees will
remain critical.
I wish to thank all executives, the management team
and all employees for their efforts during a
challenging year.
Alan Harper
2 March 2016
Our people and their remunerationRemuneration committee chairman’s report
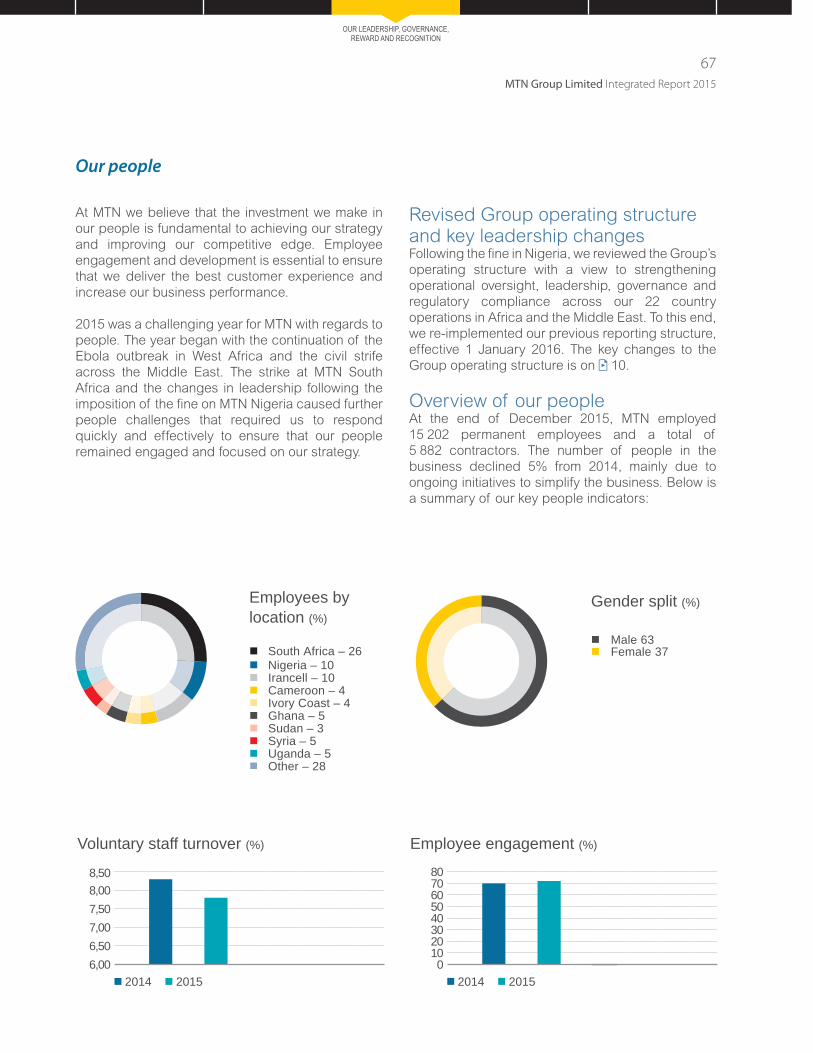
MTN Group Limited Integrated Report 2015
67
OUR LEADERSHIP, GOVERNANCE, REWARD AND RECOGNITION
8,508,007,507,006,506,00
2014 2015
Voluntary staff turnover (%)
80706050403020100
2014 2015
Employee engagement (%)
Our people
At MTN we believe that the investment we make in
our people is fundamental to achieving our strategy
and improving our competitive edge. Employee
engagement and development is essential to ensure
that we deliver the best customer experience and
increase our business performance.
2015 was a challenging year for MTN with regards to
people. The year began with the continuation of the
Ebola outbreak in West Africa and the civil strife
across the Middle East. The strike at MTN South
Africa and the changes in leadership following the
imposition of the fine on MTN Nigeria caused further
people challenges that required us to respond
quickly and effectively to ensure that our people
remained engaged and focused on our strategy.
Revised Group operating structure and key leadership changesFollowing the fine in Nigeria, we reviewed the Group’s
operating structure with a view to strengthening
operational oversight, leadership, governance and
regulatory compliance across our 22 country
operations in Africa and the Middle East. To this end,
we re-implemented our previous reporting structure,
effective 1 January 2016. The key changes to the
Group operating structure is on 10.
Overview of our peopleAt the end of December 2015, MTN employed
15 202 permanent employees and a total of
5 882 contractors. The number of people in the
business declined 5% from 2014, mainly due to
ongoing initiatives to simplify the business. Below is
a summary of our key people indicators:
Employees by location (%)
South Africa – 26Nigeria – 10Irancell – 10Cameroon – 4Ivory Coast – 4Ghana – 5Sudan – 3Syria – 5Uganda – 5Other – 28
Gender split (%)
Male 63Female 37

68
MTN Group Limited Integrated Report 2015
Engagement and cultureAchieving high levels of employee engagement and
fostering the right culture is fundamental to achieving
our strategic imperatives. Every year we invite staff
to participate in our global culture audit survey in
order to measure our employee engagement and
culture across 15 people dimensions.
Our sustainable engagement score improved by
two points from 2014 to a score of 72. The
improvement depicts the combined efforts of staff
and management to prioritise the people agenda
amidst the challenging operating environment.
MTN South Africa’s engagement increased by
one point from 2014, the initial sign of the rebuilding
of staff engagement activities following the strike in
mid-2014.
Our ongoing culture operating system (COS)
programme to instil the MTN vital behaviours also
increased by two points from 2014 after a decline in
2013. The vital behaviours are the foundation of our
social engine in order to ensure that our people work
in a way that is commensurate with the Company’s
values of integrity, honesty and innovation.
Our employee voluntary turnover rate, which
measures the rate at which employees voluntarily
exit MTN, decreased from 8,3% in 2014 to 7,8% in
2015. Retaining our top talent was a key focus for
2015 and yielded positive results, with the voluntary
turnover rate of high performers at 5,5%.
A diverse African and Middle Eastern companyKey to ensuring customer centricity is a diverse
workforce that understands the varied needs of our
subscribers. By the end of December 2015, MTN
employed over 59 different nationalities.
Gender diversity is also a key metric. By the end of
December 2015, 37% of staff were female and 63%
were male. With regard to management positions,
27% of managers were female and 73% were male.
Our focus is to improve our gender diversity in
important leadership positions and during 2015 we
employed women in the following key posts:
Jyoti Desai – Group chief operating officer; and
Philisiwe Sibiya – CEO of MTN Cameroon.
Building an organisation for the futureDuring 2015, we continued our organisational
transformation to achieve our vision. We continued to
streamline our back-office operations through the
expansion of our shared services models while
building the pillars for future growth. In 2015, we
continued to embed the structure for our enterprise
business unit and introduced a new operating model
for digital services.
In addition, we developed a strategic workforce plan
to identify the skills required over the next three
years to achieve our strategy, as well as the gaps.
We focused on closing the gaps relating to digital,
commercial and technical skills required for the
future. During the course of the year, 40% of the
gaps were closed:
41% were external appointments, of which 20%
were from telecommunications competitors,
31% from ICT organisations, 11% from FMCG
organisations, 6% from financial services
organisations and 32% from other; and
59% were internal placements of which 25% were
from talent succession pools.
Talent and learningMTN provides talent management and learning
solutions through the Global Talent and Learning
Centre of Excellence. In order to ensure that we
continue to attract, retain and build the best talent,
we introduced two key initiatives to strengthen our
talent pools during 2015:
Global talent standards were introduced to provide
the minimum technical and behavioural
requirements for each position and level of work
within the organisation. The standard is
complemented by a battery of psychometric
assessments to ensure a suitable cultural fit based
on the seniority of leadership.
Our people and their remuneration continued
Our people continued
MTN Group Limited Integrated Report 2015
69
OUR LEADERSHIP, GOVERNANCE, REWARD AND RECOGNITION
To supplement the global talent standards, talent
development standards (TDS) were defined to
clearly articulate the learning and development
priorities per functional area within the business.
The defined TDS align with career goals and
inform promotion/succession decisions across
segments and functions.
Our 2015 talent review cycle was successfully
concluded based on the above revisions and we
remain stable at a succession bench strength of 2:1
(two successors for every one incumbent) for
leadership positions across the Group.
From a training perspective, the expenditure on
training activities declined from 2014 mainly due to
operating expenditure pressures. Nonetheless,
13 240 people were trained across 889 unique
courses across the Group. In order to ensure that the
key business priorities are catered for in 2016,
we undertook the following key learning and
development initiatives:
We completed a new pilot for customer service
behaviours for rollout in 2016. In addition, core
customer experience training continued across
the opcos;
We rolled out enterprise business sales training to
208 sales staff;
We completed social media training of all required
staff, which had been launched in 2014; and
We launched a pilot programme for a Digital BSc
Honours degree focusing on technology, design
and innovation. The initial group of 12 individuals
completed the course.
People performance managementWe successfully completed our 2015 integrated
performance cycle ensuring that our pay-for-
performance framework is cascaded throughout
the organisation. In addition, we enhanced our
performance framework for lower level staff and
introduced additional mechanisms to align goals for
management. The improvements to the framework
were positively received and resulted in a two-point
increase in the performance management dimension
of our Group culture audit.
Best practicesThe Global Investor in People (IiP) standard is a
people management best practice accreditation
that defines what it takes to lead, support and
manage people well for sustainable results.
As at December 2015, a total of 15 MTN operating
companies had achieved varying levels of
accreditation, up from 12 in 2014. It is important to
note that MTN Cameroon, MTN Ghana, MTN’s head
office and MTN Nigeria all achieved gold
accreditation – the highest level of accreditation
available.
In further developing a culture of recognition, in
2015 MTN launched a new global social recognition
programme called “MTN Shine”. The platform
provides opportunities for leaders and staff to
recognise each other through the allocation of
recognition points (or a recognition wallet) which
can be redeemed as vouchers. The new platform
recorded over 100 000 recognition messages and
achieved the South African Rewards Association
(SARA) “project of the year” award.

70
MTN Group Limited Integrated Report 2015
Our remuneration philosophyMTN’s remuneration philosophy is part of our
interlinked, holistic people and talent approach,
aiming to support current and evolving business
priorities. The philosophy aims to attract, motivate
and retain desired talent to execute business
strategy in a sustainable manner over the longer
term. Given the competitive talent landscape,
this philosophy is underpinned by the following
key objectives:
Presenting a competitive yet affordable reward
proposition;
Fairly differentiating pay by relevant performance
indicators; and
Presenting a flexible and fully compliant reward
system.
In our efforts to achieve the optimal attraction,
retention and motivation of talent, we apply various
approaches, including the following:
For competitiveness and affordabilityMarket benchmarking of reward components on a
regular basis.
Linking both short-term and long-term incentives
to various performance indicators.
For differentiation and flexibilityEstablishing performance as the basis for
employee reward.
Offering the ability to customise reward, taking
into account the varied needs and lifestyles of
employees.
For compliance and sustainabilityContinuously applying full regulatory and
legislative compliance in the various markets in
which we operate.
Regularly auditing and assessing risks, benefits
and compliance of reward.
Our remuneration policyMaintaining a competitive advantage over those
companies we source from and lose talent to, is
imperative. To achieve this, we regularly conduct
benchmarking exercises in order to design our pay
policy to target the market median at minimum.
We never deliver reward that is either:
Below minimum legislative requirements; or
Below our internally approved pay scales.
As an example, South African legislation establishes
that remuneration may not be less than a predefined
hourly sectoral minimum rate. We calculated this rate
to be a minimum average of R14,15 per hour. As at
December 2015, the lowest paid hourly rate for a
full-time employee was R34 per hour, higher than
the average legislated threshold.
Where applicable and depending on specific job
requirements, we provide opportunities for people to
progress through the pay scales over time based on
performance and individual factors weighted against
job requirements. Overall, employee packages differ
based on performance and job requirements
analysis against individual employee skills, including
job-related competencies, abilities and behaviours.
Our reward principlesIn delivering on our remuneration policy, we apply
the principles of:
Fair pay based on the value of the job relative to
other jobs of similar worth i.e. internal equity;
Ongoing benchmarking to remain a competitive
offering to employees i.e. external equity;
Performance-based culture for both our short-term
and long-term incentives;
Transparent and simplified communication across
all levels including external stakeholders;
Consistency across all our operating units,
however, acknowledging differentiation and
customisation;
Empowerment of line managers to deliver effective
pay decisions;
Flexibility, taking into account the diversity of our
employees across all our operating companies;
Company affordability so as to support the
performance expectations of our shareholders;
Optimal pay structure between fixed and variable
remuneration so as to drive the right focus both in
the long and short term;
Values-based and output-driven recognition of
actions aligned to our vital behaviours; and
Recognising entrepreneurship and innovativeness.
Our people and their remuneration continued
Remuneration report
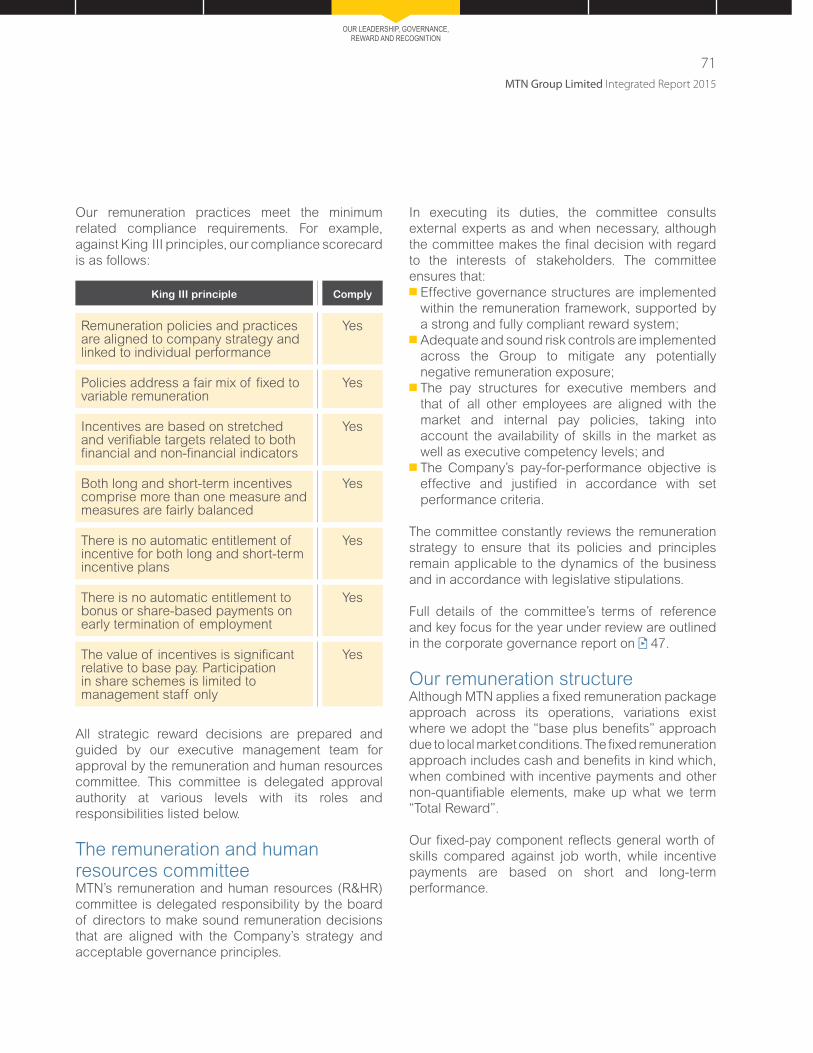
MTN Group Limited Integrated Report 2015
71
OUR LEADERSHIP, GOVERNANCE, REWARD AND RECOGNITION
Our remuneration practices meet the minimum
related compliance requirements. For example,
against King III principles, our compliance scorecard
is as follows:
King III principle Comply
Remuneration policies and practices are aligned to company strategy and linked to individual performance
Yes
Policies address a fair mix of fixed to variable remuneration
Yes
Incentives are based on stretched and verifiable targets related to both financial and non-financial indicators
Yes
Both long and short-term incentives comprise more than one measure and measures are fairly balanced
Yes
There is no automatic entitlement of incentive for both long and short-term incentive plans
Yes
There is no automatic entitlement to bonus or share-based payments on early termination of employment
Yes
The value of incentives is significant relative to base pay. Participation in share schemes is limited to management staff only
Yes
All strategic reward decisions are prepared and
guided by our executive management team for
approval by the remuneration and human resources
committee. This committee is delegated approval
authority at various levels with its roles and
responsibilities listed below.
The remuneration and human resources committeeMTN’s remuneration and human resources (R&HR)
committee is delegated responsibility by the board
of directors to make sound remuneration decisions
that are aligned with the Company’s strategy and
acceptable governance principles.
In executing its duties, the committee consults
external experts as and when necessary, although
the committee makes the final decision with regard
to the interests of stakeholders. The committee
ensures that:
Effective governance structures are implemented
within the remuneration framework, supported by
a strong and fully compliant reward system;
Adequate and sound risk controls are implemented
across the Group to mitigate any potentially
negative remuneration exposure;
The pay structures for executive members and
that of all other employees are aligned with the
market and internal pay policies, taking into
account the availability of skills in the market as
well as executive competency levels; and
The Company’s pay-for-performance objective is
effective and justified in accordance with set
performance criteria.
The committee constantly reviews the remuneration
strategy to ensure that its policies and principles
remain applicable to the dynamics of the business
and in accordance with legislative stipulations.
Full details of the committee’s terms of reference
and key focus for the year under review are outlined
in the corporate governance report on 47.
Our remuneration structureAlthough MTN applies a fixed remuneration package
approach across its operations, variations exist
where we adopt the “base plus benefits” approach
due to local market conditions. The fixed remuneration
approach includes cash and benefits in kind which,
when combined with incentive payments and other
non-quantifiable elements, make up what we term
“Total Reward”.
Our fixed-pay component reflects general worth of
skills compared against job worth, while incentive
payments are based on short and long-term
performance.
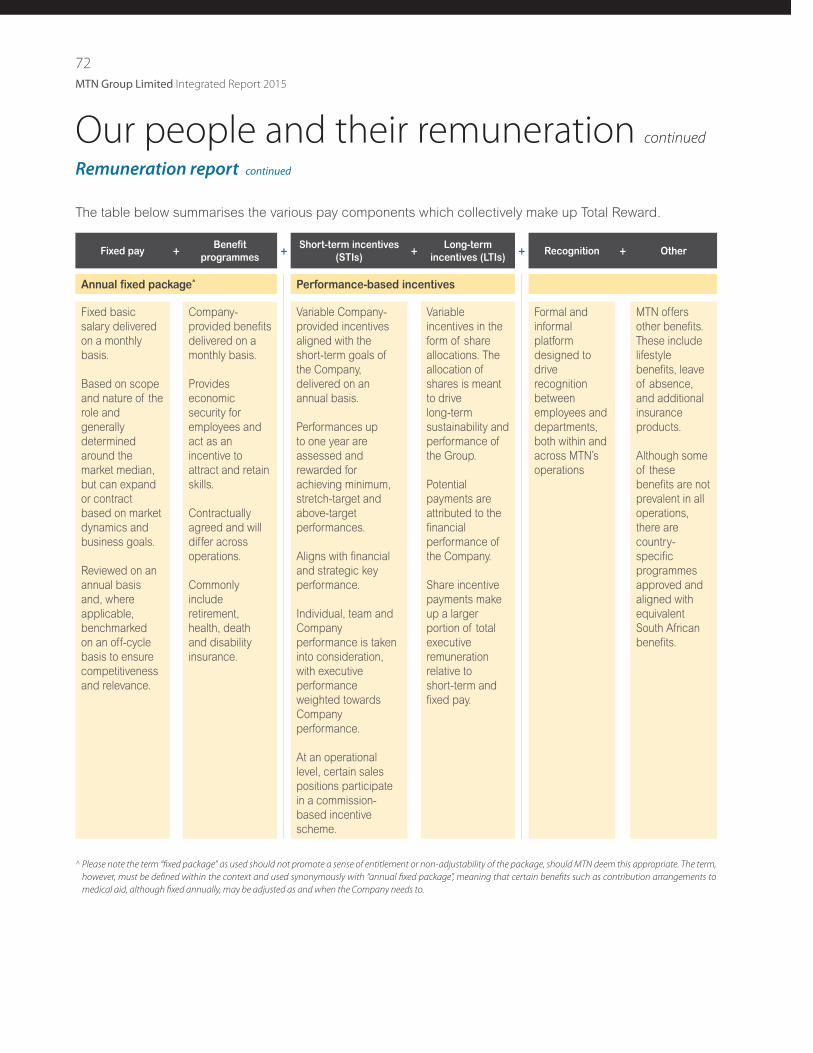
72
MTN Group Limited Integrated Report 2015
The table below summarises the various pay components which collectively make up Total Reward.
Fixed pay + Benefit
programmes+ Short-term incentives
(STIs)+ Long-term
incentives (LTIs)+ Recognition + Other
Annual fixed package^ Performance-based incentives
Fixed basic
salary delivered
on a monthly
basis.
Based on scope
and nature of the
role and
generally
determined
around the
market median,
but can expand
or contract
based on market
dynamics and
business goals.
Reviewed on an
annual basis
and, where
applicable,
benchmarked
on an off-cycle
basis to ensure
competitiveness
and relevance.
Company-
provided benefits
delivered on a
monthly basis.
Provides
economic
security for
employees and
act as an
incentive to
attract and retain
skills.
Contractually
agreed and will
differ across
operations.
Commonly
include
retirement,
health, death
and disability
insurance.
Variable Company-
provided incentives
aligned with the
short-term goals of
the Company,
delivered on an
annual basis.
Performances up
to one year are
assessed and
rewarded for
achieving minimum,
stretch-target and
above-target
performances.
Aligns with financial
and strategic key
performance.
Individual, team and
Company
performance is taken
into consideration,
with executive
performance
weighted towards
Company
performance.
At an operational
level, certain sales
positions participate
in a commission-
based incentive
scheme.
Variable
incentives in the
form of share
allocations. The
allocation of
shares is meant
to drive
long-term
sustainability and
performance of
the Group.
Potential
payments are
attributed to the
financial
performance of
the Company.
Share incentive
payments make
up a larger
portion of total
executive
remuneration
relative to
short-term and
fixed pay.
Formal and
informal
platform
designed to
drive
recognition
between
employees and
departments,
both within and
across MTN’s
operations
MTN offers
other benefits.
These include
lifestyle
benefits, leave
of absence,
and additional
insurance
products.
Although some
of these
benefits are not
prevalent in all
operations,
there are
country-
specific
programmes
approved and
aligned with
equivalent
South African
benefits.
^ Please note the term “fixed package” as used should not promote a sense of entitlement or non-adjustability of the package, should MTN deem this appropriate. The term,
however, must be defined within the context and used synonymously with “annual fixed package”, meaning that certain benefits such as contribution arrangements to
medical aid, although fixed annually, may be adjusted as and when the Company needs to.
Our people and their remuneration continued
Remuneration report continued

MTN Group Limited Integrated Report 2015
73
OUR LEADERSHIP, GOVERNANCE, REWARD AND RECOGNITION
Annual fixed packageLocal employeesGenerally, employees based in South Africa are
remunerated on an annual fixed package (AFP)
approach, which includes a combination of base
remuneration and benefit provisions, commonly
referred to as fixed remuneration. The Group has
implemented this approach subject to labour
regulations and remuneration practices. Non-South
Africa-based operations have adopted and
customised this approach in accordance with local
practices and regulations.
Expatriate employeesMTN deploys international talent (expatriates)
among our operations where this is of value and as
part of our talent mobility efforts. Although expatriate
employees are employed on a full-time basis and
with access to other benefits provided to local
employees, their contracts are, however, limited to a
fixed duration, typically two years.
In line with the frequency of talent mobility across
operations, during 2015, we reviewed the expatriate
pay model to introduce a greater degree of relative
internal pay equity across the various operations.
The choice of the United Arab Emirates as the global
employment company for the purpose of expatriate
compensation management allows us to standardise
expatriate base-pay levels in all countries within one
pay structure in a global reserve/hard currency. This
base-pay foundation is consistent for all assignees
with only country-specific dynamics being added
on, resulting in an MTN framework which represents
a balance between relative equity across the Group,
and local relevance.
MTN continues to prefer the employment of local
talent in operating companies. Notwithstanding the
above base-pay structure, the standardisation and
optimisation process for expatriate benefits remains
a priority. Where possible, within regulatory
requirements, MTN continues to standardise
expatriate employment contract conditions with the
goal of adopting one framework across operations.
This initiative is a gradual process due to legislation.
Executive pay compositionExecutives are remunerated in line with short-term
and long-term business objectives using an optimal
mix of fixed pay, short-term and long-term incentives.
This supports the alignment of strategy and desired
individual behaviour. The mix is aimed at ensuring
that executives proportionately achieve an optimal
balance of remuneration when executing their
duties. The following graphs illustrate the mix of
minimum, on-target and potential maximum
compensation for the two director positions: group
president and CEO, and the group chief financial
officer.
Minimum
0AFP STI LTI
Group president and CEO (Rm)
On-target
Maximum
10 20 30 40 50 60
Minimum
0AFP STI LTI
Group chief financial officer (Rm)
On-target
Maximum
5 10 15 20 25 30
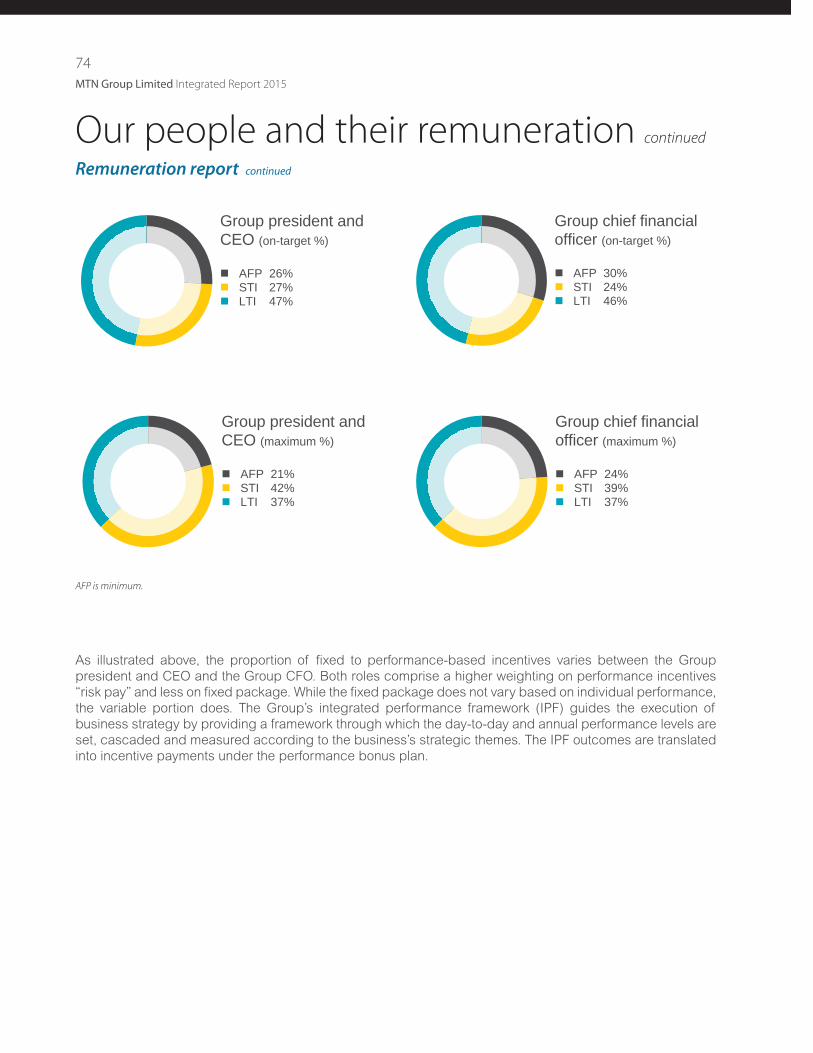
74
MTN Group Limited Integrated Report 2015
As illustrated above, the proportion of fixed to performance-based incentives varies between the Group
president and CEO and the Group CFO. Both roles comprise a higher weighting on performance incentives
“risk pay” and less on fixed package. While the fixed package does not vary based on individual performance,
the variable portion does. The Group’s integrated performance framework (IPF) guides the execution of
business strategy by providing a framework through which the day-to-day and annual performance levels are
set, cascaded and measured according to the business’s strategic themes. The IPF outcomes are translated
into incentive payments under the performance bonus plan.
Our people and their remuneration continued
AFP is minimum.
Group president and CEO (on-target %)
AFP 26%STI 27%LTI 47%
Group president and CEO (maximum %)
AFP 21%STI 42%LTI 37%
Group chief financial officer (on-target %)
AFP 30%STI 24%LTI 46%
Group chief financial officer (maximum %)
AFP 24%STI 39%LTI 37%
Remuneration report continued
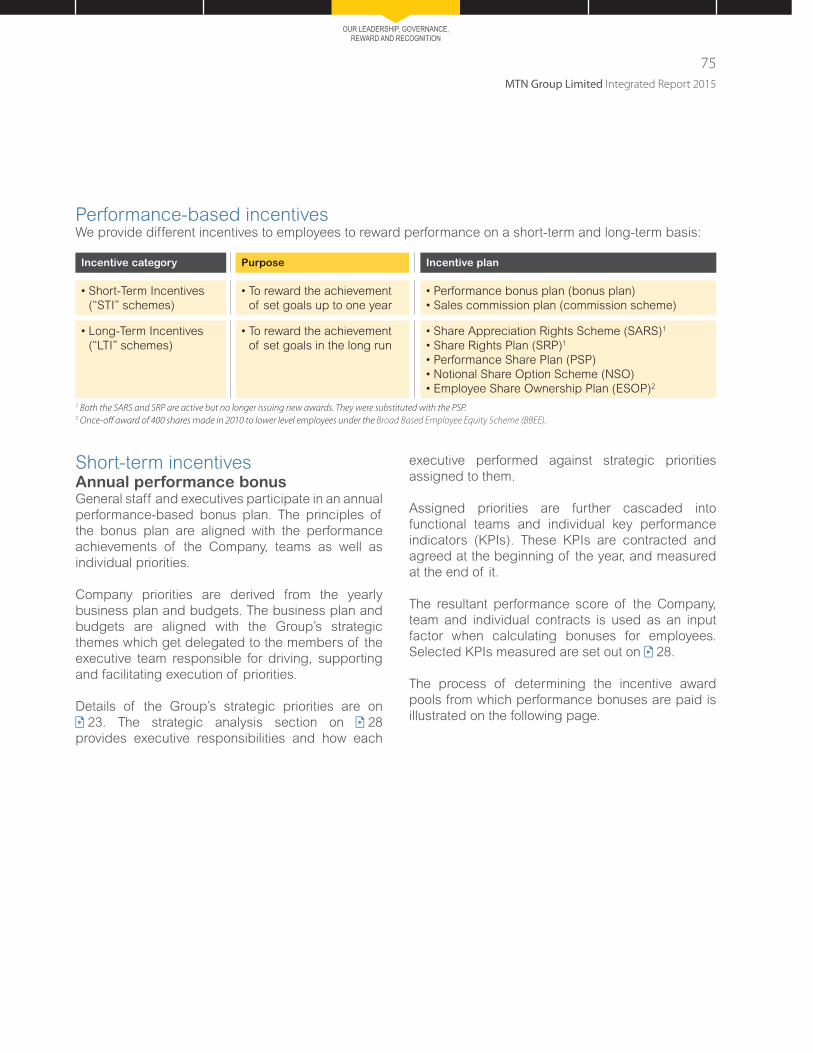
MTN Group Limited Integrated Report 2015
75
OUR LEADERSHIP, GOVERNANCE, REWARD AND RECOGNITION
Performance-based incentivesWe provide different incentives to employees to reward performance on a short-term and long-term basis:
Incentive category Purpose Incentive plan
• Short-Term Incentives
(“STI” schemes)
• To reward the achievement
of set goals up to one year
• Performance bonus plan (bonus plan)
• Sales commission plan (commission scheme)
• Long-Term Incentives
(“LTI” schemes)
• To reward the achievement
of set goals in the long run
• Share Appreciation Rights Scheme (SARS)1
• Share Rights Plan (SRP)1
• Performance Share Plan (PSP)
• Notional Share Option Scheme (NSO)
• Employee Share Ownership Plan (ESOP)2
1 Both the SARS and SRP are active but no longer issuing new awards. They were substituted with the PSP.2 Once-off award of 400 shares made in 2010 to lower level employees under the Broad Based Employee Equity Scheme (BBEE).
Short-term incentivesAnnual performance bonusGeneral staff and executives participate in an annual
performance-based bonus plan. The principles of
the bonus plan are aligned with the performance
achievements of the Company, teams as well as
individual priorities.
Company priorities are derived from the yearly
business plan and budgets. The business plan and
budgets are aligned with the Group’s strategic
themes which get delegated to the members of the
executive team responsible for driving, supporting
and facilitating execution of priorities.
Details of the Group’s strategic priorities are on
23. The strategic analysis section on 28
provides executive responsibilities and how each
executive performed against strategic priorities
assigned to them.
Assigned priorities are further cascaded into
functional teams and individual key performance
indicators (KPIs). These KPIs are contracted and
agreed at the beginning of the year, and measured
at the end of it.
The resultant performance score of the Company,
team and individual contracts is used as an input
factor when calculating bonuses for employees.
Selected KPIs measured are set out on 28.
The process of determining the incentive award
pools from which performance bonuses are paid is
illustrated on the following page.

76
MTN Group Limited Integrated Report 2015
Our people and their remuneration continued
2015 performance bonus reviewsMTN’s operations faced many challenges during
2014 and this trend continued, and even accelerated
in 2015. Among these challenges were (i) fierce
competition from non-traditional telecommunications
operators, (ii) greater regulatory and compliance
requirements, (iii) industrial action, and various other
external factors related to social unrest and
economic volatility.
These challenges collectively resulted in many of
our operations not meeting the minimum performance
levels required for a bonus to be declared, and
resultantly, did not qualify for a performance bonus.
Among the operations which missed the qualifying
criteria for 2014 was MTN South Africa. In accordance
with the then bonus rules, a minimum 4% of annual
remuneration was paid to employees in lower levels.
However, employees were dissatisfied with the
payment. This led to a prolonged strike in South
Africa, based on the argument from union-affiliated
employees that the 4% payment was insufficient and
did not adequately recognise their contributions to
the business.
As part of our ongoing review commitments,
management reviewed the bonus rules. All revisions
led to extensive engagements with staff and social
partners.
• The financial performance targets of the Company are determined in accordance with the five strategic themes at the beginning of the year.
• A factual findings engagement is performed on these results by an independent body.
• The percentage performance achievement against target is translated into a nominal performance-linked scale, adjusted to allow for maximum earning potential.
• Group attributable earnings are used at Group level and EBITDA, revenue and cash flow are used at operational level to measure Company performance.
• The strategic themes are translated into priorities to be executed at executive member levels. Details on strategic priorities are on page 23.
• Depending on the size of the function, and where applicable, team performance scorecards are further cascaded to below executive levels.
• Achievement of each KPI is proportionate and weighted; however, cumulatively they add up to 100%.
• At the beginning of each financial period, every employee enters into a contractual performance agreement.
• The performance agreement stipulates the performance expectations to be measured at year-end.
• Performance agreements ensure alignment between Company, team and individual levels.
• This is not applicable to executives.
Company performance (CP)• MTN Group: attributable earnings
• Opco: revenue, cash flow, EBITDA1
Team performance (TP)• Strategic themes are translated into
priorities
• Team priorities are further cascaded down
2
Employee performance (EP)• Alignment of individual performance
contracts with the departmental targets
• Each KPI set within the IPF principles
3
Remuneration report continued
Description of performance criteria

MTN Group Limited Integrated Report 2015
77
OUR LEADERSHIP, GOVERNANCE, REWARD AND RECOGNITION
As applicable to lower level employees at level 1 and
level 2, the following was approved:
Minimum guaranteed paymentA guaranteed 4% of annual remuneration payment
in December, subject to approval of each opco
board. This payment was in lieu of shares which
level 1 and level 2 do not participate in.
This payment was however conditional on minimum
individual performance as approved by the
respective boards.
Furthermore, management approved that for each
financial period, two computations would apply:
Computation if the board declares bonuses based
of achievement of minimum Company performance
levels being met; and
Computations if the board does not declare
bonuses, i.e. minimum Company performance
levels are not met.
These three scenarios are summarised as follows:
Description
Minimum 4% payment in
lieu of shares1
Requirements if a bonus is
declared by the board
Requirements if a bonus is
not declared by the board
Individual performance applies
Yes, an individual minimum performance score is required
Yes, an individual minimum performance score is required
Yes, an individual minimum performance score is required
Earning range as a % of applicable annual salary
Exactly 4% From 0% to 12% From 0% to 6%
Percentage payable at target achievement
Not applicable 9% 4,5%
1 The 4% minimum was payable with effect from December 2015, subject to approval of each opco board. The changes as applicable to the performance bonus were effective
for the 2015 financial year.
Where bonuses were paid, the following example
illustrates the calculation methodology:
How a bonus is calculated1. Three elements are used as inputs to a bonus
calculation, namely company performance (CP),
team performance (TP) and employee
performance (EP). Each element has a weighting
(a), with all elements combined adding up to
100%.
2. Targets for each element are set at the beginning
of the performance cycle and measured at
the end of the performance cycle where a
corresponding “nominal % (b)” is determined
from a standard translation table.
3. Company performance as a “qualifier” for bonus
declaration is first assessed for each operation.
4. For each weighted element, there is a job level
related on-target (c) and maximum (d) earning
potential.
Upon assessment of Company performance by the
board, a bonus is either declared or not. If declared:
Step 1: The weighting of each element (a) is
multiplied by the achieved nominal (b) and
the results of the three added together.
Step 2: Then the sum of the three is multiplied by
the on-target % (c) to derive the bonus
percentage.
Step 3: As a validation, a check is done against the
maximum % for each job. If the calculated
amount does not exceed the maximum, the
final bonus percentage is multiplied by
annual incentive salary to arrive at the final
bonus payment.
(CP + TP + EP) x on-target percentage = bonus percentage
The bonus percentage (validated against the minimum and maximum) x annual salary
= total bonus payable
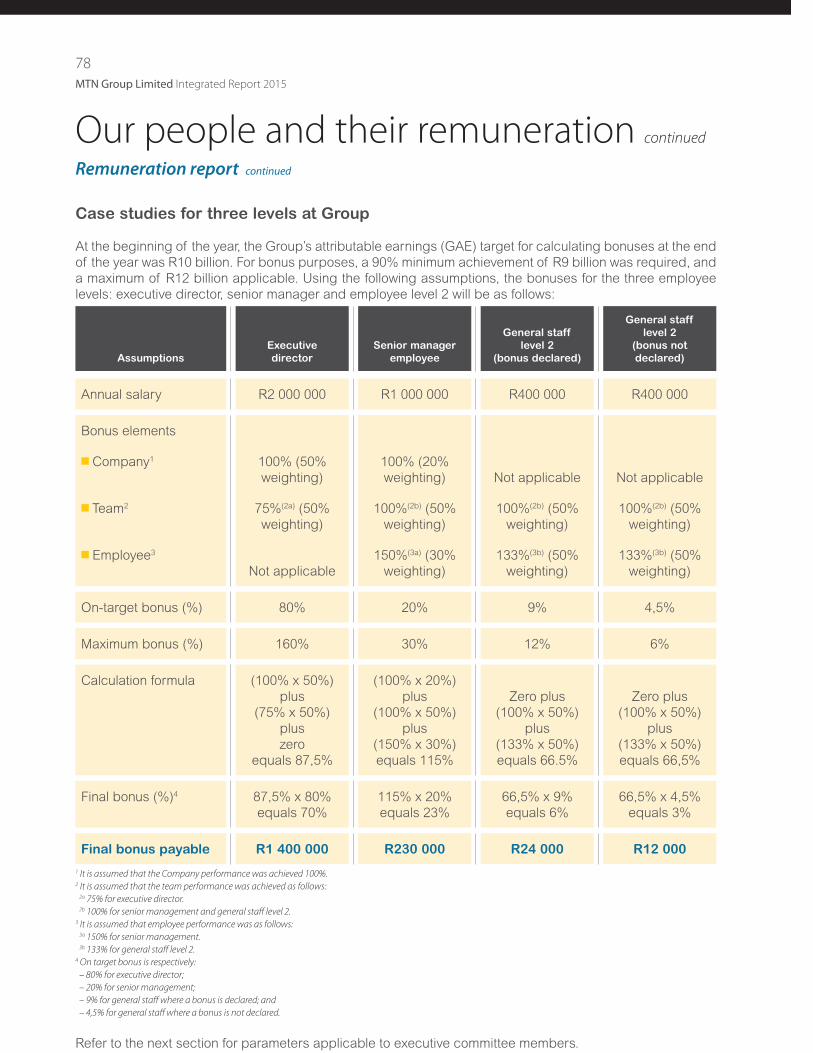
78
MTN Group Limited Integrated Report 2015
Our people and their remuneration continued
Case studies for three levels at Group
At the beginning of the year, the Group’s attributable earnings (GAE) target for calculating bonuses at the end
of the year was R10 billion. For bonus purposes, a 90% minimum achievement of R9 billion was required, and
a maximum of R12 billion applicable. Using the following assumptions, the bonuses for the three employee
levels: executive director, senior manager and employee level 2 will be as follows:
Assumptions
Executive
director
Senior manager
employee
General staff
level 2
(bonus declared)
General staff
level 2
(bonus not
declared)
Annual salary R2 000 000 R1 000 000 R400 000 R400 000
Bonus elements
Company1 100% (50%
weighting)
100% (20%
weighting) Not applicable Not applicable
Team2 75%(2a) (50%
weighting)
100%(2b) (50%
weighting)
100%(2b) (50%
weighting)
100%(2b) (50%
weighting)
Employee3
Not applicable
150%(3a) (30%
weighting)
133%(3b) (50%
weighting)
133%(3b) (50%
weighting)
On-target bonus (%) 80% 20% 9% 4,5%
Maximum bonus (%) 160% 30% 12% 6%
Calculation formula (100% x 50%)
plus
(75% x 50%)
plus
zero
equals 87,5%
(100% x 20%)
plus
(100% x 50%)
plus
(150% x 30%)
equals 115%
Zero plus
(100% x 50%)
plus
(133% x 50%)
equals 66.5%
Zero plus
(100% x 50%)
plus
(133% x 50%)
equals 66,5%
Final bonus (%)4 87,5% x 80%
equals 70%
115% x 20%
equals 23%
66,5% x 9%
equals 6%
66,5% x 4,5%
equals 3%
Final bonus payable R1 400 000 R230 000 R24 000 R12 000
1 It is assumed that the Company performance was achieved 100%.2 It is assumed that the team performance was achieved as follows:
2a 75% for executive director.2b 100% for senior management and general staff level 2.
3 It is assumed that employee performance was as follows:3a 150% for senior management.3b 133% for general staff level 2.
4 On target bonus is respectively:
– 80% for executive director;
– 20% for senior management;
– 9% for general staff where a bonus is declared; and
– 4,5% for general staff where a bonus is not declared.
Refer to the next section for parameters applicable to executive committee members.
Remuneration report continued
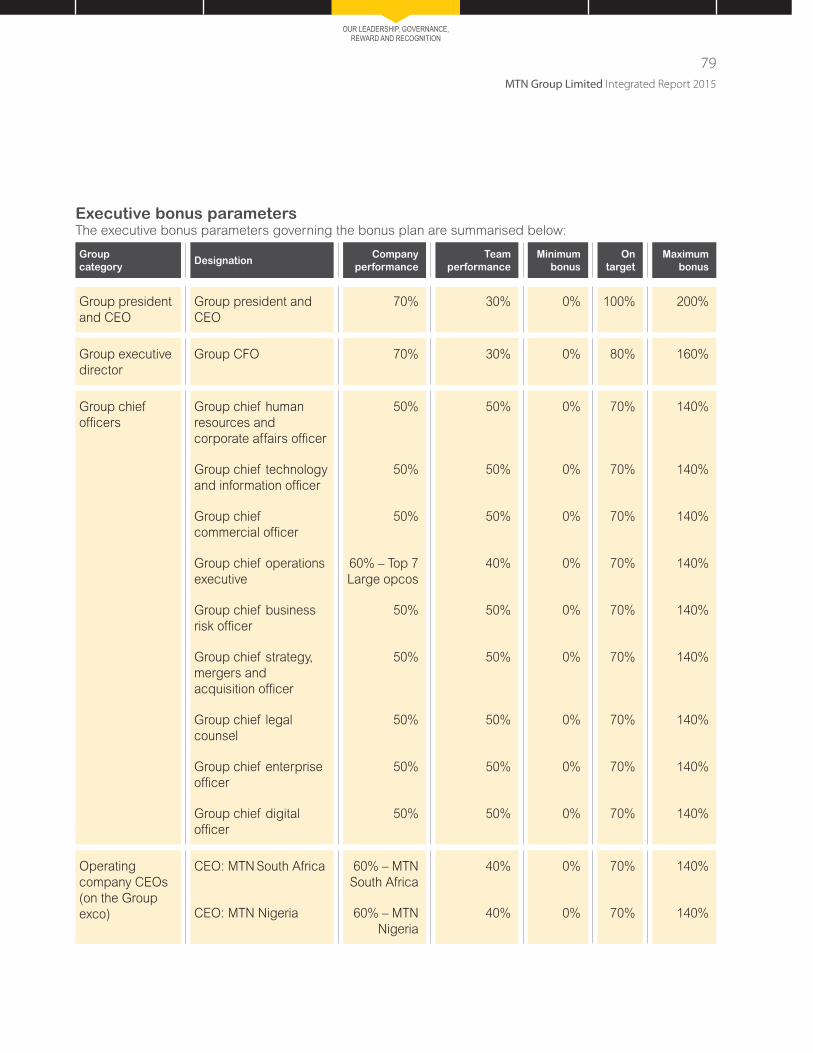
MTN Group Limited Integrated Report 2015
79
OUR LEADERSHIP, GOVERNANCE, REWARD AND RECOGNITION
Executive bonus parametersThe executive bonus parameters governing the bonus plan are summarised below:
Group
categoryDesignation
Company
performance
Team
performance
Minimum
bonus
On
target
Maximum
bonus
Group president
and CEO
Group president and
CEO
70% 30% 0% 100% 200%
Group executive
director
Group CFO 70% 30% 0% 80% 160%
Group chief
officers
Group chief human
resources and
corporate affairs officer
50% 50% 0% 70% 140%
Group chief technology
and information officer
50% 50% 0% 70% 140%
Group chief
commercial officer
50% 50% 0% 70% 140%
Group chief operations
executive
60% – Top 7
Large opcos
40% 0% 70% 140%
Group chief business
risk officer
50% 50% 0% 70% 140%
Group chief strategy,
mergers and
acquisition officer
50% 50% 0% 70% 140%
Group chief legal
counsel
50% 50% 0% 70% 140%
Group chief enterprise
officer
50% 50% 0% 70% 140%
Group chief digital
officer
50% 50% 0% 70% 140%
Operating
company CEOs
(on the Group
exco)
CEO: MTN South Africa 60% – MTN
South Africa
40% 0% 70% 140%
CEO: MTN Nigeria 60% – MTN
Nigeria
40% 0% 70% 140%

80
MTN Group Limited Integrated Report 2015
Our people and their remuneration continued
Long-term incentive schemes (LTIs)Long-term incentives to managerial and senior
employees are aimed at aligning their contributions
to shareholders’ expectations by sharing in the long-
term growth of the Company. Due to the fact that our
operations are spread across 22 African and Middle
Eastern countries, it is not always feasible to issue
Company stock to all employees as we are only
listed on the Johannesburg Stock Exchange. For this
reason, the Company operates a combination of
equity and cash-settled schemes.
Executive directors’ bonus calculationsFor 2015, the executive directors’ bonuses were calculated in line with the approved bonus principles. Full
actual amounts of the bonuses paid can also be found on 88.
MTN operations’ bonus declarationsIn line with the performance bonus rules, bonuses become payable within an operation once the committee
is satisfied that the minimum performance thresholds have been achieved. For the 2015 financial year, a
summary of the bonuses declared to the MTN Group operations is as follows:
Bonus declared Bonus declared
MTN Group No Afghanistan Yes
South Africa Yes Congo-Brazzaville Yes
Nigeria No Rwanda Yes
Ghana Yes Zambia Yes
Cameroon No Liberia No
Ivory Coast No Conakry No
Uganda No Cyprus Yes
Syria Yes South Sudan Yes
Sudan Yes Iran Yes
Benin Yes Swaziland Yes
Yemen No Guinea-Bissau No
The general rule is that participants are allocated
shares, options, or rights equivalent to a fraction of
their annual salary. Depending on the performance
of the Company measured using various indicators,
participants proportionately either receive cash,
equity or a combination of both. Although the
eligibility of participants is defined in the rules of the
schemes, MTN reserves the right to exclude
participation by certain employees by virtue of their
employment status, e.g. disciplinary, suspension,
and dismissal.
Remuneration report continued

MTN Group Limited Integrated Report 2015
81
OUR LEADERSHIP, GOVERNANCE, REWARD AND RECOGNITION
Since 2001, the Group has implemented the following schemes:
Share Option Scheme (SOS)
Eligible participants
Date
implemented
Performance
conditions
Last vesting
date Expiry period
All levels 2001 Share price
based
Unwound 2015
The share option plan fully vested and reached its expiry period in January 2015. At the time of expiry, 10 years after the last award, all options were exercised with no employee forfeiting unexercised shares.
Share Appreciation Rights Scheme (SARS) and Share Rights Plan (SRP)
Objective: To promote the achievement of MTN Group’s strategic objectives measured using the
Company’s growth in share price. Participating employees share in the appreciation of the Company’s
share price between grant and vest.
Eligible participants
Date
implemented
Performance
conditions
Last vesting
date Expiry period
All employees at junior
management level and above
2006 – SARS
2008 – SRP
Share price
based
2013
2015
2018
2020
Both the SARS and SRP were fully vested as at 2015 and are exercisable. Refer to 84. for the full reconciliation of 2015 trading.
Performance Share Plan (PSP)The PSP scheme is the current active and allocating plan, and is summarised as follows:
Objective: To promote the achievement of MTN Group’s strategic objectives measured using the Company’s
growth in share price and cash flow. Participating employees share in the Company’s achievement of the
set financial indicators over three years.
Eligible participants
Date
implemented
Performance
conditions
Last vesting
date Expiry period
All employees at junior
management level and
above
2010 Total
shareholder
return (TSR)
Adjusted free
cash flow
(AFCF)
2017 Not applicable
Details about the PSPShare awards are at the discretion of the MTN Group board and the operating entities.Participation is limited to managerial employees and those in more senior positions only.Performance is measured using TSR and AFCF. An additional service element is applicable for non-executive participating employees.Weightings are attached to each condition based on the seniority of the participant.The scheme has a three-year vesting period. Once the shares are vested and the board is satisfied with the achievement of the performance conditions, participating employees receive either shares or the cash equivalent.
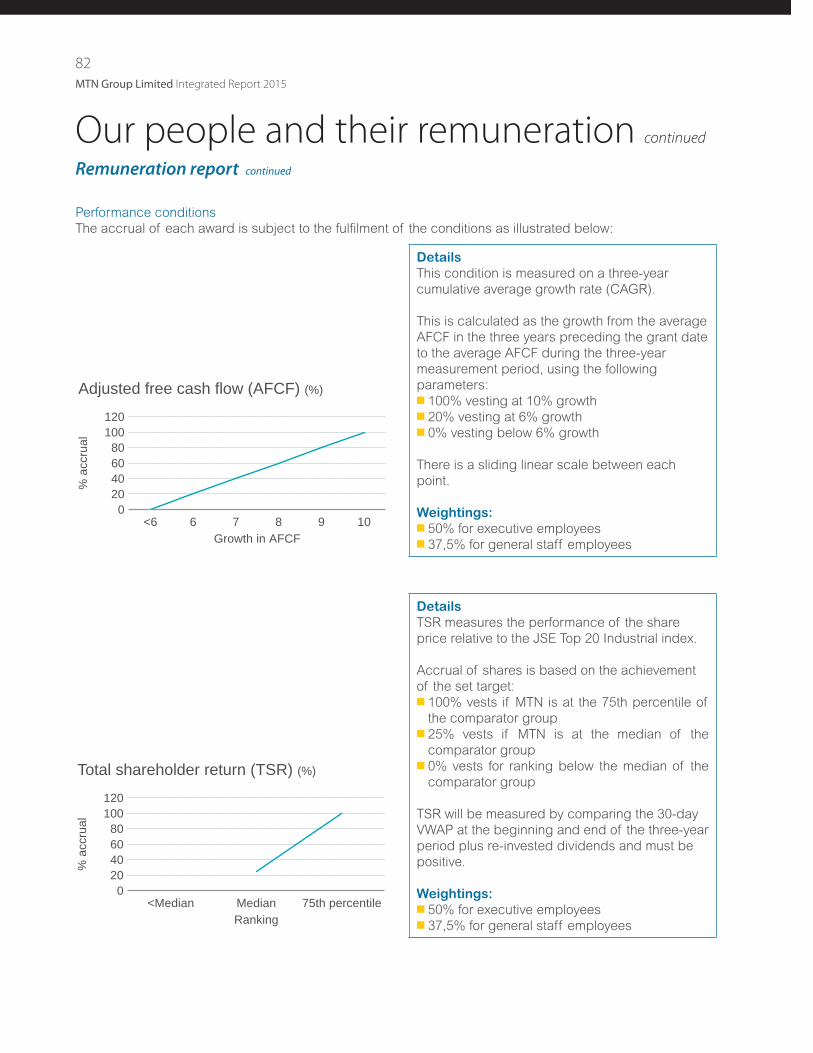
82
MTN Group Limited Integrated Report 2015
Our people and their remuneration continued
Performance conditions
The accrual of each award is subject to the fulfilment of the conditions as illustrated below:
120100806040200
<6
% a
ccru
al
6 7Growth in AFCF
8 9 10
Adjusted free cash flow (AFCF) (%)
Details
This condition is measured on a three-year
cumulative average growth rate (CAGR).
This is calculated as the growth from the average
AFCF in the three years preceding the grant date
to the average AFCF during the three-year
measurement period, using the following
parameters:
100% vesting at 10% growth
20% vesting at 6% growth
0% vesting below 6% growth
There is a sliding linear scale between each
point.
Weightings:
50% for executive employees
37,5% for general staff employees
120100806040200
<Median
% a
ccru
al
MedianRanking
75th percentile
Total shareholder return (TSR) (%)
Details
TSR measures the performance of the share
price relative to the JSE Top 20 Industrial index.
Accrual of shares is based on the achievement
of the set target:
100% vests if MTN is at the 75th percentile of
the comparator group
25% vests if MTN is at the median of the
comparator group
0% vests for ranking below the median of the
comparator group
TSR will be measured by comparing the 30-day
VWAP at the beginning and end of the three-year
period plus re-invested dividends and must be
positive.
Weightings:
50% for executive employees
37,5% for general staff employees
Remuneration report continued
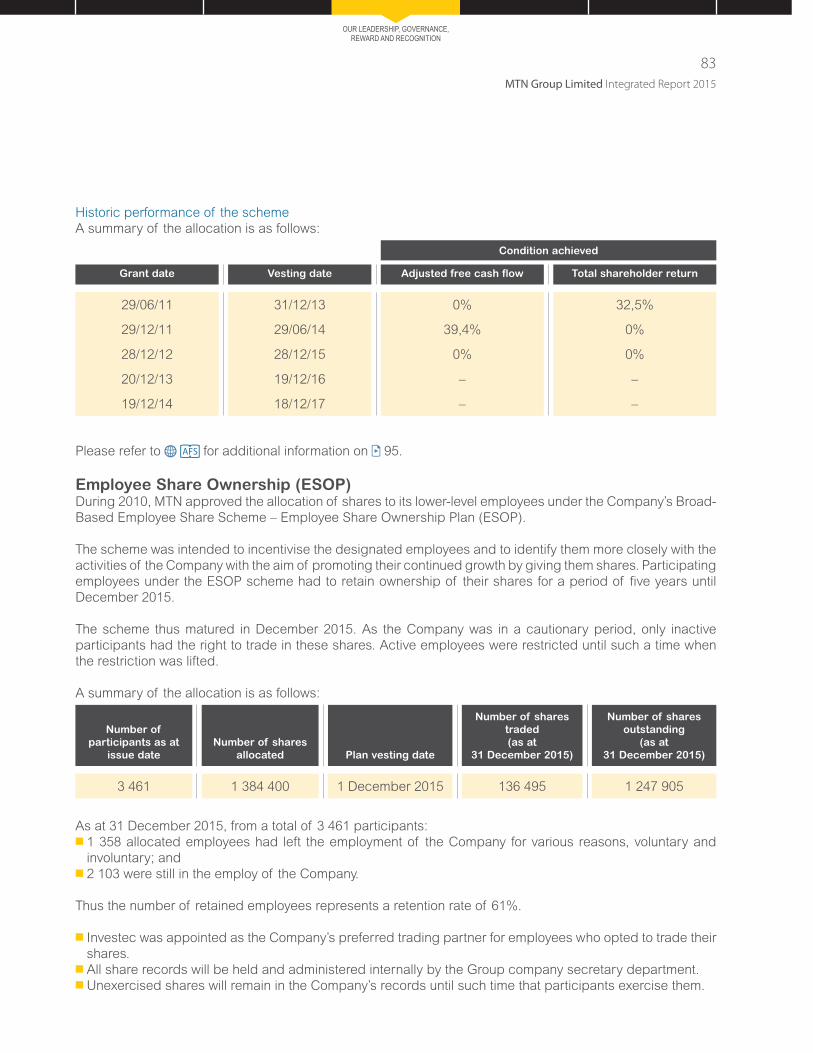
MTN Group Limited Integrated Report 2015
83
OUR LEADERSHIP, GOVERNANCE, REWARD AND RECOGNITION
Historic performance of the scheme
A summary of the allocation is as follows:
Condition achieved
Grant date Vesting date Adjusted free cash flow Total shareholder return
29/06/11 31/12/13 0% 32,5%
29/12/11 29/06/14 39,4% 0%
28/12/12 28/12/15 0% 0%
20/12/13 19/12/16 – –
19/12/14 18/12/17 – –
Please refer to for additional information on 95.
Employee Share Ownership (ESOP)During 2010, MTN approved the allocation of shares to its lower-level employees under the Company’s Broad-
Based Employee Share Scheme – Employee Share Ownership Plan (ESOP).
The scheme was intended to incentivise the designated employees and to identify them more closely with the
activities of the Company with the aim of promoting their continued growth by giving them shares. Participating
employees under the ESOP scheme had to retain ownership of their shares for a period of five years until
December 2015.
The scheme thus matured in December 2015. As the Company was in a cautionary period, only inactive
participants had the right to trade in these shares. Active employees were restricted until such a time when
the restriction was lifted.
A summary of the allocation is as follows:
Number of
participants as at
issue date
Number of shares
allocated Plan vesting date
Number of shares
traded
(as at
31 December 2015)
Number of shares
outstanding
(as at
31 December 2015)
3 461 1 384 400 1 December 2015 136 495 1 247 905
As at 31 December 2015, from a total of 3 461 participants:
1 358 allocated employees had left the employment of the Company for various reasons, voluntary and
involuntary; and
2 103 were still in the employ of the Company.
Thus the number of retained employees represents a retention rate of 61%.
Investec was appointed as the Company’s preferred trading partner for employees who opted to trade their
shares.
All share records will be held and administered internally by the Group company secretary department.
Unexercised shares will remain in the Company’s records until such time that participants exercise them.

84
MTN Group Limited Integrated Report 2015
Our people and their remuneration continued
A summary of all previous allocations and the vesting dates made under the long-term incentive scheme is
presented below:
Equity share schemes vesting schedule
Vesting timelines per anniversary (cumulative)
Plan
type
Issue
period date Year 0 > Year 1 > Year 2 > Year 3 > Year 4 > Year 5 > Year 10
Share options
28 Sept 2001*
2 Sept 2002
2 Jan 2003
7 Jul 2003
1 Dec 2003
1 Nov 2004
1 Dec 2004
31 May 2006
31 May 2006*
21 Nov 2006
1 Jan 2007
SARS 2 Apr 2007
22 Jun 2007
19 Mar 2008
1 Sept 2008
28 Jun 2010^
PSPs 29 Jun 2011^^
29 Jun 2011
29 Dec 2011
28 Dec 2012
20 Dec 2013
19 Dec 2014
^ This offer includes an allocation with one year accelerated vesting.^^ This offer was accelerated from 36 months to 30 months.
Key: Allocation date 20% tranche vested (cumulative) 30% tranche vested (cumulative)
Remuneration report continued
MTN Group Limited Integrated Report 2015
85
OUR LEADERSHIP, GOVERNANCE, REWARD AND RECOGNITION
Gains under LAN NSO are based on the LAN
price movement between allocation and exercise.
The determination of the LAN price at allocation,
and subsequently at each annual valuation, is
as below:
– Allocation – LAN price valuation is reflective of
the increase in value of an operation through
alignment with the EBITDA financial indicator.
– Valuations – annual valuations of the LAN NSO
price are based on the appreciation or
depreciation with the LAN allocation price.
Non-executive director remunerationThe R&HR committee is responsible for advising on
the remuneration of non-executive directors (NEDs),
including reviewing remuneration recommendations
as put forward by executive management in
consultation with external remuneration consultants.
The committee also recommends remuneration for
approval by the board and shareholders. The
remuneration for NEDs is considered annually and is
determined in light of market practice and with
reference to the time, commitment and responsibilities
associated with the roles.
The MTN Group’s non-executive directors receive an
annual retainer and a meeting attendance fee. They
do not participate in any type of incentive scheme
nor do they receive any employee-related benefits.
During 2015, the board requested a review of the
non-executive director fees. An external benchmark
exercise was conducted where industry trends
and market rates were obtained from
PricewaterhouseCoopers Inc. and The Hay Group
(the Company’s preferred survey providers).
A gap analysis showed that certain directors
required an adjustment to their fees payable. A
motivation was submitted to the board and approved
for implementation in 2015.
Following the Company’s cautionary statement on
trading after Nigerian regulators imposed a fine on
MTN Nigeria, the annual PSP allocation (normally
planned for December of each year) was suspended
until further notice.
Further details on the performance measurement,
assessment periods, and settlement criteria are
available under the on 95.
MTN non-equity schemes for
employees in non-listed operations
outside South AfricaMTN offers non-South Africa-based employees
participation in the Group’s notional share option
(NSO) scheme. This scheme enhances MTN’s
commitment to the “One Group, One MTN”
philosophy.
Qualifying employees own options and also
participate in the growth of the Group and its
operations, as applicable. The main objective of the
NSO scheme is to encourage an alignment between
the individual interests of senior employees and the
long-term success of the Group. Thus, the scheme’s
design rewards employees for the value gain derived
from the NSO price per share appreciation between
the allocation and vesting dates.
The NSO scheme was reviewed in 2013 and a
proposal was presented to the R&HR committee to
change the mechanics of the scheme to align it with
the Group equity schemes. The committee supported
this recommendation and operations made NSO
allocations under the new rules effective 1 April
2014. The key aspects and changes of the NSO
scheme included:
NSO awards are divided into Group-aligned
notional share scheme (GAN) NSO and locally
aligned notional share scheme (LAN) NSO.
GAN NSO constitutes up to 30% of the total value
of the award and LAN NSO constitutes up to 70%
of the total value of the award.
Gains under GAN NSO are measured by the MTN
Group’s share price movements between the
allocation date and exercise date, i.e. the difference
between the allocation and exercise prices
represents the gain.

86
MTN Group Limited Integrated Report 2015
Our people and their remuneration continued
For the 2016 financial period, the board did not approve an increase to the NED fees.
Annual
retainer
fee
Meeting
attendance
fee
2015 2015
MTN GROUP BOARD
Chairman R2 518 081 R139 893
Member R212 492 R53 123
International member €76 928 €7 693
Special assignments or projects (per day)
Local non-executive director R22 639
International non-executive director €3 373
Ad hoc work performed by non-executive directors for special projects (hourly rate) R3 985
Audit committee
Chairman R112 901 R34 828
Member R61 681 R23 997
Remuneration and human resources committee
Local chairman R84 303 R31 757
International chairman €5 625 €3 590
Local member R49 401 R23 289
International member €3 297 €3 297
Risk management, compliance committee and corporate governance committee
Chairman R84 303 R31 757
Member R49 401 R23 289
International member €3 297 €3 297
Social and ethics committee
Chairman R84 303 R31 757
Member R49 401 R23 289
MTN Group Share Trust (trustees)
Chairman R74 929 R28 226
Member R32 943 R15 530
Tender committee
Chairman R74 929 R28 226
Member R43 783 R20 641
Remuneration report continued

MTN Group Limited Integrated Report 2015
87
OUR LEADERSHIP, GOVERNANCE, REWARD AND RECOGNITION
Employment contractsGroup president and CEO (executive director)Following the resignation of the Group president
and CEO, RS Dabengwa, the board appointed
PF Nhleko to fulfil the role of executive chairman. To
enlist the services of PF Nhleko, the board entered
into a contract of employment with a service provider,
Captrust Investments Proprietary Limited. PF Nhleko
was appointed for a fixed term period of six months,
effective from 9 November 2015 and ending on
9 May 2016.
In consideration for PF Nhleko’s services, the
Company paid an agreed-upon service fee to the
service provider. His contract further stipulates that
the board, at its discretion at the end of the contract,
may award PF Nhleko with a bonus. Full details of
such payments to PF Nhleko in regard to this
executive directorship role are provided on 88.
In addition to this fixed term contract as an executive,
PF Nhleko continued to serve as chairman of the
MTN Group Limited board of directors, and as
such received all related director remuneration in
this regard. Full details of remuneration paid to
PF Nhleko in his capacity as director are provided
on 88.
Chief financial officer (executive director)The chief financial officer, BD Goschen, was
employed on a five-year fixed term contract which
expires in August 2018. Full details of remuneration
paid to BD Goschen in his capacity as director are
provided on 88.
Prescribed officersOther prescribed officers of the Company are
employed on a full-time and permanent basis with
no indication of their termination of employment.
Restraint of trade and notice periodTo safeguard the shareholders of the Company and
the proprietary, strategic, and confidential information
to which executive directors and prescribed officers
are privy to as a result of their employment, in 2014,
management recommended a contractual restriction
on the freedom of any executive director or
prescribed officer to conduct business with a
competitor. Under this agreement, new appointments
were required to sign a “restraint of trade agreement”
prohibiting them from taking employment with a
competitor company within six months from
termination of employment with MTN. For existing
executive directors and prescribed officers however,
given their current contracts excluded restraint
clauses, management continued to engage with
them in a bid to similarly agree to the restraint terms.
Where engagements are successful, the executive
director or prescribed officer is issued with an
annexure to their contract. This process is ongoing
and shall extend to 2016.
All appointments post-2014, both executive directors
and prescribed officers, have a six-month notice
period. Existing executive directors and prescribed
officers employed prior to 2014 all have a one-month
notice period, contractually agreed at their initial
appointments. In total, including the six-month
restraint period, this means that executive directors
and prescribed officers have a total of 12 months, a
period management believes is an adequate
measure to protect the Company’s information.
Directors’ emolumentsDirectors’ and prescribed officers’ emoluments and
payments in the tables presented here have been
audited. Full details on directors’ and prescribed
officers’ emoluments and equity compensation
benefits for executive directors and directors of
major subsidiaries in respect of the share
appreciation rights and share rights schemes on
88. This also includes shareholdings and dealings
in MTN Group ordinary shares and MTN Zakhele
shares by MTN Group directors, prescribed officers,
Group secretary and directors and company
secretaries of major subsidiaries.
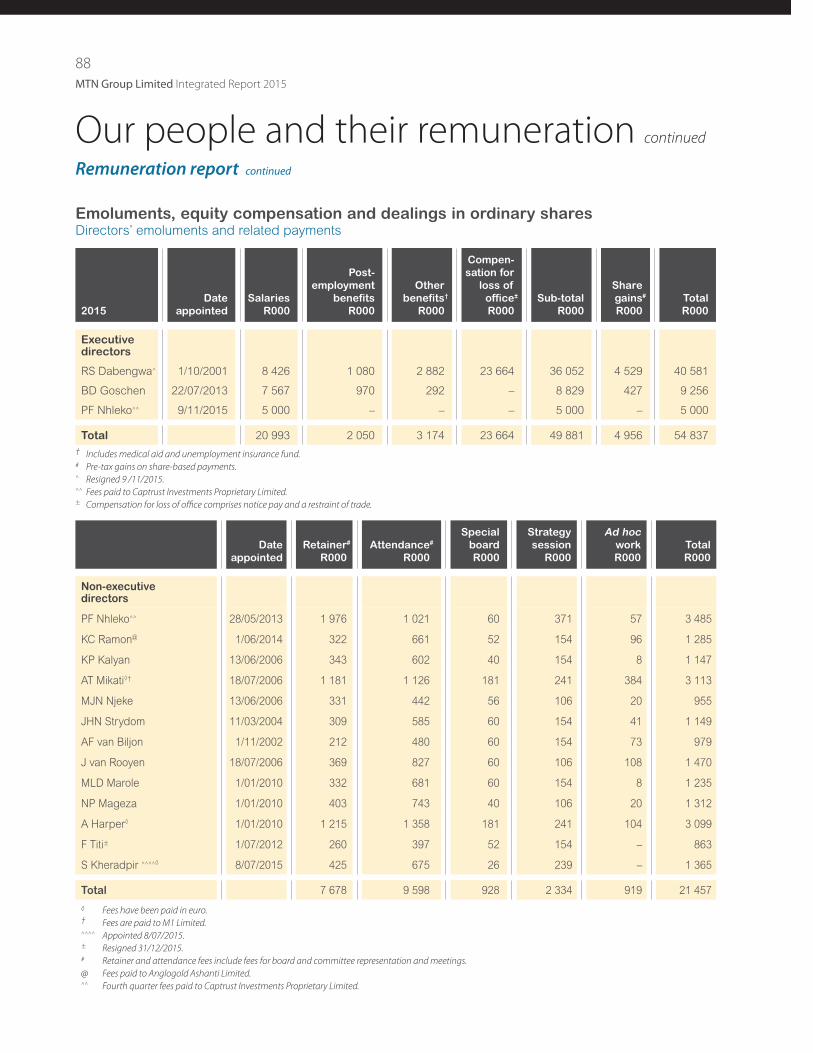
88
MTN Group Limited Integrated Report 2015
Emoluments, equity compensation and dealings in ordinary shares Directors’ emoluments and related payments
2015
Date
appointed
Salaries
R000
Post-
employment
benefits
R000
Other
benefits†
R000
Compen-
sation for
loss of
office±
R000
Sub-total
R000
Share
gains#
R000
Total
R000
Executive directors
RS Dabengwa^ 1/10/2001 8 426 1 080 2 882 23 664 36 052 4 529 40 581
BD Goschen 22/07/2013 7 567 970 292 – 8 829 427 9 256
PF Nhleko^^ 9/11/2015 5 000 – – – 5 000 – 5 000
Total 20 993 2 050 3 174 23 664 49 881 4 956 54 837
† Includes medical aid and unemployment insurance fund.# Pre-tax gains on share-based payments.^ Resigned 9 /11/2015.^^ Fees paid to Captrust Investments Proprietary Limited.± Compensation for loss of office comprises notice pay and a restraint of trade.
Date
appointed
Retainer#
R000
Attendance#
R000
Special
board
R000
Strategy
session
R000
Ad hoc
work
R000
Total
R000
Non-executive directors
PF Nhleko^^ 28/05/2013 1 976 1 021 60 371 57 3 485
KC Ramon@ 1/06/2014 322 661 52 154 96 1 285
KP Kalyan 13/06/2006 343 602 40 154 8 1 147
AT Mikatiנ 18/07/2006 1 181 1 126 181 241 384 3 113
MJN Njeke 13/06/2006 331 442 56 106 20 955
JHN Strydom 11/03/2004 309 585 60 154 41 1 149
AF van Biljon 1/11/2002 212 480 60 154 73 979
J van Rooyen 18/07/2006 369 827 60 106 108 1 470
MLD Marole 1/01/2010 332 681 60 154 8 1 235
NP Mageza 1/01/2010 403 743 40 106 20 1 312
A Harper◊ 1/01/2010 1 215 1 358 181 241 104 3 099
F Titi± 1/07/2012 260 397 52 154 – 863
S Kheradpir ^^^^◊ 8/07/2015 425 675 26 239 – 1 365
Total 7 678 9 598 928 2 334 919 21 457
◊ Fees have been paid in euro.† Fees are paid to M1 Limited.^^^^ Appointed 8/07/2015.± Resigned 31/12/2015.# Retainer and attendance fees include fees for board and committee representation and meetings.
@ Fees paid to Anglogold Ashanti Limited.^^ Fourth quarter fees paid to Captrust Investments Proprietary Limited.
Our people and their remuneration continued
Remuneration report continued

MTN Group Limited Integrated Report 2015
89
OUR LEADERSHIP, GOVERNANCE, REWARD AND RECOGNITION
Emoluments, equity compensation and dealings in ordinary shares continued Directors’ emoluments and related payments continued
2014
Date
appointed
Salaries
R000
Post-
employment
benefits
R000
Other
benefits◊
R000
Bonuses
R000
Sub-total
R000
Share
gains◊◊
R000
Total
R000
Executive directors
RS Dabengwa 1/10/2001 9 334 1 197 858 13 257 24 646 3 482 28 128
BD Goschen 22/07/2013 5 567 714 286 6 777 13 344 – 13 344
Total 14 901 1 911 1 144 20 034 37 990 3 482 41 472
◊ Includes medical aid and unemployment insurance fund.◊ ◊ Pre-tax gains on share-based payments.
Date
appointed
Retainer#
R000
Attendance#
R000
Special
projects
R000
Strategy
session
R000
Ad hoc
work
R000
Total
R000
Non-executive directors
PF Nhleko 28/05/2013 1 084 608 92 183 – 1 967
KC Ramon^ 1/06/2014 123 187 – 96 21 427
KP Kalyan 13/06/2006 332 487 97 96 – 1 012
AT Mikatiנ 18/07/2006 1 163 707 111 219 97 2 297
MJN Njeke 13/06/2006 311 388 20 96 – 815
JHN Strydom 11/03/2004 299 459 20 96 42 916
AF van Biljon 1/11/2002 312 401 68 96 63 940
J van Rooyen 18/07/2006 364 533 90 96 21 1 104
MLD Marole 1/01/2010 310 775 21 96 – 1 202
NP Mageza 1/01/2010 361 566 42 96 20 1 085
A Harper◊ 1/01/2010 1 177 852 – 219 – 2 248
F Titi 1/07/2012 253 352 – 48 – 653
Total 6 089 6 315 561 1 437 264 14 666
◊ Fees have been paid in euro.† Fees are paid to M1 Limited.# Retainer and attendance fees include fees for board and committee representation and meetings.^ Fourth quarter fees paid to Anglogold Ashanti Limited.
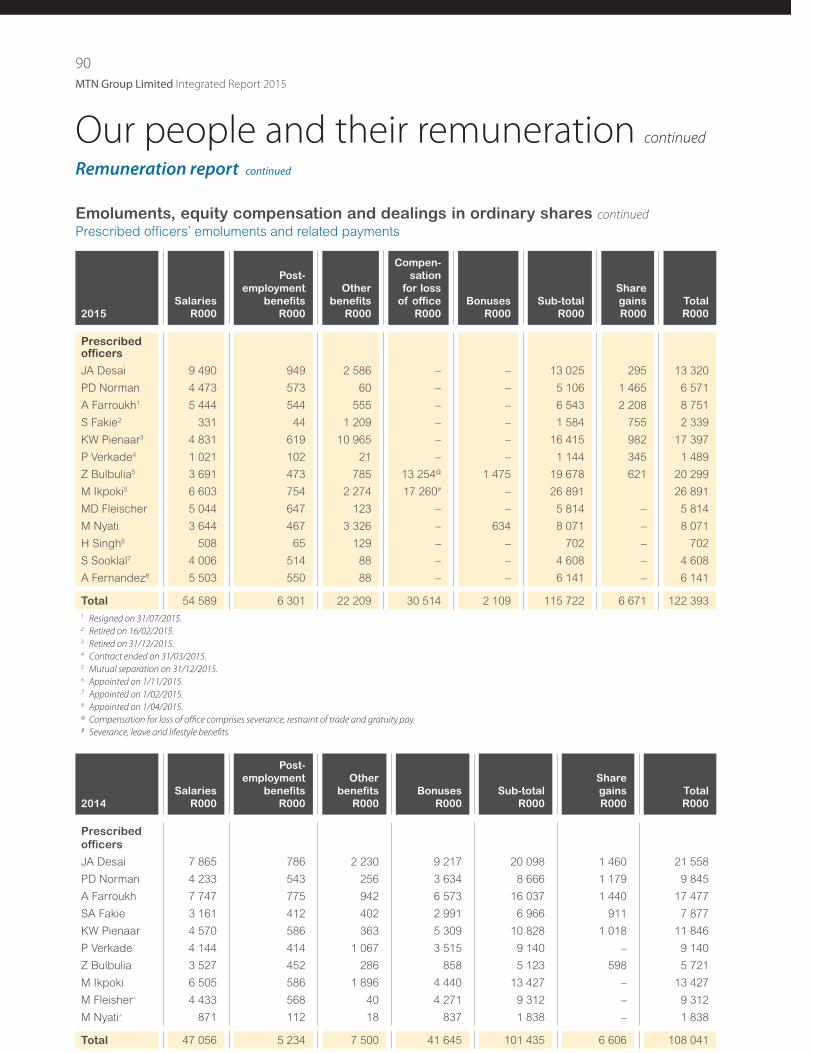
90
MTN Group Limited Integrated Report 2015
Emoluments, equity compensation and dealings in ordinary shares continued Prescribed officers’ emoluments and related payments
2015
Salaries
R000
Post-
employment
benefits
R000
Other
benefits
R000
Compen-
sation
for loss
of office
R000
Bonuses
R000
Sub-total
R000
Share
gains
R000
Total
R000
Prescribed officers
JA Desai 9 490 949 2 586 – – 13 025 295 13 320
PD Norman 4 473 573 60 – – 5 106 1 465 6 571
A Farroukh1 5 444 544 555 – – 6 543 2 208 8 751
S Fakie2 331 44 1 209 – – 1 584 755 2 339
KW Pienaar3 4 831 619 10 965 – – 16 415 982 17 397
P Verkade4 1 021 102 21 – – 1 144 345 1 489
Z Bulbulia5 3 691 473 785 13 254@ 1 475 19 678 621 20 299
M Ikpoki5 6 603 754 2 274 17 260# – 26 891 26 891
MD Fleischer 5 044 647 123 – – 5 814 – 5 814
M Nyati 3 644 467 3 326 – 634 8 071 – 8 071
H Singh6 508 65 129 – – 702 – 702
S Sooklal7 4 006 514 88 – – 4 608 – 4 608
A Fernandez8 5 503 550 88 – – 6 141 – 6 141
Total 54 589 6 301 22 209 30 514 2 109 115 722 6 671 122 393
1 Resigned on 31/07/2015.2 Retired on 16/02/2015.3 Retired on 31/12/2015.4 Contract ended on 31/03/2015.5 Mutual separation on 31/12/2015.6 Appointed on 1/11/2015.7 Appointed on 1/02/2015.8 Appointed on 1/04/2015.@ Compensation for loss of office comprises severance, restraint of trade and gratuity pay.# Severance, leave and lifestyle benefits.
2014
Salaries
R000
Post-
employment
benefits
R000
Other
benefits
R000
Bonuses
R000
Sub-total
R000
Share
gains
R000
Total
R000
Prescribed
officers
JA Desai 7 865 786 2 230 9 217 20 098 1 460 21 558
PD Norman 4 233 543 256 3 634 8 666 1 179 9 845
A Farroukh 7 747 775 942 6 573 16 037 1 440 17 477
SA Fakie 3 161 412 402 2 991 6 966 911 7 877
KW Pienaar 4 570 586 363 5 309 10 828 1 018 11 846
P Verkade 4 144 414 1 067 3 515 9 140 – 9 140
Z Bulbulia 3 527 452 286 858 5 123 598 5 721
M Ikpoki 6 505 586 1 896 4 440 13 427 – 13 427
M Fleisher^ 4 433 568 40 4 271 9 312 – 9 312
M Nyati^ 871 112 18 837 1 838 – 1 838
Total 47 056 5 234 7 500 41 645 101 435 6 606 108 041
Our people and their remuneration continued
Remuneration report continued
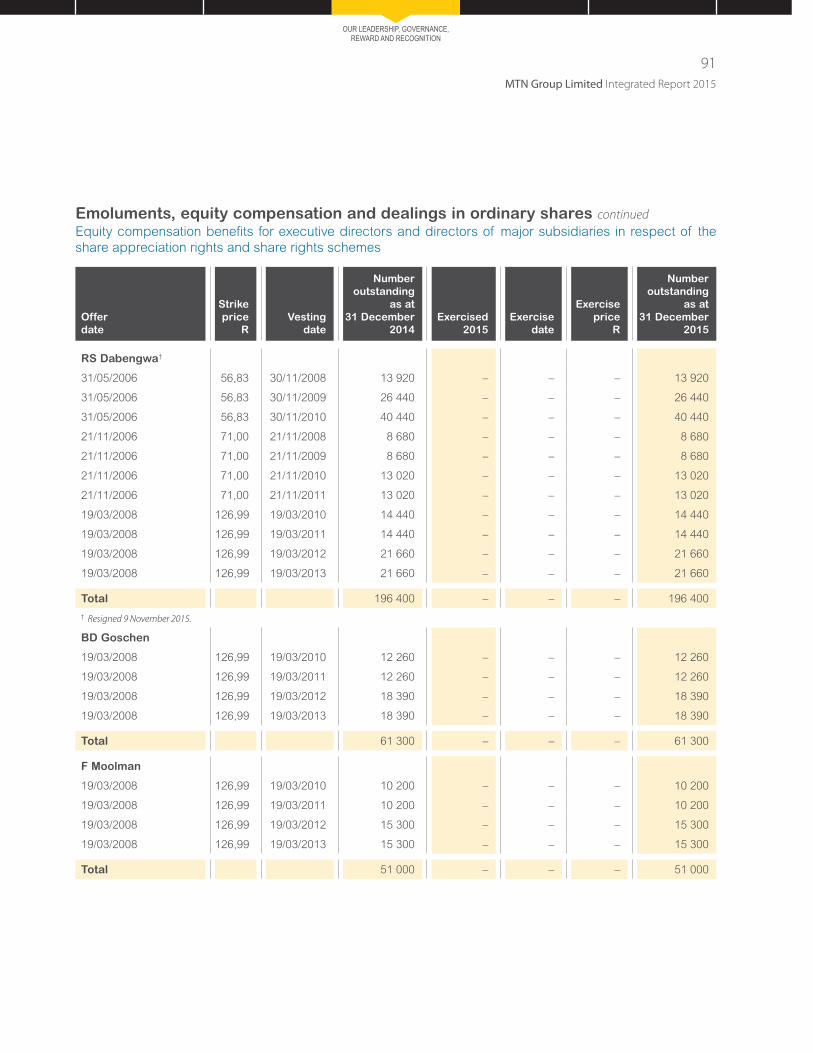
MTN Group Limited Integrated Report 2015
91
OUR LEADERSHIP, GOVERNANCE, REWARD AND RECOGNITION
Emoluments, equity compensation and dealings in ordinary shares continued
Equity compensation benefits for executive directors and directors of major subsidiaries in respect of the
share appreciation rights and share rights schemes
Offer
date
Strike
price
R
Vesting
date
Number
outstanding
as at
31 December
2014
Exercised
2015
Exercise
date
Exercise
price
R
Number
outstanding
as at
31 December
2015
RS Dabengwa†
31/05/2006 56,83 30/11/2008 13 920 – – – 13 920
31/05/2006 56,83 30/11/2009 26 440 – – – 26 440
31/05/2006 56,83 30/11/2010 40 440 – – – 40 440
21/11/2006 71,00 21/11/2008 8 680 – – – 8 680
21/11/2006 71,00 21/11/2009 8 680 – – – 8 680
21/11/2006 71,00 21/11/2010 13 020 – – – 13 020
21/11/2006 71,00 21/11/2011 13 020 – – – 13 020
19/03/2008 126,99 19/03/2010 14 440 – – – 14 440
19/03/2008 126,99 19/03/2011 14 440 – – – 14 440
19/03/2008 126,99 19/03/2012 21 660 – – – 21 660
19/03/2008 126,99 19/03/2013 21 660 – – – 21 660
Total 196 400 – – – 196 400
† Resigned 9 November 2015.
BD Goschen
19/03/2008 126,99 19/03/2010 12 260 – – – 12 260
19/03/2008 126,99 19/03/2011 12 260 – – – 12 260
19/03/2008 126,99 19/03/2012 18 390 – – – 18 390
19/03/2008 126,99 19/03/2013 18 390 – – – 18 390
Total 61 300 – – – 61 300
F Moolman
19/03/2008 126,99 19/03/2010 10 200 – – – 10 200
19/03/2008 126,99 19/03/2011 10 200 – – – 10 200
19/03/2008 126,99 19/03/2012 15 300 – – – 15 300
19/03/2008 126,99 19/03/2013 15 300 – – – 15 300
Total 51 000 – – – 51 000
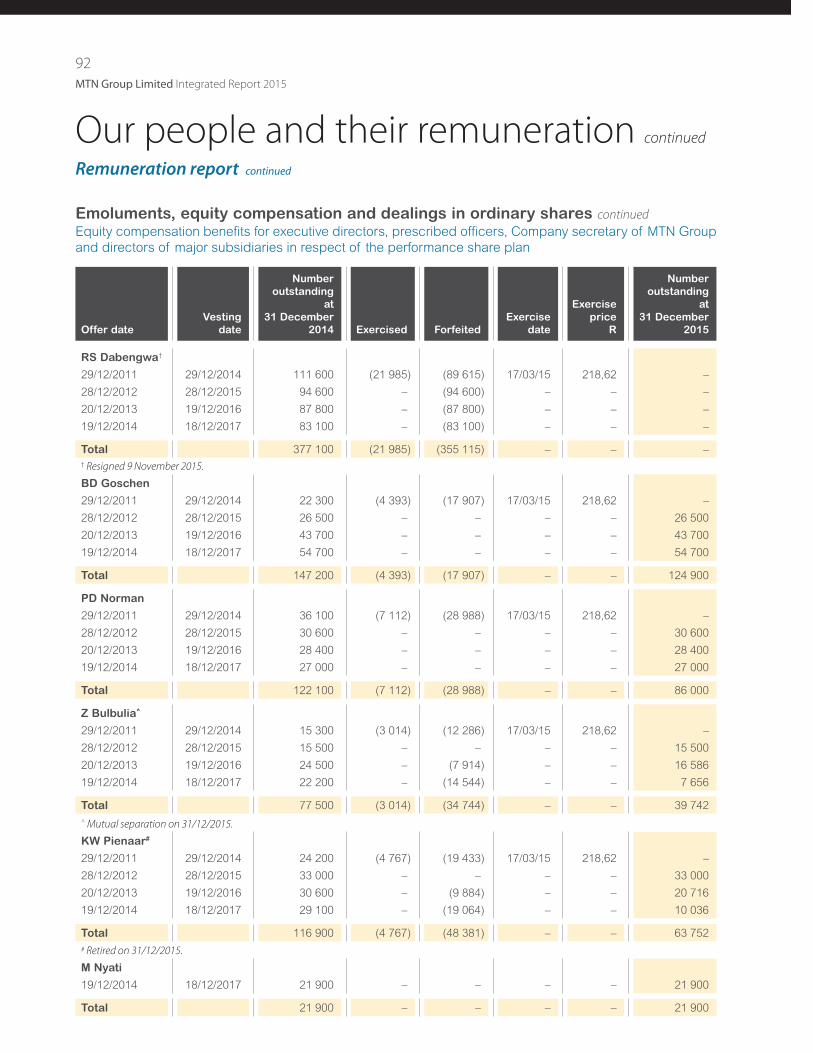
92
MTN Group Limited Integrated Report 2015
Emoluments, equity compensation and dealings in ordinary shares continued
Equity compensation benefits for executive directors, prescribed officers, Company secretary of MTN Group
and directors of major subsidiaries in respect of the performance share plan
Offer date
Vesting
date
Number
outstanding
at
31 December
2014 Exercised Forfeited
Exercise
date
Exercise
price
R
Number
outstanding
at
31 December
2015
RS Dabengwa†
29/12/2011 29/12/2014 111 600 (21 985) (89 615) 17/03/15 218,62 –
28/12/2012 28/12/2015 94 600 – (94 600) – – –
20/12/2013 19/12/2016 87 800 – (87 800) – – –
19/12/2014 18/12/2017 83 100 – (83 100) – – –
Total 377 100 (21 985) (355 115) – – –† Resigned 9 November 2015.
BD Goschen
29/12/2011 29/12/2014 22 300 (4 393) (17 907) 17/03/15 218,62 –
28/12/2012 28/12/2015 26 500 – – – – 26 500
20/12/2013 19/12/2016 43 700 – – – – 43 700
19/12/2014 18/12/2017 54 700 – – – – 54 700
Total 147 200 (4 393) (17 907) – – 124 900
PD Norman
29/12/2011 29/12/2014 36 100 (7 112) (28 988) 17/03/15 218,62 –
28/12/2012 28/12/2015 30 600 – – – – 30 600
20/12/2013 19/12/2016 28 400 – – – – 28 400
19/12/2014 18/12/2017 27 000 – – – – 27 000
Total 122 100 (7 112) (28 988) – – 86 000
Z Bulbulia^
29/12/2011 29/12/2014 15 300 (3 014) (12 286) 17/03/15 218,62 –
28/12/2012 28/12/2015 15 500 – – – – 15 500
20/12/2013 19/12/2016 24 500 – (7 914) – – 16 586
19/12/2014 18/12/2017 22 200 – (14 544) – – 7 656
Total 77 500 (3 014) (34 744) – – 39 742
^ Mutual separation on 31/12/2015.
KW Pienaar#
29/12/2011 29/12/2014 24 200 (4 767) (19 433) 17/03/15 218,62 –
28/12/2012 28/12/2015 33 000 – – – – 33 000
20/12/2013 19/12/2016 30 600 – (9 884) – – 20 716
19/12/2014 18/12/2017 29 100 – (19 064) – – 10 036
Total 116 900 (4 767) (48 381) – – 63 752
# Retired on 31/12/2015.
M Nyati
19/12/2014 18/12/2017 21 900 – – – – 21 900
Total 21 900 – – – – 21 900
Our people and their remuneration continued
Remuneration report continued
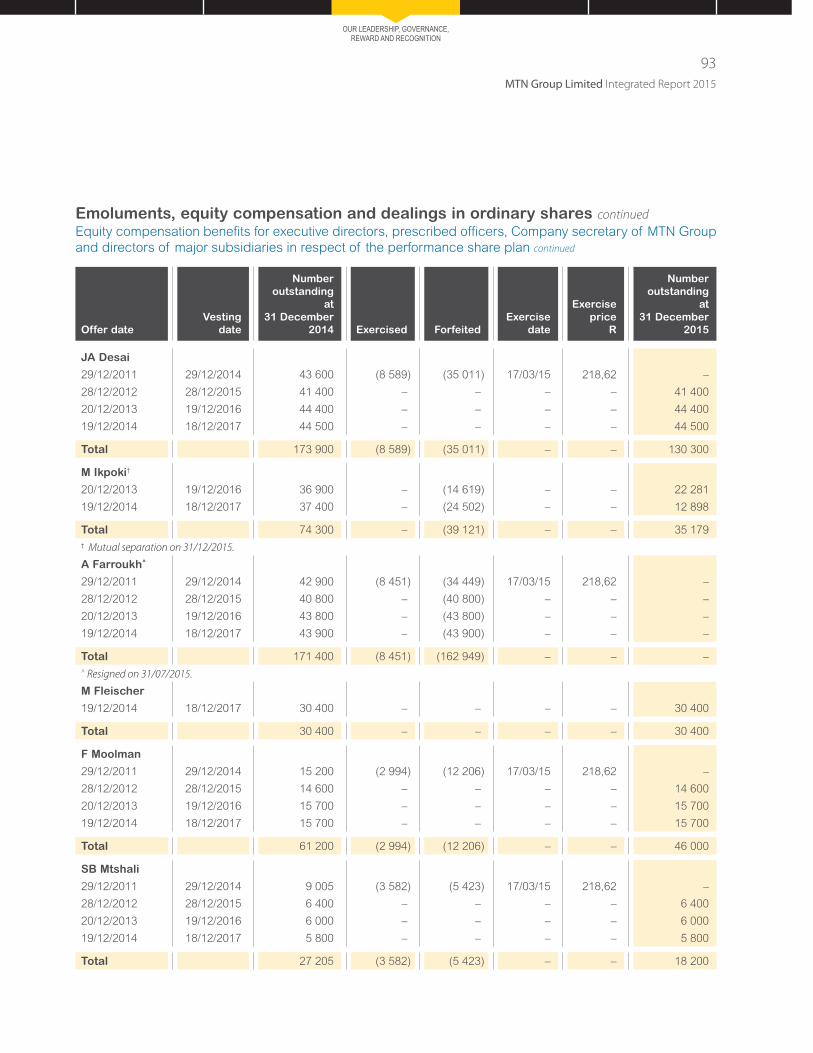
MTN Group Limited Integrated Report 2015
93
OUR LEADERSHIP, GOVERNANCE, REWARD AND RECOGNITION
Emoluments, equity compensation and dealings in ordinary shares continued
Equity compensation benefits for executive directors, prescribed officers, Company secretary of MTN Group
and directors of major subsidiaries in respect of the performance share plan continued
Offer date
Vesting
date
Number
outstanding
at
31 December
2014 Exercised Forfeited
Exercise
date
Exercise
price
R
Number
outstanding
at
31 December
2015
JA Desai
29/12/2011 29/12/2014 43 600 (8 589) (35 011) 17/03/15 218,62 –
28/12/2012 28/12/2015 41 400 – – – – 41 400
20/12/2013 19/12/2016 44 400 – – – – 44 400
19/12/2014 18/12/2017 44 500 – – – – 44 500
Total 173 900 (8 589) (35 011) – – 130 300
M Ikpoki†
20/12/2013 19/12/2016 36 900 – (14 619) – – 22 281
19/12/2014 18/12/2017 37 400 – (24 502) – – 12 898
Total 74 300 – (39 121) – – 35 179
† Mutual separation on 31/12/2015.
A Farroukh^
29/12/2011 29/12/2014 42 900 (8 451) (34 449) 17/03/15 218,62 –
28/12/2012 28/12/2015 40 800 – (40 800) – – –
20/12/2013 19/12/2016 43 800 – (43 800) – – –
19/12/2014 18/12/2017 43 900 – (43 900) – – –
Total 171 400 (8 451) (162 949) – – –
^ Resigned on 31/07/2015.
M Fleischer
19/12/2014 18/12/2017 30 400 – – – – 30 400
Total 30 400 – – – – 30 400
F Moolman
29/12/2011 29/12/2014 15 200 (2 994) (12 206) 17/03/15 218,62 –
28/12/2012 28/12/2015 14 600 – – – – 14 600
20/12/2013 19/12/2016 15 700 – – – – 15 700
19/12/2014 18/12/2017 15 700 – – – – 15 700
Total 61 200 (2 994) (12 206) – – 46 000
SB Mtshali
29/12/2011 29/12/2014 9 005 (3 582) (5 423) 17/03/15 218,62 –
28/12/2012 28/12/2015 6 400 – – – – 6 400
20/12/2013 19/12/2016 6 000 – – – – 6 000
19/12/2014 18/12/2017 5 800 – – – – 5 800
Total 27 205 (3 582) (5 423) – – 18 200
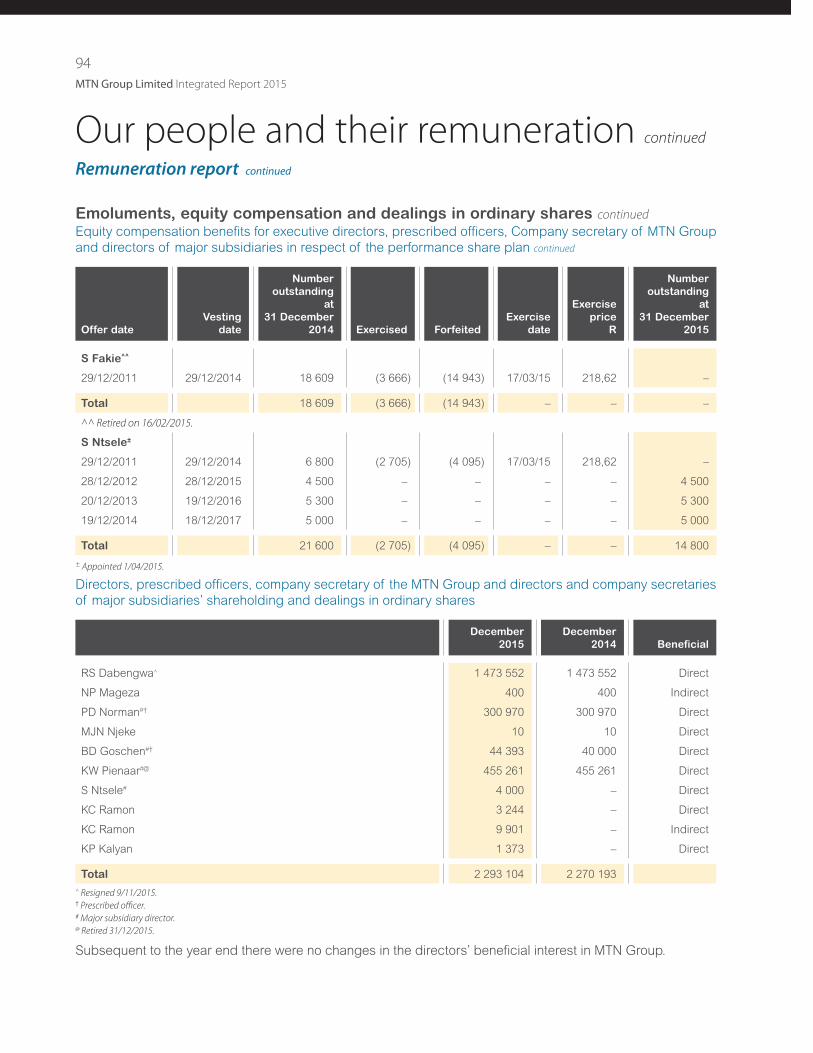
94
MTN Group Limited Integrated Report 2015
Emoluments, equity compensation and dealings in ordinary shares continued
Equity compensation benefits for executive directors, prescribed officers, Company secretary of MTN Group
and directors of major subsidiaries in respect of the performance share plan continued
Offer date
Vesting
date
Number
outstanding
at
31 December
2014 Exercised Forfeited
Exercise
date
Exercise
price
R
Number
outstanding
at
31 December
2015
S Fakie^^
29/12/2011 29/12/2014 18 609 (3 666) (14 943) 17/03/15 218,62 –
Total 18 609 (3 666) (14 943) – – –
^^ Retired on 16/02/2015.
S Ntsele±
29/12/2011 29/12/2014 6 800 (2 705) (4 095) 17/03/15 218,62 –
28/12/2012 28/12/2015 4 500 – – – – 4 500
20/12/2013 19/12/2016 5 300 – – – – 5 300
19/12/2014 18/12/2017 5 000 – – – – 5 000
Total 21 600 (2 705) (4 095) – – 14 800
± Appointed 1/04/2015.
Directors, prescribed officers, company secretary of the MTN Group and directors and company secretaries
of major subsidiaries’ shareholding and dealings in ordinary shares
December
2015
December
2014 Beneficial
RS Dabengwa^ 1 473 552 1 473 552 Direct
NP Mageza 400 400 Indirect
PD Norman#† 300 970 300 970 Direct
MJN Njeke 10 10 Direct
BD Goschen#† 44 393 40 000 Direct
KW Pienaar#@ 455 261 455 261 Direct
S Ntsele# 4 000 – Direct
KC Ramon 3 244 – Direct
KC Ramon 9 901 – Indirect
KP Kalyan 1 373 – Direct
Total 2 293 104 2 270 193
^ Resigned 9/11/2015.† Prescribed officer.# Major subsidiary director.@ Retired 31/12/2015.
Subsequent to the year end there were no changes in the directors’ beneficial interest in MTN Group.
Our people and their remuneration continued
Remuneration report continued
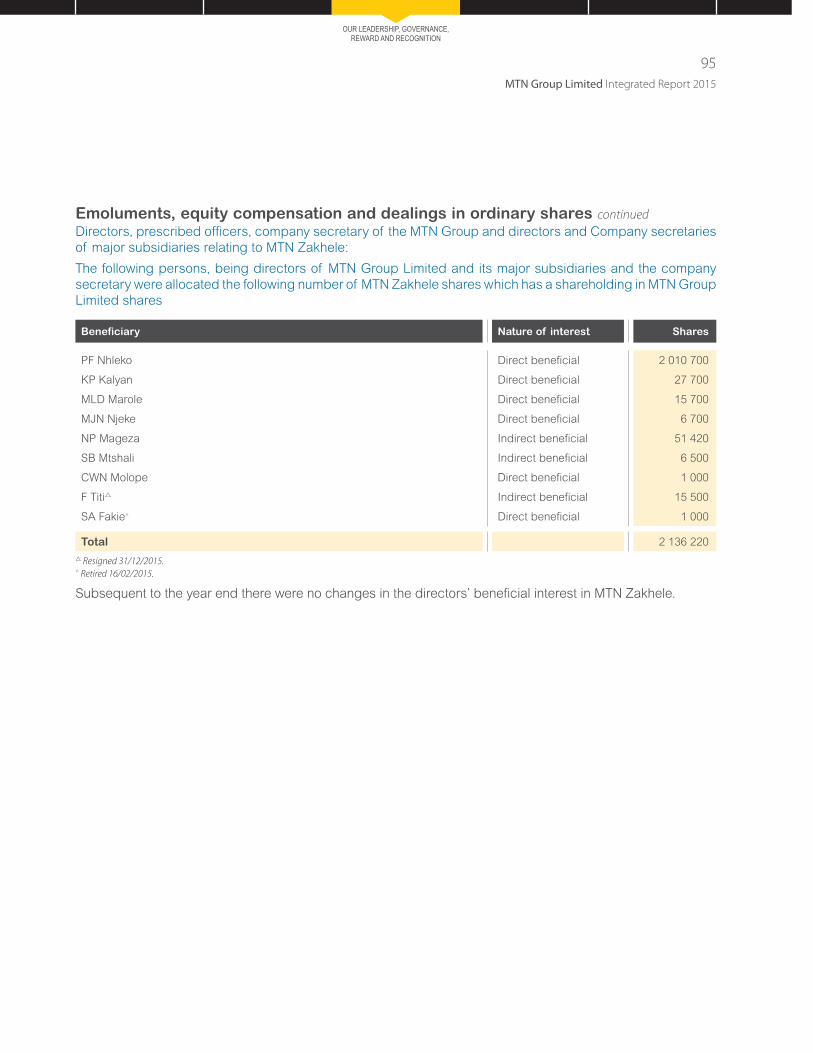
MTN Group Limited Integrated Report 2015
95
OUR LEADERSHIP, GOVERNANCE, REWARD AND RECOGNITION
Emoluments, equity compensation and dealings in ordinary shares continued
Directors, prescribed officers, company secretary of the MTN Group and directors and Company secretaries
of major subsidiaries relating to MTN Zakhele:
The following persons, being directors of MTN Group Limited and its major subsidiaries and the company
secretary were allocated the following number of MTN Zakhele shares which has a shareholding in MTN Group
Limited shares
Beneficiary Nature of interest Shares
PF Nhleko Direct beneficial 2 010 700
KP Kalyan Direct beneficial 27 700
MLD Marole Direct beneficial 15 700
MJN Njeke Direct beneficial 6 700
NP Mageza Indirect beneficial 51 420
SB Mtshali Indirect beneficial 6 500
CWN Molope Direct beneficial 1 000
F Titi Indirect beneficial 15 500
SA Fakie^ Direct beneficial 1 000
Total 2 136 220
Resigned 31/12/2015.^ Retired 16/02/2015.
Subsequent to the year end there were no changes in the directors’ beneficial interest in MTN Zakhele.

MTN Business Cloud MTN Global MPLS Machine-to-machine Partnerships
Our Enterprise Business Unit
continued to align operations to
become the ICT partner of choice.
Continued rollout of MTN global multiprotocol label
switching (MPLS), bringing the footprint to
25 points of presence in Africa.
Launched
pan-African
Internet of
Things (IoT)
platform
Internet of Things
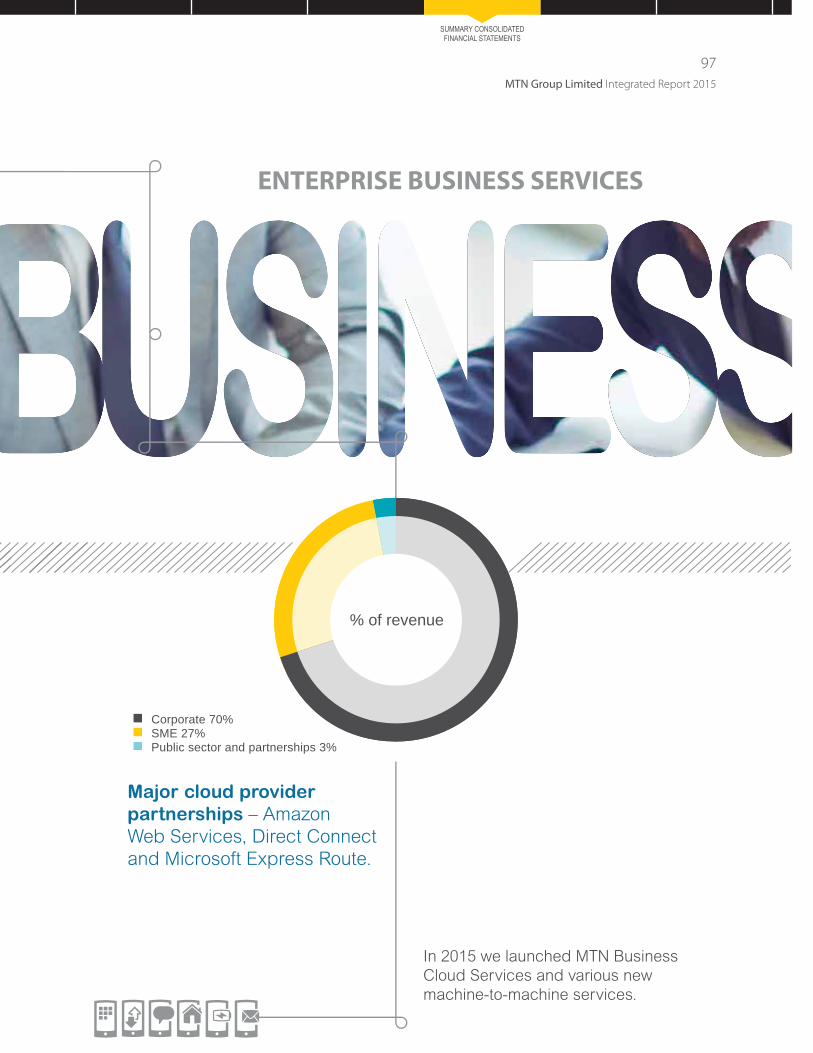
SUMMARY CONSOLIDATED FINANCIAL STATEMENTS
ENTERPRISE BUSINESS SERVICES
Major cloud provider
partnerships – Amazon
Web Services, Direct Connect
and Microsoft Express Route.
In 2015 we launched MTN Business
Cloud Services and various new
machine-to-machine services.
% of revenue
Corporate 70%SME 27%Public sector and partnerships 3%
MTN Group Limited Integrated Report 2015
97

98
MTN Group Limited Integrated Report 2015
TO THE SHAREHOLDERS OF MTN GROUP LIMITED
The summary consolidated financial statements of MTN Group Limited, set out on 100 to 111 of the MTN Group Limited integrated report for the year ended 31 December 2015, which comprise the summary consolidated statement of financial position as at 31 December 2015, the summary consolidated income statement, the summary consolidated statements of comprehensive income, changes in equity and cash flows for the year then ended and related notes, are derived from the audited consolidated financial statements of MTN Group Limited for the year ended 31 December 2015. We expressed an unmodified audit opinion on those consolidated financial statements in our report dated 2 March 2016. Our auditors’ report on the audited consolidated financial statements contained an Emphasis of Matter paragraph and an Other Matter paragraph: “Other reports required by the Companies Act” (refer below).
The summary consolidated financial statements do not contain all the disclosures required by International Financial Reporting Standards and the requirements of the Companies Act of South Africa as applicable to annual financial statements. Reading the summary consolidated financial statements, therefore, is not a substitute for reading the audited consolidated financial statements of MTN Group Limited.
DIRECTORS’ RESPONSIBILITY FOR THE SUMMARY CONSOLIDATED FINANCIAL STATEMENTSThe directors are responsible for the preparation of a summary of the audited consolidated financial statements in accordance with the JSE Limited’s (JSE) requirements for summary financial statements, set out in note 3 to the summary consolidated financial statements, and the requirements of the Companies Act of South Africa as applicable to summary financial statements, and for such internal control as the directors determine is necessary to enable the preparation of summary consolidated financial statements that are free from material misstatement, whether due to fraud or error.
AUDITORS’ RESPONSIBILITYOur responsibility is to express an opinion on the summary consolidated financial statements based on our procedures, which were conducted in accordance with International Standard on Auditing (ISA) 810, “Engagements to Report on Summary Financial Statements”.
OPINIONIn our opinion, the summary consolidated financial statements derived from the audited consolidated financial statements of MTN Group Limited for the year ended 31 December 2015 are consistent, in all material respects, with those consolidated financial statements, in accordance with the JSE’s requirements for summary financial statements, set out in note 3 to the summary consolidated financial statements, and the requirements of the Companies Act of South Africa as applicable to summary financial statements.
EMPHASIS OF MATTERIn our audit report dated 2 March 2016 we drew attention to note 6.3 to the audited consolidated financial statements which describes the circumstances, uncertainty and current status of the regulatory fine imposed by the Nigerian Communications Commission (NCC) against MTN Nigeria Communications Limited. The uncertainty regarding this matter, described in note 8 to the summary consolidated financial statements, is as inherent to the summary consolidated financial statements as it is to the audited consolidated financial statements. This matter did not result in us qualifying our opinion on the audited consolidated financial statements or our opinion on the summary consolidated financial statements.
Summary consolidated financial statementsIndependent auditors’ report on the summary consolidated financial statements
MTN Group Limited Integrated Report 2015
99
SUMMARY CONSOLIDATED FINANCIAL STATEMENTS
OTHER REPORTS REQUIRED BY THE COMPANIES ACTThe “Other reports required by the Companies Act” paragraph in our audit report dated 2 March 2016 states that as part of our audit of the consolidated financial statements for the year ended 31 December 2015, we have read the Report of the audit committee, the Certificate by the Company Secretary and the Directors’ report for the purpose of identifying whether there are material inconsistencies between these reports and the audited consolidated financial statements. These reports are the responsibility of the respective preparers. The paragraph also states that, based on reading these reports, we have not identified material inconsistencies between these reports and the audited consolidated financial statements. The paragraph furthermore states that we have not audited these reports and accordingly do not express an opinion on these reports. The paragraph does not have an effect on the summary consolidated financial statements or our opinion thereon.
PricewaterhouseCoopers Inc. SizweNtsalubaGobodo Inc.Director: JR van Huyssteen Director: SY LockhatRegistered Auditor Registered AuditorSunninghill Woodmead2 March 2016 2 March 2016

100
MTN Group Limited Integrated Report 2015
Summary consolidated financial statements continued
for the year ended 31 December 2015
for the year ended 31 December 2015
Summary consolidated income statement
Summary consolidated statement of comprehensive income
Note2015
Rm20141
Rm
Revenue 147 063 146 930Other income 8 409 7 928Direct network and technology operating costs (18 809) (16 354)Costs of handsets and other accessories (10 829) (10 314)Interconnect and roaming (13 102) (13 653)Staff costs (8 587) (8 838)Selling, distribution and marketing expenses (18 412) (17 174)Government and regulatory costs (5 888) (5 734)Other operating expenses (11 433) (9 600)
EBITDA before Nigeria regulatory fine 68 412 73 191Nigeria regulatory fine 8 (9 287) –
EBITDA 59 125 73 191Depreciation of property, plant and equipment (19 557) (18 262)Amortisation of intangible assets (3 736) (3 251)Impairment of goodwill (504) (2 033)
Operating profit 35 328 49 645Net finance costs (3 010) (3 668)Net monetary gain 1 348 878 Share of results of associates and joint ventures after tax 9 1 226 4 208
Profit before tax 34 892 51 063Income tax expense (11 322) (13 361)
Profit after tax 23 570 37 702
Attributable to:Equity holders of the Company 20 204 32 079Non-controlling interests 3 366 5 623
23 570 37 702
Basic earnings per share (cents) 7 1 109 1 752
Diluted earnings per share (cents) 7 1 106 1 742 1 Restated, refer note 18.
2015Rm
2014Rm
Profit after tax 23 570 37 702Other comprehensive income after tax:
Exchange differences on translating foreign operations including the effect of hyperinflation° 22 203 2 968
Equity holders of the Company 21 033 2 960Non-controlling interests 1 170 8
Total comprehensive income 45 773 40 670
Attributable to:Equity holders of the Company 41 237 35 039Non-controlling interests 4 536 5 631
45 773 40 670

MTN Group Limited Integrated Report 2015
101
SUMMARY CONSOLIDATED FINANCIAL STATEMENTS
as at 31 December 2015Summary consolidated statement of financial position
Note2015
Rm2014
Rm
Non-current assets 218 435 163 218
Property, plant and equipment# 106 702 87 546
Intangible assets and goodwill# 55 887 36 618
Investment in associates and joint ventures^ 35 552 25 514
Deferred tax and other non-current assets 20 294 13 540
Current assets 95 432 90 467
Non-current assets held for sale 16 10 3 848
95 422 86 619
Other current assets 15 940 9 810
Trade and other receivables 43 570 32 818
Restricted cash 1 735 893
Cash and cash equivalents 34 177 43 098
Total assets 313 867 253 685
Total equity 151 838 133 442
Attributable to equity holders of the Company 146 369 128 517
Non-controlling interests 5 469 4 925
Non-current liabilities 72 510 52 613
Interest-bearing liabilities 13 52 661 39 470
Deferred tax and other non-current liabilities 19 849 13 143
Current liabilities 89 519 67 630
Interest-bearing liabilities 13 22 510 13 809
Trade and other payables 40 484 33 234
Other current liabilities 26 525 20 587
Total equity and liabilities 313 867 253 685
# The increase in property, plant and equipment and intangible assets was mainly due to capital expenditure for the year amounting to R29 611 million.^ The increase in investment in joint ventures and associates was mainly due to the Group recognising an additional equity interest in Nigeria Tower
Interco B.V. (note 16).
The devaluation of the rand, which is the presentation currency of the Group, against the functional currencies of the Group’s largest operations contributed significantly to the increase in assets and liabilities which are translated into the Group’s presentation currency at closing rates at the end of the reporting period.
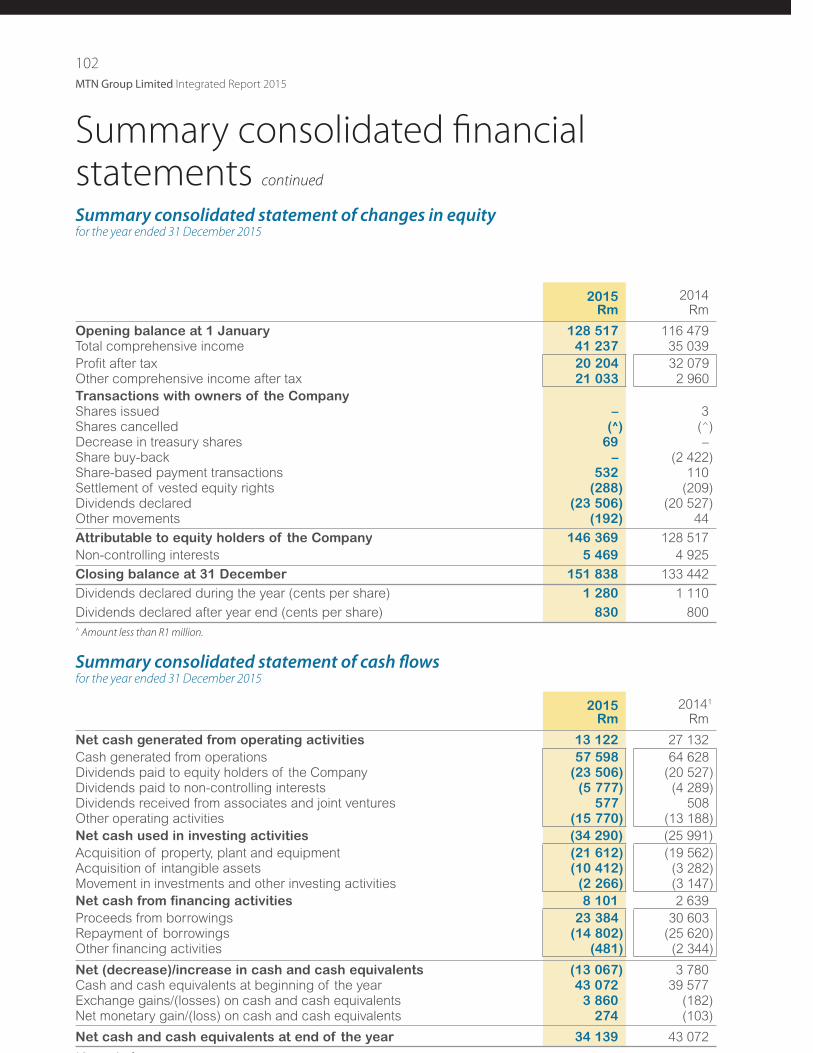
102
MTN Group Limited Integrated Report 2015
for the year ended 31 December 2015
for the year ended 31 December 2015
Summary consolidated statement of changes in equity
Summary consolidated statement of cash flows
2015Rm
2014Rm
Opening balance at 1 January 128 517 116 479 Total comprehensive income 41 237 35 039
Profit after tax 20 204 32 079 Other comprehensive income after tax 21 033 2 960
Transactions with owners of the Company
Shares issued – 3Shares cancelled (^) (^)Decrease in treasury shares 69 – Share buy-back – (2 422)Share-based payment transactions 532 110Settlement of vested equity rights (288) (209)Dividends declared (23 506) (20 527)Other movements (192) 44
Attributable to equity holders of the Company 146 369 128 517
Non-controlling interests 5 469 4 925
Closing balance at 31 December 151 838 133 442
Dividends declared during the year (cents per share) 1 280 1 110
Dividends declared after year end (cents per share) 830 800 ^ Amount less than R1 million.
2015Rm
20141
Rm
Net cash generated from operating activities 13 122 27 132
Cash generated from operations 57 598 64 628Dividends paid to equity holders of the Company (23 506) (20 527)Dividends paid to non-controlling interests (5 777) (4 289)Dividends received from associates and joint ventures 577 508Other operating activities (15 770) (13 188)
Net cash used in investing activities (34 290) (25 991)
Acquisition of property, plant and equipment (21 612) (19 562)Acquisition of intangible assets (10 412) (3 282)Movement in investments and other investing activities (2 266) (3 147)
Net cash from financing activities 8 101 2 639
Proceeds from borrowings 23 384 30 603Repayment of borrowings (14 802) (25 620)Other financing activities (481) (2 344)
Net (decrease)/increase in cash and cash equivalents (13 067) 3 780Cash and cash equivalents at beginning of the year 43 072 39 577Exchange gains/(losses) on cash and cash equivalents 3 860 (182)Net monetary gain/(loss) on cash and cash equivalents 274 (103)
Net cash and cash equivalents at end of the year 34 139 43 072
1 R d f
Summary consolidated financial statements continued

MTN Group Limited Integrated Report 2015
103
SUMMARY CONSOLIDATED FINANCIAL STATEMENTS
for the year ended 31 December 2015Notes to the summary consolidated financial statements
1. INDEPENDENT AUDITThe summary consolidated financial statements have been derived from the audited consolidated financial statements. The directors of the Company take full responsibility for the preparation of the summary consolidated financial statements and that the financial information has been correctly derived and are consistent in all material respects with the underlying audited consolidated financial statements. The summary consolidated financial statements for the year ended 31 December 2015 have been audited by our joint auditors PricewaterhouseCoopers Inc. and SizweNtsalubaGobodo Inc., who expressed an unmodified opinion thereon. The auditors also expressed an unmodified opinion on the consolidated financial statements from which these summary consolidated financial statements were derived. The auditors’ reports contained emphasis of matter paragraphs which drew attention to the circumstances, uncertainty and current status of the regulatory fine imposed by the NCC against MTN Nigeria Communications Limited. Disclosure regarding the matter that was emphasised by the auditors is contained in note 8 to the summary consolidated financial statements. A copy of the auditors’ report on the consolidated financial statements is available for inspection at the Company’s registered office, together with the financial statements identified in the auditors’ report.
2. GENERAL INFORMATIONMTN Group Limited (the Company) carries on the business of investing in the telecommunications industry through its subsidiary companies, joint ventures and associates.
3. BASIS OF PREPARATIONThe summary consolidated financial statements are prepared in accordance with the requirements of the JSE Limited Listings Requirements for provisional reports and the requirements of the Companies Act applicable to summary financial statements. The Listings Requirements require provisional reports to be prepared in accordance with the framework concepts and the measurement and recognition requirements of International Financial Reporting Standards (IFRS) and the SAICA Financial Reporting Guides as issued by the Accounting Practices Committee and the Financial Pronouncements as issued by the Financial Reporting Standards Council (FRSC), and to also, as a minimum, contain the information required by IAS 34 Interim Financial Reporting.
The accounting policies applied in the preparation of the consolidated financial statements from which the summary consolidated financial statements were derived, are in terms of IFRS and are consistent with those accounting policies applied in the preparation of the previous consolidated annual financial statements unless otherwise stated.
These summary consolidated financial statements should be read in conjunction with the consolidated financial statements for the year ended 31 December 2015, which have been prepared in accordance with IFRS. A copy of the full set of the audited consolidated financial statements is available for inspection from the company secretary at the registered office of the Company.
4. PRINCIPAL ACCOUNTING POLICIESThe Group has adopted all the new, revised or amended accounting pronouncements as issued by the International Accounting Standards Board (IASB) which were effective for the Group from 1 January 2015, none of which had a material impact on the Group.
The accounting policies applied in the preparation of the consolidated financial statements from which the summary consolidated financial statements were derived are in terms of IFRS and are consistent with those accounting policies applied in the preparation of the previous consolidated financial statements unless otherwise stated.
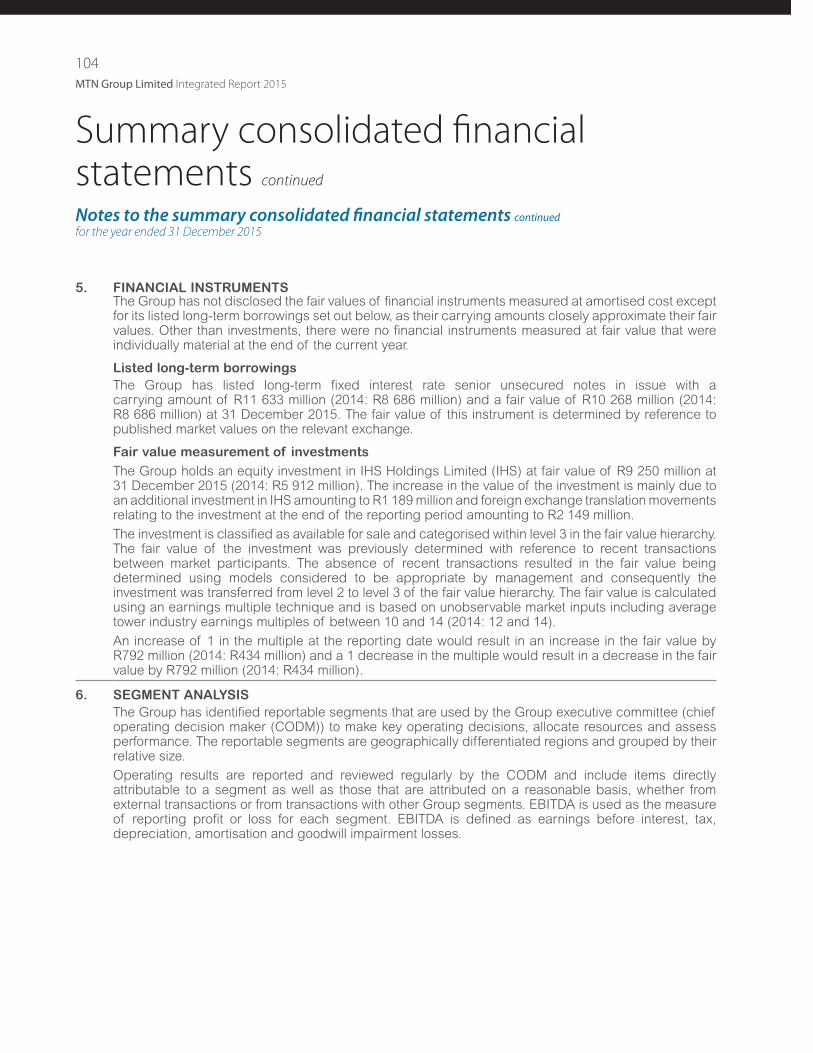
104
MTN Group Limited Integrated Report 2015
for the year ended 31 December 2015Notes to the summary consolidated financial statements continued
5. FINANCIAL INSTRUMENTSThe Group has not disclosed the fair values of financial instruments measured at amortised cost except for its listed long-term borrowings set out below, as their carrying amounts closely approximate their fair values. Other than investments, there were no financial instruments measured at fair value that were individually material at the end of the current year.
Listed long-term borrowings
The Group has listed long-term fixed interest rate senior unsecured notes in issue with a carrying amount of R11 633 million (2014: R8 686 million) and a fair value of R10 268 million (2014: R8 686 million) at 31 December 2015. The fair value of this instrument is determined by reference to published market values on the relevant exchange.
Fair value measurement of investments
The Group holds an equity investment in IHS Holdings Limited (IHS) at fair value of R9 250 million at 31 December 2015 (2014: R5 912 million). The increase in the value of the investment is mainly due to an additional investment in IHS amounting to R1 189 million and foreign exchange translation movements relating to the investment at the end of the reporting period amounting to R2 149 million.
The investment is classified as available for sale and categorised within level 3 in the fair value hierarchy. The fair value of the investment was previously determined with reference to recent transactions between market participants. The absence of recent transactions resulted in the fair value being determined using models considered to be appropriate by management and consequently the investment was transferred from level 2 to level 3 of the fair value hierarchy. The fair value is calculated using an earnings multiple technique and is based on unobservable market inputs including average tower industry earnings multiples of between 10 and 14 (2014: 12 and 14).
An increase of 1 in the multiple at the reporting date would result in an increase in the fair value by R792 million (2014: R434 million) and a 1 decrease in the multiple would result in a decrease in the fair value by R792 million (2014: R434 million).
6. SEGMENT ANALYSIS
The Group has identified reportable segments that are used by the Group executive committee (chief operating decision maker (CODM)) to make key operating decisions, allocate resources and assess performance. The reportable segments are geographically differentiated regions and grouped by their relative size.
Operating results are reported and reviewed regularly by the CODM and include items directly attributable to a segment as well as those that are attributed on a reasonable basis, whether from external transactions or from transactions with other Group segments. EBITDA is used as the measure of reporting profit or loss for each segment. EBITDA is defined as earnings before interest, tax, depreciation, amortisation and goodwill impairment losses.
Summary consolidated financial statements continued
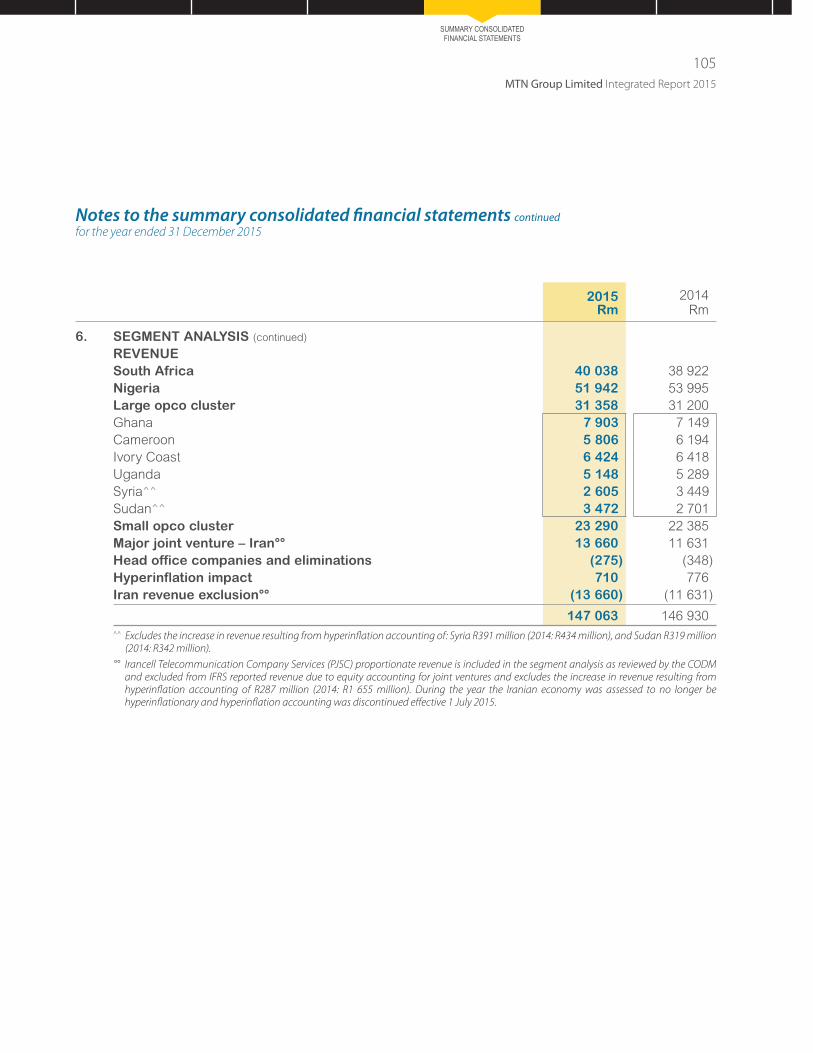
MTN Group Limited Integrated Report 2015
105
SUMMARY CONSOLIDATED FINANCIAL STATEMENTS
for the year ended 31 December 2015Notes to the summary consolidated financial statements continued
2015Rm
2014Rm
6. SEGMENT ANALYSIS (continued)
REVENUE
South Africa 40 038 38 922
Nigeria 51 942 53 995
Large opco cluster 31 358 31 200
Ghana 7 903 7 149
Cameroon 5 806 6 194
Ivory Coast 6 424 6 418
Uganda 5 148 5 289
Syria^^ 2 605 3 449
Sudan^^ 3 472 2 701
Small opco cluster 23 290 22 385
Major joint venture – Iran°° 13 660 11 631
Head office companies and eliminations (275) (348)
Hyperinflation impact 710 776
Iran revenue exclusion°° (13 660) (11 631)
147 063 146 930^^ Excludes the increase in revenue resulting from hyperinflation accounting of: Syria R391 million (2014: R434 million), and Sudan R319 million
(2014: R342 million).
°° Irancell Telecommunication Company Services (PJSC) proportionate revenue is included in the segment analysis as reviewed by the CODM and excluded from IFRS reported revenue due to equity accounting for joint ventures and excludes the increase in revenue resulting from hyperinflation accounting of R287 million (2014: R1 655 million). During the year the Iranian economy was assessed to no longer be hyperinflationary and hyperinflation accounting was discontinued effective 1 July 2015.

106
MTN Group Limited Integrated Report 2015
for the year ended 31 December 2015Notes to the summary consolidated financial statements continued
2015 Rm
2014 Rm
6. SEGMENT ANALYSIS (continued)
EBITDA
South Africa 13 370 12 509
Nigeria 27 504 31 620
Large opco cluster 10 944 11 439
Ghana 3 197 2 674
Cameroon 2 101 2 651
Ivory Coast 2 195 2 475
Uganda 1 775 2 074
Syria^^ 460 651
Sudan^^ 1 216 914
Small opco cluster 7 525 8 083
Major joint venture – Iran~ 5 665 4 982
Head office companies and eliminations 575 1 869
Hyperinflation impact 231 241
Tower sale profits# 8 263 7 430
Nigeria regulatory fine# (9 287) –
Iran EBITDA exclusion~ (5 665) (4 982)
EBITDA 59 125 73 191
Depreciation, amortisation and impairment of goodwill (23 797) (23 546)
Net finance cost (3 010) (3 668)
Net monetary gain 1 348 878
Share of results of joint ventures and associates after tax 1 226 4 208
Profit before tax 34 892 51 063^^ Excludes the increase in EBITDA resulting from hyperinflation accounting of: Syria R106 million (2014: R111 million), and Sudan R125 million
(2014: R130 million).~ Irancell Telecommunication Company Services (PJSC) proportionate EBITDA is included in the segment analysis as reviewed by the CODM and
excluded from IFRS reported EBITDA due to equity accounting for joint ventures and excludes the decrease in EBITDA resulting from hyperinflation accounting of R215 million (2014: R776 million increase). During the year the Iranian economy was assessed to no longer be hyperinflationary and hyperinflation accounting was discontinued effective 1 July 2015.
# Tower sale profits and the expense relating to the regulatory fine imposed by the NCC are excluded as the CODM reviews segment results on this basis.
Summary consolidated financial statements continued

MTN Group Limited Integrated Report 2015
107
SUMMARY CONSOLIDATED FINANCIAL STATEMENTS
for the year ended 31 December 2015Notes to the summary consolidated financial statements continued
2015 2014
7. EARNINGS PER ORDINARY SHARE
Number of ordinary shares in issue
At end of the year (excluding MTN Zakhele and treasury shares##) 1 822 517 914 1 822 213 500
Weighted average number of ordinary shares
Shares for earnings per share 1 822 453 695 1 831 196 131
Add: Dilutive shares
– MTN Zakhele shares issued 3 791 878 7 192 687
– Share schemes 965 612 2 865 069
Shares for dilutive earnings per share 1 827 211 185 1 841 253 887## Treasury shares of 11 844 233 (2014: 11 649 825) are held by the Group and 11 131 098 (2014: 14 492 564) shares are held by MTN Zakhele. Due
to the call option over Notional Vendor finance shares, the MTN Zakhele shares, although legally issued to MTN Zakhele, are not deemed to be issued. These shares are therefore excluded from this reconciliation.
2015Rm
2014Rm
Reconciliation between profit attributable to the equity holders of the Company and headline earnings
Profit after tax 20 204 32 079
Net (profit)/loss on disposal of property, plant and equipment and intangible assets (IAS 16 and IAS 38) (2) 69
Realisation of deferred gain (IAS 28) – (364)
Loss on disposal of investment in joint venture (IAS 28) – 15
Net impairment loss on property, plant and equipment and intangible assets (IAS 36) 38 708
Impairment of goodwill (IAS 36) 504 2 033
Realisation of deferred gain on disposal of non-current assets held for sale (IFRS 5) (30) (31)
Profit on disposal of non-current assets held for sale (IFRS 5) (8 264) (7 399)
Total tax effects of adjustments (702) (326)
Total non-controlling interest effect of adjustments 1 852 1 339
Basic headline earnings◊ 13 600 28 123
Earnings per share (cents)
– Basic 1 109 1 752
– Basic headline 746 1 536
Diluted earnings per share (cents)
– Diluted 1 106 1 742
– Diluted headline 744 1 527 ◊ Headline earnings is calculated in accordance with circular 2/2015 Headline Earnings as issued by the South African Institute of Chartered
Accountants, as required by the JSE Limited.
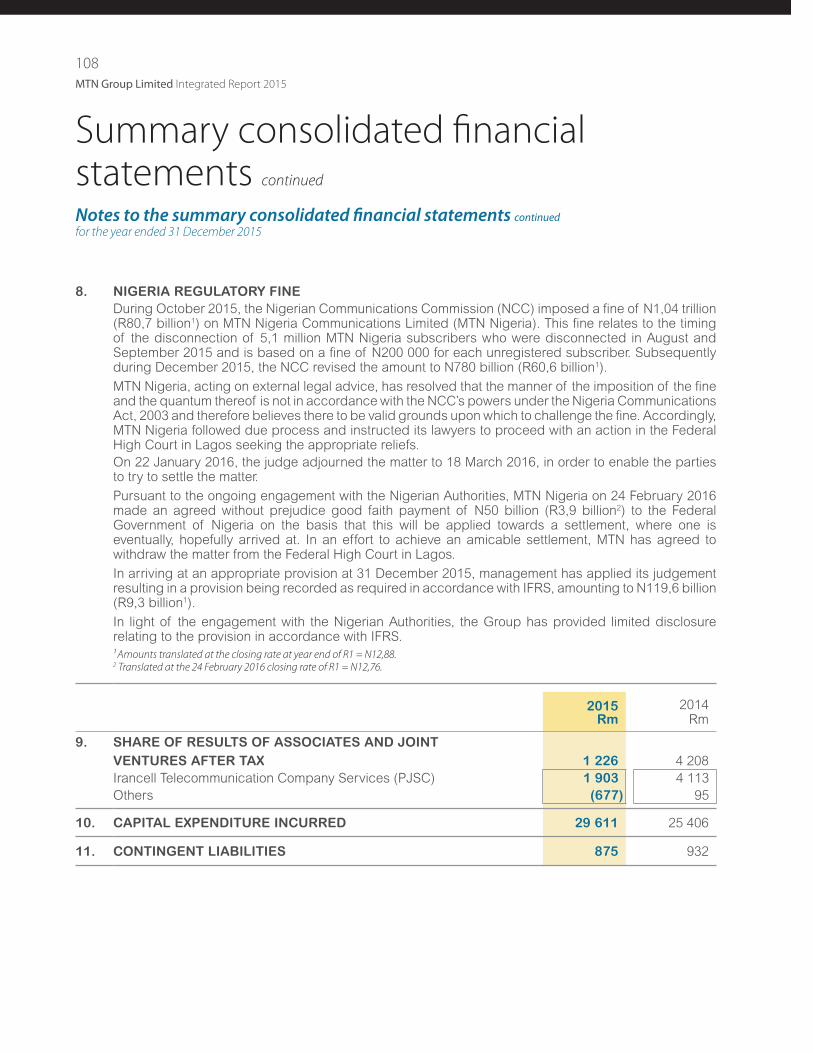
108
MTN Group Limited Integrated Report 2015
for the year ended 31 December 2015Notes to the summary consolidated financial statements continued
8. NIGERIA REGULATORY FINE
During October 2015, the Nigerian Communications Commission (NCC) imposed a fine of N1,04 trillion (R80,7 billion1) on MTN Nigeria Communications Limited (MTN Nigeria). This fine relates to the timing of the disconnection of 5,1 million MTN Nigeria subscribers who were disconnected in August and September 2015 and is based on a fine of N200 000 for each unregistered subscriber. Subsequently during December 2015, the NCC revised the amount to N780 billion (R60,6 billion1).
MTN Nigeria, acting on external legal advice, has resolved that the manner of the imposition of the fine and the quantum thereof is not in accordance with the NCC’s powers under the Nigeria Communications Act, 2003 and therefore believes there to be valid grounds upon which to challenge the fine. Accordingly, MTN Nigeria followed due process and instructed its lawyers to proceed with an action in the Federal High Court in Lagos seeking the appropriate reliefs.
On 22 January 2016, the judge adjourned the matter to 18 March 2016, in order to enable the parties to try to settle the matter.
Pursuant to the ongoing engagement with the Nigerian Authorities, MTN Nigeria on 24 February 2016 made an agreed without prejudice good faith payment of N50 billion (R3,9 billion2) to the Federal Government of Nigeria on the basis that this will be applied towards a settlement, where one is eventually, hopefully arrived at. In an effort to achieve an amicable settlement, MTN has agreed to withdraw the matter from the Federal High Court in Lagos.
In arriving at an appropriate provision at 31 December 2015, management has applied its judgement resulting in a provision being recorded as required in accordance with IFRS, amounting to N119,6 billion (R9,3 billion1).
In light of the engagement with the Nigerian Authorities, the Group has provided limited disclosure relating to the provision in accordance with IFRS.
¹ Amounts translated at the closing rate at year end of R1 = N12,88.2 Translated at the 24 February 2016 closing rate of R1 = N12,76.
2015Rm
2014Rm
9. SHARE OF RESULTS OF ASSOCIATES AND JOINT
VENTURES AFTER TAX 1 226 4 208
Irancell Telecommunication Company Services (PJSC) 1 903 4 113
Others (677) 95
10. CAPITAL EXPENDITURE INCURRED 29 611 25 406
11. CONTINGENT LIABILITIES 875 932
Summary consolidated financial statements continued
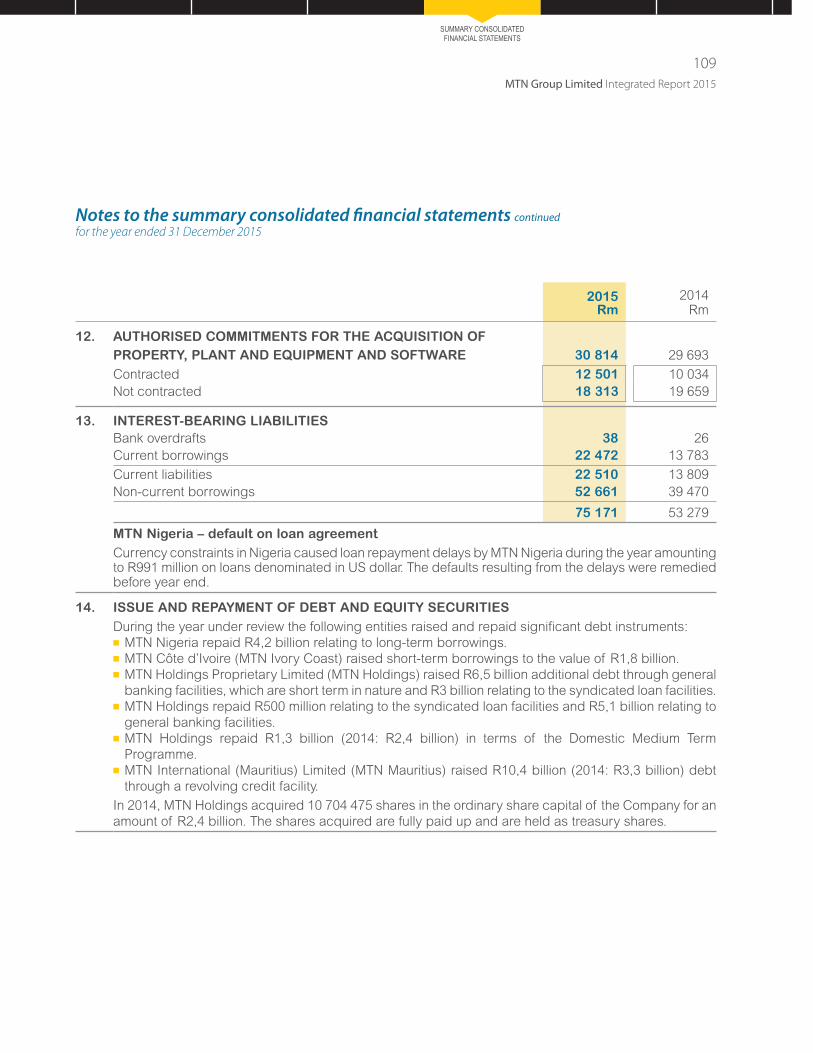
MTN Group Limited Integrated Report 2015
109
SUMMARY CONSOLIDATED FINANCIAL STATEMENTS
for the year ended 31 December 2015Notes to the summary consolidated financial statements continued
2015Rm
2014Rm
12. AUTHORISED COMMITMENTS FOR THE ACQUISITION OF
PROPERTY, PLANT AND EQUIPMENT AND SOFTWARE 30 814 29 693
Contracted 12 501 10 034
Not contracted 18 313 19 659
13. INTEREST-BEARING LIABILITIES
Bank overdrafts 38 26
Current borrowings 22 472 13 783
Current liabilities 22 510 13 809
Non-current borrowings 52 661 39 470
75 171 53 279
MTN Nigeria – default on loan agreement
Currency constraints in Nigeria caused loan repayment delays by MTN Nigeria during the year amounting to R991 million on loans denominated in US dollar. The defaults resulting from the delays were remedied before year end.
14. ISSUE AND REPAYMENT OF DEBT AND EQUITY SECURITIES
During the year under review the following entities raised and repaid significant debt instruments:
MTN Nigeria repaid R4,2 billion relating to long-term borrowings.
MTN Côte d’Ivoire (MTN Ivory Coast) raised short-term borrowings to the value of R1,8 billion.
MTN Holdings Proprietary Limited (MTN Holdings) raised R6,5 billion additional debt through general
banking facilities, which are short term in nature and R3 billion relating to the syndicated loan facilities.
MTN Holdings repaid R500 million relating to the syndicated loan facilities and R5,1 billion relating to
general banking facilities.
MTN Holdings repaid R1,3 billion (2014: R2,4 billion) in terms of the Domestic Medium Term
Programme.
MTN International (Mauritius) Limited (MTN Mauritius) raised R10,4 billion (2014: R3,3 billion) debt
through a revolving credit facility.
In 2014, MTN Holdings acquired 10 704 475 shares in the ordinary share capital of the Company for an
amount of R2,4 billion. The shares acquired are fully paid up and are held as treasury shares.

110
MTN Group Limited Integrated Report 2015
Notes to the summary consolidated financial statements continuedfor the year ended 31 December 2015
15. BUSINESS COMBINATIONS, ACQUISITION OF JOINT VENTURES AND OTHER INVESTMENTS
Nashua Mobile subscriber base, Afrihost Proprietary Limited, Middle East Internet Holdings S.A.R.L (MEIH) and Africa Internet Holding Gmbh (AIH)
The net fair value of the assets, liabilities and goodwill relating to the prior year acquisitions described in the heading above were finalised during the year and no material changes to the previously reported results were required.
Conversion of loan to Ghana Tower Interco B.V. into equity
During the year, the Group accounted for the conversion of its loan to Ghana Tower Interco B.V., a related party, into equity, amounting to R1,3 billion.
Visafone Communications Limited
On 31 December 2015, the Group acquired 100% of the share capital of Visafone Communications Limited, an ICT company, for a cash consideration of R3 432 million. As a result, the Group obtained control of Visafone Communications Limited. The acquisition will enable the Group to improve the quality of broadband services for its subscribers. The acquisition seeks to leverage resources for service enhancement and reflects the Group’s concerted efforts to deepen the growth and roll-out of broadband services across Nigeria.
The acquisition has been accounted for in accordance with IFRS 3, Business Combinations. Net identifiable assets acquired of R2 690 million (including intangible assets of R3 752 million and a deferred tax liability of R1 062 million) resulted in goodwill of R742 million determined on a provisional basis, pending completion of the final purchase price allocation.
16. NON-CURRENT ASSETS HELD FOR SALE
In 2014 the Group entered into a transaction with IHS which involved the sale of its mobile network towers in MTN Nigeria in two tranches to INT Towers Limited, a wholly owned subsidiary of Nigeria Tower Interco B.V.
The first tranche of the tower sales closed on 24 December 2014, which involved the sale of 4 154 mobile network towers by MTN Nigeria to INT Towers Limited for a cash consideration of US$451 million and the Group recognising its equity interest in Nigeria Tower Interco B.V. amounting to US$370 million. The second tranche of the tower sale closed independently on 1 July 2015 which involved the sale of 4 696 mobile network towers by MTN Nigeria to INT Towers Limited for a cash consideration of US$533 million and the Group recognising a further equity interest in Nigeria Tower Interco B.V. amounting to US$405 million.
17. EVENTS AFTER REPORTING PERIOD
Altech Autopage subscriber base
On 11 February 2016, the Group acquired its Altech Autopage subscriber base from Altron TMT Proprietary Limited for R640 million. The acquisition of the subscriber base will enable the Group to service and interact directly with its customers and will reduce future commission expenditure.
Net identifiable assets acquired of R428 million resulted in goodwill of R212 million being determined on a provisional basis, pending completion of the final purchase price allocation.
Travelstart
On 22 January 2016, the MTN Group made an investment in TravelLab Global AB (Travelstart) amounting to US$30 million. Travelstart is an online travel agency focused on emerging markets. MTN Group jointly controls Travelstart indirectly through a fund managed by its venture capital fund manager, Amadeus Capital Partners.
Summary consolidated financial statements continued

MTN Group Limited Integrated Report 2015
111
Notes to the summary consolidated financial statements continued
SUMMARY CONSOLIDATED FINANCIAL STATEMENTS
for the year ended 31 December 2015
17. EVENTS AFTER REPORTING PERIOD (continued)
Increase in investment in AIH
The Group committed a further €135 million investment in Africa Internet Holding GmbH (AIH), the ultimate parent company of Jumia. The investment forms part of a wider capital funding to AIH. The funds will enable it to leverage the significant growth of Jumia and to capitalise on the significant opportunities in Africa. This investment will increase MTN Group’s interest in the joint venture from 33,3% to 41,4%. The transaction is subject to customary closing procedures.
Facilities
During January 2016 and February 2016 additional loan facilities amounting to R14,9 billion were secured by MTN Holdings. These facilities are expected to mature in the next five years. Additionally, facilities amounting to R2,6 billion were refinanced for a further period of three to six months.
In addition, a loan amounting to R481 million payable by MTN Zambia Limited was refinanced for a further three months in January 2016.
Scancom Limited licence acquisition
During December 2015, Scancom Limited (MTN Ghana) was successful in its bid to obtain a 15-year 4G/LTE licence in the 800MHz spectrum band for an amount of US$67,5 million. Ten percent of the purchase consideration was settled before year end as part of the bidding process with the remainder settled on 27 January 2016, following which the National Communications Authority provided MTN Ghana with a provisional authorisation pending issuance of the licence.
Dividends declared
Dividends declared at the board meeting held on 2 March 2016 amounted to 830 cents per share.
18. RESTATEMENTS
18.1 Reclassification of expenses
Following a review of expenses disclosed in the Group income statement during the current financial year, the expenses detailed below have been disclosed separately or reclassified between expense categories in the comparable financial year to present the expenses in accordance with the classification applied in the current year.
Government and regulatory costs
Government and regulatory costs that had previously been included in direct network operating costs (R5 250 million) and other operating expenses (R484 million) have now been disclosed as a significant separate category of expense in the income statement.
Value-added services (VAS) costs
VAS costs amounting to R1 643 million were previously included in the costs of handsets and other accessories. Based on the underlying nature of these costs, this has now been reclassified and included in selling, distribution and marketing expenses.
18.2 Reclassification of cash used in investing activities
In line with the current year presentation, cash used in acquiring intangible assets (R3 282 million) has now been disclosed as a significant item separately from cash used in other investing activities.
APPENDIX: CONSTANT CURRENCY, HYPERINFLATION AND TOWER PROFIT
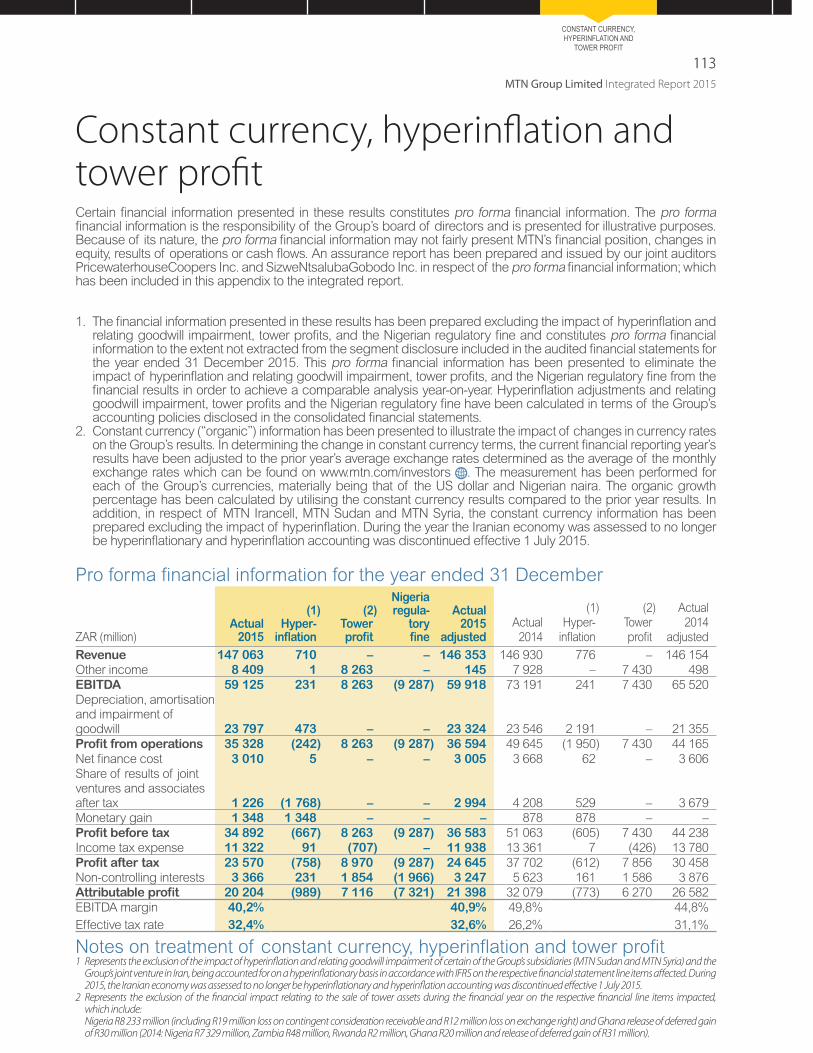
113
MTN Group Limited Integrated Report 2015
113
Constant currency, hyperinflation and tower profitCertain financial information presented in these results constitutes pro forma financial information. The pro forma financial information is the responsibility of the Group’s board of directors and is presented for illustrative purposes. Because of its nature, the pro forma financial information may not fairly present MTN’s financial position, changes in equity, results of operations or cash flows. An assurance report has been prepared and issued by our joint auditors PricewaterhouseCoopers Inc. and SizweNtsalubaGobodo Inc. in respect of the pro forma financial information; which has been included in this appendix to the integrated report.
1. The financial information presented in these results has been prepared excluding the impact of hyperinflation and relating goodwill impairment, tower profits, and the Nigerian regulatory fine and constitutes pro forma financial information to the extent not extracted from the segment disclosure included in the audited financial statements for the year ended 31 December 2015. This pro forma financial information has been presented to eliminate the impact of hyperinflation and relating goodwill impairment, tower profits, and the Nigerian regulatory fine from the financial results in order to achieve a comparable analysis year-on-year. Hyperinflation adjustments and relating goodwill impairment, tower profits and the Nigerian regulatory fine have been calculated in terms of the Group’s accounting policies disclosed in the consolidated financial statements.
2. Constant currency (“organic”) information has been presented to illustrate the impact of changes in currency rates on the Group’s results. In determining the change in constant currency terms, the current financial reporting year’s results have been adjusted to the prior year’s average exchange rates determined as the average of the monthly exchange rates which can be found on www.mtn.com/investors . The measurement has been performed for each of the Group’s currencies, materially being that of the US dollar and Nigerian naira. The organic growth percentage has been calculated by utilising the constant currency results compared to the prior year results. In addition, in respect of MTN Irancell, MTN Sudan and MTN Syria, the constant currency information has been prepared excluding the impact of hyperinflation. During the year the Iranian economy was assessed to no longer be hyperinflationary and hyperinflation accounting was discontinued effective 1 July 2015.
Pro forma financial information for the year ended 31 December
ZAR (million)Actual
2015
(1)Hyper-
inflation
(2)Tower profit
Nigeria regula-
tory fine
Actual 2015
adjusted
Actual 2014
(1)Hyper-
inflation
(2)Tower profit
Actual 2014
adjusted
Revenue 147 063 710 – – 146 353 146 930 776 – 146 154Other income 8 409 1 8 263 – 145 7 928 – 7 430 498EBITDA 59 125 231 8 263 (9 287) 59 918 73 191 241 7 430 65 520Depreciation, amortisation and impairment of goodwill 23 797 473 – – 23 324 23 546 2 191 – 21 355Profit from operations 35 328 (242) 8 263 (9 287) 36 594 49 645 (1 950) 7 430 44 165Net finance cost 3 010 5 – – 3 005 3 668 62 – 3 606Share of results of joint ventures and associates after tax 1 226 (1 768) – – 2 994 4 208 529 – 3 679Monetary gain 1 348 1 348 – – – 878 878 – – Profit before tax 34 892 (667) 8 263 (9 287) 36 583 51 063 (605) 7 430 44 238Income tax expense 11 322 91 (707) – 11 938 13 361 7 (426) 13 780Profit after tax 23 570 (758) 8 970 (9 287) 24 645 37 702 (612) 7 856 30 458Non-controlling interests 3 366 231 1 854 (1 966) 3 247 5 623 161 1 586 3 876Attributable profit 20 204 (989) 7 116 (7 321) 21 398 32 079 (773) 6 270 26 582EBITDA margin 40,2% 40,9% 49,8% 44,8%
Effective tax rate 32,4% 32,6% 26,2% 31,1%
Notes on treatment of constant currency, hyperinflation and tower profit1 Represents the exclusion of the impact of hyperinflation and relating goodwill impairment of certain of the Group’s subsidiaries (MTN Sudan and MTN Syria) and the
Group’s joint venture in Iran, being accounted for on a hyperinflationary basis in accordance with IFRS on the respective financial statement line items affected. During 2015, the Iranian economy was assessed to no longer be hyperinflationary and hyperinflation accounting was discontinued effective 1 July 2015.
2 Represents the exclusion of the financial impact relating to the sale of tower assets during the financial year on the respective financial line items impacted, which include:
Nigeria R8 233 million (including R19 million loss on contingent consideration receivable and R12 million loss on exchange right) and Ghana release of deferred gain of R30 million (2014: Nigeria R7 329 million, Zambia R48 million, Rwanda R2 million, Ghana R20 million and release of deferred gain of R31 million).
CONSTANT CURRENCY, HYPERINFLATION AND
TOWER PROFIT

114
MTN Group Limited Integrated Report 2015
The Directors
MTN Group Limited
216 – 14th Avenue
Fairland, Roodepoort
2195
IntroductionMTN Group Limited (“MTN” or “the Company”) is including the presentation of selected financial data on a
pro forma basis so as to separately present the impact of hyperinflation and relating goodwill impairment,
tower profits and the MTN Nigeria regulatory fine on the results and to present certain financial information on
a constant currency basis (collectively “the Pro Forma Financial Information”) within the Financial review and
Appendix: Constant Currency, Hyperinflation and Tower Profit sections of its integrated report for the year
ended 31 December 2015 (“the 2015 Integrated Report”).
At your request and for the purposes of the 2015 Integrated Report, we present our assurance report on the
compilation of the Pro Forma Financial Information of MTN by the directors. The Pro Forma Financial
Information, presented in the 2015 Integrated Report consists of separately presenting the impact of
hyperinflation and relating goodwill impairment, tower profits and the MTN Nigeria regulatory fine on the
results and to present selected financial data on a constant currency basis as part of the 2015 Integrated
Report under the heading Financial review and as included in Appendix: Constant Currency, Hyperinflation
and Tower Profit. The applicable criteria on the basis of which the directors have compiled the Pro Forma
Financial Information are specified in the JSE Limited (“JSE”) Listings Requirements and in Appendix: Constant
Currency, Hyperinflation and Tower Profit of the 2015 Integrated Report.
The Pro Forma Financial Information has been compiled by the directors to illustrate the impact of hyperinflation
and relating goodwill impairment, tower profits, the MTN Nigeria regulatory fine and foreign currency
movements on the Company’s reported financial performance for the year ended 31 December 2015. As part
of this process, information about the Company’s financial position and financial performance has been
extracted by the directors from the Company’s audited consolidated financial statements on which an audit
report was issued on 2 March 2016 and has been published.
Directors’ responsibilityThe directors of MTN are responsible for the compilation, contents and presentation of the Pro Forma Financial
Information on the basis of the applicable criteria specified in the JSE Listings Requirements and in Appendix:
Constant Currency, Hyperinflation and Tower Profit of the 2015 Integrated Report. The directors of MTN are
also responsible for the financial information from which it has been prepared.
Reporting accountants’ responsibilityOur responsibility is to express an opinion about whether the Pro Forma Financial Information has been
compiled, in all material respects, by the directors on the basis specified in the JSE Listings Requirements
and described in Appendix: Constant Currency, Hyperinflation and Tower Profit of the 2015 Integrated Report
based on our procedures performed. We conducted our engagement in accordance with the International
Standard on Assurance Engagements (ISAE) 3420, Assurance Engagements to Report on the Compilation of Pro Forma Financial Information Included in a Prospectus. This standard requires that we comply with ethical
requirements and plan and perform our procedures to obtain reasonable assurance about whether the
Pro Forma Financial Information has been compiled, in all material respects, on the basis specified in the
Independent reporting accountants’ assurance report on the compilation of selected financial data of MTN Group Limited (“MTN” or “the Company”) on a pro forma basis
115
JSE Listings Requirements and described in Appendix: Constant Currency, Hyperinflation and Tower Profit of
the 2015 Integrated Report.
For purposes of this engagement, we are not responsible for updating or re-issuing any reports or opinions
on any historical financial information used in compiling the Pro Forma Financial Information, nor have we, in
the course of this engagement, performed an audit or review of the financial information used in compiling the
Pro Forma Financial Information.
As the purpose of Pro Forma Financial Information included in the 2015 Integrated Report is solely to illustrate
the impact of eliminating hyperinflation and relating goodwill impairment, tower profits and the MTN Nigeria
regulatory fine from the results in order to achieve a comparable analysis year-on-year and in respect of
constant currency, to illustrate the impact of foreign currency movements on the Company’s financial
performance for the period then ended, we do not provide any assurance that the actual financial information
would have been as presented.
A reasonable assurance engagement to report on whether the Pro Forma Financial Information has been
compiled, in all material respects, on the basis of the applicable criteria involves performing procedures to
assess whether the applicable criteria used in the compilation of the Pro Forma Financial Information provides
a reasonable basis for presenting the financial performance on a pro forma basis as defined, and to obtain
sufficient appropriate evidence about whether:
the related adjustments give appropriate effect to those criteria; and
the Pro Forma Financial Information reflects the proper application of those adjustments to the unadjusted
financial information.
Our procedures selected depend on our judgement, having regard to our understanding of the nature of the
Company, the illustrative purpose in respect of which the Pro Forma Financial Information has been compiled,
and other relevant engagement circumstances.
Our engagement also involves evaluating the overall presentation of the Pro Forma Financial Information.
We believe that the evidence we have obtained is sufficient and appropriate to provide a basis for our opinion.
OpinionIn our opinion, the Pro Forma Financial Information has been compiled, in all material respects, on the basis
of the applicable criteria specified by the JSE Listings Requirements and described in Appendix: Constant
Currency, Hyperinflation and Tower Profit of the 2015 Integrated Report.
PricewaterhouseCoopers Inc. SizweNtsalubaGobodo Inc.
Director: JR van Huyssteen Director: SY Lockhat
Registered Auditor Registered Auditor
Johannesburg Johannesburg
2 March 2016 2 March 2016
MTN Group Limited Integrated Report 2015
115
CONSTANT CURRENCY, HYPERINFLATION AND
TOWER PROFIT

NON-FINANCIAL DATA, INDEPENDENT ASSURANCE REPORT AND SHAREHOLDER INFORMATION
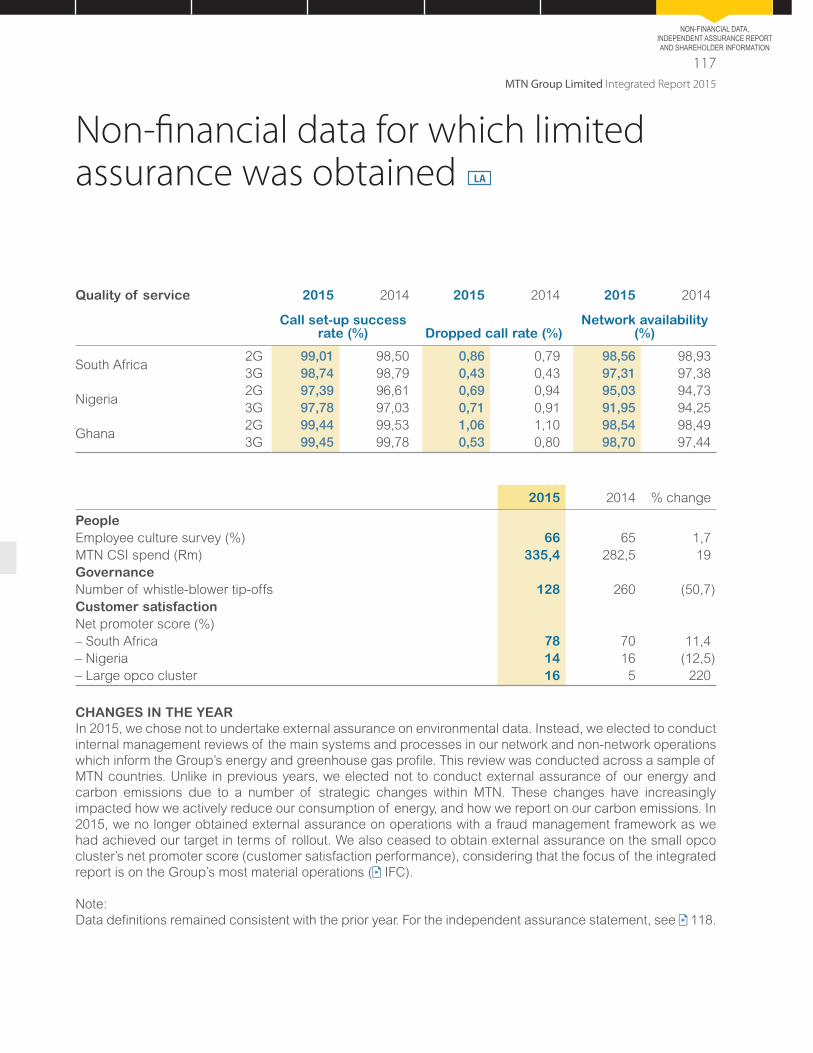
MTN Group Limited Integrated Report 2015
117
Non-financial data for which limited assurance was obtained LA
Quality of service 2015 2014 2015 2014 2015 2014
Call set-up success rate (%) Dropped call rate (%)
Network availability (%)
South Africa2G 99,01 98,50 0,86 0,79 98,56 98,93
3G 98,74 98,79 0,43 0,43 97,31 97,38
Nigeria2G 97,39 96,61 0,69 0,94 95,03 94,73
3G 97,78 97,03 0,71 0,91 91,95 94,25
Ghana2G 99,44 99,53 1,06 1,10 98,54 98,49
3G 99,45 99,78 0,53 0,80 98,70 97,44
2015 2014 % change
People
Employee culture survey (%) 66 65 1,7
MTN CSI spend (Rm) 335,4 282,5 19
Governance
Number of whistle-blower tip-offs 128 260 (50,7)
Customer satisfaction
Net promoter score (%)
– South Africa 78 70 11,4
– Nigeria 14 16 (12,5)
– Large opco cluster 16 5 220
CHANGES IN THE YEAR
In 2015, we chose not to undertake external assurance on environmental data. Instead, we elected to conduct
internal management reviews of the main systems and processes in our network and non-network operations
which inform the Group’s energy and greenhouse gas profile. This review was conducted across a sample of
MTN countries. Unlike in previous years, we elected not to conduct external assurance of our energy and
carbon emissions due to a number of strategic changes within MTN. These changes have increasingly
impacted how we actively reduce our consumption of energy, and how we report on our carbon emissions. In
2015, we no longer obtained external assurance on operations with a fraud management framework as we
had achieved our target in terms of rollout. We also ceased to obtain external assurance on the small opco
cluster’s net promoter score (customer satisfaction performance), considering that the focus of the integrated
report is on the Group’s most material operations ( IFC).
Note:
Data definitions remained consistent with the prior year. For the independent assurance statement, see 118.
NON-FINANCIAL DATA, INDEPENDENT ASSURANCE REPORT AND SHAREHOLDER INFORMATION

118
MTN Group Limited Integrated Report 2015
Independent assurance report to the directors of MTN Group Limited We have been engaged by the directors of MTN Group Limited (MTN or the Company) to perform an independent limited assurance engagement in respect of Selected Sustainability Information reported in the Company’s integrated annual report for the year ended 31 December 2015 (the report). This report is produced in accordance with the terms of our contract with the Company dated 16 November 2015.
INDEPENDENCE, QUALITY CONTROL AND EXPERTISEWe have complied with the independence and other requirements of the Code of Professional Conduct for Registered Auditors issued by the Independent Regulatory Board for Auditors, which is founded on fundamental principles of integrity, objectivity, professional competence and due care, confidentiality and professional behaviour.The firm applies International Standard on Quality Control 1 and, accordingly, maintains a comprehensive system of quality control including documented policies and procedures regarding compliance with ethical requirements, professional standards and applicable legal and regulatory requirements.
Our engagement was conducted by a multidisciplinary team of health, safety, environmental and assurance specialists with extensive experience in sustainability reporting.
SCOPE AND SUBJECT MATTERThe subject matter of our engagement and the related level of assurance that we are required to provide are as follows:
Limited assuranceThe following Selected Sustainability Information in the report was selected for an expression of limited assurance:
1. Quality of service: network availability %; call setup success rate %; dropped call rate % a. MTN South Africa b. MTN Nigeria c. MTN Ghana 2. Group MTN Foundation CSI spend: ZAR 3. Group employee culture survey result: overall performance % 4. Group whistle-blower hotline data: number of fraud incidents reported and reviewed 5. Net promoter score a. MTN South Africa b. MTN Nigeria c. Large opco cluster
We refer to this information as the “Selected Sustainability Information for Limited Assurance”.
We have carried out work on the data reported for 31 December 2015 only and have not performed any procedures with respect to earlier periods except where specifically indicated, or any other elements included in the integrated report 2015 and, therefore, do not express any conclusion thereon. We have not performed work in respect of future projections and targets.
RESPECTIVE RESPONSIBILITIES OF THE DIRECTORS AND PRICEWATERHOUSECOOPERS INC.MTN’s directors are responsible for selection, preparation and presentation of the Selected Sustainability Information for Limited Assurance in accordance with MTN’s internally defined procedures set out on MTN’s website
www.mtn.com/Investors/FinancialReporting/Pages/IntegratedReports.aspx, and for the development of the reporting criteria. The directors are also responsible for designing, implementing and maintaining of internal controls as the directors determine is necessary to enable the preparation of the Selected Sustainability Information for Limited Assurance that are free from material misstatements, whether due to fraud or error.
Our responsibility is to form an independent conclusion, based on our limited assurance procedures, on whether anything has come to our attention to indicate that Selected Sustainability Information has not been prepared, in all material respects, in accordance with the reporting criteria.
This report, including the conclusion, has been prepared solely for the directors of the Company as a body, to assist the directors in reporting on the Company’s sustainable development performance and activities. We permit the disclosure of this report within the report for the year ended 31 December 2015, to enable the directors to demonstrate they have discharged their governance responsibilities by commissioning an independent assurance report in connection with the report. To the fullest extent permitted by law, we do not accept or assume responsibility to anyone other than the directors as a body and the Company for our work or this report save where terms are expressly agreed and with our prior consent in writing.
ASSURANCE WORK PERFORMEDWe conducted our limited assurance engagement in accordance with International Standard on Assurance Engagements 3000: Assurance Engagements other than Audits and Reviews of Historical Financial Information
118
MTN Group Limited Integrated Report 2015

for the year ended 31 DecemberNotes to the summary consolidated financial statements continuedcomply with ethical requirements and that we plan and perform the assurance engagement to obtain limited assurance on the Selected Sustainability Information as per the terms of our engagement.
Our work included examination, on a test basis, of evidence relevant to the Selected Sustainability Information for Limited Assurance. It also included an assessment of the significant estimates and judgements made by the directors in the preparation of the Selected Sustainability Information for Limited Assurance. We planned and performed our work so as to obtain all the information and explanations that we considered necessary in order to provide us with sufficient evidence on which to base our conclusion in respect of the Selected Sustainability Information for Limited Assurance.
Our limited assurance procedures primarily comprised:Reviewing the processes that MTN has in place for determining the Subject Matter for Limited Assurance included in the report;Obtaining an understanding of the systems used to generate, aggregate and report the subject matter selected for limited assurance; Conducting interviews with management at corporate head office;Evaluating the data generation and reporting processes against the reporting criteria;Performing key controls testing and testing the accuracy of the data reported on a sample basis at a minimum of three opcos material to Group reporting data for the subject matter selected for limited assurance;Reviewing the consistency between the subject matter selected for limited assurance and the related statements in MTN’s report.
A limited assurance engagement is substantially less in scope than a reasonable assurance engagement under ISAE 3000. Consequently, the nature, timing and extent of procedures for gathering sufficient appropriate evidence are deliberately limited relative to a reasonable assurance engagement, and therefore less assurance is obtained with a limited assurance engagement than for a reasonable assurance engagement.
The procedures selected depend on our judgement, including the assessment of the risk of material misstatement of the Selected Sustainability Information, whether due to fraud or error. In making those risk assessments, we consider internal control relevant to the Company’s preparation of the Selected Sustainability Information in order to design procedures that are appropriate in the circumstances.
We believe that the evidence we have obtained is sufficient and appropriate to provide a basis for our conclusion.
INHERENT LIMITATIONSNon-financial performance information is subject to more inherent limitations than financial information, given the characteristics of the subject matter and the methods used for determining, calculating, sampling and estimating such information. The absence of a significant body of established practice on which to draw allows for the selection of different but acceptable measurement techniques which can result in materially different measurements and can impact comparability. Qualitative interpretations of relevance, materiality and the accuracy of data are subject to individual assumptions and judgements. The precision of different measurement techniques may also vary. Furthermore, the nature and methods used to determine such information, as well as the measurement criteria and the precision thereof, may change over time. It is important to read the report in the context of the reporting criteria.
In particular, where the information relies on factors and methodologies derived by independent third parties, our assurance work has not included examination of the derivation of those factors and other third-party information.
CONCLUSIONBased on the results of our limited assurance procedures nothing has come to our attention that causes us to believe that the Selected Sustainability Information for the year ended 31 December 2015, has not been prepared, in all material respects, in accordance with the reporting criteria.
OTHER MATTERThe maintenance and integrity of MTN’s website is the responsibility of MTN’s management. Our procedures did not involve consideration of these matters and, accordingly we accept no responsibility for any changes to either the information in the report or our independent assurance report that may have occurred since the initial date of presentation on the MTN website.
PricewaterhouseCoopers Inc.Director: Jayne MammattRegistered AuditorJohannesburg
p
P i h C I
119
MTN Group Limited Integrated Report 2015
NON-FINANCIAL DATA, INDEPENDENT ASSURANCE REPORT AND SHAREHOLDER INFORMATION

120
MTN Group Limited Integrated Report 2015
Stock exchange performance
MTN market-related metrics for the year ended 31 December 2015 2014
Closing price (c) 13 289 22 141
Highest price (c) 24 602 26 010
Lowest price (c) 12 550 19 282
Total volume of shares traded 1 611 100 564 1 206 689 986
Total value of shares traded (Rm) 306 175 269 439
Number of shares in issue 1 845 493 245 1 848 355 889
Number of shares traded as a percentage of shares in issue (%) 87,3 65,3
Number of transactions (as per JSE) 2 209 726 1 757 177
Average weighted trading price (cents per share) (one-year VWAP) 19 004,10 22 328,80
Average telecommunication index (close) 9 823,29 10 672,84
Average industrial index (close) 44 933,65 45 103,22
Average mobile index (close) 326,74 361,99
Dividend yield (%) 9,6320 5,0133
Earnings yield (%) (basic headline earnings) 5,365 6,567
Price-earnings multiple (basic headline earnings) 18,64 14,41
Market capitalisation (Rm) 245 248 409 244 Source: INet and Bloomberg.
Shareholders’ diary
Annual general meeting 25 May 2016
Final dividend declaration 2 March 2016
Summarised annual financial results published 3 March 2016
Annual financial statements posted April 2016
Half-year-end 30 June 2016
Interim dividend declaration August 2016
Interim financial statements published August 2016
Financial year-end 31 December 2016
Please note that these dates are subject to alteration.
Forward looking information
Opinions and forward looking statements expressed in this report represent those of the Company at the time. Undue reliance should not be placed on such statements and opinions because by nature, they are subjective to known and unknown risk and uncertainties and can be affected by other factors that could cause actual results and Company plans and objectives to differ materially from those expressed or implied in the forward looking statements.
Neither the Company nor any of its respective affiliates, advisers or representatives shall have any liability whatsoever (based on negligence or otherwise) for any loss howsoever arising from any use of this report or its contents or otherwise arising in connection with this presentation and do not undertake to publicly update or revise any of its opinions or forward looking statements whether to reflect new information or future events or circumstances otherwise.

BASTION GRAPHICS
Administration
Registration number: 1994/009584/06
ISIN: ZAE000042164
JSE share code: MTN
Board of directors
PF Nhleko1
BD Goschen1
A Harper3#
KP Kalyan3
S Kheradpir3+++
NP Mageza3
MLD Marole3
AT Mikati2†
MJN Njeke3
KC Ramon3
JHN Strydom2
AF van Biljon3
J van Rooyen3
† Lebanese# British+++ American 1 Executive2 Non-executive3 Independent non-executive
Group secretary
SB Mtshali
Private Bag X9955, Cresta, 2118
Registered office
216 – 14th Avenue, Fairland, 2195
American Depository Receipt (ADR)
Programme:
Cusip No. 62474M108 ADR to ordinary Share 1:1
Depository
The Bank of New York
101 Barclay Street, New York NY, 10286, USA
MTN Group sharecare line
Toll free: 0800 202 360 or +27 11 870 8206
if phoning from outside South Africa
Office of the transfer secretaries
Computershare Investor Services Proprietary Limited
Registration number: 2004/003647/07
70 Marshall Street, Marshalltown
Johannesburg, 2001
PO Box 61051, Marshalltown, 2107
Joint auditors
PricewaterhouseCoopers Inc.
2 Eglin Road, Sunninghill, 2157
Private Bag X36, Sunninghill, 2157
SizweNtsalubaGobodo Inc.
20 Morris Street East
Woodmead, 2157
PO Box 2939, Saxonwold, 2132
Sponsor
Deutsche Securities (SA) Proprietary Limited
3 Exchange Square, 87 Maude Street, Sandton, 2196
Attorneys
Webber Wentzel
10 Fricker Road, Illovo Boulevard, Sandton, 2107
PO Box 61771, Marshalltown, 2107
Contact details
Telephone: National (011) 912 3000
International +27 11 912 3000
Facsimile: National (011) 912 4093
International +27 11 912 4093
Email: [email protected]
Internet: http:/www.mtn.com

www.mtn.com
Tel: +27 11 912 3000
Innovation Centre
216 14th Avenue
Fairland
South Africa