MTM E14B25, E14B35 TECHNICAL REPORT ON THE EL CHATO ...
77
Technical Report on the El Chato Property MTM E14B25, E14B35 TECHNICAL REPORT ON THE EL CHATO PROPERTY PUEBLA, MEXICO Prepared For: Almadex Minerals Limited 210 – 1333 Johnston St. Vancouver, BC, Canada V6H 3R9 Prepared by: APEX Geoscience Ltd. 410 - 800 West Pender St. Vancouver, BC, Canada V6C 2V6 Kristopher J. Raffle, B.Sc., P. Geo. Report Effective Date: April 6 th , 2018 Vancouver, British Columbia, Canada
Transcript of MTM E14B25, E14B35 TECHNICAL REPORT ON THE EL CHATO ...
Technical Report on the El Chato Property
MTM E14B25, E14B35 TECHNICAL REPORT ON THE EL CHATO PROPERTY
PUEBLA, MEXICO
Prepared For: Almadex Minerals Limited
210 – 1333 Johnston St. Vancouver, BC, Canada
V6H 3R9
Prepared by:
APEX Geoscience Ltd. 410 - 800 West Pender St. Vancouver, BC, Canada
V6C 2V6
Kristopher J. Raffle, B.Sc., P. Geo.
Report Effective Date: April 6th, 2018 Vancouver, British Columbia, Canada
Technical Report on the El Chato Property
1
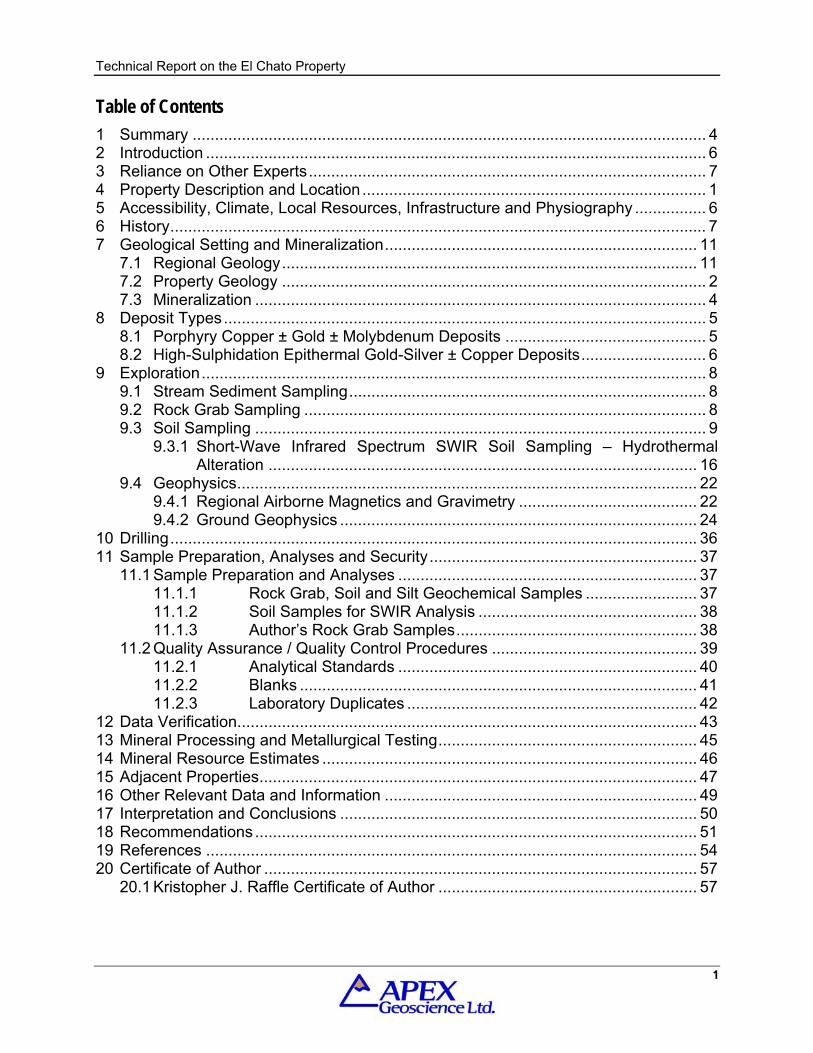
Table of Contents
1 Summary ................................................................................................................... 4 2 Introduction ................................................................................................................ 6 3 Reliance on Other Experts ......................................................................................... 7 4 Property Description and Location ............................................................................. 1 5 Accessibility, Climate, Local Resources, Infrastructure and Physiography ................ 6 6 History ........................................................................................................................ 7 7 Geological Setting and Mineralization ...................................................................... 11
7.1 Regional Geology ............................................................................................. 11 7.2 Property Geology ............................................................................................... 2 7.3 Mineralization ..................................................................................................... 4
8 Deposit Types ............................................................................................................ 5 8.1 Porphyry Copper ± Gold ± Molybdenum Deposits ............................................. 5 8.2 High-Sulphidation Epithermal Gold-Silver ± Copper Deposits ............................ 6
9 Exploration ................................................................................................................. 8 9.1 Stream Sediment Sampling ................................................................................ 8 9.2 Rock Grab Sampling .......................................................................................... 8 9.3 Soil Sampling ..................................................................................................... 9
9.3.1 Short-Wave Infrared Spectrum SWIR Soil Sampling – Hydrothermal Alteration ................................................................................................ 16
9.4 Geophysics ....................................................................................................... 22 9.4.1 Regional Airborne Magnetics and Gravimetry ........................................ 22 9.4.2 Ground Geophysics ................................................................................ 24
10 Drilling ...................................................................................................................... 36 11 Sample Preparation, Analyses and Security ............................................................ 37
11.1 Sample Preparation and Analyses ................................................................... 37 11.1.1 Rock Grab, Soil and Silt Geochemical Samples ......................... 37 11.1.2 Soil Samples for SWIR Analysis ................................................. 38 11.1.3 Author’s Rock Grab Samples ...................................................... 38
11.2 Quality Assurance / Quality Control Procedures .............................................. 39 11.2.1 Analytical Standards ................................................................... 40 11.2.2 Blanks ......................................................................................... 41 11.2.3 Laboratory Duplicates ................................................................. 42
12 Data Verification....................................................................................................... 43 13 Mineral Processing and Metallurgical Testing .......................................................... 45 14 Mineral Resource Estimates .................................................................................... 46 15 Adjacent Properties .................................................................................................. 47 16 Other Relevant Data and Information ...................................................................... 49 17 Interpretation and Conclusions ................................................................................ 50 18 Recommendations ................................................................................................... 51 19 References .............................................................................................................. 54 20 Certificate of Author ................................................................................................. 57
20.1 Kristopher J. Raffle Certificate of Author .......................................................... 57
Technical Report on the El Chato Property
2
List of Tables
TABLE 4-1. EL CHATO PROPERTY MINING CLAIM .................................................................. 1 TABLE 4-2. MINING CONCESSION MINIMUM EXPENDITURE / PRODUCTION VALUE
REQUIREMENTS(CHAPTER 2, ARTICLE 59, MEXICAN LAW REGULATION 2012) ........ 4 TABLE 9-1. EL CHATO CORRELATION MATRIX FOR SELECTED ELEMENTS FOR ROCK
SAMPLES. ............................................................................................................................ 9 TABLE 9-2. EL CHATO 2012 – 2017 SOIL GEOCHEMICAL SAMPLING SUMMARY
STATISTICS ....................................................................................................................... 10 TABLE 9-3. EL CHATO HISTORICAL GROUND GEOPHYSICAL SURVEYS .......................... 24 TABLE 11.1. PERFORMANCE OF STANDARDS INSERTED BY THE AUTHOR .................... 40 TABLE 12-1. AUTHORS ROCK GRAB SAMPLE ASSAYS ....................................................... 44 TABLE 16-1. PROPOSED 2015 DRILLING BUDGET FOR EL CHATO .................................... 52
List of Figures
TABLE 4-1. EL CHATO PROPERTY MINING CLAIM .................................................................. 1 FIGURE 4-1. EL CHATO PROPERTY LOCATION ...................................................................... 2 FIGURE 4-2. EL CHATO PROPERTY MINING CLAIM................................................................ 3 FIGURE 6-1. EL CHATO PROPERTY HISTORICAL SHOWINGS .............................................. 9 FIGURE 6-2. EL CHATO PROPERTY ASTER HYDROXYL ALTERATION .............................. 10 FIGURE 7-1. REGIONAL GEOLOGY (INEGI COMPILATION) .................................................... 1 FIGURE 7-2. EL CHATO PROPERTY GEOLOGY ...................................................................... 3 FIGURE 8-1. TELESCOPED PORPHYRY COPPER SYSTEM. .................................................. 5 FIGURE 9-1. EL CHATO SOIL AND ROCK GEOCHEMISTRY – GOLD ................................... 11 FIGURE 9-2. EL CHATO SOIL, STREAM AND ROCK GEOCHEMISTRY - SILVER ................ 12 FIGURE 9-3. EL CHATO SOIL, STREAM AND ROCK GEOCHEMISTRY - COPPER .............. 13 FIGURE 9-3. EL CHATO SOIL, STREAM AND ROCK GEOCHEMISTRY – ARSENIC ............ 14 FIGURE 9-4. EL CHATO SOIL, STREAM AND ROCK GEOCHEMISTRY - MOLYBDENUM ... 15 FIGURE 9-5. SIMPLIFIED REPRESENTATION OF A ZONED ALTERATION PATTERN IN
PORPHYRY-EPITHERMAL SYSTEMS, USED DURING INTERPRETATION OF TERRASPEC® DATA TO PREDICT THE VECTORS TO THE LOCATION OF PORPHYRY AND EPITHERMAL ORE DEPOSITS (HARRISON, 2013). .......................... 18
FIGURE 9-6. EL CHATO SWIR SOIL SAMPLE DISTRIBUTION, SIMPLIFIED ALTERATION CONTOURS, ASTER HYDROXYL IMAGERY. .................................................................. 19
FIGURE 9-7. EL CHATO, SOUTHWEST RIDGES. SWIR SOIL SAMPLE DETAILED ALTERATION CONTOURS AND WHITE MICA CRYSTALLINITY. ................................... 20
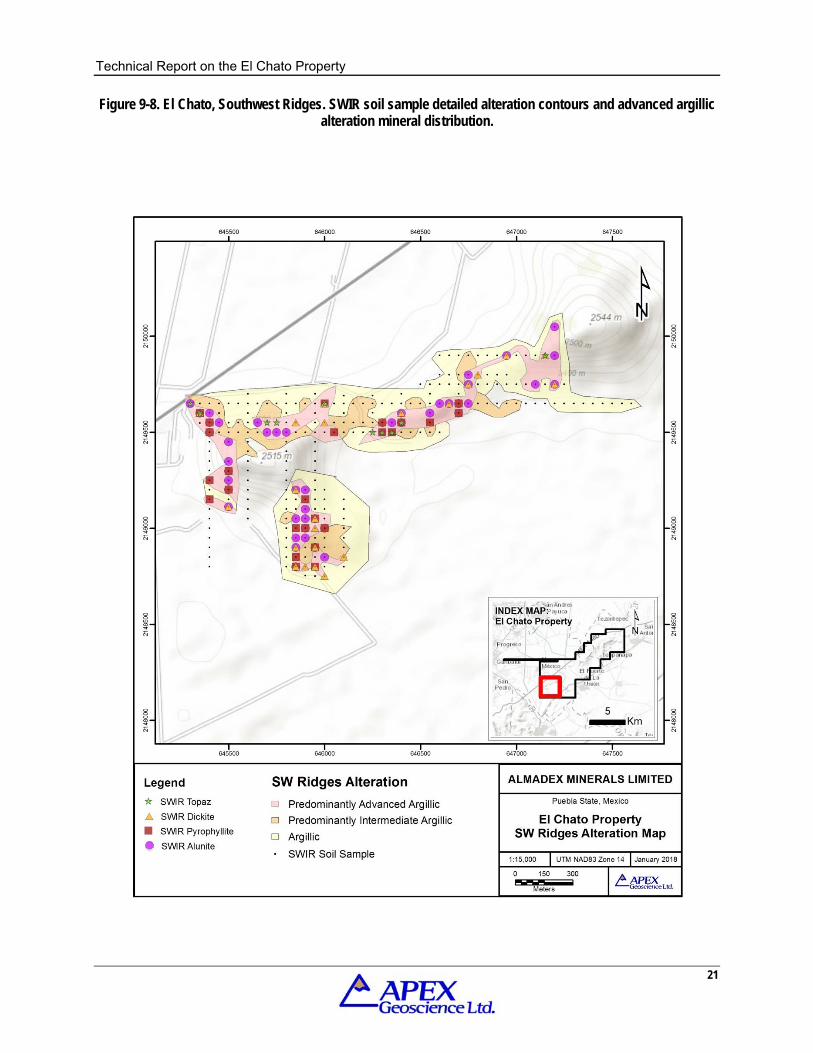
FIGURE 9-8. EL CHATO, SOUTHWEST RIDGES. SWIR SOIL SAMPLE DETAILED ALTERATION CONTOURS AND ADVANCED ARGILLIC ALTERATION MINERAL DISTRIBUTION. .................................................................................................................. 21
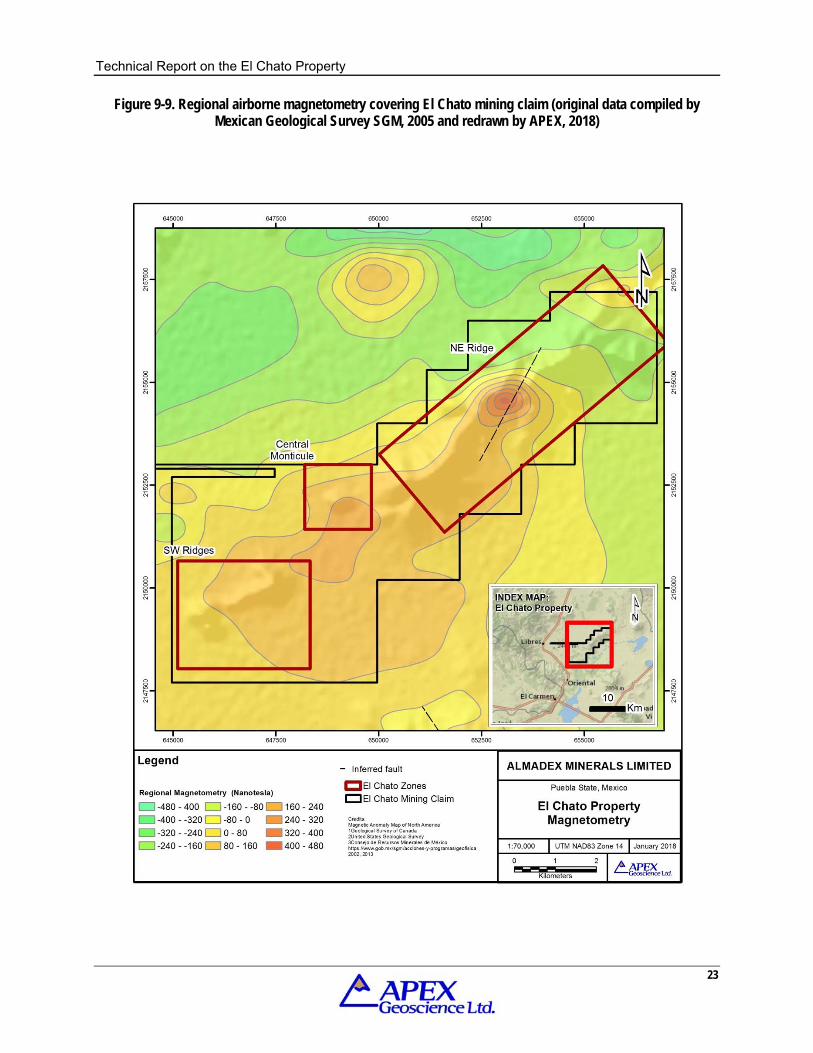
FIGURE 9-9. REGIONAL AIRBORNE MAGNETOMETRY COVERING EL CHATO MINING CLAIM (ORIGINAL DATA COMPILED BY MEXICAN GEOLOGICAL SURVEY SGM, 2005 AND REDRAWN BY APEX, 2018) ..................................................................................... 23
FIGURE 9-10. EL CHATO GEOPHYSICAL SURVEY LOCATION (IP) ...................................... 26 FIGURE 9-11. EL CHATO NORTHEAST RIDGE GEOPHYSICAL SURVEY (IP
CHARGEABILITY-RESISTIVITY) AT 2,450 M ASL ............................................................ 27 FIGURE 9-12. EL CHATO NORTHEAST RIDGE GEOPHYSICAL SURVEY (IP
CHARGEABILITY-RESISTIVITY) AT 2,010 M ASL ............................................................ 28 FIGURE 9-13. EL CHATO NORTHEAST RIDGE GEOPHYSICAL SURVEY (IP
CHARGEABILITY-RESISTIVITY) VERTICAL CROSS SECTION FOR EAST-WEST SURVEY LN5200N, LOOKING NORTH. ............................................................................ 29
Technical Report on the El Chato Property
3
FIGURE 9-14. EL CHATO NORTHEAST RIDGE GEOPHYSICAL SURVEY (IP CHARGEABILITY-RESISTIVITY) VERTICAL CROSS SECTION NORTH-SOUTH SURVEY LN53000E, LOOKING WEST. ............................................................................. 30
FIGURE 9-15. EL CHATO SOUTHWEST RIDGES GEOPHYSICAL SURVEY (IP CHARGEABILITY-RESISTIVITY) AT 2,250 M ASL ............................................................ 31
FIGURE 9-16. EL CHATO SOUTHWEST RIDGES GEOPHYSICAL SURVEY (IP CHARGEABILITY-RESISTIVITY) AT 2110 M ASL ............................................................. 32
FIGURE 9-17. EL CHATO CENTRAL MONTICULE GEOPHYSICAL SURVEY (IP CHARGEABILITY-RESISTIVITY), VERTICAL CROSS SECTION NORTH-SOUTH SURVEY LOOKING WEST LN49100 ................................................................................. 33
FIGURE 9-18. EL CHATO SOUTHWEST RIDGES GEOPHYSICAL SURVEY (IP CHARGEABILITY-RESISTIVITY), VERTICAL CROSS SECTION NORTH-SOUTH SURVEY LOOKING WEST LN47300 ................................................................................. 34
FIGURE 9-19. EL CHATO SOUTHWEST RIDGES GEOPHYSICAL SURVEY (IP CHARGEABILITY-RESISTIVITY), VERTICAL CROSS SECTION NORTH-SOUTH SURVEY LOOKING WEST LN46100 ................................................................................. 35
FIGURE 11-1. SWIR SAMPLE DATA. ILLITE SPECTRUM. TOP: ALTERED RHYOLITE. BOTTOM: SWIR SPECTRUM COMPARED TO ILLITE SPECTRUM BY MEANS OF SPECMIN-PRO ASD DATABASE. ..................................................................................... 39
FIGURE 11-1. QA/QC BLANKS ................................................................................................. 41 FIGURE 11-2. QA/QC DUPLICATES ......................................................................................... 42 FIGURE 15-1. ADJACENT PROPERTIES. ................................................................................ 48 FIGURE 18-1. EL CHATO PROPOSED 2018 DRILL HOLES.................................................... 53
Technical Report on the El Chato Property
4
1 Summary
This Technical Report (the “Report”) is written for the El Chato property (the “Property” or “El Chato”), which is held 100 percent (%) by Minera Gavilán S.A. de C.V. (“Minera Gavilán”), a wholly owned subsidiary of Almadex Minerals Limited (“Almadex”). On May 15, 2015, Almaden transferred its interest in Minera Gavilán to Almadex. The Property has a total area of 5,332 hectares (“ha”) and is located in Puebla State, 10 kilometres (“km”) east of Libres Town, 70 km northeast of Puebla city, 165 km east of Mexico City and 160 km northwest-west of Veracruz City. During 2017, Almadex retained APEX Geoscience Ltd. (“APEX”) to complete an independent Canadian National Instrument 43-101 (“NI 43-101”) Technical Report specific to the Property.
The author of the Report, Mr. Kristopher J. Raffle, P.Geo., principal of APEX and an independent Qualified Person as defined by NI 43-101, conducted property visits on September 23rd and 24th, 2012, and September 19th, 2017.
Following defined zones of interest associated with intrusive centers along the Trans-Mexican Volcanic Belt (“TMVB”) by M. Poliquin and the team of Almaden, Almaden staked several areas along the TMVB including the Property. The project covers a large area of hydrothermal alteration interpreted to represent an eroded lithocap to a porphyry system. Almaden, Almadex and partners completed field work programs on the El Chato project between 2011 and 2017. These field work programs included stream sediment, soil geochemistry and short-wave infrared spectrometry (“SWIR”) surveys as well as collection of a significant number of rock/grab samples with associated geological mapping. In addition, surface induced polarization (“IP”) / resistivity geophysical survey was carried out in strategic zones. These surveys identified three areas of interest: the Northeast Ridge (the “Northeast Ridge”), the Central Monticule and the Southwest Ridges (the “Southwest Ridges”).
The Northeast Ridge exhibits multi-element copper-gold-silver/base metal anomalies in coincidence with argillic, carbonate and propylitic alterations. The highest copper value in the Northeast Ridge corresponds to a selective vein sample of an oxidized copper bearing vein which yielded 21% copper. Geophysical anomalies in this area are highlighted by zones of high chargeability at depth. These anomalies are coincident with regional magnetometry anomalies.
The Central Monticule exhibits copper-silver geochemical anomalies in coincidence with felsic intrusives cropping out in this zone. Geophysical anomalies outlined by dome like zones of high chargeability were also determined.
The Southwest Ridges exhibit extensive advanced argillic alteration, typical of high sulphidation epithermal deposits in coincidence with arsenic, bismuth molybdenum and antimony geochemical anomalies. The geophysical inversion model for this zone outlines areas of high chargeability and contrasting low/high IP resistivity geophysical anomalies up to 200 m below surface.
Technical Report on the El Chato Property
5
Given the geochemical characteristics as well as coincident alteration pattern and geophysical anomalies, the Northeast Ridge and the Central Monticule anomalies are considered representative of shallow porphyry environments while the Southwest Ridges anomaly is considered representative of shallower epithermal high-sulphidation environments. All these anomalies remain untested by diamond drilling.
Exploration activities conducted by Almadex in the project area have been limited to geologic mapping, surface geochemical, and geophysical surveys. As of the effective date of this report, no mining operations have been carried out by Almadex in the Property and no mineral resources have been defined. Further studies are required in order to determine whether or not mineralization in the project is of economic significance. There can be no guarantee that further exploration will results in the discovery or definition of mineral resources of any category.
Thus, it is recommended to carry out follow-up soil sampling programs as well as a two-phased drilling program in the upcoming year. These programs should include but not be limited to:
Soil sampling program at the Northeast Ridge for SWIR and geochemistry analysis parallel to current lines for following up anomalies preliminarily defined. Three lines are proposed with a sample spacing of 50 m. The estimated number of samples is 220 samples, at $50.00 per soil sample (all-up) for a total cost of $11,000.00.
Soil sampling infill programs at the Southwest Ridges for SWIR and geochemistry analysis within areas anomalous in arsenic and coincident with advanced argillic hydrothermal alteration. Surveys of 25 m x 25 m grids and extension of the current soil grid in the Southwest Ridges to 200-300 m northeast are recommended. The estimated amount of soil samples is 500, at $50.00 per soil sample (all-up) for a total cost of $25,000.00.
Diamond drilling of approximately 14 holes totalling 7,000 m designed to test copper bearing/multi-element soil/rock geochemical anomalies at the Northeast Ridge and the Central Monticules as well as combined IP chargeability plus alteration features and arsenic-bismuth anomalies in the Southwest Ridges. Drilling should be carried out in two phases. The phase 2 exploration is contingent on the results of phase 1 exploration. Phase 1 drilling should include diamond drilling of an initial 8 holes totalling 4,000 m followed by phase 2 drilling of an additional 6 holes totalling 3,000 m. The estimated cost to complete phase 1 and phase 2 drilling is $770,000.00.
Thus, the total budget proposed for the exploration program in 2018 at the Property is $795,000.00 (all-up).
Technical Report on the El Chato Property
6
2 Introduction
The Report was prepared to provide an independent NI 43-101 Technical Report for the Property, which is held 100% by Minera Gavilán, a wholly owned subsidiary of Almadex. The Property covers a total area of 5,332 ha, and is located in Puebla State, Mexico, approximately 70 km northeast of the city of Puebla, 165 km east of Mexico City, and 160 km north-northwest of Veracruz City.
The Report was prepared by APEX at the request of Almadex. Almadex is a publicly listed mining company trading under the symbol “AMZ” on the TSX Venture Exchange, with its head office located in Vancouver, British Columbia.
The author of the Report, Mr. Kristopher J. Raffle, P.Geo., principal and consultant of APEX and a Qualified Person as defined by NI 43-101, conducted property visits on September 23rd and 24th, 2012, and September 19th, 2017. Mr. Raffle collected independent verification samples during both site visits. In addition to the site visits, Mr. Raffle completed a review of the available literature and documented results relevant to the Property.
The Report is written in accordance with the requirements of form NI 43-101F1 of the British Columbia Securities Commission and the Canadian Securities Administrators, and is a technical summary of the available geological, geophysical, and geochemical data relevant to the Property.
The author, in writing the Report, used sources of information as listed in Section 19 “References”. Government reports were prepared by Qualified Persons holding post-secondary geology, or related university degree(s), and are therefore deemed to be accurate. For those reports which were written by others, who are not Qualified Persons, the information in those reports is assumed to be reasonably accurate, based on the data review and property visits conducted by the author; however, they are not the basis for the Report.
Unless otherwise stated, all units used in the Report are metric, all dollar amounts ($) are in Canadian currency (“CAD”), and Universal Transverse Mercator coordinates in the Report and accompanying illustrations are referenced to the North American Datum 1983 Zone 14.
Technical Report on the El Chato Property
7
3 Reliance on Other Experts
With respect to legal title to the El Chato mining claim, the author has relied on the Mexico Secretary of Economy, Mining Administration Integrated System website (http://www.cartografia.economia.gob.mx/cartografia/), where as of January 5th, 2018 the El Chato claim was shown to be in good standing and held 100% by Minera Gavilán. The author has also reviewed a title opinion prepared by VHG Servicios Legales, S.C dated on March 1st, 2018, prepared for Mineral Gavilan, where the current status of El Chato property corresponds to the mining claim 238640 and its holder is Minera Gavilan.
Technical Report on the El Chato Property
1
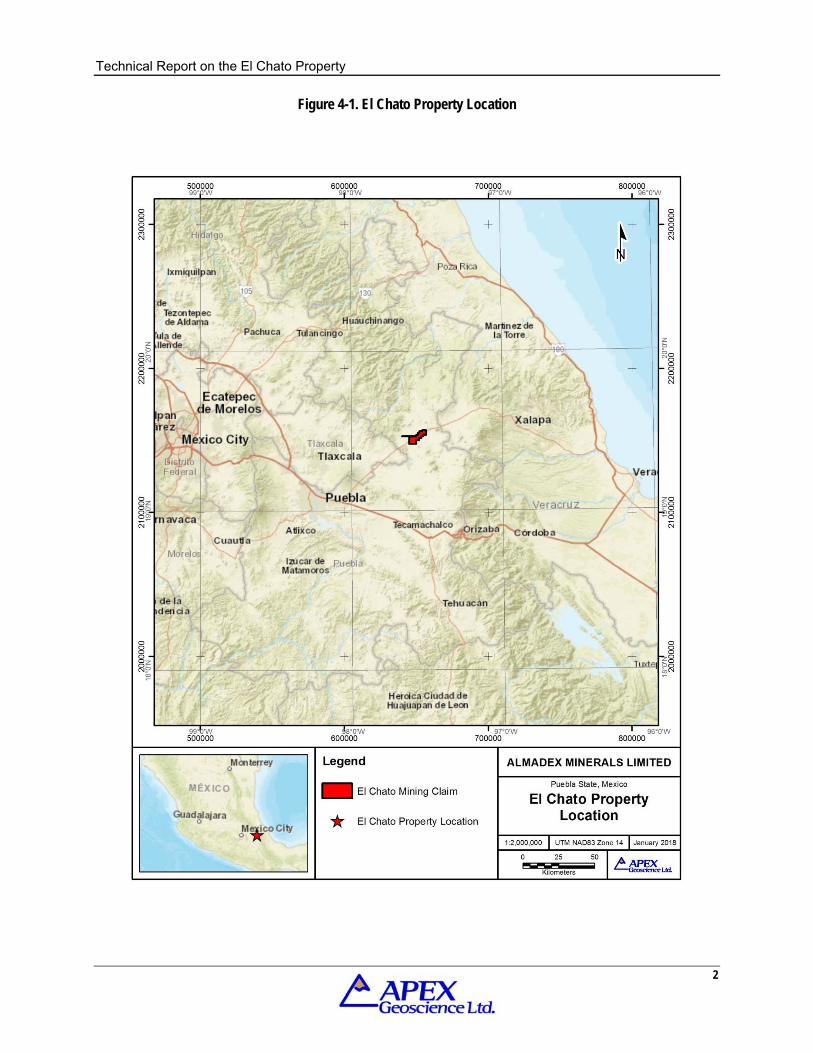
4 Property Description and Location
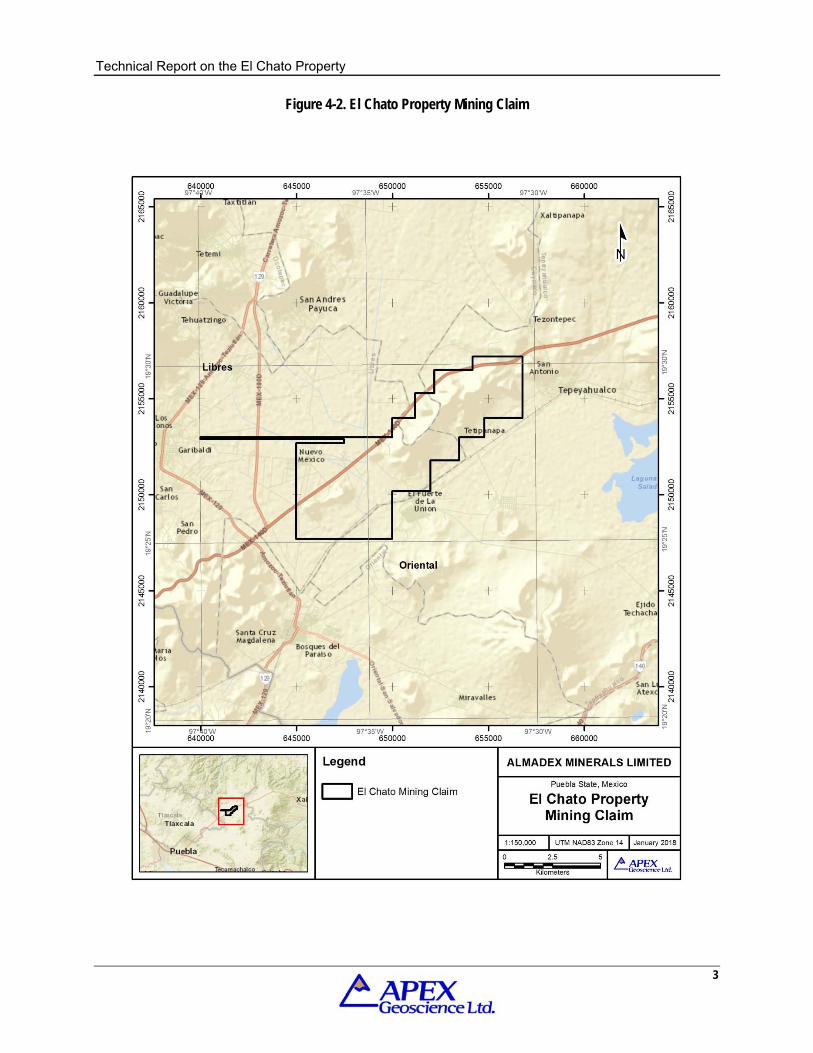
The Property has a total area of 5,332 ha and is located in Puebla State, Mexico, approximately 70 km northeast of the city of Puebla and 165 km east of Mexico City. (Figure 4-1). It is bounded by latitudes 19°25’6.65” N and 19°30’11.13” N, and longitudes 97°39’59.14” W and 97°30’22.09” W, and is centred at approximately 19°27’30” N latitude and 97°33’56” W longitude. The Property is located within the 1:50,000 scale Mexican Topographic Map (“MTM”) sheets E14B25 (Xonacatlan) and E14B35 (Guadalupe Victoria).
Table 4-1. El Chato Property Mining Claim
Claim Number Claim Name Title Holder Acquired
238640 El Chato Minera Gavilan, S.A. de C. V. 11/10/2011
The El Chato mining claim is registered to Minera Gavilán (Table 4-1; Figure 4-2). According mining law of Mexico (the “Mining Law”) exploration and exploitation of mineral resources can only be done through mining concessions (concesiones mineras) provided by the Mining Secretary (Chapter 2, Article 10, amendment August 11, 2014). Each mining concession with mineral resources should refer to a mining claim (lote minero) (Chapter 2, Article 12, amendment August 11, 2014).
Following an amendment to the Mining Law on April 28, 2005, there is no longer a distinction between exploration mining concessions and exploitation mining concessions. The Mining Law permits the owner of a mining concession to conduct exploration for the purpose of identifying mineral deposits and quantifying and evaluating economically usable mineral reserves, to prepare and to develop exploitation works in areas containing mineral deposits, and to extract mineral products from such deposits. Mining concession registrations expire after 50 years from the date of their recording and may be extended for an equal term if the holder requests an extension within five years prior to the expiration date.
To maintain a mining claim in good standing, holders are required to provide evidence of the exploration and/or exploitation work carried out on the claim under the terms and conditions stipulated in the Mining Law, and to pay mining duties established under the Mexican Federal Law of Rights, Article 263. Exploration work can be evidenced with investments made on the lot covered by the mining claim, and the exploitation work can be evidenced the same way, or by obtaining economically utilizable minerals. Chapter 2, Article 59 of the Mexican Law Regulation (2012) indicates the minimum exploration expenditures or the value of the mineral products to be obtained (Table 4-2).
Technical Report on the El Chato Property
2
Figure 4-1. El Chato Property Location
Technical Report on the El Chato Property
3
Figure 4-2. El Chato Property Mining Claim
Technical Report on the El Chato Property
4
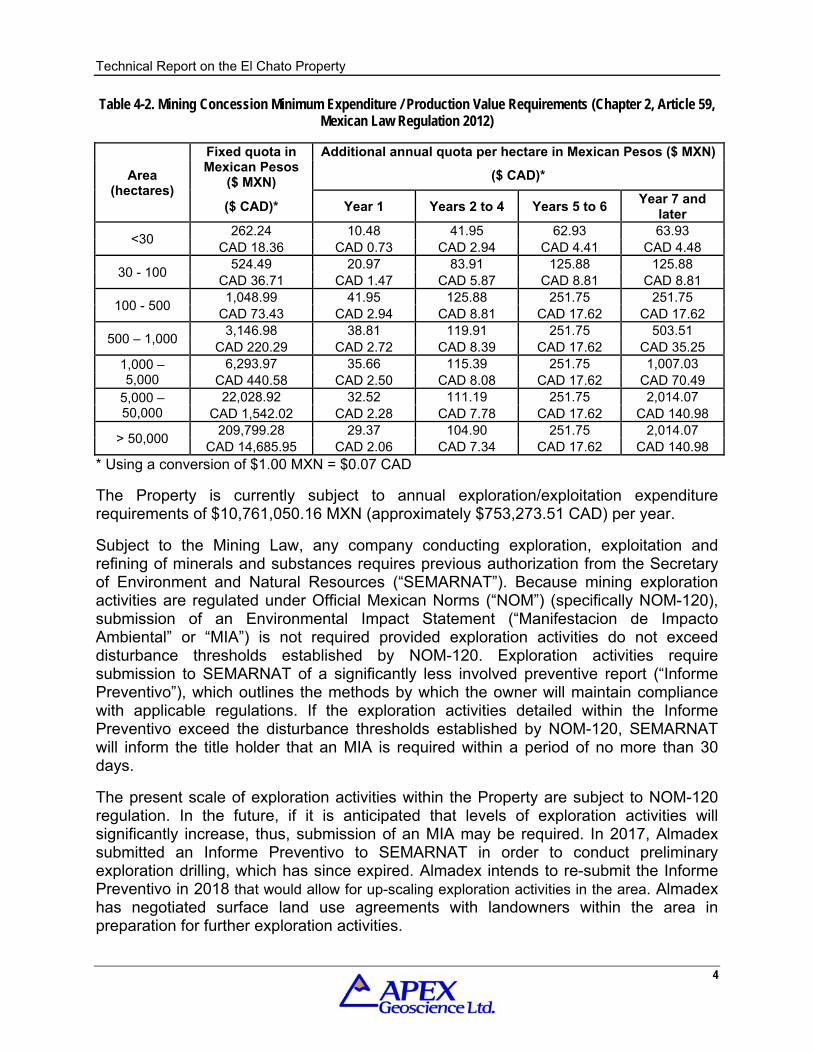
Table 4-2. Mining Concession Minimum Expenditure / Production Value Requirements (Chapter 2, Article 59, Mexican Law Regulation 2012)
Area (hectares)
Fixed quota in Mexican Pesos
($ MXN)
Additional annual quota per hectare in Mexican Pesos ($ MXN)
($ CAD)*
($ CAD)* Year 1 Years 2 to 4 Years 5 to 6 Year 7 and
later
<30 262.24 10.48 41.95 62.93 63.93
CAD 18.36 CAD 0.73 CAD 2.94 CAD 4.41 CAD 4.48
30 - 100 524.49 20.97 83.91 125.88 125.88
CAD 36.71 CAD 1.47 CAD 5.87 CAD 8.81 CAD 8.81
100 - 500 1,048.99 41.95 125.88 251.75 251.75
CAD 73.43 CAD 2.94 CAD 8.81 CAD 17.62 CAD 17.62
500 – 1,000 3,146.98 38.81 119.91 251.75 503.51
CAD 220.29 CAD 2.72 CAD 8.39 CAD 17.62 CAD 35.251,000 – 5,000
6,293.97 35.66 115.39 251.75 1,007.03CAD 440.58 CAD 2.50 CAD 8.08 CAD 17.62 CAD 70.49
5,000 – 50,000
22,028.92 32.52 111.19 251.75 2,014.07CAD 1,542.02 CAD 2.28 CAD 7.78 CAD 17.62 CAD 140.98
> 50,000 209,799.28 29.37 104.90 251.75 2,014.07
CAD 14,685.95 CAD 2.06 CAD 7.34 CAD 17.62 CAD 140.98* Using a conversion of $1.00 MXN = $0.07 CAD
The Property is currently subject to annual exploration/exploitation expenditure requirements of $10,761,050.16 MXN (approximately $753,273.51 CAD) per year.
Subject to the Mining Law, any company conducting exploration, exploitation and refining of minerals and substances requires previous authorization from the Secretary of Environment and Natural Resources (“SEMARNAT”). Because mining exploration activities are regulated under Official Mexican Norms (“NOM”) (specifically NOM-120), submission of an Environmental Impact Statement (“Manifestacion de Impacto Ambiental” or “MIA”) is not required provided exploration activities do not exceed disturbance thresholds established by NOM-120. Exploration activities require submission to SEMARNAT of a significantly less involved preventive report (“Informe Preventivo”), which outlines the methods by which the owner will maintain compliance with applicable regulations. If the exploration activities detailed within the Informe Preventivo exceed the disturbance thresholds established by NOM-120, SEMARNAT will inform the title holder that an MIA is required within a period of no more than 30 days.
The present scale of exploration activities within the Property are subject to NOM-120 regulation. In the future, if it is anticipated that levels of exploration activities will significantly increase, thus, submission of an MIA may be required. In 2017, Almadex submitted an Informe Preventivo to SEMARNAT in order to conduct preliminary exploration drilling, which has since expired. Almadex intends to re-submit the Informe Preventivo in 2018 that would allow for up-scaling exploration activities in the area. Almadex has negotiated surface land use agreements with landowners within the area in preparation for further exploration activities.

Technical Report on the El Chato Property
5
At present, the author is not aware of any environmental liabilities to which the Property may be subject, or any other significant risk factors that may affect access, title, or Almadex’s right or ability to perform work on the Property.
Technical Report on the El Chato Property
6
5 Accessibility, Climate, Local Resources, Infrastructure and Physiography
The Property is located in Puebla State, Mexico, approximately 10 km east of the town of Libres, 70 km northeast of the city of Puebla and 165 km east of Mexico City. Puebla is served by Hermanos Serdán International Airport, which is part of the metropolitan airport group for the capital region and an alternate airport for Mexico City. It provides daily service to numerous domestic and international destinations.
The Property can be accessed via the Mexican Federal Highway system. Mexican Federal Highway 140D runs through the northern part of the Property from southwest to northeast, and Highway 129D runs along its Eastern flank. The Tepeyahualco Hill Road and an adjacent rail line run along the Southern boundary of the Property from southwest to northeast. A network of secondary and dirt roads provide access to most areas of the Property.
The nearest supply center is Libres, a town with a population of approximately 31,000 people, located west of the Property. Several smaller towns are located around the periphery of the claim boundary, providing access to transportation and utilities. These towns are connected to the electricity grid and water supply is sufficient for this zone where agriculture is one of the main economic activities. Any services and supplies not available in surrounding towns can be acquired in Puebla, which is approximately 1 hour and 20 minutes from the Property by road.
The Property is characterized by mountainous terrain in the Northeast and mainly flat agricultural land in the Southwest. The terrain reaches elevations between 2,350 m and 2,700 m above sea level. The Salado River runs immediately south of the Property from northeast to southwest, feeding Totolcingo Lake. Small creeks are common in the mountainous Northeastern part of the El Chato claim, and irrigation channels crosscut farmland in the Southwest.
The climate in Puebla is generally warm and temperate, being classified as subtropical highland variety under the Köppen climate classification. Night temperatures are typically cool, and higher elevations experience a colder overall climate. The dry season runs from November through April and the rainy season lasts from May to October, with most precipitation falling between June and September. In general, weather conditions favor field operation year-round particularly during the dry season. Vegetation is mostly associated with farmlands in the Southwest and xerophytic scrub mostly in the Northeast ridge.
Technical Report on the El Chato Property
7
6 History
The Property covers an area of the Sierra Norte de Puebla, part of the Trans-Mexican Volcanic Belt (TMVB), east of the town of Libres and northeast of the city of Puebla, in Puebla State, Mexico. The mining title was conferred by the Dirección General de Minas in Mexico (DGM, General Mine Management, Mexican Authority) to Minera Gavilán, for exploration and mining between October 11, 2011 and October 10, 2061, in an area initially covering 16,120 ha. On January 30th, 2015, Minera Gavilán filed documents for reduction of the tenement surface to the 5,332 ha presented in this Report. This request is still being process by DGM.
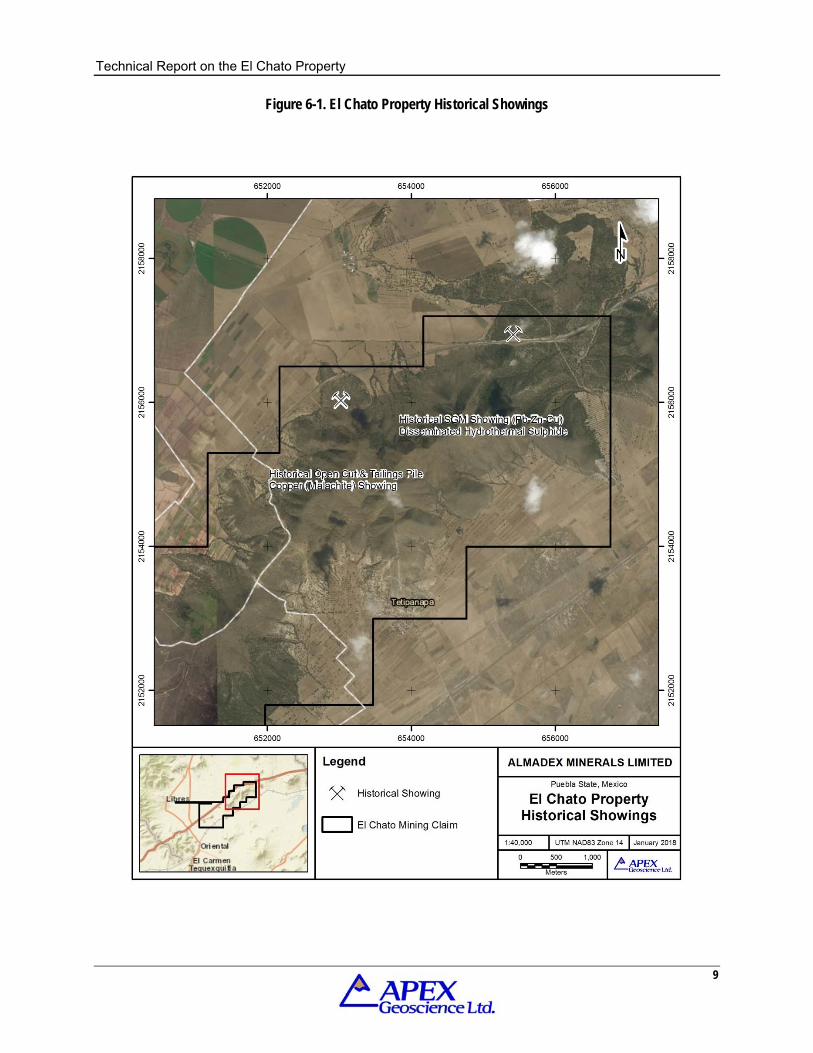
Historical mining work in the area around El Chato focused primarily on aggregates and dimensional stone. The National Institute for Statistics and Geography of Mexico (“INEGI”) identifies an aggregate processing plan in the town of Oriental, south of the Property, and the Mexican Geological Service (“SGM”) has records of multiple aggregate and dimensional stone deposits in the area. A single lead-zinc-copper showing is identified by the SGM in the Northeast corner of the Property (Figure 6-1). The showing is associated with disseminated hydrothermal sulphide mineralization. No alteration type is noted.
In the Northeast of the Property adjacent to Highway 140D, there is a small, approximately 2 m by 2 m open cut extending 3 m into the hillside on a steep downward angle (Figure 6-1). About 4 to 5 metres up the hill is a second near-vertical cut. Tailings piles are located adjacent to the excavations. The workings appear to target copper mineralization, as is evidenced by significant malachite staining of the surrounding rocks. The age of the workings is unknown, but the condition of the access trail and vegetation growth indicates that they are likely fairly old.
No other evidence of historical metals exploration or mining on the Property has been encountered in the field or the literature. The author is not aware of any significant modern exploration on the Property prior to the title acquisition by Minera Gavilán.
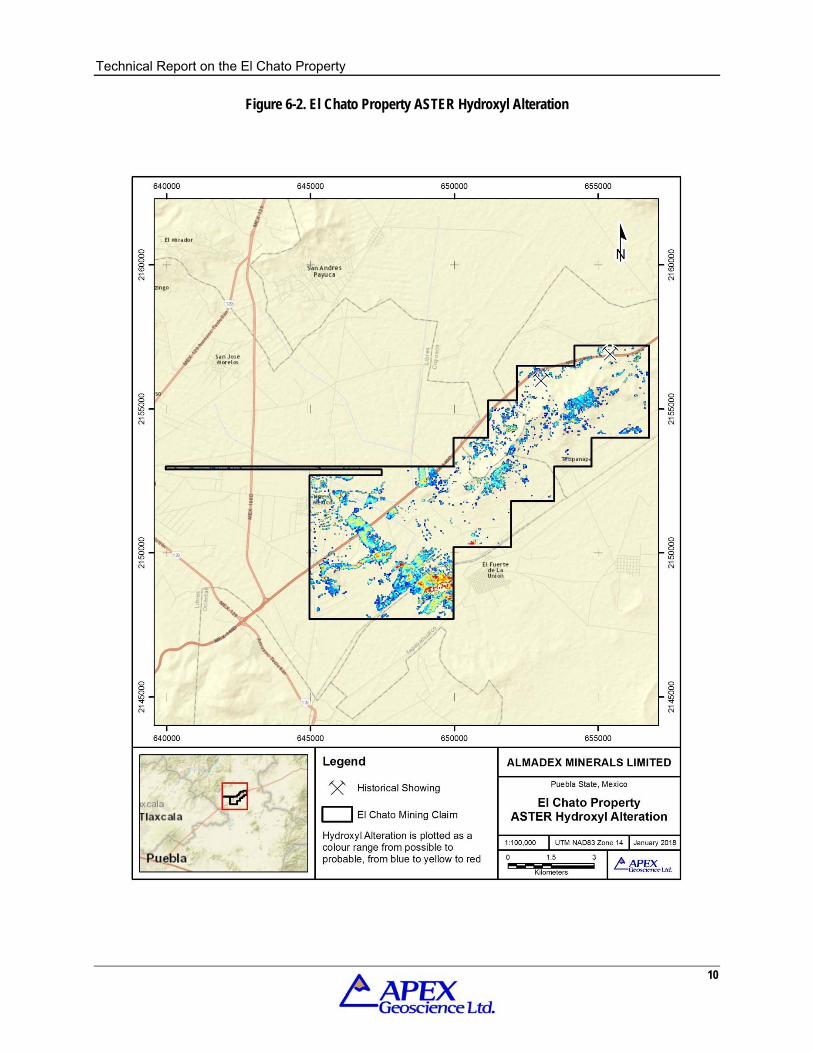
Between 2002 and 2008, M. Poliquin carried out field work focused on intrusive centers throughout the TMVB as part of his doctoral studies supported by Almaden. Poliquin and Almaden’s team identified areas of interest by targeting plutonic rocks referenced in published and unpublished sources, mostly previously mapped by Ortega-Gutierrez et al. (1992). The map data were cross-referenced with Advanced Spaceborne Thermal Emission and Reflection Radiometer (“ASTER”) satellite imagery using the infrared spectrum to identify hydroxyl minerals associated with zones of hydrothermal alteration within the TMVB. Over 200 areas of interest were identified throughout Eastern Mexico (Poliquin, 2009), including areas at El Chato (Figure 6-2). Although these anomalous areas were identified several years prior to staking the El Chato claim, Almaden’s focus at the time was on the discovery of the Caballo Blanco prospect, east of the Property.
Starting in late 2011, Almaden commenced exploration activities at El Chato. Exploration work between 2011 and 2017 comprised mapping, rock and soil sampling, stream sediment sampling, and induced polarization geophysical surveys. To date, no

Technical Report on the El Chato Property
8
drilling has been completed on the Property. The 2011 to 2017 exploration programs are discussed further in Section 9 “Exploration”.
Technical Report on the El Chato Property
9
Figure 6-1. El Chato Property Historical Showings
Technical Report on the El Chato Property
10
Figure 6-2. El Chato Property ASTER Hydroxyl Alteration
Technical Report on the El Chato Property
11
7 Geological Setting and Mineralization
7.1 Regional Geology
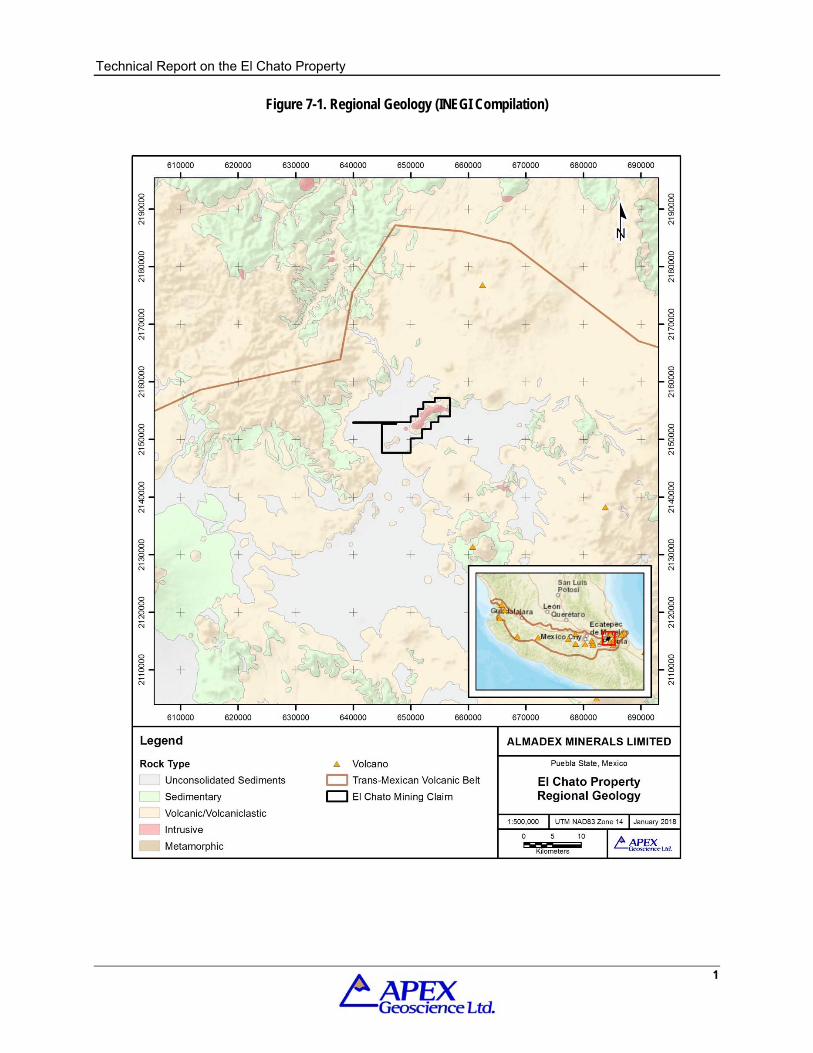
The Property is situated in the Sierra Norte de Puebla, part of the TMVB, a Neogene continental magmatic arc formed by more than 8,000 volcanic edifices and several intrusive bodies with a general east-west orientation that extends 1,000 km from the Pacific Ocean to the Gulf Coast in Central Mexico, ranging in width from 10 to 300 km (Figure 7-1). The TMVB is controlled by a complex extensional tectonic regime, whose volcanic products are underlain by basement units with widely different ages, compositions and thicknesses. Calc-alkaline and alkaline rocks are distributed all along the TMVB; however alkaline rocks (sodium-potassium) tend to be more abundant at both the West and East ends of the TMVB (Orozco-Esquivel, et al., 2007).
The TMVB is the most recent episode of a long lasting magmatic activity which, since the Jurassic, produced a series of partially overlapping arcs as a result of the eastward subduction of the Farellon plate beneath Western Mexico (Ferrari et al., 2011). The basement rocks of the Eastern half of the TMVB are Precambrian terranes, including biotite orthogneiss and granulite affected by granitic intrusions, grouped into the Oaxaquia microcontinent (Ferrari et al., 2011; Fuentes-Peralta and Calderon, 2008). These are overlain by the Paleozoic Mixteco terrane, consisting of a metamorphic sequence known as the Acatlan complex and a fan delta sedimentary sequence known as the Matzitzi formation. Another sedimentary complex is found on top of the Mixteco terrane, represented by various paleogeographic elements such as the Mesozoic basins of Tlaxiaco, Zongolica, Zapotitlan, and Tampico Misantla (Fuentes-Peralta and Calderon, 2008). The subducting plates associated with the TMVB are relatively young, with the Rivera plate dated at 10 million years (“Ma”) and the Cocos plate at 11 to 17 Ma.
Several geological episodes have been distinguished during the evolution of the TMVB (Gomez-Tuena et al., 2003, 2005, 2007; Orozco-Esquivel, et al., 2007 and Ferrari, et al., 2011): (1) effusive volcanism of intermediate composition date in the early to mid-Miocene (approximately 20 to 8 Ma) related to melting of the subducted slab; (2) a late Miocene (~11 Ma) episode of eastward migrating mafic volcanism north of the previously formed arc; (3) a latest Miocene (7.5 to 3.5 Ma) silicic episode became bimodal (mafic-silicic) in the early Pliocene, and marked the beginning of trench-ward migration of volcanism; and (4) late Pliocene and Pleistocene development of a compositionally diverse volcanic arc.
The regional trend of the arc rocks is west-northwest; though more northerly trending transform faults, forming at a high angle to the TMVB, provide a structural control on the volcanic units (Coller, 2011). Compressional strike-slip and extensional faults also developed as a result of compressional and extensional periods during subduction. The Northeast-Southwest San Antonio fault system, which was still active during the late Pliocene, before the reactivation of the Taxco-Queretaro fault system, is characterized by extensional left-lateral oblique-slip kinematics (Coller, 2011). Bellotti et al. (2006) show that north-northwest trending regional faults were right lateral in the Miocene, whereas the north-northeast to north-south trending faults observed by Coller (2011)
Technical Report on the El Chato Property
12
are related to the regional horst-and-graben development and likely to be purely extensional with possibly a component of right lateral movement, or trans-tensional.
Technical Report on the El Chato Property
1
Figure 7-1. Regional Geology (INEGI Compilation)
Technical Report on the El Chato Property
2
7.2 Property Geology
Most of the rock units at the Property are associated with Pleistocene to Holocene (<1.8 Ma) siliceous volcanism (Gomez-Tuena et al., 2003, 2005, 2007). INEGI provides regional geology maps at 1:250,000 and 1:50,000 scales for the area covering the Property. These maps report a minor Mesozoic mudstone unit cropping out at the base of the Northeast Ridge in the Northeastern part of the Property, and widespread Cenozoic volcanic, subvolcanic and intrusive (granitic) rocks, as well as Quaternary sediment deposits (Figure 7-1).
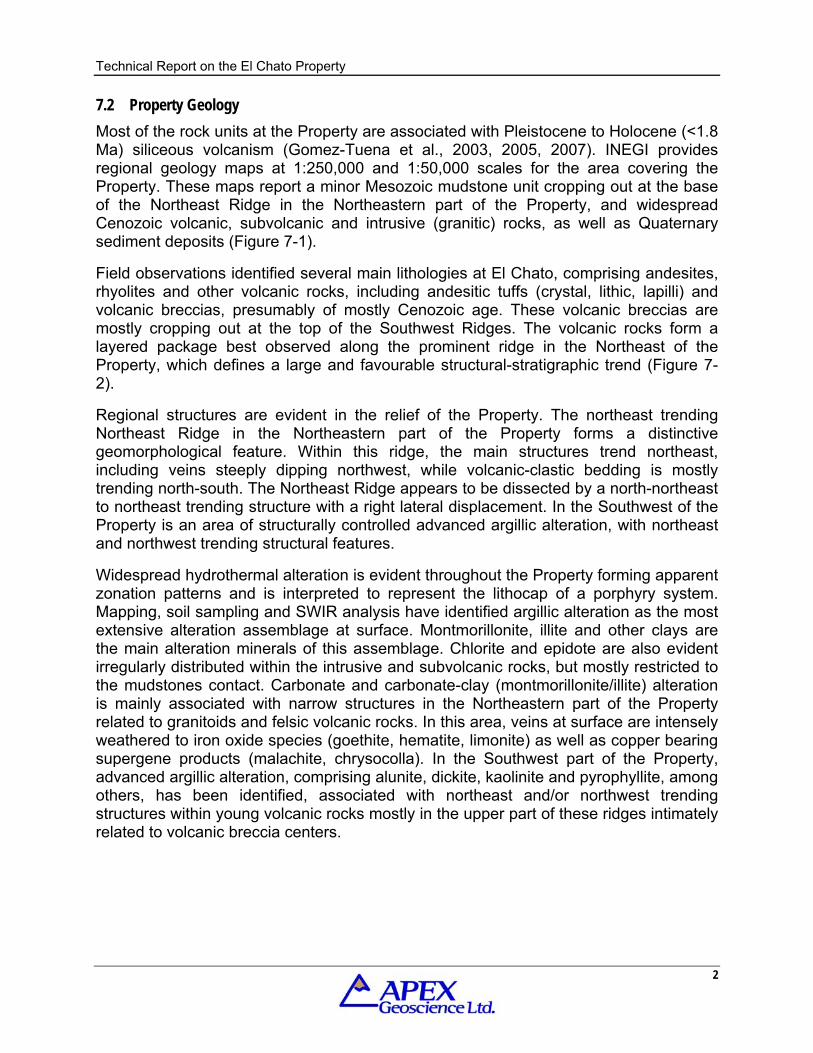
Field observations identified several main lithologies at El Chato, comprising andesites, rhyolites and other volcanic rocks, including andesitic tuffs (crystal, lithic, lapilli) and volcanic breccias, presumably of mostly Cenozoic age. These volcanic breccias are mostly cropping out at the top of the Southwest Ridges. The volcanic rocks form a layered package best observed along the prominent ridge in the Northeast of the Property, which defines a large and favourable structural-stratigraphic trend (Figure 7-2).
Regional structures are evident in the relief of the Property. The northeast trending Northeast Ridge in the Northeastern part of the Property forms a distinctive geomorphological feature. Within this ridge, the main structures trend northeast, including veins steeply dipping northwest, while volcanic-clastic bedding is mostly trending north-south. The Northeast Ridge appears to be dissected by a north-northeast to northeast trending structure with a right lateral displacement. In the Southwest of the Property is an area of structurally controlled advanced argillic alteration, with northeast and northwest trending structural features.
Widespread hydrothermal alteration is evident throughout the Property forming apparent zonation patterns and is interpreted to represent the lithocap of a porphyry system. Mapping, soil sampling and SWIR analysis have identified argillic alteration as the most extensive alteration assemblage at surface. Montmorillonite, illite and other clays are the main alteration minerals of this assemblage. Chlorite and epidote are also evident irregularly distributed within the intrusive and subvolcanic rocks, but mostly restricted to the mudstones contact. Carbonate and carbonate-clay (montmorillonite/illite) alteration is mainly associated with narrow structures in the Northeastern part of the Property related to granitoids and felsic volcanic rocks. In this area, veins at surface are intensely weathered to iron oxide species (goethite, hematite, limonite) as well as copper bearing supergene products (malachite, chrysocolla). In the Southwest part of the Property, advanced argillic alteration, comprising alunite, dickite, kaolinite and pyrophyllite, among others, has been identified, associated with northeast and/or northwest trending structures within young volcanic rocks mostly in the upper part of these ridges intimately related to volcanic breccia centers.
Technical Report on the El Chato Property
3
Figure 7-2. El Chato Property Geology
Technical Report on the El Chato Property
4
7.3 Mineralization
Rock, soil and stream sediment sampling at the Property have identified three main anomalies of interest. The Northeast Ridge is associated with a multi-element geochemical anomaly that includes copper, silver, minor gold and other base metals, within Cenozoic intrusives and subvolcanics. SWIR analysis of soil samples from the area identified montmorillonite-bearing argillic alteration with minor structurally controlled carbonate (mainly siderite) and carbonate-clay (argillic) alteration. The area is also known to host copper bearing veins weathering to malachite, and possibly chrysocolla and spangolite. The highest value associated with a rock sample is 2.1% copper, corresponding to an oxidized vein with malachite ± crysocolla mineralization.
Immediately southwest of the Northeast Ridge is a minor monticule associated with copper, gold and silver rock and soil geochemical anomalies, hosted within Cenozoic felsic igneous rocks (granite and rhyolite). Mineralization at the Central Monticule is likely associated with northeast trending structures.
Approximately 2 to 3 km southwest of the Central Monticule are the Southwest Ridges. Stream sediment sampling defined a copper-silver anomaly coincident with elevated values for arsenic, bismuth, and antimony in soil samples. Rock sampling also identified anomalous molybdenum values in the area. The Southwest Ridges anomalies appear to be associated with argillic and advanced argillic alteration.
Anomalies within the Northeast Ridge and the distribution of hydrothermal alteration appear to be consistent with shallow porphyry style mineralization, whereas the alterations associated with anomalies in the Southwest Ridges may be considered representative of the upper part of a high-sulfidation epithermal system.
Technical Report on the El Chato Property
5
8 Deposit Types
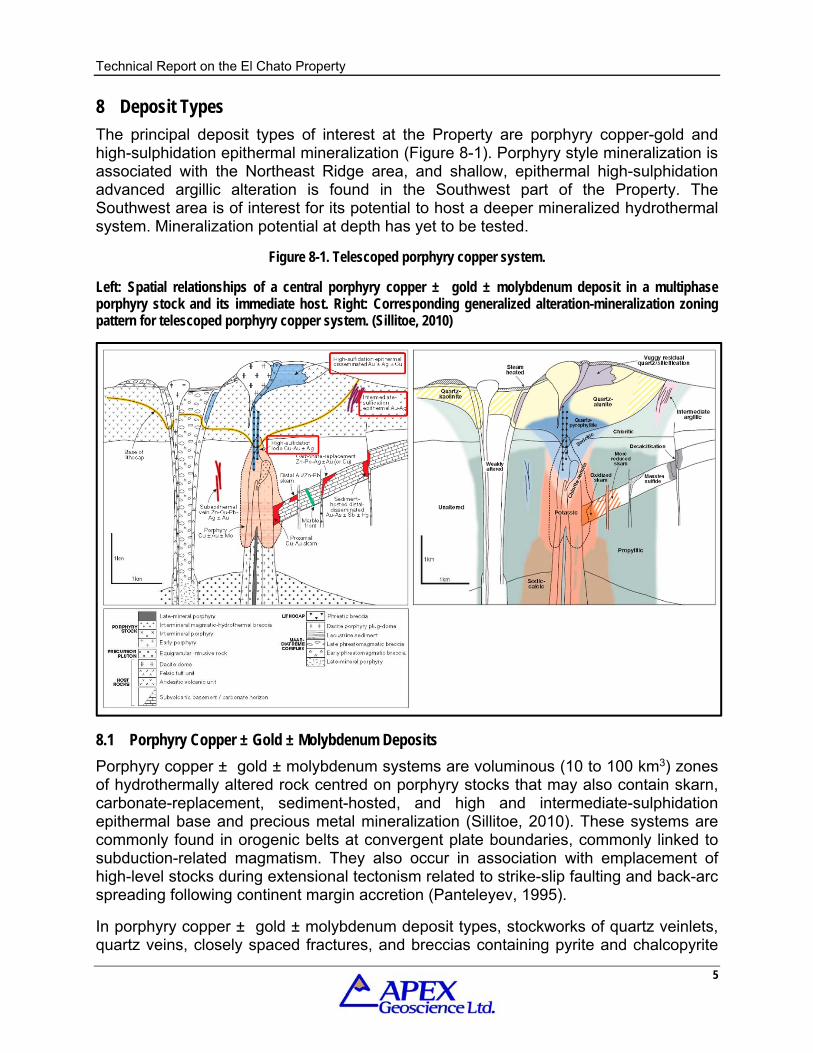
The principal deposit types of interest at the Property are porphyry copper-gold and high-sulphidation epithermal mineralization (Figure 8-1). Porphyry style mineralization is associated with the Northeast Ridge area, and shallow, epithermal high-sulphidation advanced argillic alteration is found in the Southwest part of the Property. The Southwest area is of interest for its potential to host a deeper mineralized hydrothermal system. Mineralization potential at depth has yet to be tested.
Figure 8-1. Telescoped porphyry copper system.
Left: Spatial relationships of a central porphyry copper ± gold ± molybdenum deposit in a multiphase porphyry stock and its immediate host. Right: Corresponding generalized alteration-mineralization zoning pattern for telescoped porphyry copper system. (Sillitoe, 2010)
8.1 Porphyry Copper ± Gold ± Molybdenum Deposits
Porphyry copper ± gold ± molybdenum systems are voluminous (10 to 100 km3) zones of hydrothermally altered rock centred on porphyry stocks that may also contain skarn, carbonate-replacement, sediment-hosted, and high and intermediate-sulphidation epithermal base and precious metal mineralization (Sillitoe, 2010). These systems are commonly found in orogenic belts at convergent plate boundaries, commonly linked to subduction-related magmatism. They also occur in association with emplacement of high-level stocks during extensional tectonism related to strike-slip faulting and back-arc spreading following continent margin accretion (Panteleyev, 1995).
In porphyry copper ± gold ± molybdenum deposit types, stockworks of quartz veinlets, quartz veins, closely spaced fractures, and breccias containing pyrite and chalcopyrite
Technical Report on the El Chato Property
6
with lesser molybdenite, bornite, enargite, covellite and magnetite occur in large zones of economically bulk-mineable mineralization in, or adjoining porphyritic intrusions and related breccia bodies. Disseminated sulphide minerals are present, generally in subordinate amounts. The mineralization is spatially, temporally and genetically associated with hydrothermal alteration of the host rock intrusions and wall rocks.
Temperature, fluid pH, and fluid and host rock composition control the mineralogy of hydrothermal systems. The stability temperature and pH range for each hydrothermal mineral determines the alteration zonation. The alteration and associated mineralization in porphyry copper ± gold ± molybdenum systems is zoned outward and upward from the stocks, generally progressing from barren, early sodic-calcic to potentially ore-grade potassic, chlorite-sericite and sericitic, to advanced argillic alteration, the last of these comprising the lithocap, which, in absence of significant erosion, may be greater than 1 km in thickness. Chalcopyrite ± bornite ± molybdenite ± magnetite assemblages are characteristic of potassic zones, whereas pyrite ± enargite ± covellite assemblages are associated with shallower parts of the lithocap (Sillitoe, 2010).
8.2 High-Sulphidation Epithermal Gold-Silver ± Copper Deposits
Gold and silver deposits that form at shallow crustal depths (<1,500 m) are interpreted to be controlled principally by the tectonic setting and composition of the mineralizing hydrothermal fluids. Three classes of epithermal deposits (high-sulphidation, intermediate-sulphidation and low-sulphidation) are recognized by the oxidation state of sulphur in the mineralogy, the form and style of mineralization, the geometry and mineralogy of alteration zoning, and the ore composition (Hedenquist et al., 2000; White and Hedenquist, 1995). Overlapping characteristics and gradations between epithermal classes may occur within a district or even within a single deposit. The appropriate classification of a newly discovered epithermal prospect can have important implications to exploration.
High-sulphidation and intermediate-sulphidation systems are most commonly hosted by subduction-related andesite/dacite volcanic arc rocks, which are dominantly calc-alkaline in composition. Low-sulphidation systems are more restricted, generally to rift-related bimodal (basalt, rhyolite) or alkalic volcanic sequences. The gangue mineralogy, metal contents and fluid inclusion studies indicate that near neutral pH hydrothermal fluids with low to moderate salinities form low- and intermediate-sulphidation class deposits whereas high-sulphidation deposits are related to more acidic fluids with variable low to high salinities. Low- and intermediate-sulphidation deposits are typically more vein-style while high-sulphidation deposits commonly consist primarily of replacement and disseminated styles of mineralization with subordinate veining. Epithermal mineralization and alteration at El Chato is believed to represent a high-sulphidation system.
High-sulphidation epithermal deposits result from fluids (dominantly gases such as sulphur dioxide, hydrogen fluoride, hydrogen chloride) channeled directly from a hot magma. The fluids interact with groundwater and form strong acids. These acids rot and dissolve the surrounding rock leaving only silica behind, often in a sponge-like formation known as vuggy silica. Gold, and sometimes copper-rich brines that also ascend from
Technical Report on the El Chato Property
7
the magma then precipitate their metals within the spongy, vuggy silica bodies. The shape of these mineral deposits is generally determined by the distribution of vuggy silica. Sometimes the vuggy silica can be widespread if the acid fluids encountered a broad permeable geologic unit. In this case it is common to find large bulk-tonnage mines with lower grades.
The acidic fluids are progressively neutralized by the rock the further they move away from the source. The rocks in turn are altered by the fluids into progressively more neutral/stable minerals the further away from the source. As a result, definable zones of alteration minerals are almost always formed in shell-like layers around a core zone. Typically, the sequence is to move from vuggy silica at the centre, progressing through quartz-alunite to kaolinite-dickite, illite rich rock, to chlorite rich rock at the outer reaches of alteration. Alunite (a sulphate mineral) and kalonite, dickite, illite and chlorite (clay minerals) are generally whitish to yellowish in colour. The clay and sulphate alteration (referred to as acid-sulphate alteration) in high-sulphidation systems can produce huge areas, sometimes up to 100 square-km, of visually impressive coloured rocks.
Native gold and electrum are the primary ore-bearing minerals in high-sulphidation deposits, along with variable amounts of pyrite, copper-bearing sulphides and sulfosalts such as enargite, luzonite, covellite, tetrahedrite and tennanite, plus sphalerite and telluride minerals. Enargite dominates the copper sulphides, indicating a high-sulphidation state (Simmons et al., 2005).
Technical Report on the El Chato Property
8
9 Exploration
Almaden commenced exploration at the Property in late 2011 and Almadex continued work as of May 2015. Between 2011 and 2017, exploration work at the Property comprised of rock, soil and stream geochemical sampling, IP geophysical surveys, and geological mapping. To date, a total of 98 rock samples, 534 soil samples and 16 stream sediment samples have been collected, and 69.1 line-km of IP has been completed. Spectral analysis was performed on 582 of the soil samples, distributed in 477 locations within the Property, in order to identify hydrothermal alteration minerals.
Based on the results of soil, rock and stream sampling described below, good correlation of surface with geochemical anomalies, and the results of quality assurance / quality control measures, the geochemical samples are considered representative and there are no apparent factors that may have resulted in sample biases.
9.1 Stream Sediment Sampling
A total of 16 stream sediment silt samples were collected at the Property during the 2012 field programs. Samples were collected from second order drainages covering the Property at a density of about 1 sample per square-km.
The specific sample collection methods employed are not known, however the author does not rule these samples as not representative of their respective source drainages. These samples show copper anomalous values in the Northeast Ridge. Similarly, stream sediment anomalous values were detected for molybdenum and arsenic in the Southwest Ridges.
9.2 Rock Grab Sampling
A total of 98 rock samples were collected through the main three anomalies of the Property and adjacent areas. The Northeast Ridge and the Southwest monticule copper-gold anomalies are consistent with the soil sample anomalies and are considered mostly copper-gold anomalies.
Rock grab samples collected by Almaden and Almadex were from both representative and apparently mineralized lithologies in outcrop, talus and transported boulders within creeks throughout the Property. Rock samples ranged from 0.5 to 2.5 kilograms (“kg”) in weight and were placed in uniquely labelled poly samples bags. Sample locations were recorded using handheld GPS accurate to plus or minus 5 m accuracy.
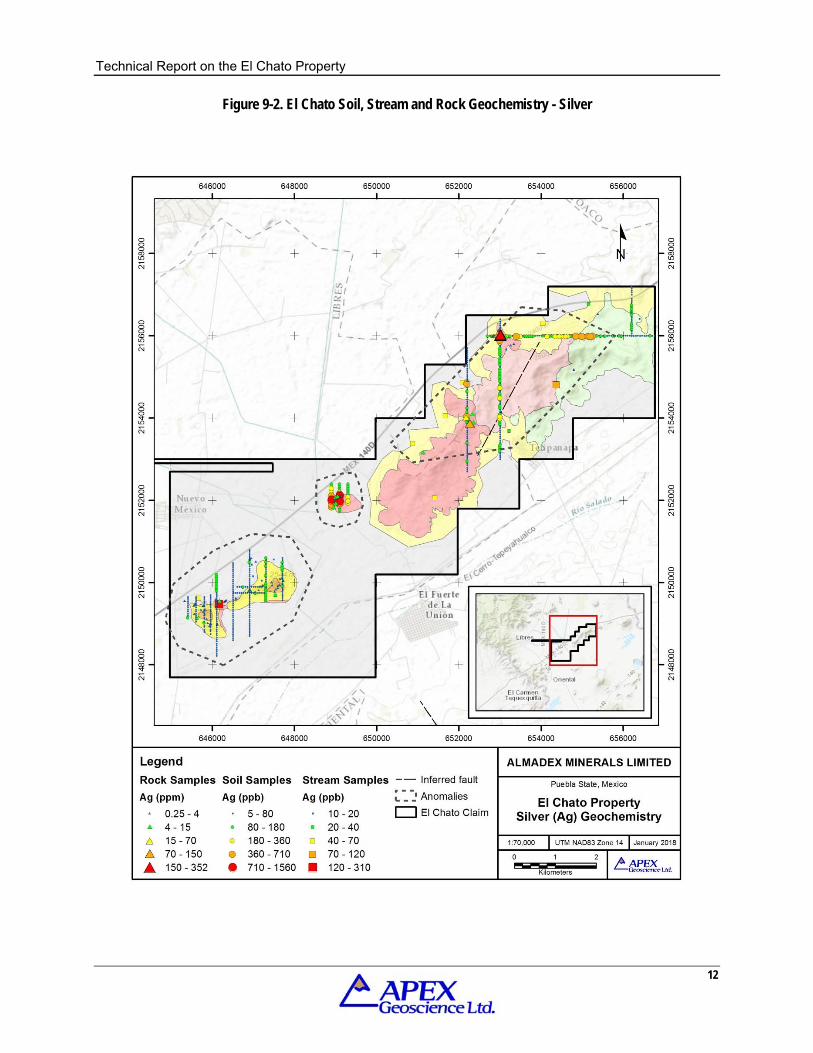
A total of 21 samples returned gold values greater than 10 parts per billion (“ppb”) and 4 samples returned gold values greater than 100 ppb. A total of 12 samples returned silver values greater than 10 parts per million (“ppm”) and 5 of these returned values greater than 100 ppm. A total of 20 samples returned copper higher than 0.01%, five greater than 0.1% including four greater than 1% and one of 21% copper.
Sample 17KRP801, collected from a small underground cut in the vicinity of the contact between the granites and the felsic volcanic rocks in the Northeast Ridge yielded values of 2.1% copper, 317 ppm silver and 0.033 ppm gold. In the same area, another grab sample outside of the old mine working, yielded 3.5% copper, 259 ppm silver and 121
Technical Report on the El Chato Property
9
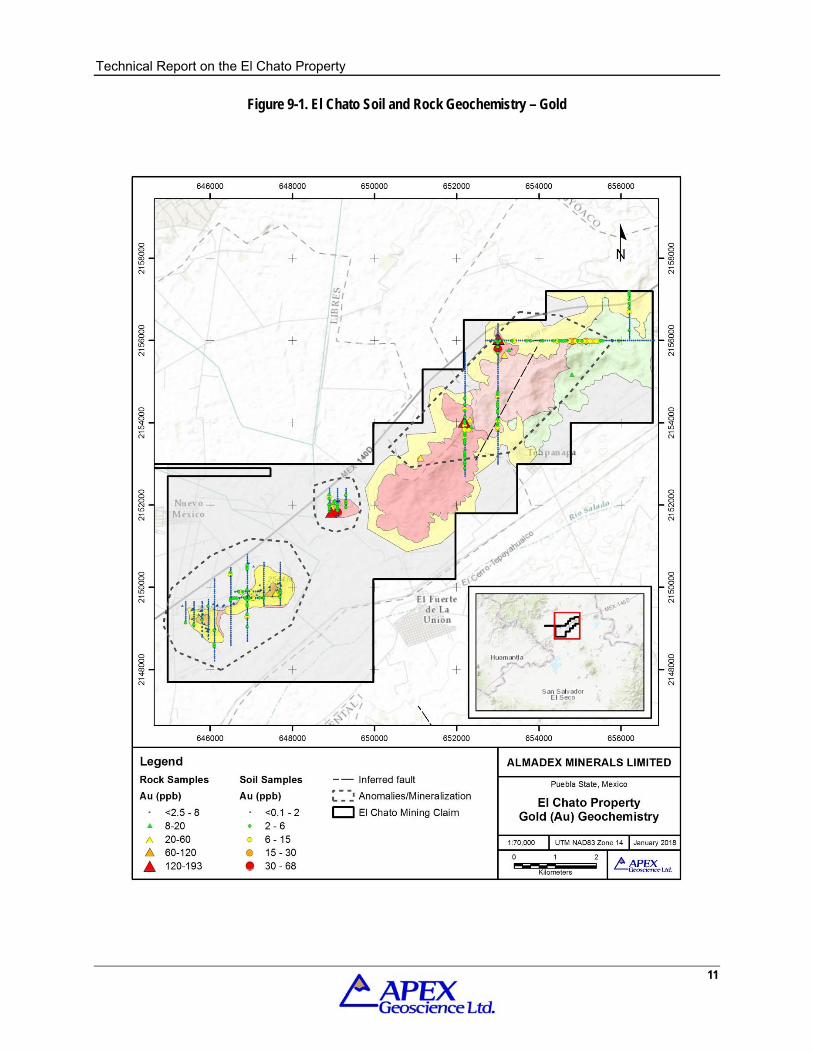
ppb gold. The highest gold value corresponds to a sample within the granitoid body and yielded 193 ppb gold, 68.3 ppm silver and 0.01% copper. Most rock samples showing anomalous values for copper, silver, gold and other elements were collected either from the granitoids or in the vicinity of the granitoids within the Northeast Ridge and the Central Monticule (Figures 9-1 and 9-2).
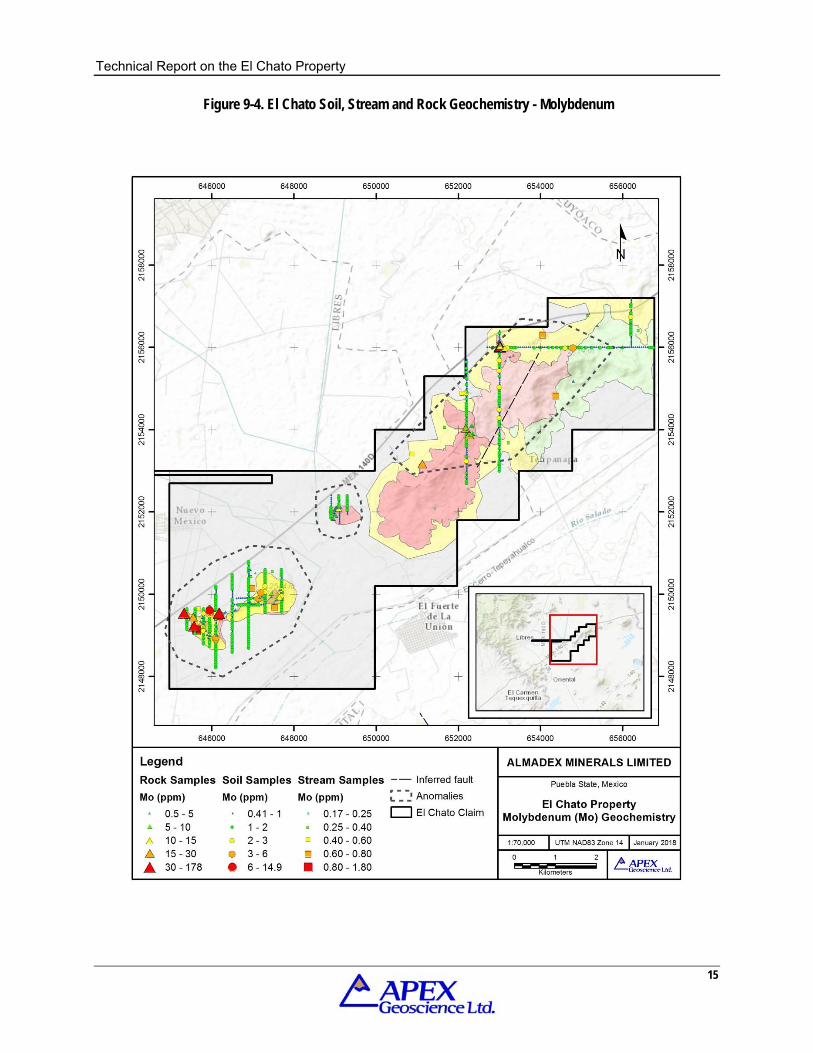
The Southwest Ridges exhibit anomalous values for molybdenite with a rock sample yielding 178 ppm molybdenum within the area of argillic/advanced argillic alteration in the recent silicic volcanic rocks.
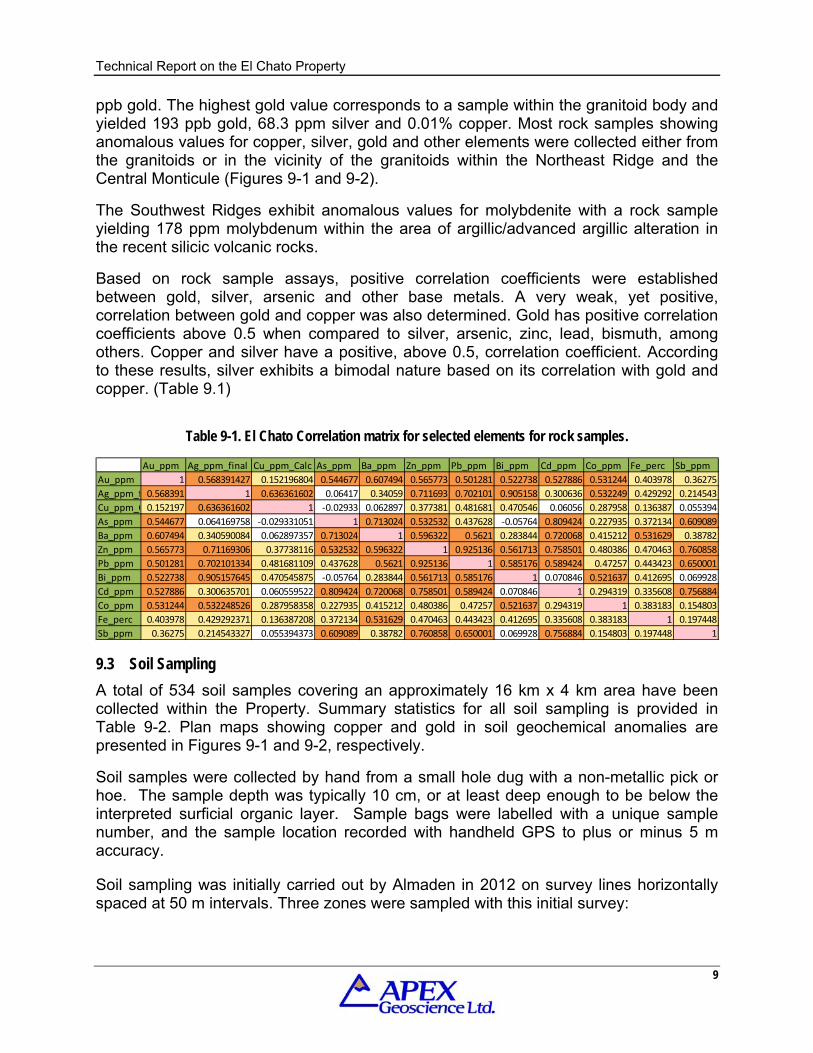
Based on rock sample assays, positive correlation coefficients were established between gold, silver, arsenic and other base metals. A very weak, yet positive, correlation between gold and copper was also determined. Gold has positive correlation coefficients above 0.5 when compared to silver, arsenic, zinc, lead, bismuth, among others. Copper and silver have a positive, above 0.5, correlation coefficient. According to these results, silver exhibits a bimodal nature based on its correlation with gold and copper. (Table 9.1)
Table 9-1. El Chato Correlation matrix for selected elements for rock samples.
9.3 Soil Sampling
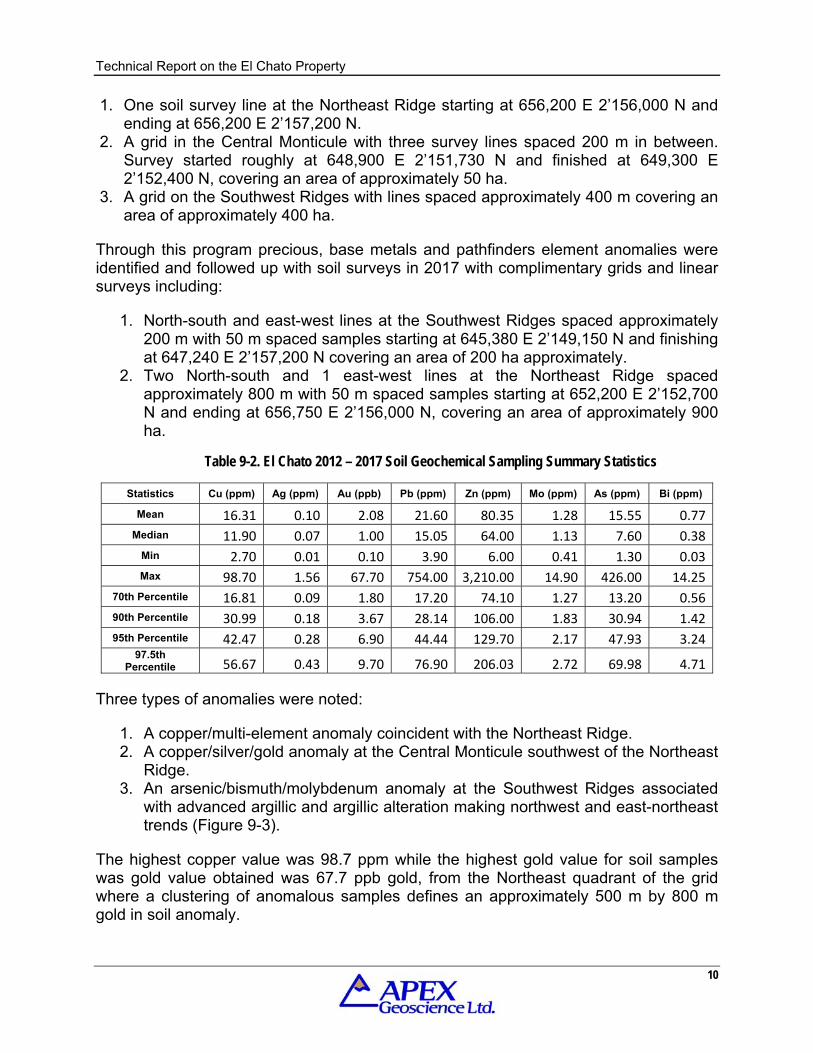
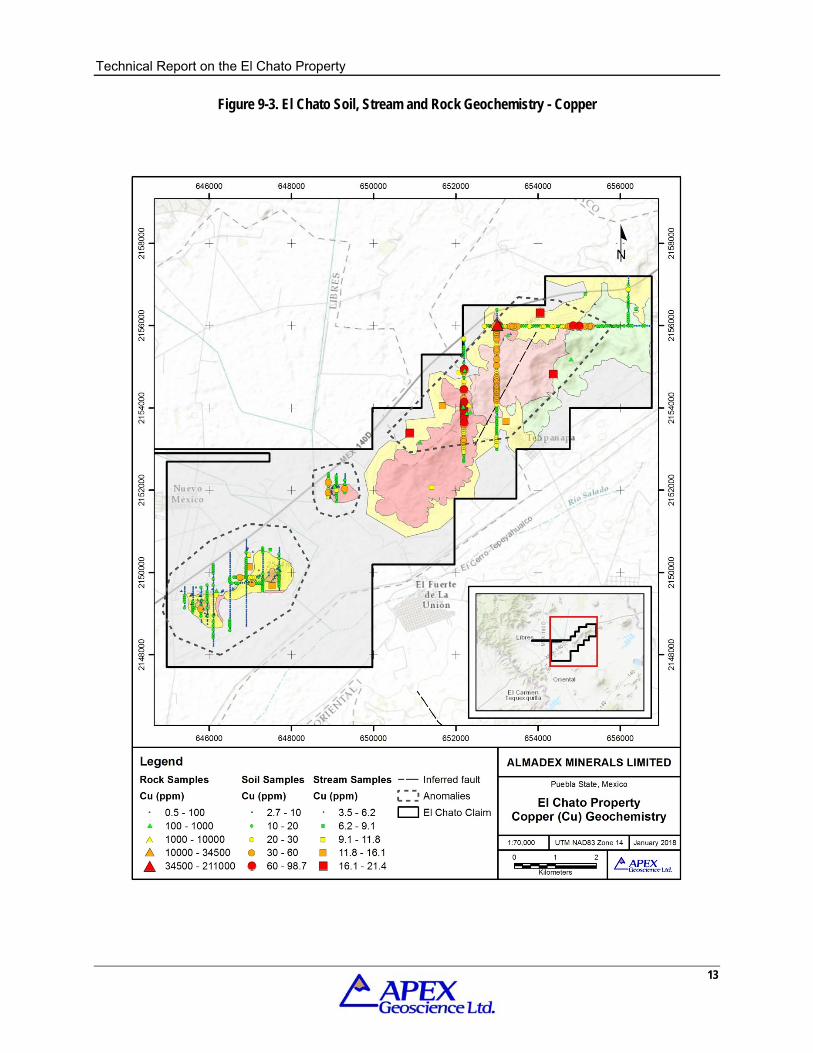
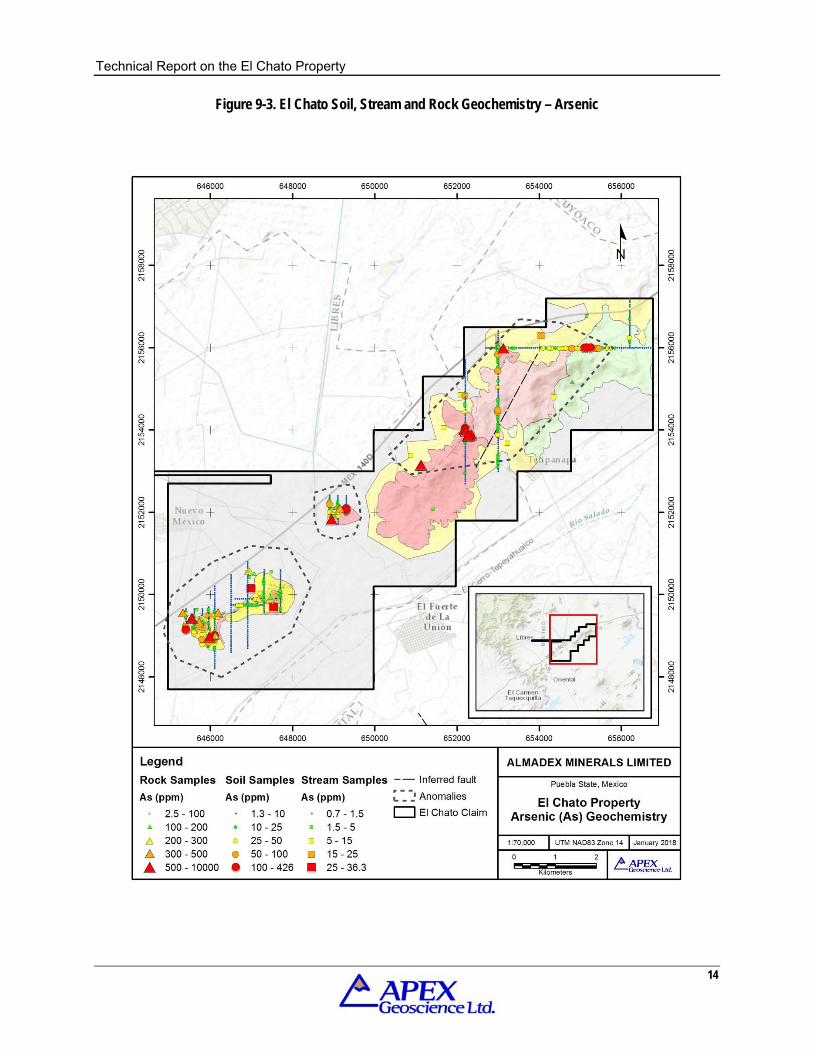
A total of 534 soil samples covering an approximately 16 km x 4 km area have been collected within the Property. Summary statistics for all soil sampling is provided in Table 9-2. Plan maps showing copper and gold in soil geochemical anomalies are presented in Figures 9-1 and 9-2, respectively.
Soil samples were collected by hand from a small hole dug with a non-metallic pick or hoe. The sample depth was typically 10 cm, or at least deep enough to be below the interpreted surficial organic layer. Sample bags were labelled with a unique sample number, and the sample location recorded with handheld GPS to plus or minus 5 m accuracy.
Soil sampling was initially carried out by Almaden in 2012 on survey lines horizontally spaced at 50 m intervals. Three zones were sampled with this initial survey:
Au_ppm Ag_ppm_final Cu_ppm_Calc As_ppm Ba_ppm Zn_ppm Pb_ppm Bi_ppm Cd_ppm Co_ppm Fe_perc Sb_ppm
Au_ppm 1 0.568391427 0.152196804 0.544677 0.607494 0.565773 0.501281 0.522738 0.527886 0.531244 0.403978 0.36275
Ag_ppm_f 0.568391 1 0.636361602 0.06417 0.34059 0.711693 0.702101 0.905158 0.300636 0.532249 0.429292 0.214543
Cu_ppm_C 0.152197 0.636361602 1 ‐0.02933 0.062897 0.377381 0.481681 0.470546 0.06056 0.287958 0.136387 0.055394
As_ppm 0.544677 0.064169758 ‐0.029331051 1 0.713024 0.532532 0.437628 ‐0.05764 0.809424 0.227935 0.372134 0.609089
Ba_ppm 0.607494 0.340590084 0.062897357 0.713024 1 0.596322 0.5621 0.283844 0.720068 0.415212 0.531629 0.38782
Zn_ppm 0.565773 0.71169306 0.37738116 0.532532 0.596322 1 0.925136 0.561713 0.758501 0.480386 0.470463 0.760858
Pb_ppm 0.501281 0.702101334 0.481681109 0.437628 0.5621 0.925136 1 0.585176 0.589424 0.47257 0.443423 0.650001
Bi_ppm 0.522738 0.905157645 0.470545875 ‐0.05764 0.283844 0.561713 0.585176 1 0.070846 0.521637 0.412695 0.069928
Cd_ppm 0.527886 0.300635701 0.060559522 0.809424 0.720068 0.758501 0.589424 0.070846 1 0.294319 0.335608 0.756884
Co_ppm 0.531244 0.532248526 0.287958358 0.227935 0.415212 0.480386 0.47257 0.521637 0.294319 1 0.383183 0.154803
Fe_perc 0.403978 0.429292371 0.136387208 0.372134 0.531629 0.470463 0.443423 0.412695 0.335608 0.383183 1 0.197448
Sb_ppm 0.36275 0.214543327 0.055394373 0.609089 0.38782 0.760858 0.650001 0.069928 0.756884 0.154803 0.197448 1
Technical Report on the El Chato Property
10
1. One soil survey line at the Northeast Ridge starting at 656,200 E 2’156,000 N and ending at 656,200 E 2’157,200 N.
2. A grid in the Central Monticule with three survey lines spaced 200 m in between. Survey started roughly at 648,900 E 2’151,730 N and finished at 649,300 E 2’152,400 N, covering an area of approximately 50 ha.
3. A grid on the Southwest Ridges with lines spaced approximately 400 m covering an area of approximately 400 ha.
Through this program precious, base metals and pathfinders element anomalies were identified and followed up with soil surveys in 2017 with complimentary grids and linear surveys including:
1. North-south and east-west lines at the Southwest Ridges spaced approximately 200 m with 50 m spaced samples starting at 645,380 E 2’149,150 N and finishing at 647,240 E 2’157,200 N covering an area of 200 ha approximately.
2. Two North-south and 1 east-west lines at the Northeast Ridge spaced approximately 800 m with 50 m spaced samples starting at 652,200 E 2’152,700 N and ending at 656,750 E 2’156,000 N, covering an area of approximately 900 ha.
Table 9-2. El Chato 2012 – 2017 Soil Geochemical Sampling Summary Statistics
Statistics Cu (ppm) Ag (ppm) Au (ppb) Pb (ppm) Zn (ppm) Mo (ppm) As (ppm) Bi (ppm)
Mean 16.31 0.10 2.08 21.60 80.35 1.28 15.55 0.77
Median 11.90 0.07 1.00 15.05 64.00 1.13 7.60 0.38
Min 2.70 0.01 0.10 3.90 6.00 0.41 1.30 0.03
Max 98.70 1.56 67.70 754.00 3,210.00 14.90 426.00 14.25
70th Percentile 16.81 0.09 1.80 17.20 74.10 1.27 13.20 0.56
90th Percentile 30.99 0.18 3.67 28.14 106.00 1.83 30.94 1.42
95th Percentile 42.47 0.28 6.90 44.44 129.70 2.17 47.93 3.2497.5th
Percentile 56.67 0.43 9.70 76.90 206.03 2.72 69.98 4.71
Three types of anomalies were noted:
1. A copper/multi-element anomaly coincident with the Northeast Ridge. 2. A copper/silver/gold anomaly at the Central Monticule southwest of the Northeast
Ridge. 3. An arsenic/bismuth/molybdenum anomaly at the Southwest Ridges associated
with advanced argillic and argillic alteration making northwest and east-northeast trends (Figure 9-3).
The highest copper value was 98.7 ppm while the highest gold value for soil samples was gold value obtained was 67.7 ppb gold, from the Northeast quadrant of the grid where a clustering of anomalous samples defines an approximately 500 m by 800 m gold in soil anomaly.
Technical Report on the El Chato Property
11
Figure 9-1. El Chato Soil and Rock Geochemistry – Gold
Technical Report on the El Chato Property
12
Figure 9-2. El Chato Soil, Stream and Rock Geochemistry - Silver
Technical Report on the El Chato Property
13
Figure 9-3. El Chato Soil, Stream and Rock Geochemistry - Copper
Technical Report on the El Chato Property
14
Figure 9-3. El Chato Soil, Stream and Rock Geochemistry – Arsenic
Technical Report on the El Chato Property
15
Figure 9-4. El Chato Soil, Stream and Rock Geochemistry - Molybdenum
Technical Report on the El Chato Property
16
9.3.1 Short-Wave Infrared Spectrum SWIR Soil Sampling – Hydrothermal Alteration
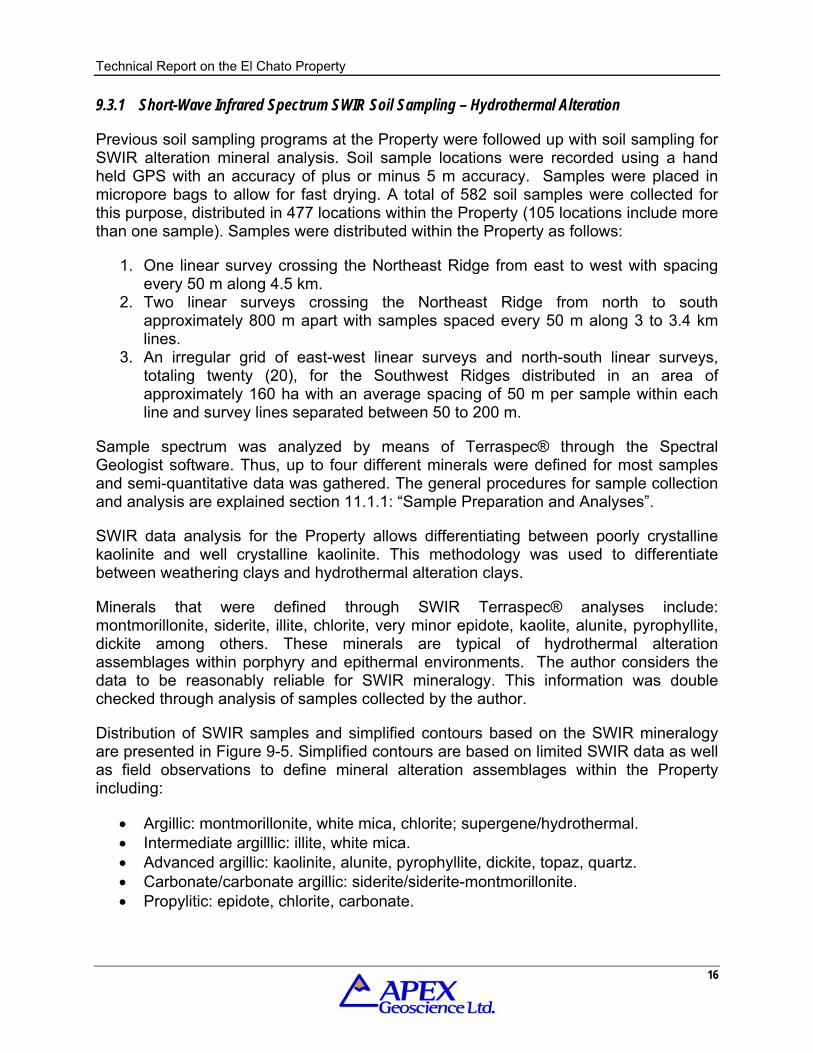
Previous soil sampling programs at the Property were followed up with soil sampling for SWIR alteration mineral analysis. Soil sample locations were recorded using a hand held GPS with an accuracy of plus or minus 5 m accuracy. Samples were placed in micropore bags to allow for fast drying. A total of 582 soil samples were collected for this purpose, distributed in 477 locations within the Property (105 locations include more than one sample). Samples were distributed within the Property as follows:
1. One linear survey crossing the Northeast Ridge from east to west with spacing every 50 m along 4.5 km.
2. Two linear surveys crossing the Northeast Ridge from north to south approximately 800 m apart with samples spaced every 50 m along 3 to 3.4 km lines.
3. An irregular grid of east-west linear surveys and north-south linear surveys, totaling twenty (20), for the Southwest Ridges distributed in an area of approximately 160 ha with an average spacing of 50 m per sample within each line and survey lines separated between 50 to 200 m.
Sample spectrum was analyzed by means of Terraspec® through the Spectral Geologist software. Thus, up to four different minerals were defined for most samples and semi-quantitative data was gathered. The general procedures for sample collection and analysis are explained section 11.1.1: “Sample Preparation and Analyses”.
SWIR data analysis for the Property allows differentiating between poorly crystalline kaolinite and well crystalline kaolinite. This methodology was used to differentiate between weathering clays and hydrothermal alteration clays.
Minerals that were defined through SWIR Terraspec® analyses include: montmorillonite, siderite, illite, chlorite, very minor epidote, kaolite, alunite, pyrophyllite, dickite among others. These minerals are typical of hydrothermal alteration assemblages within porphyry and epithermal environments. The author considers the data to be reasonably reliable for SWIR mineralogy. This information was double checked through analysis of samples collected by the author.
Distribution of SWIR samples and simplified contours based on the SWIR mineralogy are presented in Figure 9-5. Simplified contours are based on limited SWIR data as well as field observations to define mineral alteration assemblages within the Property including:
Argillic: montmorillonite, white mica, chlorite; supergene/hydrothermal. Intermediate argilllic: illite, white mica. Advanced argillic: kaolinite, alunite, pyrophyllite, dickite, topaz, quartz. Carbonate/carbonate argillic: siderite/siderite-montmorillonite. Propylitic: epidote, chlorite, carbonate.
Technical Report on the El Chato Property
17
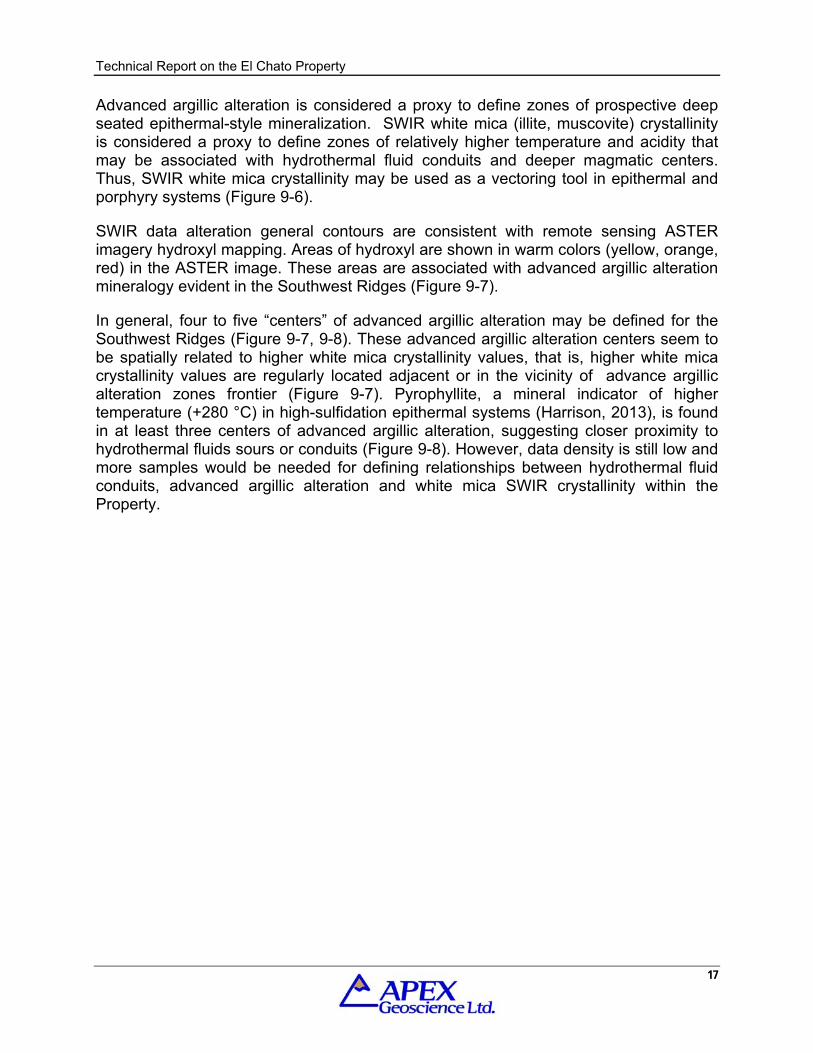
Advanced argillic alteration is considered a proxy to define zones of prospective deep seated epithermal-style mineralization. SWIR white mica (illite, muscovite) crystallinity is considered a proxy to define zones of relatively higher temperature and acidity that may be associated with hydrothermal fluid conduits and deeper magmatic centers. Thus, SWIR white mica crystallinity may be used as a vectoring tool in epithermal and porphyry systems (Figure 9-6).
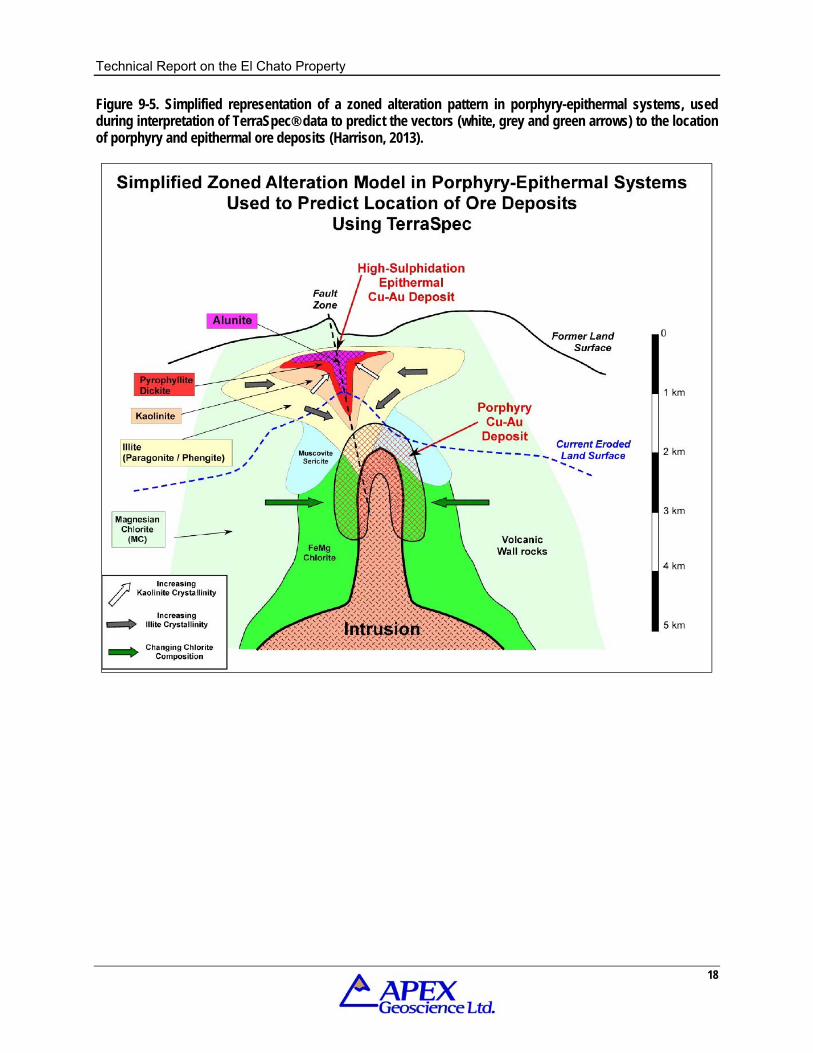
SWIR data alteration general contours are consistent with remote sensing ASTER imagery hydroxyl mapping. Areas of hydroxyl are shown in warm colors (yellow, orange, red) in the ASTER image. These areas are associated with advanced argillic alteration mineralogy evident in the Southwest Ridges (Figure 9-7).
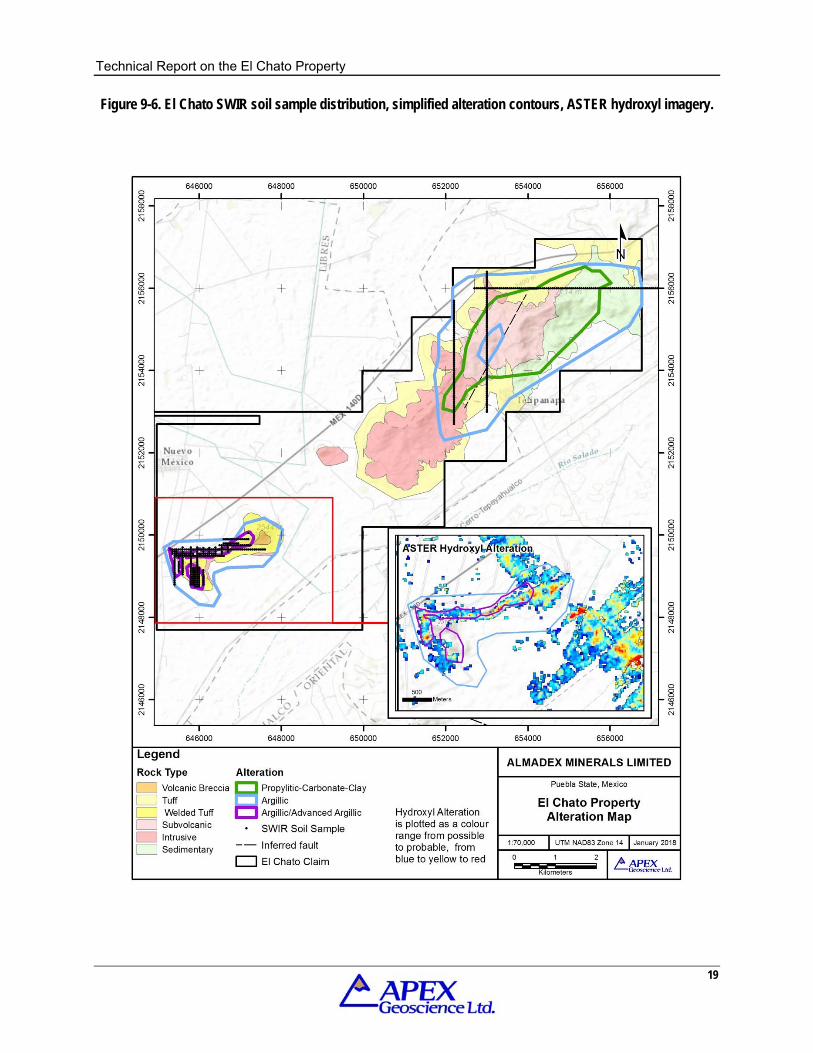
In general, four to five “centers” of advanced argillic alteration may be defined for the Southwest Ridges (Figure 9-7, 9-8). These advanced argillic alteration centers seem to be spatially related to higher white mica crystallinity values, that is, higher white mica crystallinity values are regularly located adjacent or in the vicinity of advance argillic alteration zones frontier (Figure 9-7). Pyrophyllite, a mineral indicator of higher temperature (+280 °C) in high-sulfidation epithermal systems (Harrison, 2013), is found in at least three centers of advanced argillic alteration, suggesting closer proximity to hydrothermal fluids sours or conduits (Figure 9-8). However, data density is still low and more samples would be needed for defining relationships between hydrothermal fluid conduits, advanced argillic alteration and white mica SWIR crystallinity within the Property.
Technical Report on the El Chato Property
18
Figure 9-5. Simplified representation of a zoned alteration pattern in porphyry-epithermal systems, used during interpretation of TerraSpec® data to predict the vectors (white, grey and green arrows) to the location of porphyry and epithermal ore deposits (Harrison, 2013).
Technical Report on the El Chato Property
19
Figure 9-6. El Chato SWIR soil sample distribution, simplified alteration contours, ASTER hydroxyl imagery.
Technical Report on the El Chato Property
20
Figure 9-7. El Chato, Southwest Ridges. SWIR soil sample detailed alteration contours and white mica crystallinity.
Technical Report on the El Chato Property
21
Figure 9-8. El Chato, Southwest Ridges. SWIR soil sample detailed alteration contours and advanced argillic alteration mineral distribution.
Technical Report on the El Chato Property
22
9.4 Geophysics
Mexico has been covered regionally by geophysical surveys including aerial magnetometry and gravimetry since 1963 in areas that overlap the Property. Furthermore, since 2011, areas of interest have been covered by several stages of conventional ground IP/resistivity geophysics.
9.4.1 Regional Airborne Magnetics and Gravimetry
Mexico has been covered by regional geophysical surveys including airborne magnetics and gravimetry surveys since 1963 by the SGM (Mexican Geological Survey) and partners. This data show gravimetric and magnetic anomalies along the TMVB magmatic arc.
Gravimetric anomalies within the TMVB suggest that there is an increase in crust thickness from the Mexican Pacific coast to the interior where the Earth’s crust reaches thickness between 40 and 45 km (Molina-Garza & Urrutia-Fucugauchi, 1993; Urrutia-Fucugauchi & Flores-Ruiz, 1996; García-Pérez & Urrutia-Fucugauchi, 1997; Campos-Enríquez & Sánchez-Zamora, 2000 In Del Bosque-Espinosa & Hidalgo-Moral, 2013). This thickness increase seems to have a relationship with the abundance of primitive magma along the TMVB (Wallace & Carmichael, 1999 In Del Bosque-Espinosa & Hidalgo-Moral, 2013).
The most recent publicly available compilation of magnetometry data, by the SGM was done with data collected up to 2009 and published in 2016 (https://www.gob.mx/sgm/acciones-y-programas/geofisica). This compilation was part of a joint collaboration between the SGM, the U.S. Geological Survey and the Geological Survey of Canada for compilation of geophysical data of North America, first published in 2002 (Bankey et al., 2002).
According to the SGM regional airborne, significant magnetic highs in the Eastern and central segment of the TMVB, where the Property is located, are evident (Figure 9-9). This area is part of the E14-3 magnetic chart (Veracruz) which was flown using a Geometric G-822A magnetometer at 300 m elevation on NS strikes separated 1,000 m with control lines every 10,000 m. This magnetic chart was first published in 1997 and most recent data dates from 2005 (SGM, 2005). Magnetic anomalies within this quadrangle include anomalies at the Property. These magnetic anomalies are coincident with copper-gold soil anomalies within the Northeast Ridge.
Technical Report on the El Chato Property
23
Figure 9-9. Regional airborne magnetometry covering El Chato mining claim (original data compiled by Mexican Geological Survey SGM, 2005 and redrawn by APEX, 2018)
Technical Report on the El Chato Property
24
9.4.2 Ground Geophysics
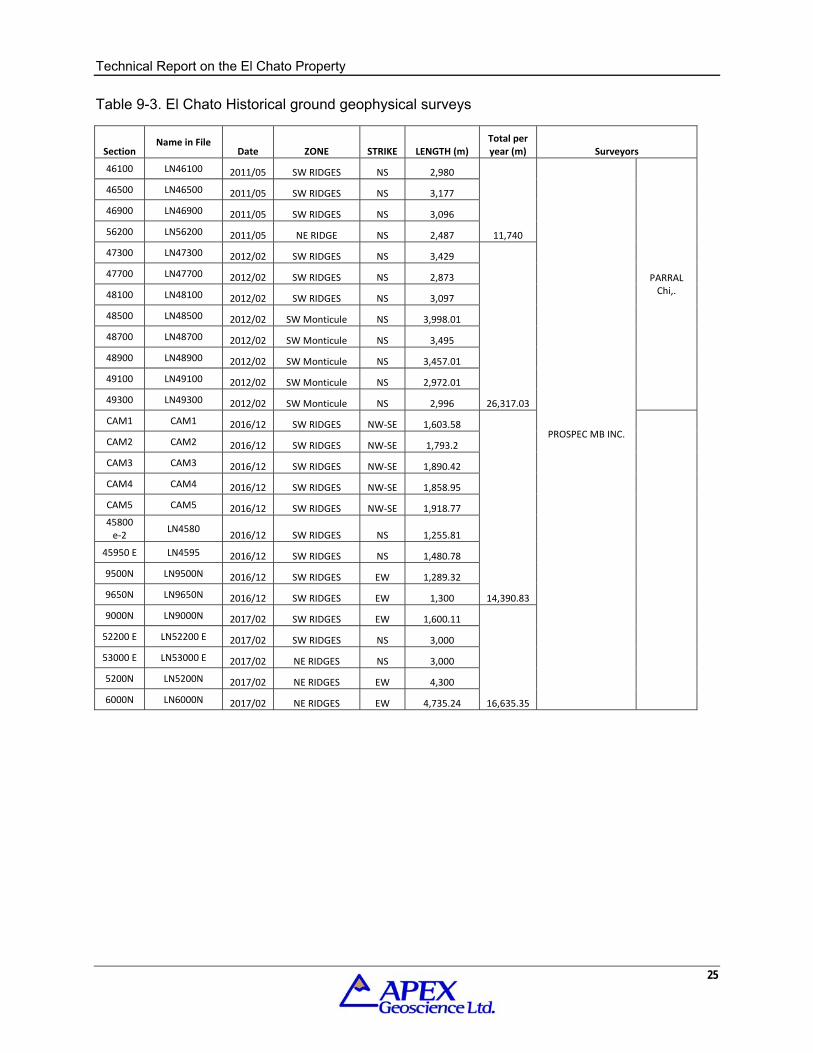
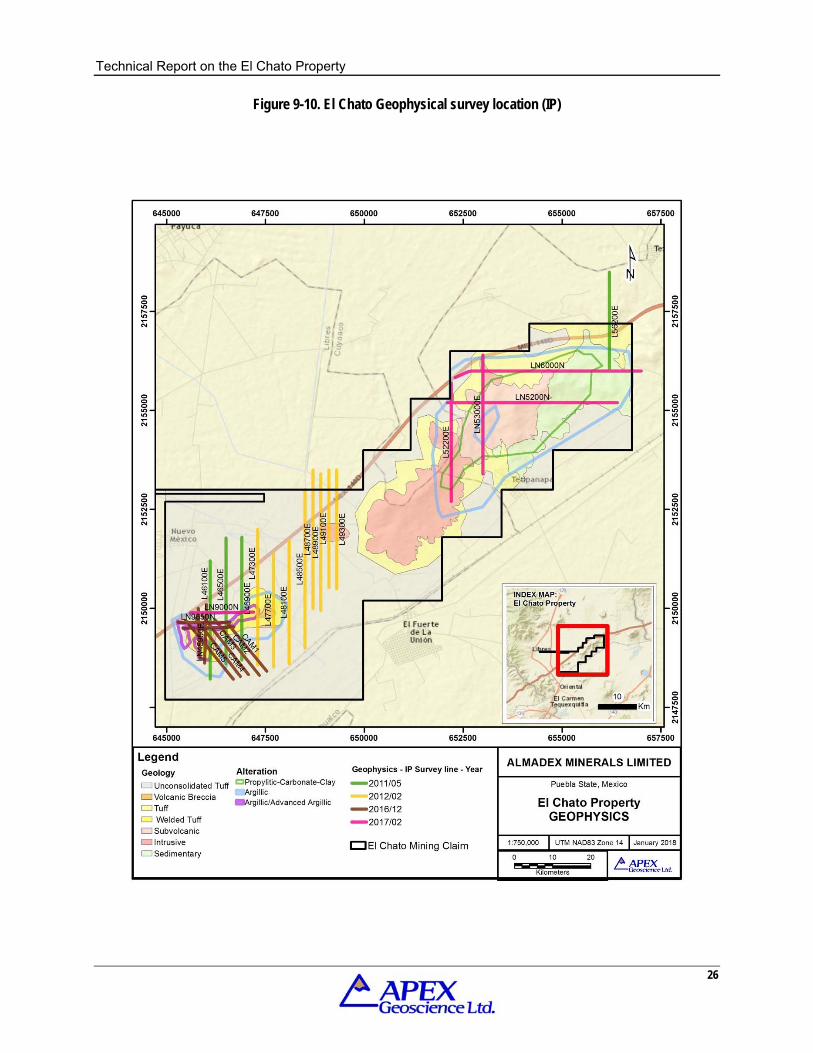
9.4.2.1 Induced Polarization / Resistivity
The El Chato Property has been partially covered by ground conventional IP/resistivity surveys targeting strategic zones. IP geophysics was carried out by Prospec MB Inc. (“Prospec MB”) and Parral Chi. between 2011 and 2012 and by Prospec MB between 2016 and 2017 along several survey lines parallel to soil surveys and a few trending northwest-southeast survey lines (Table 9.3). The total accumulated length for these surveys is approximately 69 km (Figure 9.10).
A pole-dipole array was used with an “a” spacing of 100 m and “n” separations of 1 to 8. Twenty six lines were completed, covering strategic zones, including:
1. The Northeast Ridge, which was covered through 3 discrete north-south linear surveys and 2 east-west linear surveys, spaced in an area of 2,000 ha.
2. The Central Monticule, which was covered through a series of north-south lines spaced approximately ~ 200 m.
3. The Southwest Ridges were covered through north-south surveys, spaced ~ 400 m in between, as well as partially overlapping to the west, through east-west surveys, spaced ~ 200 m in average, and southeast striking surveys, spaced ~ 200 m in average.
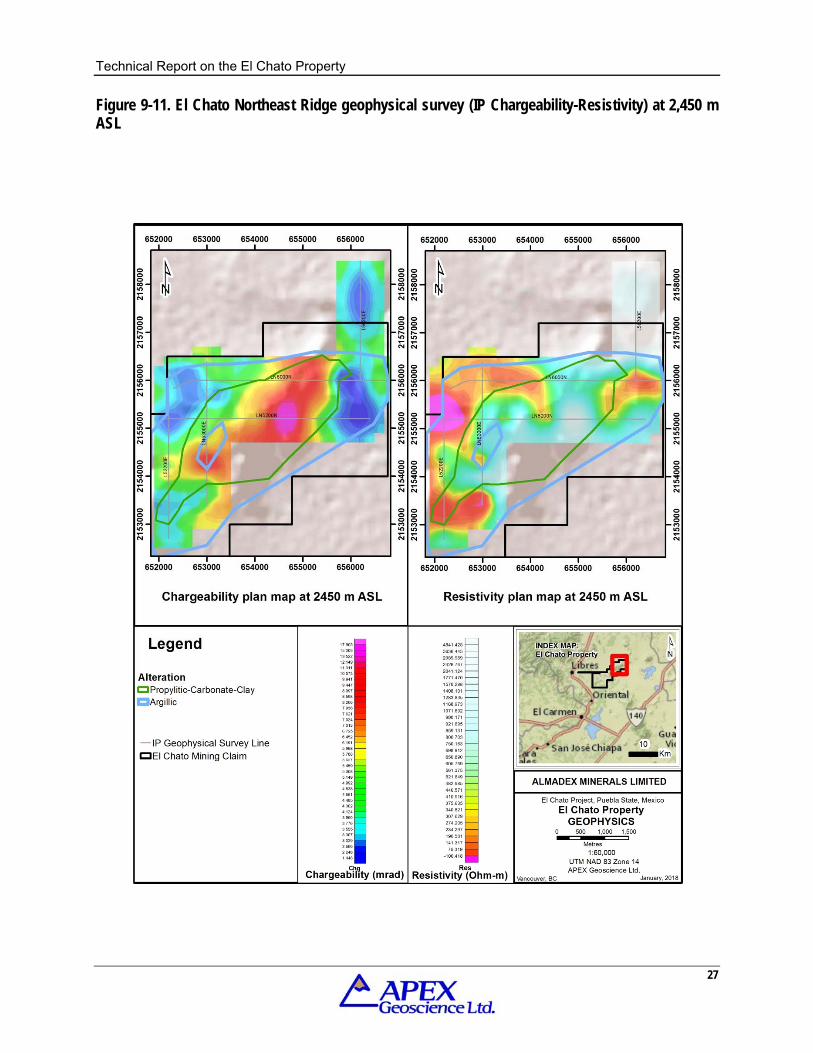
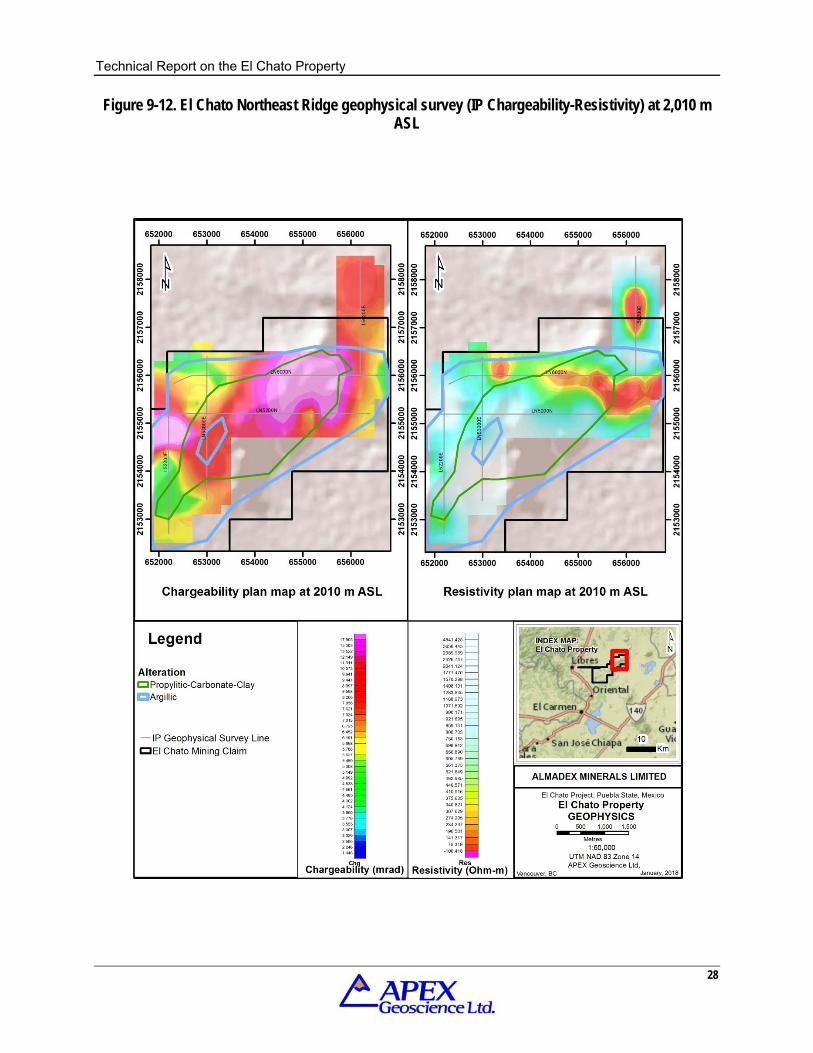
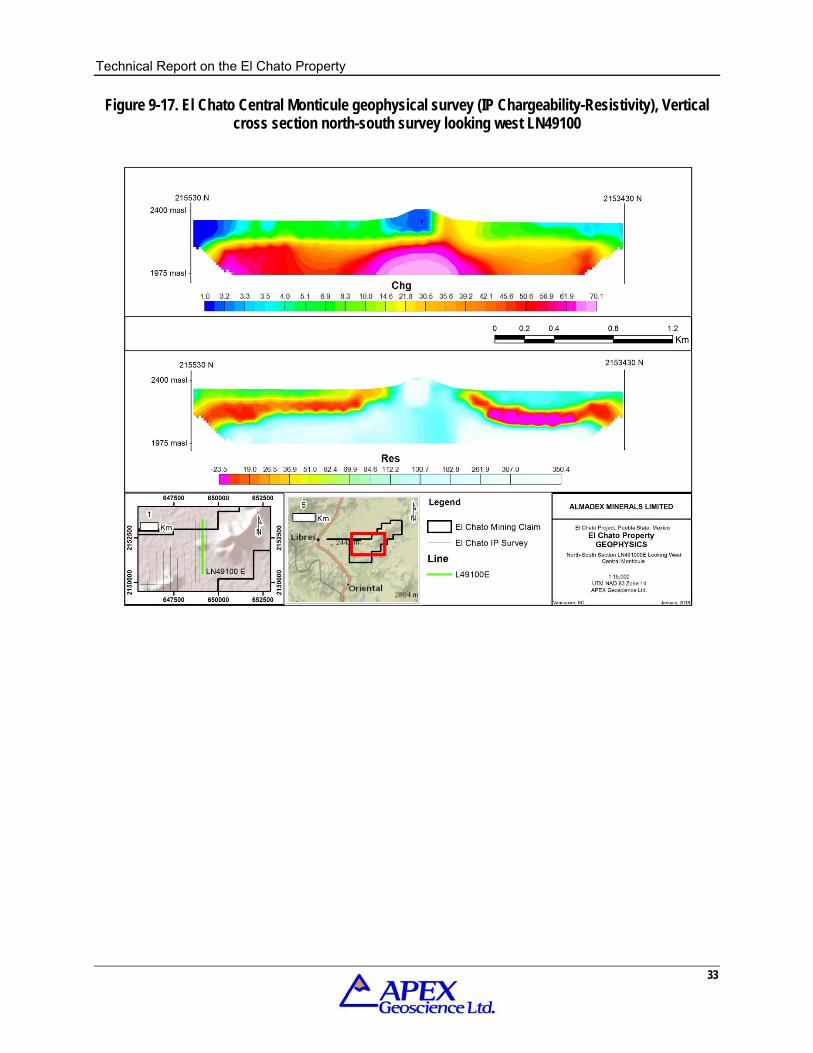
Regional interpretation and IP inversion of the area that was covered by the geophysical lines allows for development of geophysical inversion models. Based on the density of information, one general IP inversion model was created for the Northeast Ridge and another IP inversion model was created for the area covering the Central Monticule and the Southwest Ridges.
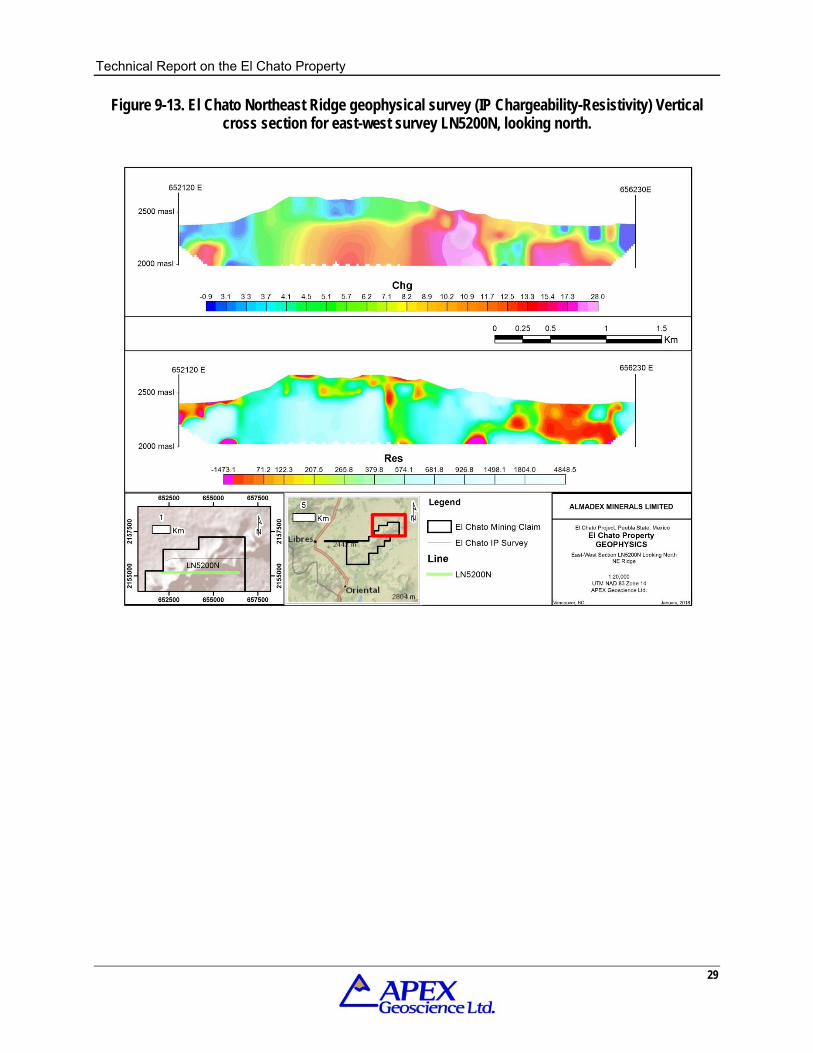
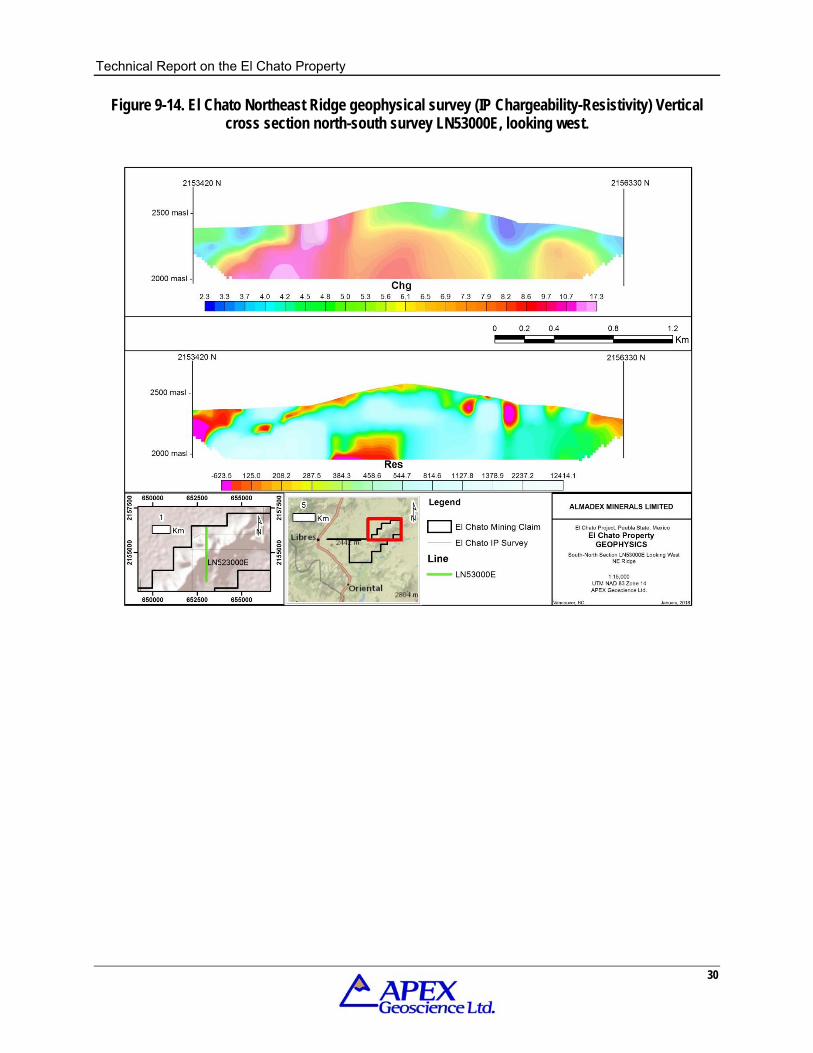
In the Northeast Ridge, chargeability is moderate close to surface and increases with depth, particularly coincident with the ridge relief (Figures 9.11, 9.12, 9.13, 9.14). At depth, within the Northeastern segments of this Northeast Ridge, at the 2,010 m above sea level (ASL), a high chargeability and contrasting low resistivity response is apparent. The coincidence of these features, together with copper/multi-element geochemical anomalies at surface, makes the Northeast Ridge an interesting target for further exploration.
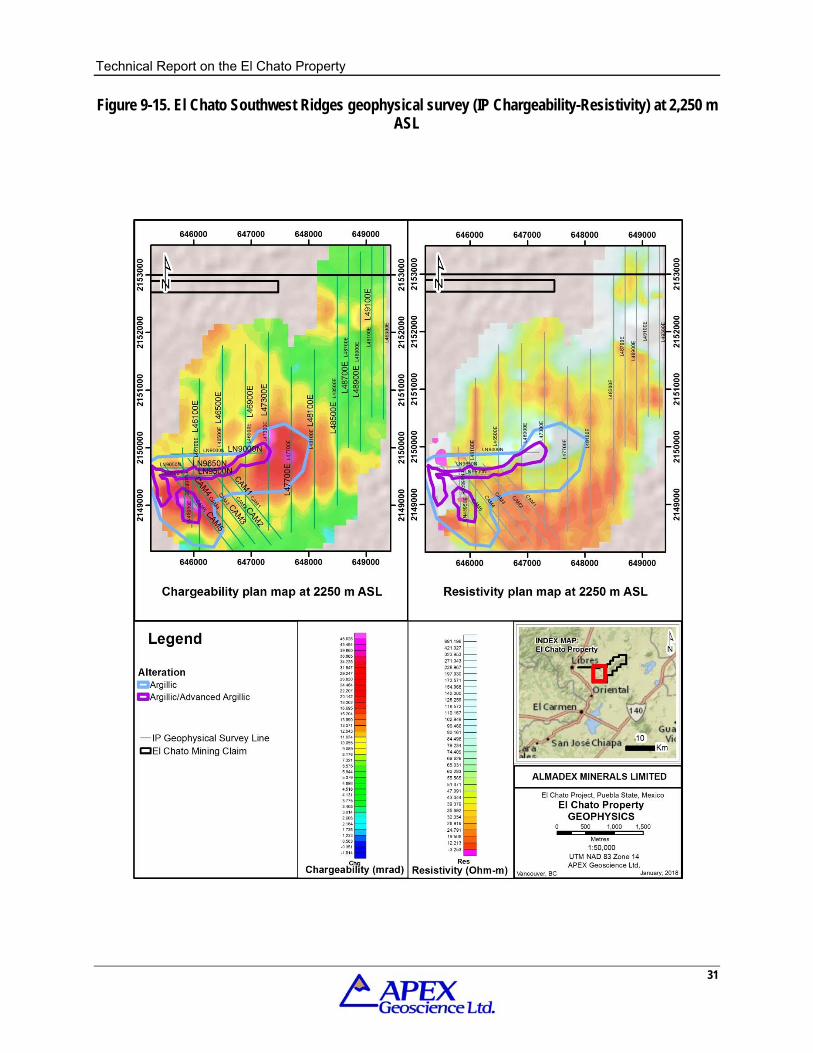
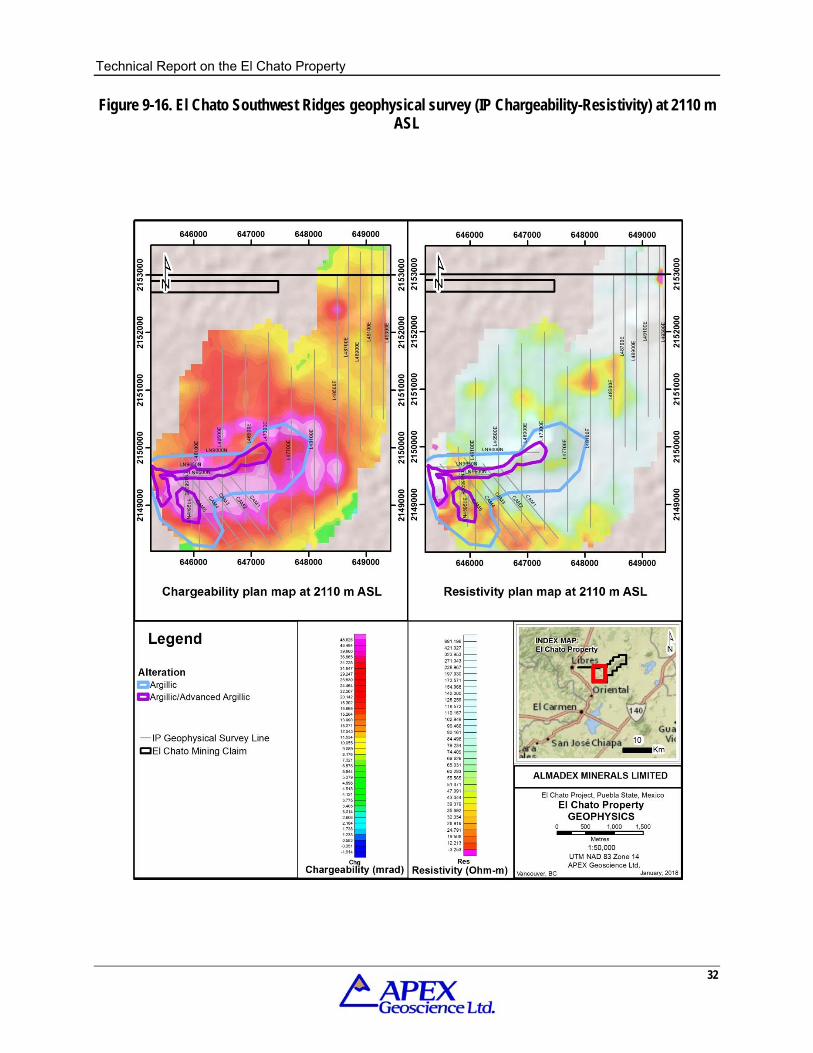
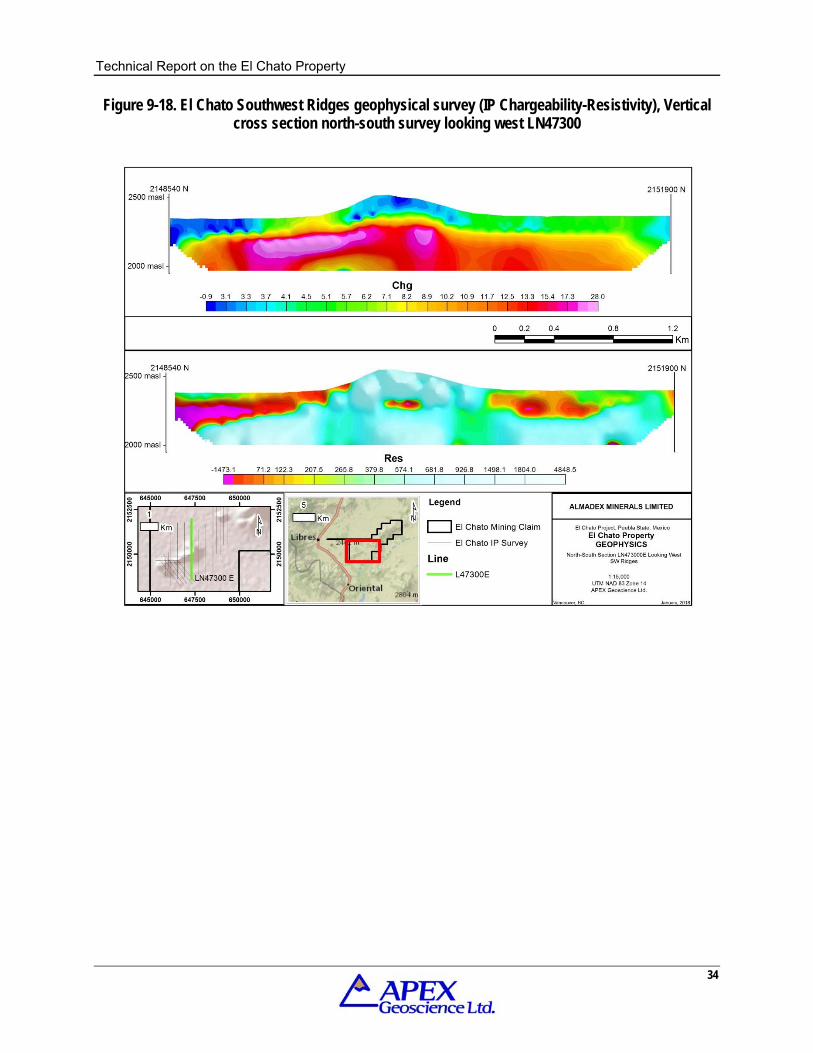
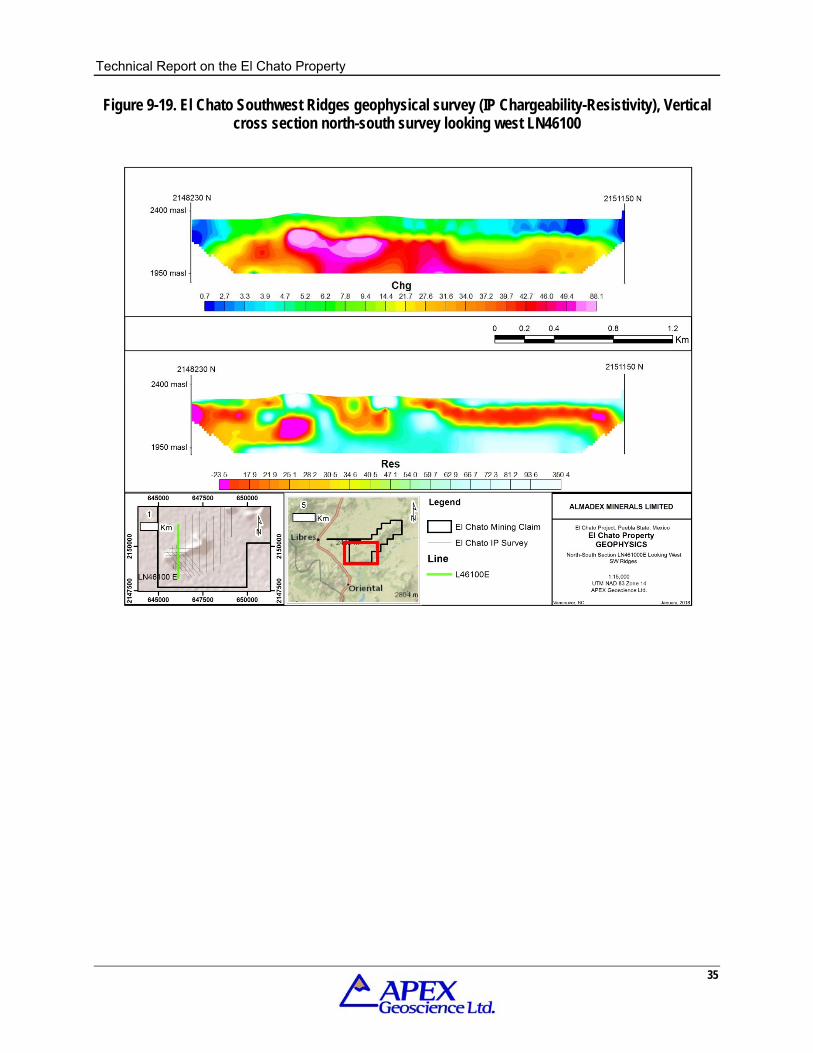
The 3D inversion geophysical model developed for the Central Monticule and the Southwest Ridges exhibits anomalies of interest (Figures 9.14, 9.15, 9.16, 9.17, 9.18, and 9.19). The Central Monticule shows zones of high chargeability at depth which are coincident with copper-silver-gold anomalies at surface and the occurrence of an intrusive body cropping out at surface. In the Southwest Ridges, zones of high chargeability and contrasting low/high resistivity anomalies are located below the area in which hydroxyl and advanced argillic alteration have been detected (Figures 9.14, 9.15). These geophysical anomalies in the Southwest Ridges are coincident with arsenic geochemical anomalies defined from soil sampling. Thus, this area can be considered an interesting target for testing deep seated epithermal style mineralization.
Technical Report on the El Chato Property
25
Table 9-3. El Chato Historical ground geophysical surveys
Section
Name in File Date ZONE STRIKE LENGTH (m)
Total per year (m) Surveyors
46100 LN46100 2011/05 SW RIDGES NS 2,980
11,740
PROSPEC MB INC.
PARRAL Chi,.
46500 LN46500 2011/05 SW RIDGES NS 3,177
46900 LN46900 2011/05 SW RIDGES NS 3,096
56200 LN56200 2011/05 NE RIDGE NS 2,487
47300 LN47300 2012/02 SW RIDGES NS 3,429
26,317.03
47700 LN47700 2012/02 SW RIDGES NS 2,873
48100 LN48100 2012/02 SW RIDGES NS 3,097
48500 LN48500 2012/02 SW Monticule NS 3,998.01
48700 LN48700 2012/02 SW Monticule NS 3,495
48900 LN48900 2012/02 SW Monticule NS 3,457.01
49100 LN49100 2012/02 SW Monticule NS 2,972.01
49300 LN49300 2012/02 SW Monticule NS 2,996
CAM1 CAM1 2016/12 SW RIDGES NW‐SE 1,603.58
14,390.83
CAM2 CAM2 2016/12 SW RIDGES NW‐SE 1,793.2
CAM3 CAM3 2016/12 SW RIDGES NW‐SE 1,890.42
CAM4 CAM4 2016/12 SW RIDGES NW‐SE 1,858.95
CAM5 CAM5 2016/12 SW RIDGES NW‐SE 1,918.77
45800 e‐2
LN4580 2016/12 SW RIDGES NS 1,255.81
45950 E LN4595 2016/12 SW RIDGES NS 1,480.78
9500N LN9500N 2016/12 SW RIDGES EW 1,289.32
9650N LN9650N 2016/12 SW RIDGES EW 1,300
9000N LN9000N 2017/02 SW RIDGES EW 1,600.11
16,635.35
52200 E LN52200 E 2017/02 SW RIDGES NS 3,000
53000 E LN53000 E 2017/02 NE RIDGES NS 3,000
5200N LN5200N 2017/02 NE RIDGES EW 4,300
6000N LN6000N 2017/02 NE RIDGES EW 4,735.24
Technical Report on the El Chato Property
26
Figure 9-10. El Chato Geophysical survey location (IP)
Technical Report on the El Chato Property
27
Figure 9-11. El Chato Northeast Ridge geophysical survey (IP Chargeability-Resistivity) at 2,450 m ASL
Technical Report on the El Chato Property
28
Figure 9-12. El Chato Northeast Ridge geophysical survey (IP Chargeability-Resistivity) at 2,010 m ASL
Technical Report on the El Chato Property
29
Figure 9-13. El Chato Northeast Ridge geophysical survey (IP Chargeability-Resistivity) Vertical cross section for east-west survey LN5200N, looking north.
Technical Report on the El Chato Property
30
Figure 9-14. El Chato Northeast Ridge geophysical survey (IP Chargeability-Resistivity) Vertical cross section north-south survey LN53000E, looking west.
Technical Report on the El Chato Property
31
Figure 9-15. El Chato Southwest Ridges geophysical survey (IP Chargeability-Resistivity) at 2,250 m ASL
Technical Report on the El Chato Property
32
Figure 9-16. El Chato Southwest Ridges geophysical survey (IP Chargeability-Resistivity) at 2110 m ASL
Technical Report on the El Chato Property
33
Figure 9-17. El Chato Central Monticule geophysical survey (IP Chargeability-Resistivity), Vertical cross section north-south survey looking west LN49100
Technical Report on the El Chato Property
34
Figure 9-18. El Chato Southwest Ridges geophysical survey (IP Chargeability-Resistivity), Vertical cross section north-south survey looking west LN47300
Technical Report on the El Chato Property
35
Figure 9-19. El Chato Southwest Ridges geophysical survey (IP Chargeability-Resistivity), Vertical cross section north-south survey looking west LN46100
Technical Report on the El Chato Property
36
10 Drilling
No drilling has been conducted on the Property as of the Effective Date.
Technical Report on the El Chato Property
37
11 Sample Preparation, Analyses and Security
11.1 Sample Preparation and Analyses
11.1.1 Rock Grab, Soil and Silt Geochemical Samples
Rock grab, soil and silt geochemical samples were bagged in the field either in poly bags or in micropore bags for humid soil samples by Minera Gavilan’s personnel. From the field, samples were transported to the Ixtaca project facilities for storage prior to transportation. The Ixtaca project is located 8 km northwest of the town of San Francisco Ixtacamaxtitlán, the county seat of the municipality of Ixtacamaxtitlán, Puebla State. In preparation for shipping, samples were placed into plastic twine (rice) sacks and sealed using locking plastic cable ties.
Custody of samples is handed over to ALS at the Ixtaca project’s Santa Maria sample storage facility. ALS sends its own trucks to Ixtaca’s facilities for picking up samples and transporting them to its sample preparation facility in Zacatecas, Mexico. Prepared sample pulps were then forwarded by ALS personnel to ALS laboratories in North Vancouver, British Columbia for analysis. The author of this report considers the measures emplaced in the chain of custody of samples to be sufficient, for this stage of the project.
ALS is an International Standards Organization (ISO) 9001:2008 and ISO 17025-2005 certified geochemical analysis and assaying laboratory. ALS is independent of Almadex and the authors.
At ALS Zacatecas sample preparation facilities, rock grab samples were dried prior to preparation and then crushed to 10 mesh (70% minimum pass) using a jaw crusher. The samples were then split using a riffle splitter, and sample splits were further crushed to pass 200 mesh (85% minimum pass) using a ring mill pulverizer (ALS PREP-31 procedure). Soil and silt samples were dried and sieved to 80 mesh.
Rock grab samples are subject to gold determination via a 50 gram (“g”) fire-assay (“FA”) fusion utilizing atomic absorption spectroscopy (“AA”) finish with a lower detection limit of 0.005 ppm gold (5 ppb) and upper limit of 10 ppm gold (ALS method Au-AA24). Silver, base metal and pathfinder elements are analyzed by 33-element inductively coupled plasma atomic emission spectroscopy (ICP-AES), with a 4-acid digestion (ALS method ME-ICP61).
Soil and stream samples were analyzed for gold via aqua-regia digestion of a 50 g sample utilizing and ICP-MS finish with a lower detection limit of 0.1 ppb gold and an upper limit of 100 ppb gold (ALS “ultra-trace” method Au-ST44).
Silver, base metal and pathfinder elements for soils were analyzed by 48-element inductively coupled plasma atomic absorption spectroscopy (ICP-AES), with a 4-acid digestion (ALS method ME-MS61). For stream samples they were analyzed by 51-element inductively coupled plasma atomic absorption spectroscopy (ICP-AES), with aqua regia digestion (ALS method ME-MS41).
Technical Report on the El Chato Property
38
11.1.2 Soil Samples for SWIR Analysis
Soil samples for spectral analysis were mostly taken as close to altered bedrock as possible in order to increase the detection rate of hypogene alteration minerals over weathering ones. Base of the C horizon was the preferred as target horizon and clay-rich soil with rock chip fragments from the bedrock was considered the best media. However, when soil profiles were very deep, clay-rich soil samples from the base of B or B/C transition were used. Sampling in alluvial zones was avoided to ensure spectral data was reflecting in situ, bedrock anomalism. Samples were stored in micropore bags in order to allow for drying. Drying samples helps avoid interference in the water range of the spectra which affects mineral crystallinity calculations.
Absorption spectra were obtained with an ASD Inc (ASD) unit TerraSpec® SWIR spectrometer. The TerraSpec® requires calibrating with a clean, white Spectralon disk every 20 samples. Representative portions of the rock or soil sample were analysed. Portions of the samples that contained higher than average concentrations of quartz, sulfides or magnetite were avoided to minimize reductions in the spectral response by these opaque minerals. Spectra were acquired using RS3 software linked to the TerraSpec®. Calibration was done at the beginning of the session and every half an hour. White reference was collected every 200 readings, dark current every 40 readings. Each scan lasted 20 seconds.
The author verified reliability of data by analyzing samples through TerraSpec® using a similar methodology described above for spectra collection using scan duration of 60 seconds. Spectrum was analyzed by peak search and spectrum match through SpecMin-Pro ASD database. According to this analysis, the altered “bleached” rock sample that was analyzed exhibits illite/illite montmorillonite alteration (Figure 11.1).
11.1.3 Author’s Rock Grab Samples
Rock grab samples collected by Kristopher J. Raffle, P.Geo., were placed into sealed plastic bags and submitted to the ALS preparation laboratory in Zacatecas. Prepared sample pulps were then forwarded by ALS personnel to ALS laboratories in North Vancouver, British Columbia for gold FA and ICP-MS analysis.
The samples were dried prior to preparation and then crushed to 10 mesh (70% minimum pass) using a jaw crusher. The samples were then split using a riffle splitter, and sample splits were further crushed to pass 200 mesh (85% minimum pass) using a ring mill pulverizer (ALS PREP-31 procedure).
Rock samples collected by the author were subject to gold determination via a 50 g AA finish FA fusion with a lower detection limit of 0.005 ppm gold (5 ppb) and upper limit of 10 ppm gold (ALS method Au-AA24).
Silver, base metal and pathfinder elements for rock and soil samples were analyzed by 33-element ICP-AES, with a four acid digestion (ALS method ME-ICP61).
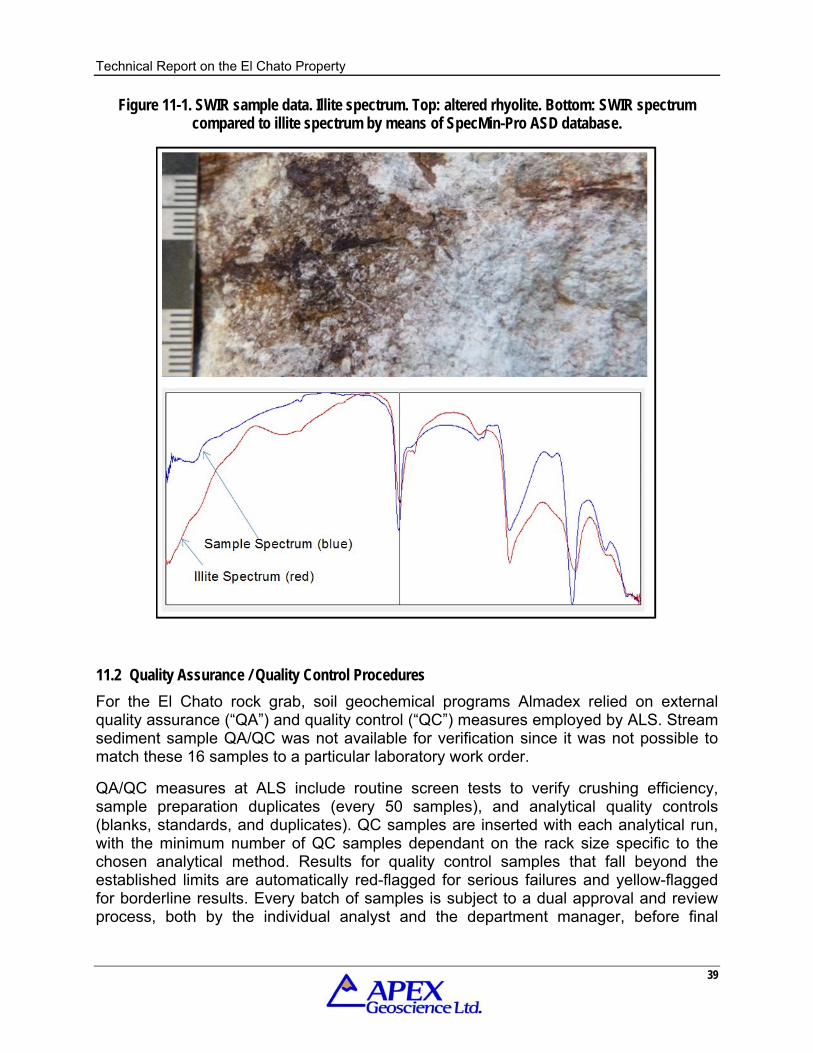
Technical Report on the El Chato Property
39
Figure 11-1. SWIR sample data. Illite spectrum. Top: altered rhyolite. Bottom: SWIR spectrum compared to illite spectrum by means of SpecMin-Pro ASD database.
11.2 Quality Assurance / Quality Control Procedures
For the El Chato rock grab, soil geochemical programs Almadex relied on external quality assurance (“QA”) and quality control (“QC”) measures employed by ALS. Stream sediment sample QA/QC was not available for verification since it was not possible to match these 16 samples to a particular laboratory work order.
QA/QC measures at ALS include routine screen tests to verify crushing efficiency, sample preparation duplicates (every 50 samples), and analytical quality controls (blanks, standards, and duplicates). QC samples are inserted with each analytical run, with the minimum number of QC samples dependant on the rack size specific to the chosen analytical method. Results for quality control samples that fall beyond the established limits are automatically red-flagged for serious failures and yellow-flagged for borderline results. Every batch of samples is subject to a dual approval and review process, both by the individual analyst and the department manager, before final
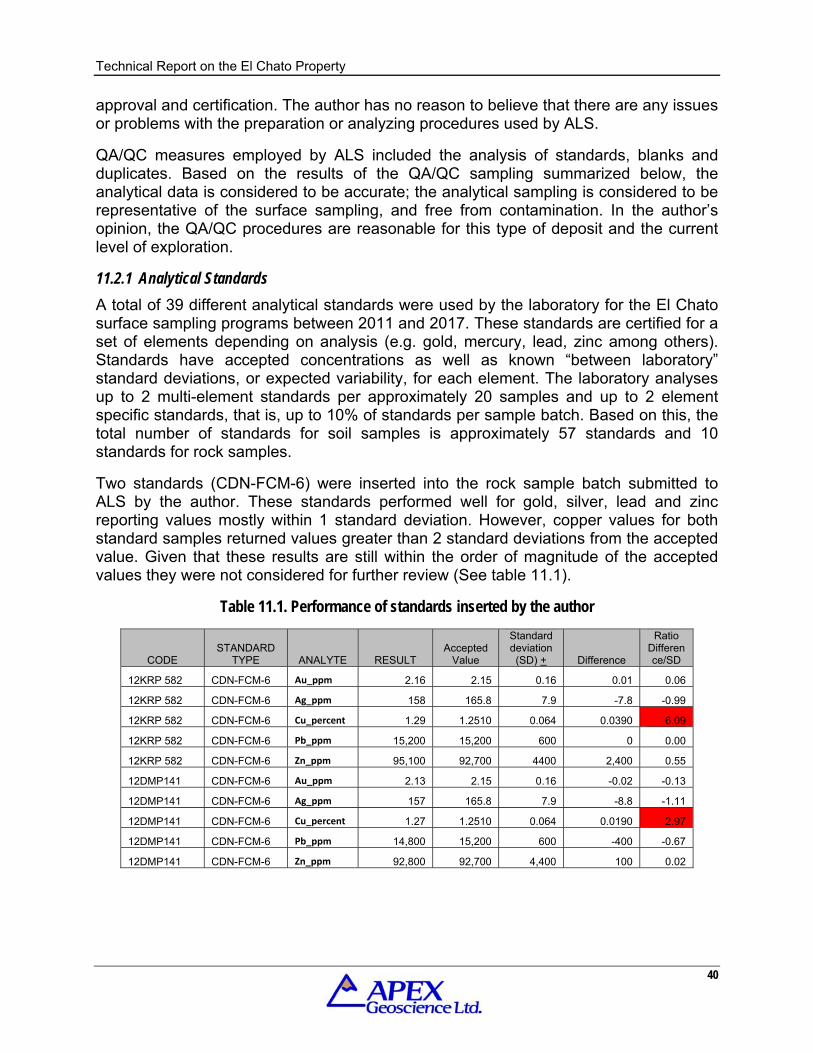
Technical Report on the El Chato Property
40
approval and certification. The author has no reason to believe that there are any issues or problems with the preparation or analyzing procedures used by ALS.
QA/QC measures employed by ALS included the analysis of standards, blanks and duplicates. Based on the results of the QA/QC sampling summarized below, the analytical data is considered to be accurate; the analytical sampling is considered to be representative of the surface sampling, and free from contamination. In the author’s opinion, the QA/QC procedures are reasonable for this type of deposit and the current level of exploration.
11.2.1 Analytical Standards
A total of 39 different analytical standards were used by the laboratory for the El Chato surface sampling programs between 2011 and 2017. These standards are certified for a set of elements depending on analysis (e.g. gold, mercury, lead, zinc among others). Standards have accepted concentrations as well as known “between laboratory” standard deviations, or expected variability, for each element. The laboratory analyses up to 2 multi-element standards per approximately 20 samples and up to 2 element specific standards, that is, up to 10% of standards per sample batch. Based on this, the total number of standards for soil samples is approximately 57 standards and 10 standards for rock samples.
Two standards (CDN-FCM-6) were inserted into the rock sample batch submitted to ALS by the author. These standards performed well for gold, silver, lead and zinc reporting values mostly within 1 standard deviation. However, copper values for both standard samples returned values greater than 2 standard deviations from the accepted value. Given that these results are still within the order of magnitude of the accepted values they were not considered for further review (See table 11.1).
Table 11.1. Performance of standards inserted by the author
CODE STANDARD
TYPE ANALYTE RESULTAccepted
Value
Standard deviation (SD) + Difference
Ratio Difference/SD
12KRP 582 CDN-FCM-6 Au_ppm 2.16 2.15 0.16 0.01 0.06
12KRP 582 CDN-FCM-6 Ag_ppm 158 165.8 7.9 -7.8 -0.99
12KRP 582 CDN-FCM-6 Cu_percent 1.29 1.2510 0.064 0.0390 6.09
12KRP 582 CDN-FCM-6 Pb_ppm 15,200 15,200 600 0 0.00
12KRP 582 CDN-FCM-6 Zn_ppm 95,100 92,700 4400 2,400 0.55
12DMP141 CDN-FCM-6 Au_ppm 2.13 2.15 0.16 -0.02 -0.13
12DMP141 CDN-FCM-6 Ag_ppm 157 165.8 7.9 -8.8 -1.11
12DMP141 CDN-FCM-6 Cu_percent 1.27 1.2510 0.064 0.0190 2.97
12DMP141 CDN-FCM-6 Pb_ppm 14,800 15,200 600 -400 -0.67
12DMP141 CDN-FCM-6 Zn_ppm 92,800 92,700 4,400 100 0.02
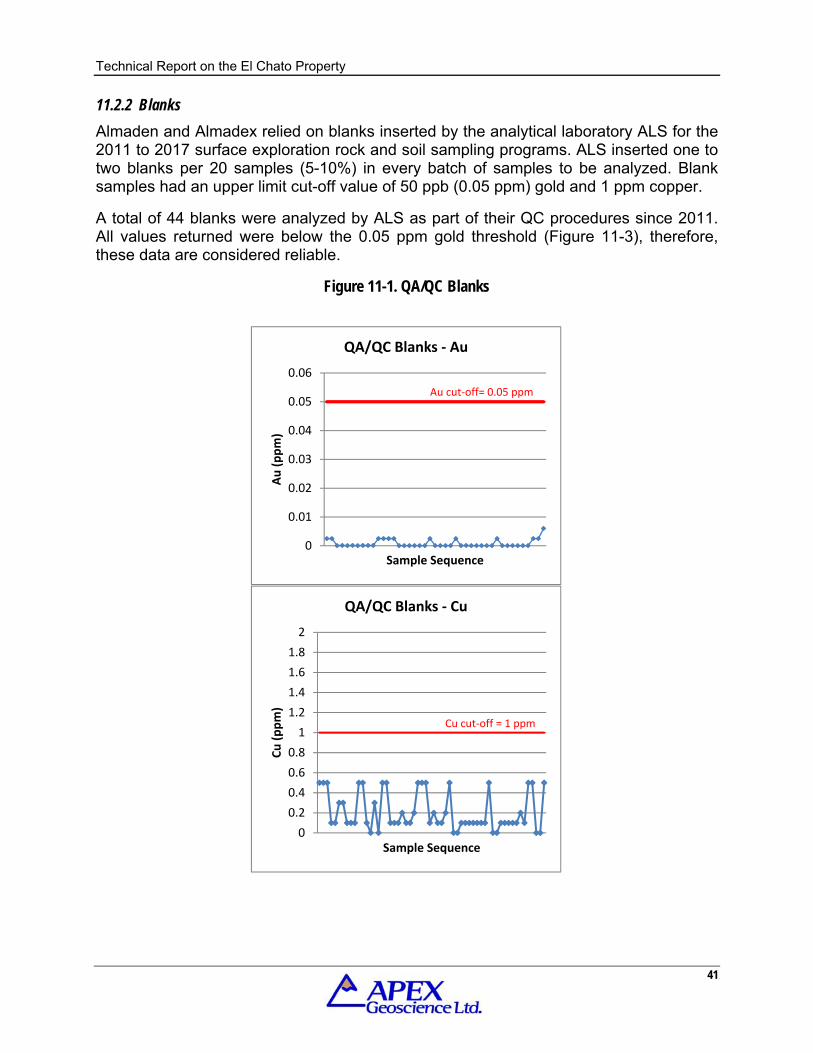
Technical Report on the El Chato Property
41
11.2.2 Blanks
Almaden and Almadex relied on blanks inserted by the analytical laboratory ALS for the 2011 to 2017 surface exploration rock and soil sampling programs. ALS inserted one to two blanks per 20 samples (5-10%) in every batch of samples to be analyzed. Blank samples had an upper limit cut-off value of 50 ppb (0.05 ppm) gold and 1 ppm copper.
A total of 44 blanks were analyzed by ALS as part of their QC procedures since 2011. All values returned were below the 0.05 ppm gold threshold (Figure 11-3), therefore, these data are considered reliable.
Figure 11-1. QA/QC Blanks
0
0.01
0.02
0.03
0.04
0.05
0.06
Au (ppm)
Sample Sequence
QA/QC Blanks ‐ Au
Au cut‐off= 0.05 ppm
0
0.2
0.4
0.6
0.8
1
1.2
1.4
1.6
1.8
2
Cu (ppm)
Sample Sequence
QA/QC Blanks ‐ Cu
Cu cut‐off = 1 ppm
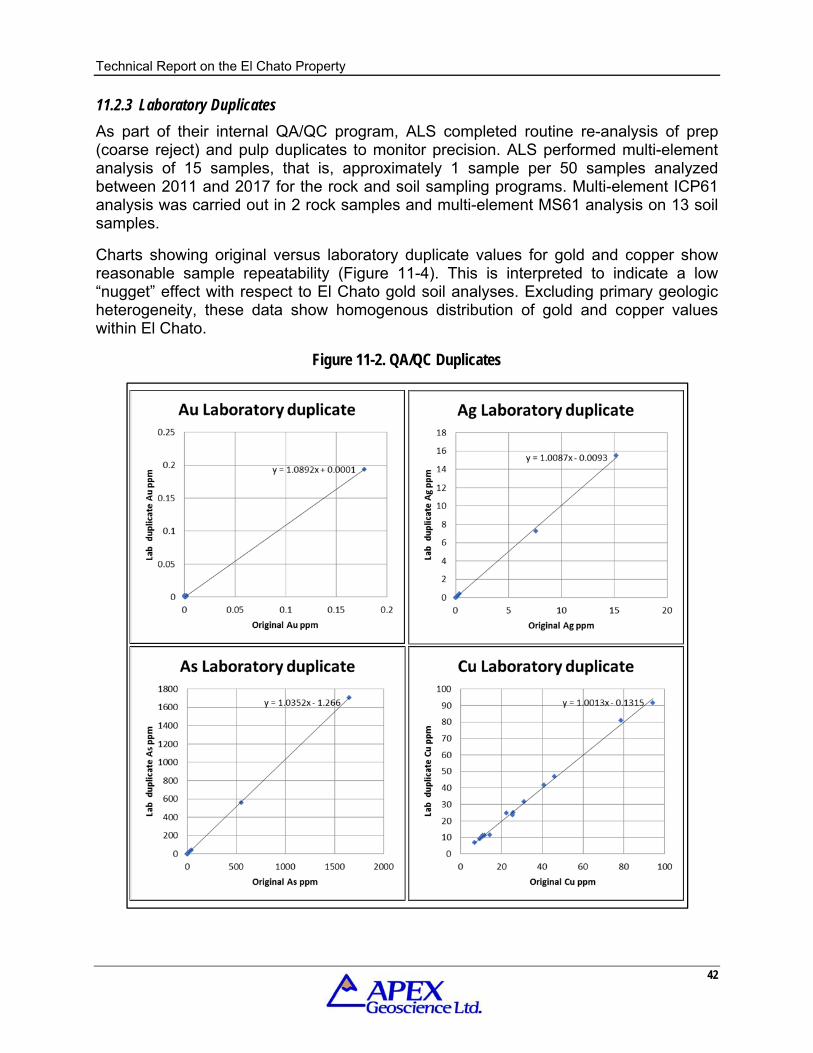
Technical Report on the El Chato Property
42
11.2.3 Laboratory Duplicates
As part of their internal QA/QC program, ALS completed routine re-analysis of prep (coarse reject) and pulp duplicates to monitor precision. ALS performed multi-element analysis of 15 samples, that is, approximately 1 sample per 50 samples analyzed between 2011 and 2017 for the rock and soil sampling programs. Multi-element ICP61 analysis was carried out in 2 rock samples and multi-element MS61 analysis on 13 soil samples.
Charts showing original versus laboratory duplicate values for gold and copper show reasonable sample repeatability (Figure 11-4). This is interpreted to indicate a low “nugget” effect with respect to El Chato gold soil analyses. Excluding primary geologic heterogeneity, these data show homogenous distribution of gold and copper values within El Chato.
Figure 11-2. QA/QC Duplicates
Technical Report on the El Chato Property
43
12 Data Verification
The author conducted a reconnaissance of the Property in 2012 to assess the property initially and in September, 2017 the author returned to verify the reported exploration results. The author completed a traverse along the Northeast Ridge, the Central Monticule and the Southwest Ridges and collected surface rock grab samples for data verification purposes. All information was forwarded to Almaden and Almadex for inclusion into their rock sample database and results were used for exploration and the Report. Results for gold, silver, arsenic and copper of the author’s rock grab samples collected in 2012 and 2017 are presented in Table 12-1.
Standards inserted by the author are discussed in section 11.2.1: “Analytical Standards”. Based on the results of grab-rock samples from traverses within the area visited by the author, the author has no reason to doubt the reported exploration results. Slight variation in assays is expected due to variable distribution of ore minerals within the area but the analytical data is considered to be representative of the surface samples.
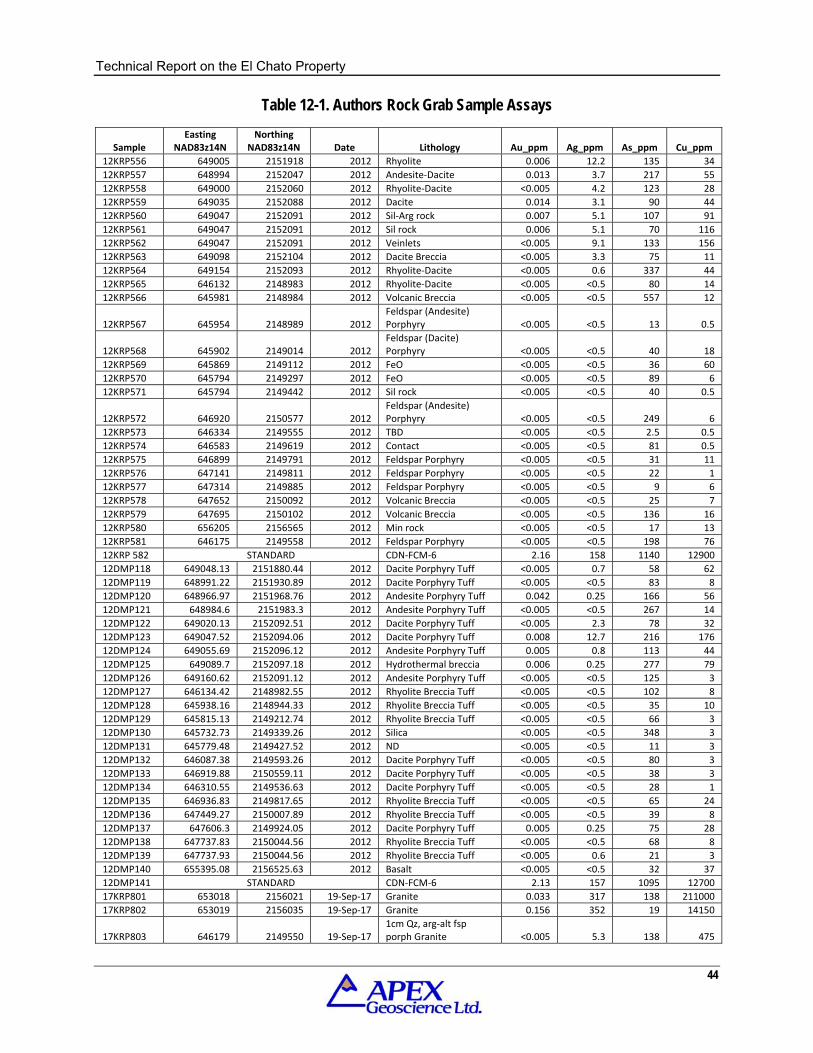
Technical Report on the El Chato Property
44
Table 12-1. Authors Rock Grab Sample Assays
Sample Easting
NAD83z14N Northing
NAD83z14N Date Lithology Au_ppm Ag_ppm As_ppm Cu_ppm
12KRP556 649005 2151918 2012 Rhyolite 0.006 12.2 135 34
12KRP557 648994 2152047 2012 Andesite‐Dacite 0.013 3.7 217 55
12KRP558 649000 2152060 2012 Rhyolite‐Dacite <0.005 4.2 123 28
12KRP559 649035 2152088 2012 Dacite 0.014 3.1 90 44
12KRP560 649047 2152091 2012 Sil‐Arg rock 0.007 5.1 107 91
12KRP561 649047 2152091 2012 Sil rock 0.006 5.1 70 116
12KRP562 649047 2152091 2012 Veinlets <0.005 9.1 133 156
12KRP563 649098 2152104 2012 Dacite Breccia <0.005 3.3 75 11
12KRP564 649154 2152093 2012 Rhyolite‐Dacite <0.005 0.6 337 44
12KRP565 646132 2148983 2012 Rhyolite‐Dacite <0.005 <0.5 80 14
12KRP566 645981 2148984 2012 Volcanic Breccia <0.005 <0.5 557 12
12KRP567 645954 2148989 2012 Feldspar (Andesite) Porphyry <0.005 <0.5 13 0.5
12KRP568 645902 2149014 2012 Feldspar (Dacite) Porphyry <0.005 <0.5 40 18
12KRP569 645869 2149112 2012 FeO <0.005 <0.5 36 60
12KRP570 645794 2149297 2012 FeO <0.005 <0.5 89 6
12KRP571 645794 2149442 2012 Sil rock <0.005 <0.5 40 0.5
12KRP572 646920 2150577 2012 Feldspar (Andesite) Porphyry <0.005 <0.5 249 6
12KRP573 646334 2149555 2012 TBD <0.005 <0.5 2.5 0.5
12KRP574 646583 2149619 2012 Contact <0.005 <0.5 81 0.5
12KRP575 646899 2149791 2012 Feldspar Porphyry <0.005 <0.5 31 11
12KRP576 647141 2149811 2012 Feldspar Porphyry <0.005 <0.5 22 1
12KRP577 647314 2149885 2012 Feldspar Porphyry <0.005 <0.5 9 6
12KRP578 647652 2150092 2012 Volcanic Breccia <0.005 <0.5 25 7
12KRP579 647695 2150102 2012 Volcanic Breccia <0.005 <0.5 136 16
12KRP580 656205 2156565 2012 Min rock <0.005 <0.5 17 13
12KRP581 646175 2149558 2012 Feldspar Porphyry <0.005 <0.5 198 76
12KRP 582 STANDARD CDN‐FCM‐6 2.16 158 1140 12900
12DMP118 649048.13 2151880.44 2012 Dacite Porphyry Tuff <0.005 0.7 58 62
12DMP119 648991.22 2151930.89 2012 Dacite Porphyry Tuff <0.005 <0.5 83 8
12DMP120 648966.97 2151968.76 2012 Andesite Porphyry Tuff 0.042 0.25 166 56
12DMP121 648984.6 2151983.3 2012 Andesite Porphyry Tuff <0.005 <0.5 267 14
12DMP122 649020.13 2152092.51 2012 Dacite Porphyry Tuff <0.005 2.3 78 32
12DMP123 649047.52 2152094.06 2012 Dacite Porphyry Tuff 0.008 12.7 216 176
12DMP124 649055.69 2152096.12 2012 Andesite Porphyry Tuff 0.005 0.8 113 44
12DMP125 649089.7 2152097.18 2012 Hydrothermal breccia 0.006 0.25 277 79
12DMP126 649160.62 2152091.12 2012 Andesite Porphyry Tuff <0.005 <0.5 125 3
12DMP127 646134.42 2148982.55 2012 Rhyolite Breccia Tuff <0.005 <0.5 102 8
12DMP128 645938.16 2148944.33 2012 Rhyolite Breccia Tuff <0.005 <0.5 35 10
12DMP129 645815.13 2149212.74 2012 Rhyolite Breccia Tuff <0.005 <0.5 66 3
12DMP130 645732.73 2149339.26 2012 Silica <0.005 <0.5 348 3
12DMP131 645779.48 2149427.52 2012 ND <0.005 <0.5 11 3
12DMP132 646087.38 2149593.26 2012 Dacite Porphyry Tuff <0.005 <0.5 80 3
12DMP133 646919.88 2150559.11 2012 Dacite Porphyry Tuff <0.005 <0.5 38 3
12DMP134 646310.55 2149536.63 2012 Dacite Porphyry Tuff <0.005 <0.5 28 1
12DMP135 646936.83 2149817.65 2012 Rhyolite Breccia Tuff <0.005 <0.5 65 24
12DMP136 647449.27 2150007.89 2012 Rhyolite Breccia Tuff <0.005 <0.5 39 8
12DMP137 647606.3 2149924.05 2012 Dacite Porphyry Tuff 0.005 0.25 75 28
12DMP138 647737.83 2150044.56 2012 Rhyolite Breccia Tuff <0.005 <0.5 68 8
12DMP139 647737.93 2150044.56 2012 Rhyolite Breccia Tuff <0.005 0.6 21 3
12DMP140 655395.08 2156525.63 2012 Basalt <0.005 <0.5 32 37
12DMP141 STANDARD CDN‐FCM‐6 2.13 157 1095 12700
17KRP801 653018 2156021 19‐Sep‐17 Granite 0.033 317 138 211000
17KRP802 653019 2156035 19‐Sep‐17 Granite 0.156 352 19 14150
17KRP803 646179 2149550 19‐Sep‐17 1cm Qz, arg‐alt fsp porph Granite <0.005 5.3 138 475
Technical Report on the El Chato Property
45
13 Mineral Processing and Metallurgical Testing
No metallurgical testing analyses have been carried out on the Property as of the Effective Date.
Technical Report on the El Chato Property
46
14 Mineral Resource Estimates
No mineral resource estimates are available for the Property as of the Effective Date.
Technical Report on the El Chato Property
47
15 Adjacent Properties
The author has not visited properties immediately adjacent to the Property. The main mining activities in the area, as described in the section 6: “History”, correspond to aggregates processing plants, most of which are not operating at this point.
Based on information extracted from the Mexican mineral authority, other claims for precious metal exploration in the vicinity of the Property have been granted. Further information regarding exploration and mining activities from most claims is unknown, except for the Caldera exploration project, which is owned by Almadex and is not the subject of the Report.
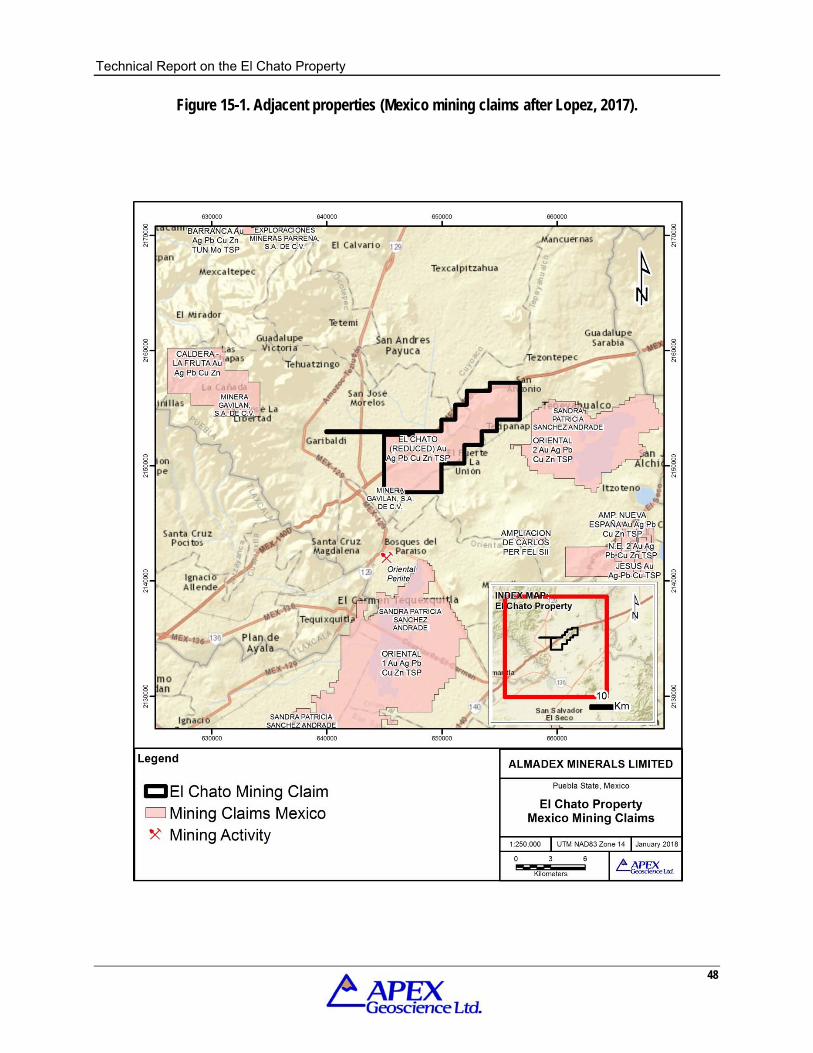
Technical Report on the El Chato Property
48
Figure 15-1. Adjacent properties (Mexico mining claims after Lopez, 2017).
Technical Report on the El Chato Property
49
16 Other Relevant Data and Information
The author is not aware of any other relevant information with respect to the Property that is not disclosed in the Report.
Technical Report on the El Chato Property
50
17 Interpretation and Conclusions
Between 2011 and 2017 Almaden and Almadex completed surface IP/resistivity geophysical surveys, rock, stream and soil geochemistry, and geologic mapping at the Property. Exploration has resulted in the definition of three areas of porphyry and epithermal copper-gold mineralization known as the Northeast Ridge, the Central Monticule and the Southwest Ridges.
Surface mapping and soil geochemical surveys over the property defined three main anomalies:
1. Soil, rock multi-element copper, silver gold, lead, zinc, arsenic and antimony anomaly at the Northeast Ridge.
2. Soil and rock copper, gold, silver anomaly at the central monticule. 3. Soil arsenic-bismuth, rock molybdenum and stream sediment copper, silver
anomalies within the Southwest Ridges.
The multi-element copper anomalies at the Northeast Ridge are associated with felsic intrusive rocks (granites) in contact to felsic volcanic rocks exhibiting argillic (illite-montmorillonite), but also structurally controlled carbonate/argillic (siderite+-montmorillonite) alteration as well as propylitic (epidote-chlorite-carbonate) alteration, mostly in the vicinity of the contact to sedimentary rocks. Discrete structures showing copper bearing supergene minerals at surface (malachite, chrysochola), with selective samples exhibiting grades up to 21.1% copper, are consistent with this anomaly, possibly representing a distal porphyry environment. IP/resistivity 3D geophysical inversion model for this area defined zones of high chargeability at depths with moderate to high resistivity. The Central Monticule exhibits similar features as per rock types, including felsic intrusives and felsic volcanics.
The Southwest Ridges anomaly is outlined by highly mobile elements such as arsenic and bismuth mostly within felsic volcanic rocks and volcanic breccias. ASTER mapping has highlighted areas of hydroxyl within these ridges, consistent with surface mapping and SWIR soil analyses which defined contours of advanced argillic and argillic alterations. These alteration patterns are considered representative epithermal environments. Furthermore, IP/resistivity 3D inversion model for this area defined zones of high chargeability (in excess of 30 milliradians) in coincidence with low resistivity at depths between ~250-400 m below surface.
All these anomalies remain untested by drilling. Their features and consistency between rock types, geochemical anomalies and geophysical responses make these areas of merit for further follow up through diamond drilling exploration programs.
Exploration activities conducted by Almadex in the project area have been limited to geologic mapping, surface geochemical, and geophysical surveys. As of the effective date of this report, no mining operations have been carried out by Almadex in the Property and no mineral resources have been defined. Further studies are required in order to determine whether or not mineralization in the project is of economic significance. There can be no guarantee that further exploration will results in the discovery or definition of mineral resources of any category.
Technical Report on the El Chato Property
51
18 Recommendations
Based on the presence of porphyry copper and epithermal features exposed at surface including favourable lithology and alteration features coincident with chargeability geophysical anomalies as well as copper and gold and arsenic-bismuth soil geochemical anomalies; the El Chato Property is of a high priority for follow-up exploration.
The 2018 exploration program should include but not be limited to:
Soil sampling program at the Northeast Ridge for SWIR and geochemistry parallel to current lines for following up anomalies preliminarily defined. Three lines are proposed with a sample spacing of 50 m. The estimated number of samples is 220 samples, at $50.00 per soil sample (all-up) for a total cost of $11,000.00.
Soil sampling infill programs at the Southwest Ridges for SWIR and geochemistry analysis within areas anomalous in arsenic and coincident with advanced argillic hydrothermal alteration. Surveys of 25 m x 25 m grids and extension of the current soil grid in the Southwest Ridges to 200-300 m northeast are recommended. The estimated amount of soil samples is 500, at $50.00 per soil sample (all-up) for a total cost of $25,000.00.
Diamond drilling of approximately 14 holes totalling 7,000 m designed to test copper bearing/multi-element soil/rock geochemical anomalies at the Northeast Ridge and the Central Monticules as well as combined IP chargeability plus alteration features and arsenic-bismuth anomalies in the Southwest Ridges. Drilling should be carried out in two phases. The phase 2 exploration is contingent on the results of phase 1 exploration. Phase 1 drilling should include diamond drilling of an initial 8 holes totalling 4,000 m followed by phase 2 drilling of an additional 6 holes totalling 3,000 m. The estimated cost to complete phase 1 and phase 2 drilling is $770,000.00 (Table 16-1).
More specifically, the phase 1 exploration should include: 1) Six (6) holes totalling 3,000 m designed to target untested chargeability geophysical anomalies coincident with alteration features in the Southwest Ridges. 2) One (1) drill hole totalling 500 m designed to test the Central Monticule copper-gold-silver anomaly at depth. 3) One (1) drill hole totalling approximately 500 m designed to target the untested chargeability and copper multi-element soil anomaly located at the Northeast Ridge. 4) Six (6) holes totalling approximately 3,000 m designed to follow up on anomalies tested by phase 1 drilling in each zone (Figure 16-1).
Thus, the total budget proposed for the exploration program in 2018 at the Property is $795,000.00 (all-up).
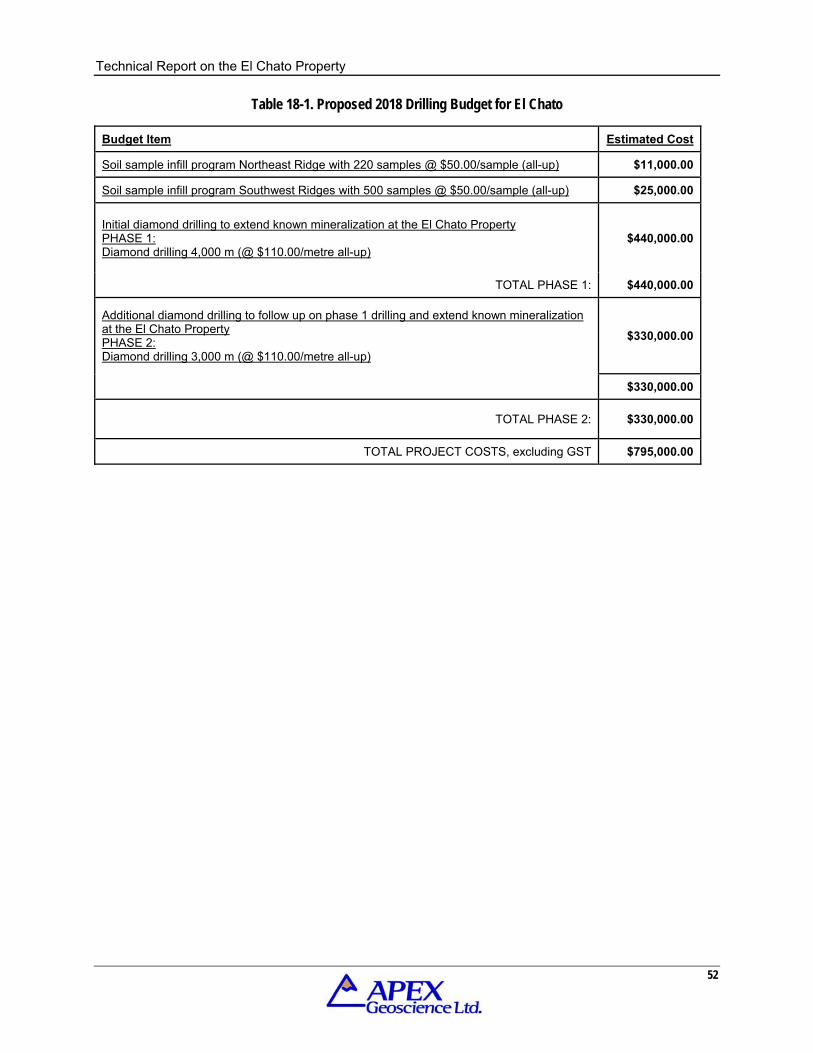
Technical Report on the El Chato Property
52
Table 18-1. Proposed 2018 Drilling Budget for El Chato
Budget Item Estimated Cost
Soil sample infill program Northeast Ridge with 220 samples @ $50.00/sample (all-up) $11,000.00
Soil sample infill program Southwest Ridges with 500 samples @ $50.00/sample (all-up) $25,000.00
Initial diamond drilling to extend known mineralization at the El Chato Property PHASE 1: Diamond drilling 4,000 m (@ $110.00/metre all-up)
$440,000.00
TOTAL PHASE 1: $440,000.00
Additional diamond drilling to follow up on phase 1 drilling and extend known mineralization at the El Chato Property PHASE 2: Diamond drilling 3,000 m (@ $110.00/metre all-up)
$330,000.00
$330,000.00
TOTAL PHASE 2: $330,000.00
TOTAL PROJECT COSTS, excluding GST $795,000.00
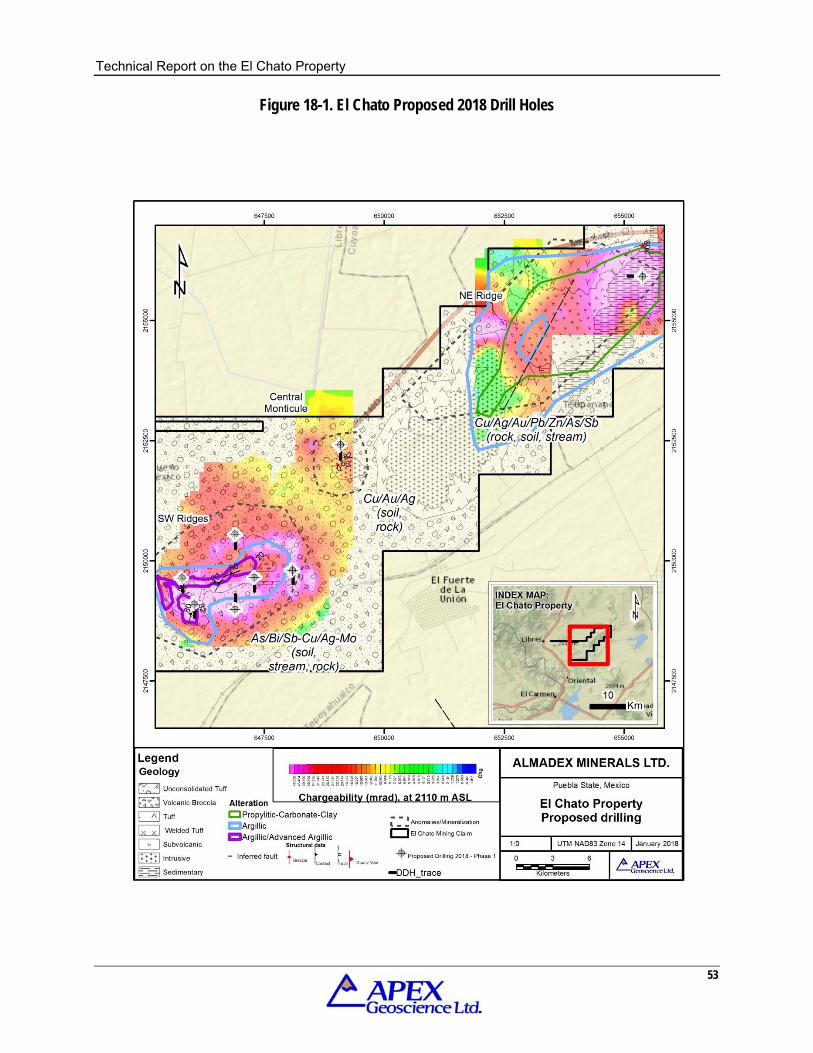
Technical Report on the El Chato Property
53
Figure 18-1. El Chato Proposed 2018 Drill Holes
Technical Report on the El Chato Property
54
19 References
Bankey, V., Cuevas, A., Daniels, D., Finn, C. A., Hernandez, I., Hill, P., Kucks, R., Miles, W., Pilkington, M., Roberts, C., Roest, W., Rystrom, V., Shearer, S., Snyder, S., Sweedney, R., Velez, J. 2002. Magnetic Anomaly Map of North America. Sponsored by Geological Survey of Canada, United States Geological Survey, Consejo de Recursos Minerales de México. Available at: https://www.gob.mx/sgm/acciones-y-programas/geofisica
Bellotti, F., Capra, L., Groppelli, G., Norini, G., 2006. Tectonic evolution of the central-eastern sector of trans MexicanVolcanic Belt and its influenceon the eruptive history of the Nevado de Toluca Volcano (Mexico). J. Volcanol. Geotherm. Res. 158 (1), 21–36
Campos-Enriquez J. O., Arroyo-Esquivel M. A. And Urrutia-Fucugauchi J. (1990) Basement, Curie isotherm and shallow-crustal structure of the Trans-Mexican Volcanic Belt, from aeromagnetic data. Tectonophysics 172, 77-90; In Del Bosque Espinosa, L., Hidalgo Moral, E. L. (2014). Estructura cortical del sector centro-este de la Faja Volcánica Trans-Mexicana mediante modelado de perfiles magnetométricos y gravimétricos. Tesis para obtener el tituloo de Ingeniero Geofisico. Universidad Nacional de Mexico.
Coller, D. (2011): Structure and Tectonics of the Ixtaca Epithermal Gold-Silver Vein System, Puebla, Mexico, A Preliminary Field Based Assessment, 15 p.
Del Bosque Espinosa, L., Hidalgo Moral, E. L. (2014). Estructura cortical del sector centro-este de la Faja Volcánica Trans-Mexicana mediante modelado de perfiles magnetométricos y gravimétricos. Tesis para obtener el titulo de Ingeniero Geofisico. Universidad Nacional de Mexico.
Ferrari, L., Tagami, T., Eguchi, M., Orozco-Esquivel, T., Petrone, C., Jacobo-Albarran, J., and López-Martinez, M. (2005): Geology, geochronology and tectonic setting of late Cenozoic volcanism along the Southwestern Gulf of Mexico: The Eastern Alkaline Province revisited; Journal of Volcanology and Geothermal Research, v. 146, p. 284-306.
Ferrari L., Orozco-Esquivel T., Manea V., Manea M. (2011): The dynamic history of the Trans-Mexican Volcanic Belt and the Mexico Subduction Zone. Tectonophysics, V 522-523, p. 122-149.
Fuentes-Peralta T., and Calderon M. C. (2008): Geological Monography of the State of Puebla, Mexico (in Spanish). Servicio Geologico Mexicano (SGM), 257 p.
García-Pérez, F., Urrutia-Fucugauchi, J. (1997). Crustal Structure of the Arteaga Complex, Michoacán Southern Mexico, form gravity and magnetic. Geofísica Internacional (1997), Vol 36, Num. 4, pp 235-244; In Del Bosque Espinosa, L., Hidalgo Moral, E. L. (2014). Estructura cortical del sector centro-este de la Faja Volcánica Trans-Mexicana mediante modelado de perfiles magnetométricos y
Technical Report on the El Chato Property
55
gravimétricos. Tesis para obtener el tituloo de Ingeniero Geofisico. Universidad Nacional de Mexico.
Gomez-Tuena, A., LaGatta, A., Langmuir, C., Goldstein, S., Ortega-Gutirrez, F., and Carraco-Nuñez, G. (2003): Temporal control of subduction magmatism in the Eastern Trans-Mexican volcanic belt: mantle sources, slab contributions and crystal contamination. Geochemistry, Geophysics, Geosystems, v. 4., no. 8, 33p.
Gomez-Tuena, A., Orozco-Esquivel, M., Ferrari, L. (2005). Petrogénesis ígnea de la Faja Volcánica Transmexicana. Boletín de la Sociedad Geológica Mexicana Volumen Conmemorativo del Centenario Temas Selectos de la Geología Mexicana Tomo LVII, núm. 3, 2005, p. 227-283.
Gomez-Tuena, A., Orozco-Esquivel, M., Ferrari, L. (2007): Igneous petrogenesis of the Trans-Mexican Volcanic Belt; Geological Society of America, Special Paper 422, p. 129-181.
Harrison, R. (2013). Application of TerraSpec Spectral Data in Exploration at Cascabel, Northern Ecuador.
Hedenquist, J.W., Arribas, A.R., Gonzalez-Urien, E. (2000): Exploration for Epithermal Gold Deposits; SEG Reviews, v. 13, p. 245-277.
Hurd, S., Carlson, G. (2012). News release. Blue Sky Uranium Corp. and Windstorm Resources Inc. Announce Agreement to Merge. Blue Sky Uranium Corp. and Windstorm Resources Inc. Available at https://www.sedar.com/
Lopez, S. 2017. Cartografía de concesiones mineras en el territorio nacional de SE, at https://datos.gob.mx/busca/dataset/cartografia-minera-de-se
Molina Garza., R., Urrutia-Fucugauchi, J. (1993). Deep Crustal Structure of Central Mexico derived from interpretation of Bouguer gravity anomaly data. Journal Of Geodynamics Vol. 17, No. 4, pp. 181-201, In Del Bosque Espinosa, L., Hidalgo Moral, E. L. (2014). Estructura cortical del sector centro-este de la Faja Volcánica Trans-Mexicana mediante modelado de perfiles magnetométricos y gravimétricos. Tesis para obtener el tituloo de Ingeniero Geofisico. Universidad Nacional de Mexico.
Orozco-Esquivel, T., Petrone, C.M., Ferrari, L., Tagami, T., and Manetti, P. (2007): Geochemical and isotopic variability in lavas from the Eastern Trans-Mexican Volcanic Belt: Slab detachment in a subduction zone with varying dip; Lithos, v. 93, p. 149-174.
Ortega-Gutierrez, F., Mitre-Salazar, L., Roldan-Quintana, J., Aranda-Gomez, J., Moran- Zenteno, D., Alaniz-Alvarez, S., and Nieto-Samaniego, A. (1992). Carta Geologica de la Republica Mexicana: Universidad Nacional Autonoma de Mexico, Instituto de Geologia; Secretaria de Minas e Industria Paraestatal, Consejo de Recursos Minerales, scale 1:2 000 000, 1 sheet, 74 p. text.
Technical Report on the El Chato Property
56
Panteleyev, A. (1995): Porphyry Cu-Au: (Alkalic); Selected British Columbia Mineral Deposit Profiles; BC Ministry of Energy and Mines Open File 1995-20, v. 1, p. 83-86.
Poliquin, M. J. (2009). Geology, Geochemistry and Age of Intrusion-Related Mineralisation in Eastern Mexico. Dissertation for the degree of Doctor of Philosophy by Research in Earth Resources. University of Exeter.
Secretaria de Economia de Mexico, Sistema Integrado de Aministracion Minera SIAM http://www.cartografia.economia.gob.mx/cartografia/#
Servicio Geologico Mexicano (SGM) GeoInfomex system –- https://www.sgm.gob.mx/GeoInfoMexGobMx/#
Servicio Geologico Mexicano (SGM) (2005). Carta Magnetica de Campo Total. Veracruz E14-3, Escala 1:250000. https://www.sgm.gob.mx/GeoInfoMexGobMx/
Servicio Geologico Mexicano (SGM) (2016). Panorama Minero del Estado de Puebla. Secretaria de Economia. Servicio Geologico Mexicano.
Sillitoe, R.H. (2010): Porphyry copper systems, Economic Geology, v. 105, pp. 3-41
Simmons, S.F., White, N.C., & John, D.A. (2005): Geologic Characteristics of Epithermal Precious and Base Metal Deposits; Economic Geology 100th Anniversary Volume, p. 485–522.
Terry, D. (2010). News release. Windstorm Options Mexican Gold Project from Almaden Minerals. Windstorm Resources Inc. Available at https://www.sedar.com/
Urrutia-Fucugauchi, J., Flores-Ruiz, J. (1996). Bouguer Gravity Anomalies and Regional Crustal Structure in Central Mexico. International Geology Review. Vol. 38 p 176-194; In Del Bosque Espinosa, L., Hidalgo Moral, E. L. (2014). Estructura cortical del sector centro-este de la Faja Volcánica Trans-Mexicana mediante modelado de perfiles magnetométricos y gravimétricos. Tesis para obtener el tituloo de Ingeniero Geofisico. Universidad Nacional de Mexico.
White N.C., and Hedenquist J.W. (1995): Epithermal Gold Deposits: Styles, Characteristics and Exploration. Society of Economic Geologists (SEG), Number 23, 6 p.
Technical Report on the El Chato Property
57
20 Certificate of Author
20.1 Kristopher J. Raffle Certificate of Author
I, Kristopher J. Raffle, residing in Vancouver British Columbia, do hereby certify that:
1. I am a Principal of APEX Geoscience Ltd. (“APEX”), 110, 8429 – 24 Street, Edmonton, Alberta, Canada.
2. I am the author and am responsible for all sections of this Technical Report entitled: “Technical Report on the El Chato Property, Puebla, Mexico”, and dated April 6th, 2018 (the “Technical Report”).
3. I am a graduate of The University of British Columbia, Vancouver, British Columbia with a B.Sc. in Geology (2000) and have practiced my profession continuously since 2000. I have supervised numerous exploration programs specific to porphyry copper-gold and epithermal gold-silver deposits having similar geologic characteristics to the El Chato Property throughout British Columbia, Canada and Mexico. I am a Professional Geologist registered with APEGBC (Association of Professional Engineers and Geoscientists of British Columbia) and I am a ‘Qualified Person’ in relation to the subject matter of this Technical Report.
4. I visited the Property that is the subject of this Report on visits on September 23rd and 24th, 2012, and September 19th, 2017. I have no prior involvement with the Property.
5. I am independent of Almadex Minerals Ltd. and Minera Gavilán S.A. de C.V., applying all of the tests in section 1.5 of National Instrument 43-101. I have not received, nor do I expect to receive, any interest, directly or indirectly, in Almaden Minerals Ltd. or Minera Gavilán S.A. de C.V.. I am not aware of any other information or circumstance that could interfere with my judgment regarding the preparation of the Technical Report.
7. I have read and understand National Instrument 43-101 and Form 43-101 F1 and the Report has been prepared in compliance with the instrument.
8. To the best of my knowledge, information and belief, the Technical Report contains all scientific and technical information that is required to be disclosed to make the Technical Report not misleading.
9. I consent to the filing of the Technical Report with any stock exchange and other regulatory authority and any publication by them, including electronic publication in the public company files on their websites accessible by the public, of the Technical Report.
Dated this April 6th, 2018
Vancouver, British Columbia, Canada
Kristopher J. Raffle, B.Sc., P.Geo.