MTEP17 MVP Triennial Review MVP Triennial Review Report117065.pdfThe previous MVP Triennial Review...
50
2017 MVP TRIENNIAL REVIEW REPORT 1 MTEP17 MVP Triennial Review A 2017 review of the public policy, economic, and qualitative benefits of the Multi-Value Project Portfolio September 2017
Transcript of MTEP17 MVP Triennial Review MVP Triennial Review Report117065.pdfThe previous MVP Triennial Review...
2017 MVP TRIENNIAL REVIEW REPORT
1
MTEP17 MVP Triennial Review
A 2017 review of the public policy, economic, and qualitative benefits of the
Multi-Value Project Portfolio
September 2017
2017 MVP TRIENNIAL REVIEW REPORT
2
Table of Contents Executive Summary .................................................................................................................................... 4
1. Study Purpose and Drivers .............................................................................................................. 10
2. Study Background ............................................................................................................................ 11
3. MTEP17 MVP Review Model Development ..................................................................................... 15
3.1 Economic Models .....................................................................................................15
3.2 Capacity Expansion Models .....................................................................................17
3.3 Reliability Models ......................................................................................................17
3.4 Capacity Import Limit Models ..................................................................................18
3.5 Loss of Load Expectation Models ...........................................................................18
4. Project Costs and In-Service Dates ................................................................................................ 19
5. Portfolio Public Policy Assessment ................................................................................................ 21
5.1 Wind Curtailment ......................................................................................................21
5.2 Wind Enabled ............................................................................................................21
6. Portfolio Economic Analysis ........................................................................................................... 23
6.1 Congestion and Fuel Savings ..................................................................................25
6.2 Operating Reserves ..................................................................................................28
6.3 Planning Reserve Margin Requirements .................................................................29
6.4 Transmission Line Losses .......................................................................................30
6.5 Wind Turbine Investment .........................................................................................31
6.6 Future Transmission Investment .............................................................................33
7. Qualitative and Social Benefits........................................................................................................ 35
7.1 Enhanced Generation Flexibility ..............................................................................35
7.2 Increased System Robustness ................................................................................36
7.3 Decreased Natural Gas Risk ....................................................................................36
7.4 Decreased Wind Generation Volatility .....................................................................37
7.5 Local Investment and Jobs Creation .......................................................................39
7.6 Carbon Reduction .....................................................................................................39
8. Historical Data Review ...................................................................................................................... 40
8.1 Introduction ...............................................................................................................40
8.2 Congestion Costs and Energy Prices .....................................................................40
8.3 Fuel Costs .................................................................................................................44

2017 MVP TRIENNIAL REVIEW REPORT
3
8.4 Planning Reserve Margin Requirements .................................................................46
8.5 Newly Interconnected Resources ............................................................................46
8.6 Share of Energy Supplied ........................................................................................47
8.7 Conclusions ..............................................................................................................49
9. Conclusions and Going Forward..................................................................................................... 50
2017 MVP TRIENNIAL REVIEW REPORT
4
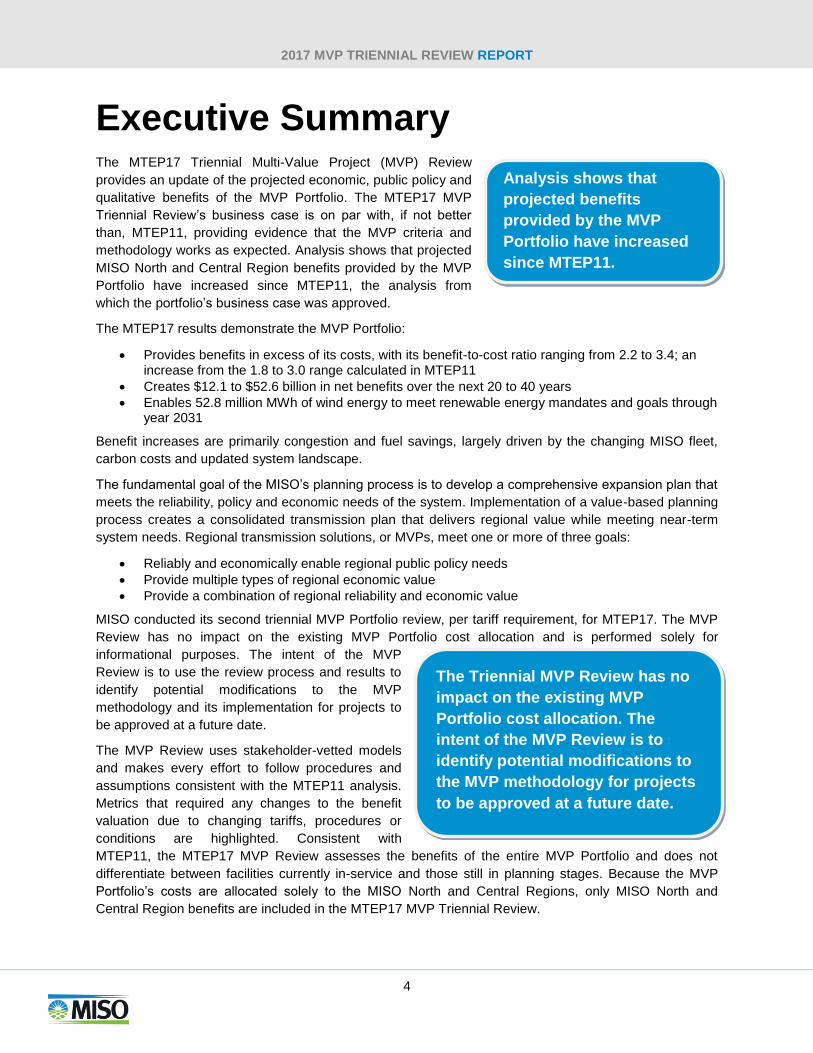
Executive Summary The MTEP17 Triennial Multi-Value Project (MVP) Review
provides an update of the projected economic, public policy and
qualitative benefits of the MVP Portfolio. The MTEP17 MVP
Triennial Review’s business case is on par with, if not better
than, MTEP11, providing evidence that the MVP criteria and
methodology works as expected. Analysis shows that projected
MISO North and Central Region benefits provided by the MVP
Portfolio have increased since MTEP11, the analysis from
which the portfolio’s business case was approved.
The MTEP17 results demonstrate the MVP Portfolio:
Provides benefits in excess of its costs, with its benefit-to-cost ratio ranging from 2.2 to 3.4; an increase from the 1.8 to 3.0 range calculated in MTEP11
Creates $12.1 to $52.6 billion in net benefits over the next 20 to 40 years
Enables 52.8 million MWh of wind energy to meet renewable energy mandates and goals through year 2031
Benefit increases are primarily congestion and fuel savings, largely driven by the changing MISO fleet,
carbon costs and updated system landscape.
The fundamental goal of the MISO’s planning process is to develop a comprehensive expansion plan that
meets the reliability, policy and economic needs of the system. Implementation of a value-based planning
process creates a consolidated transmission plan that delivers regional value while meeting near-term
system needs. Regional transmission solutions, or MVPs, meet one or more of three goals:
Reliably and economically enable regional public policy needs
Provide multiple types of regional economic value
Provide a combination of regional reliability and economic value
MISO conducted its second triennial MVP Portfolio review, per tariff requirement, for MTEP17. The MVP
Review has no impact on the existing MVP Portfolio cost allocation and is performed solely for
informational purposes. The intent of the MVP
Review is to use the review process and results to
identify potential modifications to the MVP
methodology and its implementation for projects to
be approved at a future date.
The MVP Review uses stakeholder-vetted models
and makes every effort to follow procedures and
assumptions consistent with the MTEP11 analysis.
Metrics that required any changes to the benefit
valuation due to changing tariffs, procedures or
conditions are highlighted. Consistent with
MTEP11, the MTEP17 MVP Review assesses the benefits of the entire MVP Portfolio and does not
differentiate between facilities currently in-service and those still in planning stages. Because the MVP
Portfolio’s costs are allocated solely to the MISO North and Central Regions, only MISO North and
Central Region benefits are included in the MTEP17 MVP Triennial Review.
The Triennial MVP Review has no
impact on the existing MVP
Portfolio cost allocation. The
intent of the MVP Review is to
identify potential modifications to
the MVP methodology for projects
to be approved at a future date.
Analysis shows that
projected benefits
provided by the MVP
Portfolio have increased
since MTEP11.

2017 MVP TRIENNIAL REVIEW REPORT
5
Public Policy Benefits
The MTEP17 MVP Review reconfirms the MVP Portfolio’s ability to deliver wind generation, in a cost-
effective manner, in support of MISO States’ renewable energy mandates. Renewable Portfolio
Standards assumptions1 have only had minor changes since the MTEP11 analysis.
Updated analyses find that 11.3 GW of dispatched wind would be curtailed in lieu of the MVP Portfolio,
which extrapolates to 60.5 percent of the 2031 full Renewable Portfolio Standard (RPS) energy. MTEP14
and MTEP11 analyses both showed a similar percentage of their full RPS energy would be curtailed
without the installation of the MVP Portfolio. The minor differences between studies can be attributed to
new transmission upgrades represented in the system models and the changes in actual physical
locations of installed wind turbines.
In addition to allowing energy to not be curtailed, analyses determined that 5.1 GW of wind generation in
excess of the 2031 requirements is enabled by the MVP Portfolio. For their respective models years,
MTEP11 and MTEP14 analyses determined that 2.2 GW and 3.4 GW of additional generation could be
sourced from the incremental energy zones.
When the results from the curtailment analyses and the wind-enabled analyses are combined, MTEP17
results show the MVP Portfolio enables a total of 52.8 million MWh of renewable energy to meet the
renewable energy mandates through 2031. System wide, the MTEP17 wind enablement amount is
substantively similar to 2014 and 2011 analyses — 43 million MWh and 41 million MWh, respectively.
Economic Benefits
MTEP17 analysis shows the Multi-Value Portfolio creates $22.1 to $74.8 billion in total benefits to MISO
North and Central Region members (Figure E-1). Total portfolio costs have increased from $5.56 billion in
MTEP11 to $6.65 billion in MTEP17. Even with the increased portfolio cost estimates, the increased
MTEP17 congestion and fuel savings benefit forecasts result in portfolio benefit-to-cost ratios that have
increased since MTEP11.
1 Assumptions include Renewable Portflio Standard levels and fulfillment methods
2017 MVP TRIENNIAL REVIEW REPORT
6
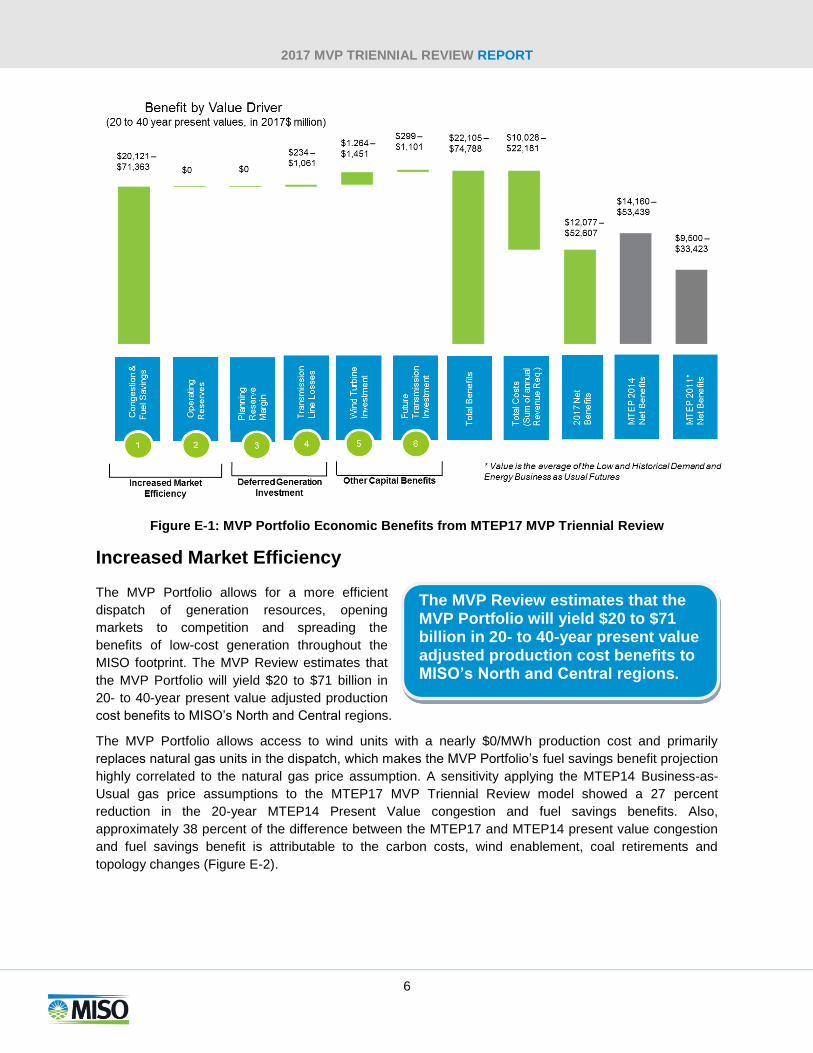
Figure E-1: MVP Portfolio Economic Benefits from MTEP17 MVP Triennial Review
Increased Market Efficiency
The MVP Portfolio allows for a more efficient
dispatch of generation resources, opening
markets to competition and spreading the
benefits of low-cost generation throughout the
MISO footprint. The MVP Review estimates that
the MVP Portfolio will yield $20 to $71 billion in
20- to 40-year present value adjusted production
cost benefits to MISO’s North and Central regions.
The MVP Portfolio allows access to wind units with a nearly $0/MWh production cost and primarily
replaces natural gas units in the dispatch, which makes the MVP Portfolio’s fuel savings benefit projection
highly correlated to the natural gas price assumption. A sensitivity applying the MTEP14 Business-as-
Usual gas price assumptions to the MTEP17 MVP Triennial Review model showed a 27 percent
reduction in the 20-year MTEP14 Present Value congestion and fuel savings benefits. Also,
approximately 38 percent of the difference between the MTEP17 and MTEP14 present value congestion
and fuel savings benefit is attributable to the carbon costs, wind enablement, coal retirements and
topology changes (Figure E-2).
The MVP Review estimates that the MVP Portfolio will yield $20 to $71 billion in 20- to 40-year present value adjusted production cost benefits to MISO’s North and Central regions.
2017 MVP TRIENNIAL REVIEW REPORT
7
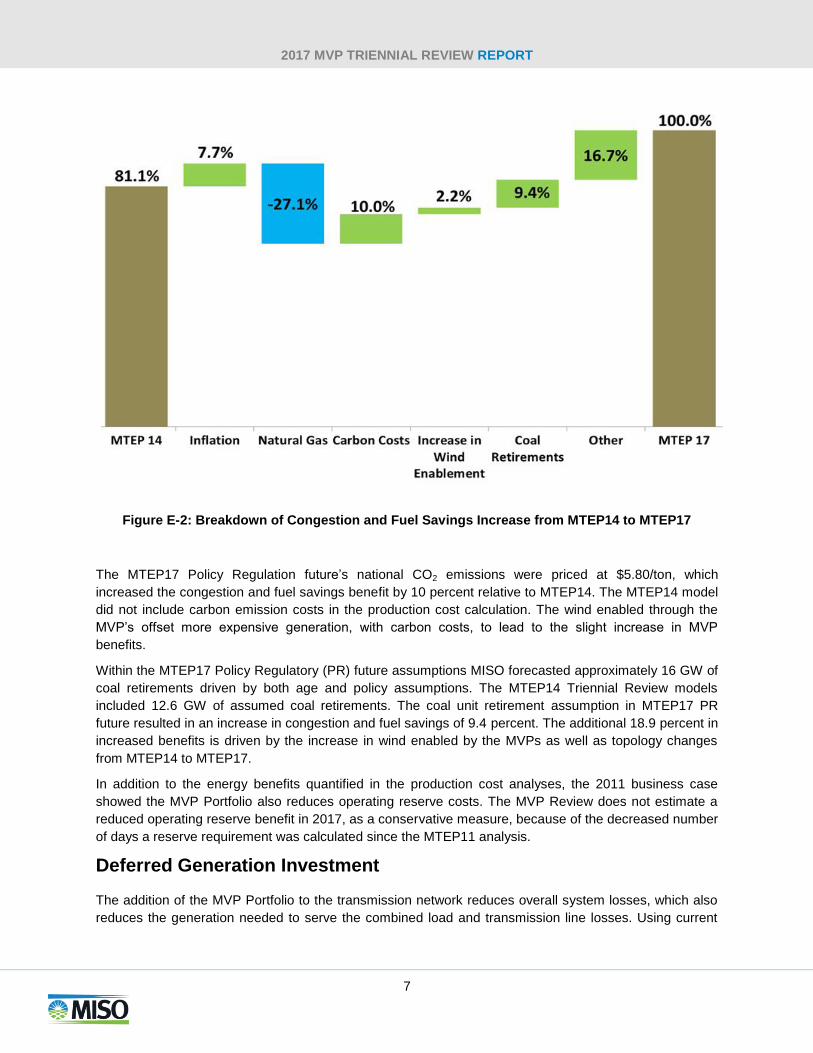
Figure E-2: Breakdown of Congestion and Fuel Savings Increase from MTEP14 to MTEP17
The MTEP17 Policy Regulation future’s national CO2 emissions were priced at $5.80/ton, which
increased the congestion and fuel savings benefit by 10 percent relative to MTEP14. The MTEP14 model
did not include carbon emission costs in the production cost calculation. The wind enabled through the
MVP’s offset more expensive generation, with carbon costs, to lead to the slight increase in MVP
benefits.
Within the MTEP17 Policy Regulatory (PR) future assumptions MISO forecasted approximately 16 GW of
coal retirements driven by both age and policy assumptions. The MTEP14 Triennial Review models
included 12.6 GW of assumed coal retirements. The coal unit retirement assumption in MTEP17 PR
future resulted in an increase in congestion and fuel savings of 9.4 percent. The additional 18.9 percent in
increased benefits is driven by the increase in wind enabled by the MVPs as well as topology changes
from MTEP14 to MTEP17.
In addition to the energy benefits quantified in the production cost analyses, the 2011 business case
showed the MVP Portfolio also reduces operating reserve costs. The MVP Review does not estimate a
reduced operating reserve benefit in 2017, as a conservative measure, because of the decreased number
of days a reserve requirement was calculated since the MTEP11 analysis.
Deferred Generation Investment
The addition of the MVP Portfolio to the transmission network reduces overall system losses, which also
reduces the generation needed to serve the combined load and transmission line losses. Using current

2017 MVP TRIENNIAL REVIEW REPORT
8
capital costs, the deferment from loss reduction equates to a MISO North and Central Regions’ savings of
$234 to $1,061 million — nearly double the MTEP11 values as a result of tighter reserve margins.
The previous MVP Triennial Review in MTEP14 estimated a deferred capacity value of $75.8 million due
to the expected capacity shortage in Local Resource Zone (LRZ) 3 without the addition of the MVPs. With
the refreshed analysis using updated system topology and expected capacity resources, MISO no longer
expects a capacity shortfall in LRZ 3. As a result, the MVP Review does not estimate any deferred
capacity benefits in the MTEP17 MVP Review.
Other Capital Benefits
The MTEP17 Triennial MVP Review found that the benefits from the optimization of wind generation
siting to be $1.2 to $1.4 billion. These benefits are lower relative to MTEP11 and MTEP14 which is
primarily due to a 40 percent decrease in the estimated wind capital costs.
Consistent with MTEP11, the MTEP17 MVP Triennial Review shows that the MVP Portfolio eliminates the
need for $300 million in future baseline reliability upgrades. The magnitude of estimated benefits is in
close proximity to the estimates from MTEP11 and MTEP14; however, the actual identified upgrades are
different as a result of load growth, generation dispatch, wind levels and transmission upgrades.
Distribution of Economic Benefits
The MVP Portfolio provides benefits across the MISO footprint in a manner that is roughly equivalent to
costs allocated to each LRZ (Figure E-3). The MVP Portfolio’s benefits are at least 1.5 to 2.6 times the
cost allocated to each zone. Differences in zonal distribution relative to MTEP11 and MTEP14 are a result
of changing tariffs/business practices (planning reserve margin requirement and baseline reliability project
cost allocation), generation dispatch, wind siting and load levels.
Figure E-3: MVP Portfolio Total Benefit Distribution
2017 MVP TRIENNIAL REVIEW REPORT
9
Qualitative and Social Benefits
Aside from widespread economic and public policy benefits, the MVP Portfolio also provides benefits
based on qualitative or social values. The MVP Portfolio:
Enhances generation flexibility
Creates a more robust regional transmission system that decreases the likelihood of future blackouts
Increases the geographic diversity of wind resources that can be delivered, increasing the average wind output available at any given time
Supports the creation of thousands of local jobs and billions in local investment
Reduces carbon emissions by 13 to 21 million tons annually
These benefits suggest quantified values from the economic analysis may be conservative because they
do not account for the full potential benefits of the MVP Portfolio.
Historical Review
The MTEP17 MVP Review is the first cycle to provide a quantitative and qualitative look at how the in-
service MVPs may have impacted certain historical market metrics. With only four of the 17 MVPs
presently in service, no definitive conclusions could be made as a result of this analysis. However,
correlations between congestion improvements on targeted flow gates and upward trends of wind
resource interconnections and energy supplied were observed from the limited available data. As a larger
statistical sample size becomes available in future reviews, a more detailed discussion on MVP impacts
will be provided.
Going Forward
MTEP18 and MTEP19 will feature a Limited Review of the MVP Portfolio benefits. Each Limited Review
will provide an updated assessment of the congestion and fuel savings using the latest portfolio costs and
in-service dates. The next full triennial review will be performed in MTEP20.
2017 MVP TRIENNIAL REVIEW REPORT
10
1. Study Purpose and Drivers In 2017, MISO performed its second triennial review of the Multi-Value Project (MVP) Portfolio benefits. The MVP Portfolio was studied and approved in 2011 as a part of MISO’s annual transmission expansion plan (MTEP), with a tariff requirement to conduct a full review every three years. The first triennial review was completed in 2014. The MTEP17 Triennial MVP Review provides an updated view into the projected economic, public policy and qualitative benefits of the MTEP11-approved MVP Portfolio.
The MVP Review has no impact on the existing MVP Portfolio cost allocation. Analysis is performed
solely for information purposes. The intent of the MVP Reviews is to use the review process and results to
identify potential modifications to the MVP methodology and its implementation for projects to be
approved at a future date. The MVP Reviews are intended to verify if the MVP criteria and methodology is
working as expected.
The MVP Review uses stakeholder-vetted models and makes every effort to follow consistent procedures
and assumptions as the Candidate MVP, also known as the MTEP11 analysis. Any metrics that required
changes to the benefit valuation due to revised tariffs, procedures or conditions are highlighted
throughout the report. Wherever practical, any differences between MTEP17, MTEP14 and MTEP11
assumptions are noted and the resulting differences quantified.
Consistent with MTEP11, the MTEP17 MVP Review assesses the benefits of the entire MVP Portfolio
and does not differentiate between facilities currently in-service and those still being planned. The latest
MVP cost estimates and in-service dates are used for all analyses.
The MVP Triennial Review has no
impact on the existing Multi-Value
Project Portfolio cost allocation.
The study is performed solely for
information purposes.
2017 MVP TRIENNIAL REVIEW REPORT
11
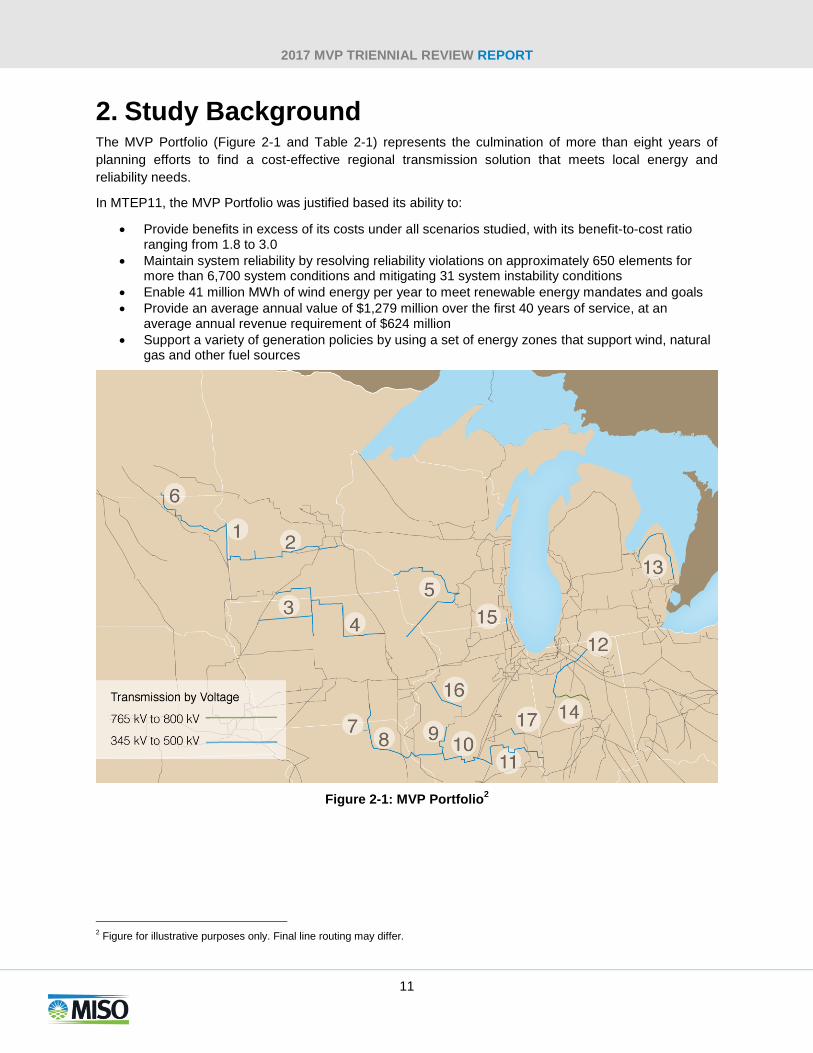
2. Study Background The MVP Portfolio (Figure 2-1 and Table 2-1) represents the culmination of more than eight years of
planning efforts to find a cost-effective regional transmission solution that meets local energy and
reliability needs.
In MTEP11, the MVP Portfolio was justified based its ability to:
Provide benefits in excess of its costs under all scenarios studied, with its benefit-to-cost ratio ranging from 1.8 to 3.0
Maintain system reliability by resolving reliability violations on approximately 650 elements for more than 6,700 system conditions and mitigating 31 system instability conditions
Enable 41 million MWh of wind energy per year to meet renewable energy mandates and goals
Provide an average annual value of $1,279 million over the first 40 years of service, at an average annual revenue requirement of $624 million
Support a variety of generation policies by using a set of energy zones that support wind, natural gas and other fuel sources
Figure 2-1: MVP Portfolio2
2 Figure for illustrative purposes only. Final line routing may differ.
2017 MVP TRIENNIAL REVIEW REPORT
12
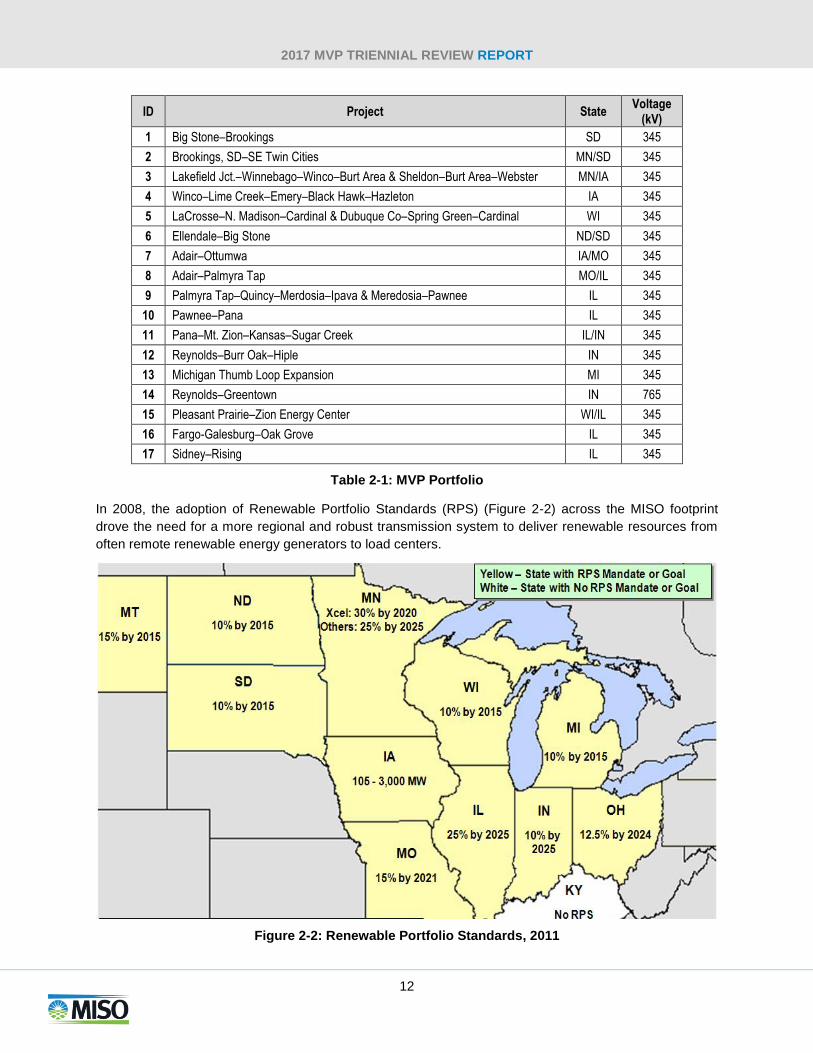
ID Project State Voltage
(kV)
1 Big Stone–Brookings SD 345
2 Brookings, SD–SE Twin Cities MN/SD 345
3 Lakefield Jct.–Winnebago–Winco–Burt Area & Sheldon–Burt Area–Webster MN/IA 345
4 Winco–Lime Creek–Emery–Black Hawk–Hazleton IA 345
5 LaCrosse–N. Madison–Cardinal & Dubuque Co–Spring Green–Cardinal WI 345
6 Ellendale–Big Stone ND/SD 345
7 Adair–Ottumwa IA/MO 345
8 Adair–Palmyra Tap MO/IL 345
9 Palmyra Tap–Quincy–Merdosia–Ipava & Meredosia–Pawnee IL 345
10 Pawnee–Pana IL 345
11 Pana–Mt. Zion–Kansas–Sugar Creek IL/IN 345
12 Reynolds–Burr Oak–Hiple IN 345
13 Michigan Thumb Loop Expansion MI 345
14 Reynolds–Greentown IN 765
15 Pleasant Prairie–Zion Energy Center WI/IL 345
16 Fargo-Galesburg–Oak Grove IL 345
17 Sidney–Rising IL 345
Table 2-1: MVP Portfolio
In 2008, the adoption of Renewable Portfolio Standards (RPS) (Figure 2-2) across the MISO footprint
drove the need for a more regional and robust transmission system to deliver renewable resources from
often remote renewable energy generators to load centers.
Figure 2-2: Renewable Portfolio Standards, 2011
2017 MVP TRIENNIAL REVIEW REPORT
13
Beginning with the MTEP 2003 Exploratory Studies, MISO and stakeholders began to explore how to
best provide a value-added regional planning process to complement the local planning of MISO
members. These explorations continued in later MTEP cycles and in specific targeted studies. In 2008,
MISO began the Regional Generation Outlet Study (RGOS) to identify a set of value-based transmission
projects necessary to enable Load Serving Entities (LSEs) to meet their RPS mandates. It accomplished
this with the assistance of state regulators and industry stakeholders such as the Midwest Governor’s
Association (MGA), the Upper Midwest Transmission Development Initiative (UMTDI) and the
Organization of MISO States (OMS).
While much consideration was given to wind capacity factors when developing the energy zones utilized
in the RGOS and MVP Portfolio analyses, the zones were chosen with consideration of more factors than
wind capacity. Existing infrastructure, such as transmission and natural gas pipelines, also influenced the
selection of the zones. As such, although the energy zones were created to serve the renewable
generation mandates, they could be used for a variety of different generation types to serve various future
generation policies.
Common elements between the RGOS results and previous reliability, economic and generation
interconnection analyses were identified to create the 2011 candidate MVP portfolio. This portfolio
represented a set of “no regrets” projects that were believed to provide multiple kinds of reliability and
economic benefits under all alternate futures studied. Over the course of the MVP Portfolio analysis, the
Candidate MVP Portfolio was refined into the portfolio that was approved by the MISO Board of Directors
in MTEP11.
The MVP Portfolio enables the delivery of the renewable energy required by public policy mandates in a
manner more reliable and economical than without the associated transmission upgrades. Specifically,
the portfolio mitigates approximately 650 reliability constraints under 6,700 different transmission outage
conditions for steady state and transient conditions under both peak and shoulder load scenarios. Some
of these conditions could be severe enough to cause cascading outages on the system. By mitigating
these constraints, approximately 41 million MWh per year of renewable generation can be delivered to
serve the MISO state renewable portfolio mandates.
Under all future policy scenarios studied, the MVP Portfolio delivered widespread regional benefits to the
transmission system. To use conservative projections relating only to the state renewable portfolio
mandates, only the Business as Usual future was used in developing the candidate MVP business case.
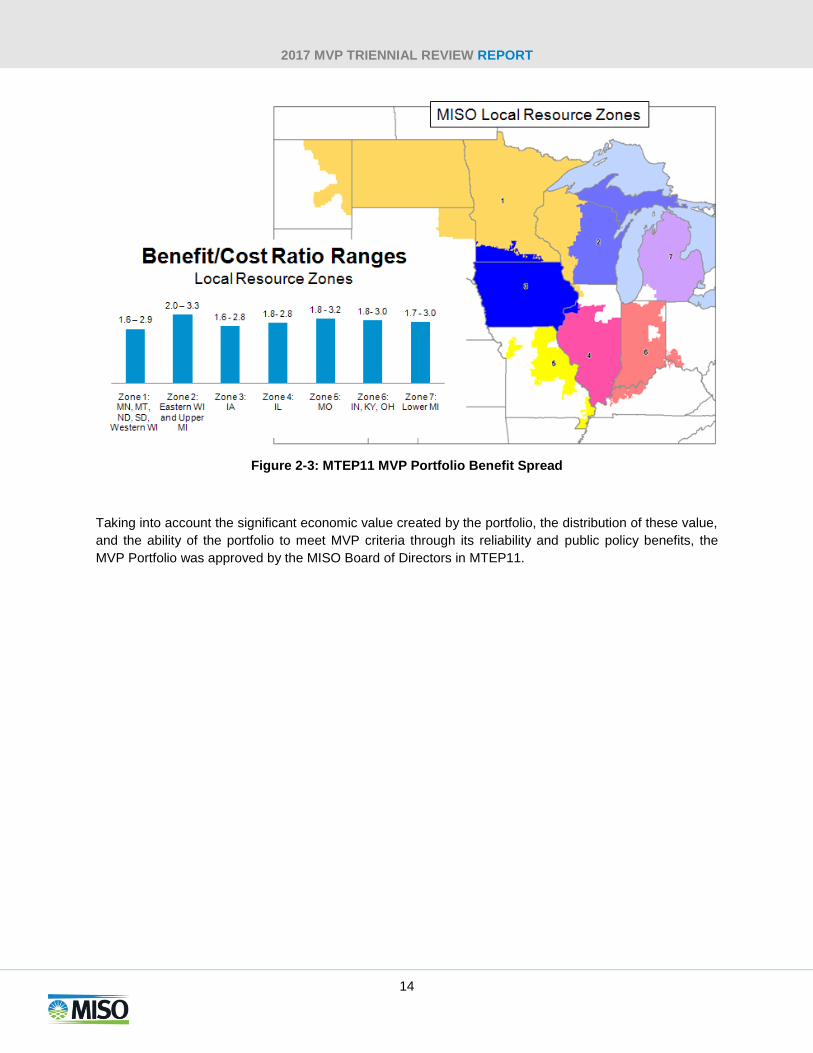
The projected benefits are spread across the system, in a manner commensurate with costs (Figure 2-3).
2017 MVP TRIENNIAL REVIEW REPORT
14
Figure 2-3: MTEP11 MVP Portfolio Benefit Spread
Taking into account the significant economic value created by the portfolio, the distribution of these value,
and the ability of the portfolio to meet MVP criteria through its reliability and public policy benefits, the
MVP Portfolio was approved by the MISO Board of Directors in MTEP11.
2017 MVP TRIENNIAL REVIEW REPORT
15
3. MTEP17 MVP Review Model Development
The MTEP17 MVP Triennial Review uses MTEP17 economic
models as the basis for the analysis. The MTEP17 economic
models were developed in 2016 with topology based on the
MISO powerflow models from the MTEP16 reliability study.
To maintain consistency between economic and reliability
models, MVP Triennial Review wind curtailment and
enablement analysis was performed with MTEP16 vintage
powerflows.
The MTEP models were developed through an open stakeholder process and vetted through the
appropriate MISO stakeholder committees, including MISO Planning Advisory Committee, Planning
Subcommittee, Modeling Users Group and Economic Planning Users Group. The details of the economic
and reliability models used in the MTEP17 MVP Triennial Review are described in the following sections.
The MTEP models are available via the MISO FTP site with proper licenses and confidentiality
agreements.
3.1 Economic Models
The MVP Benefit Review uses PROMOD IV as the primary tool to evaluate the economic benefits of the
MVP Portfolio. The MTEP17 MISO North/Central economic models, stakeholder vetted in 2016, are used
as the basis for the MTEP17 Review. The same economic models are used in the MTEP17 Market
Congestion Planning Study.
In previous reviews, including MTEP11, MISO utilized a
Business as Usual (BAU) future scenario to represent a
status quo environment; generally including existing
standards for renewable mandates and little or no change
in environmental legislation. A BAU future was not
developed for MTEP17. To replicate the MTEP11 MVP
business case3 as close as possible, the MTEP17 Review
will rely on the Policy Regulation (PR) future.
Similar to previous cycles’ BAU futures, the MTEP17 PR future includes mid or base levels of demand
and energy growth rates, fuel prices and uncertainty variables. The primary difference between the
MTEP17 PR and previous cycles’ BAU futures is the inclusion of a carbon reduction target in the MTEP17
PR. The MTEP17 Triennial Review was performed both with and without the carbon reduction target
applied for comparability, but default values in the MTEP17 include the carbon constraint per the future
definition.
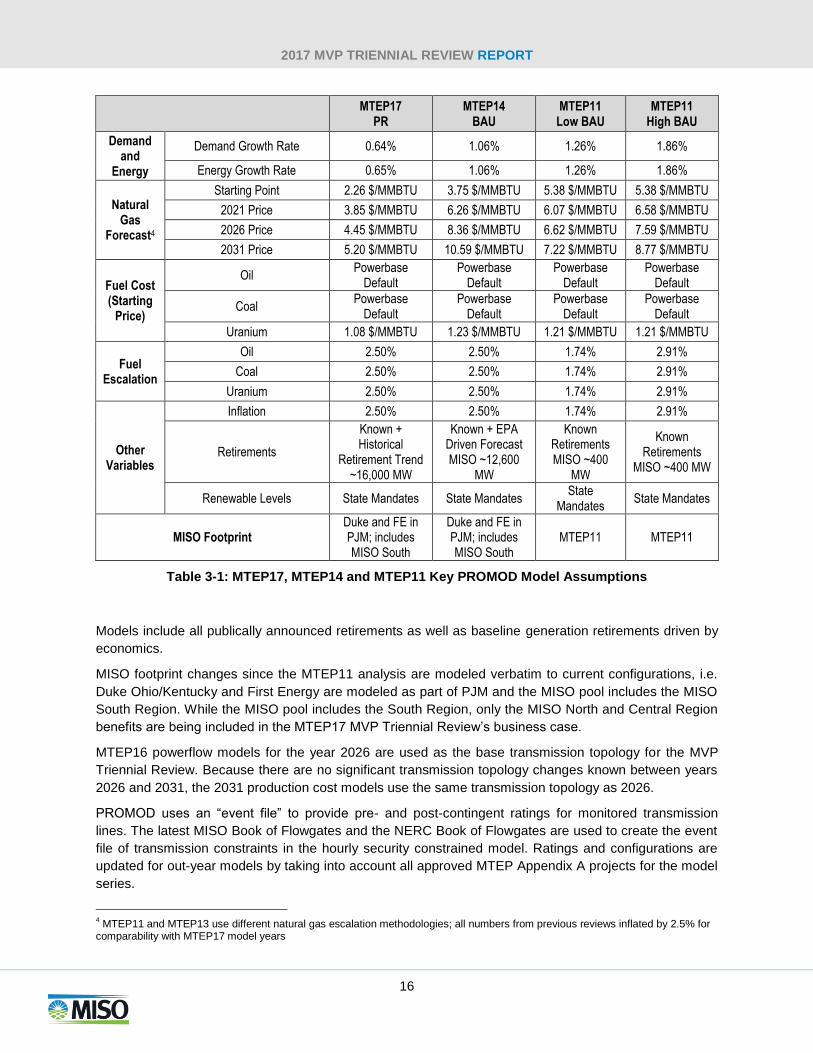
MTEP11 analysis relied on two definitions of the BAU future — one with a slightly higher baseline growth
rate and one with a slightly lower growth rate (Table 3-1), and MTEP14 utilized a single BAU future
scenario in the previous review. As such, all MTEP17 Triennial MVP Review results in this report will be
compared to the arithmetic mean of the MTEP11 Low BAU and High BAU results and MTEP14 BAU
results (where applicable).
3 The Candidate MVP Analysis provided results for information purposes under all MTEP11 future scenarios; however, the business
case only used the Business as Usual futures.
MTEP17 economic
models, developed in
2016, are the basis for the
MTEP17 MVP Triennial
Review.
To replicate the MTEP11 MVP
business case as close as
possible, the MTEP17 Review
will rely on the Policy
Regulation (PR) future.
2017 MVP TRIENNIAL REVIEW REPORT
16
MTEP17
PR MTEP14
BAU MTEP11
Low BAU MTEP11
High BAU
Demand and
Energy
Demand Growth Rate 0.64% 1.06% 1.26% 1.86%
Energy Growth Rate 0.65% 1.06% 1.26% 1.86%
Natural Gas
Forecast4
Starting Point 2.26 $/MMBTU 3.75 $/MMBTU 5.38 $/MMBTU 5.38 $/MMBTU
2021 Price 3.85 $/MMBTU 6.26 $/MMBTU 6.07 $/MMBTU 6.58 $/MMBTU
2026 Price 4.45 $/MMBTU 8.36 $/MMBTU 6.62 $/MMBTU 7.59 $/MMBTU
2031 Price 5.20 $/MMBTU 10.59 $/MMBTU 7.22 $/MMBTU 8.77 $/MMBTU
Fuel Cost (Starting
Price)
Oil Powerbase
Default Powerbase
Default Powerbase
Default Powerbase
Default
Coal Powerbase
Default Powerbase
Default Powerbase
Default Powerbase
Default
Uranium 1.08 $/MMBTU 1.23 $/MMBTU 1.21 $/MMBTU 1.21 $/MMBTU
Fuel Escalation
Oil 2.50% 2.50% 1.74% 2.91%
Coal 2.50% 2.50% 1.74% 2.91%
Uranium 2.50% 2.50% 1.74% 2.91%
Other Variables
Inflation 2.50% 2.50% 1.74% 2.91%
Retirements
Known + Historical
Retirement Trend ~16,000 MW
Known + EPA Driven Forecast MISO ~12,600
MW
Known Retirements MISO ~400
MW
Known Retirements
MISO ~400 MW
Renewable Levels State Mandates State Mandates State
Mandates State Mandates
MISO Footprint Duke and FE in PJM; includes MISO South
Duke and FE in PJM; includes MISO South
MTEP11 MTEP11
Table 3-1: MTEP17, MTEP14 and MTEP11 Key PROMOD Model Assumptions
Models include all publically announced retirements as well as baseline generation retirements driven by
economics.
MISO footprint changes since the MTEP11 analysis are modeled verbatim to current configurations, i.e.
Duke Ohio/Kentucky and First Energy are modeled as part of PJM and the MISO pool includes the MISO
South Region. While the MISO pool includes the South Region, only the MISO North and Central Region
benefits are being included in the MTEP17 MVP Triennial Review’s business case.
MTEP16 powerflow models for the year 2026 are used as the base transmission topology for the MVP
Triennial Review. Because there are no significant transmission topology changes known between years
2026 and 2031, the 2031 production cost models use the same transmission topology as 2026.
PROMOD uses an “event file” to provide pre- and post-contingent ratings for monitored transmission
lines. The latest MISO Book of Flowgates and the NERC Book of Flowgates are used to create the event
file of transmission constraints in the hourly security constrained model. Ratings and configurations are
updated for out-year models by taking into account all approved MTEP Appendix A projects for the model
series.
4 MTEP11 and MTEP13 use different natural gas escalation methodologies; all numbers from previous reviews inflated by 2.5% for
comparability with MTEP17 model years
2017 MVP TRIENNIAL REVIEW REPORT
17
3.2 Capacity Expansion Models
The MTEP17 Triennial Review decreased transmission line losses benefit (Section 6.4) is monetized
using the Electricity Generation Expansion Analysis System (EGEAS) model. EGEAS is designed by the
Electric Power Research Institute to find the least-cost integrated resource supply plan given a demand
level. EGEAS expansions include traditional supply-side resources, demand response and storage
resources. The EGEAS model is used annually in MISO’s MTEP process to identify future capacity needs
beyond the typical five-year project-planning horizon.
The EGEAS optimization process is based on a dynamic programming method where all possible
resource addition combinations that meet user-specified constraints are enumerated and evaluated. The
EGEAS objective function minimizes the present value of revenue requirements. The revenue
requirements include both carrying charges for capital investment and system operating costs.
MTEP17 Triennial MVP Review analysis was performed using the MTEP17 Policy Regulation future,
developed in 2016. The capacity model shares the same input database and assumptions as the
economic models (Section 3.1).
3.3 Reliability Models
To maintain consistency between economic and reliability models, MTEP16-vintage MISO powerflow
models are used as the basis for the MTEP17 MVP Triennial Review reliability analysis. The MTEP17
economic models are developed with topology based on the MTEP16 MISO powerflow models. Siemens
PTI Power System Simulator for Engineering (PSS/E) and Transmission Adequacy & Reliability
Assessment (TARA) are utilized for the MTEP17 MVP Triennial Review analysis.
Powerflow models are built using MISO’s Model on Demand (MOD) model data repository. Models
include approved MTEP Appendix A projects (through MTEP16) and the Eastern Interconnection
Reliability Assessment Group (ERAG) Multiregional Modeling Working Group (MMWG) modeling for the
external system. Load and generation profiles are seasonal dependent (Table 3-2). MTEP powerflow
models have wind dispatched at 90 percent connected capacity in Shoulder models and at capacity credit
level (approximately 15.6 percent) in the Summer Peak.
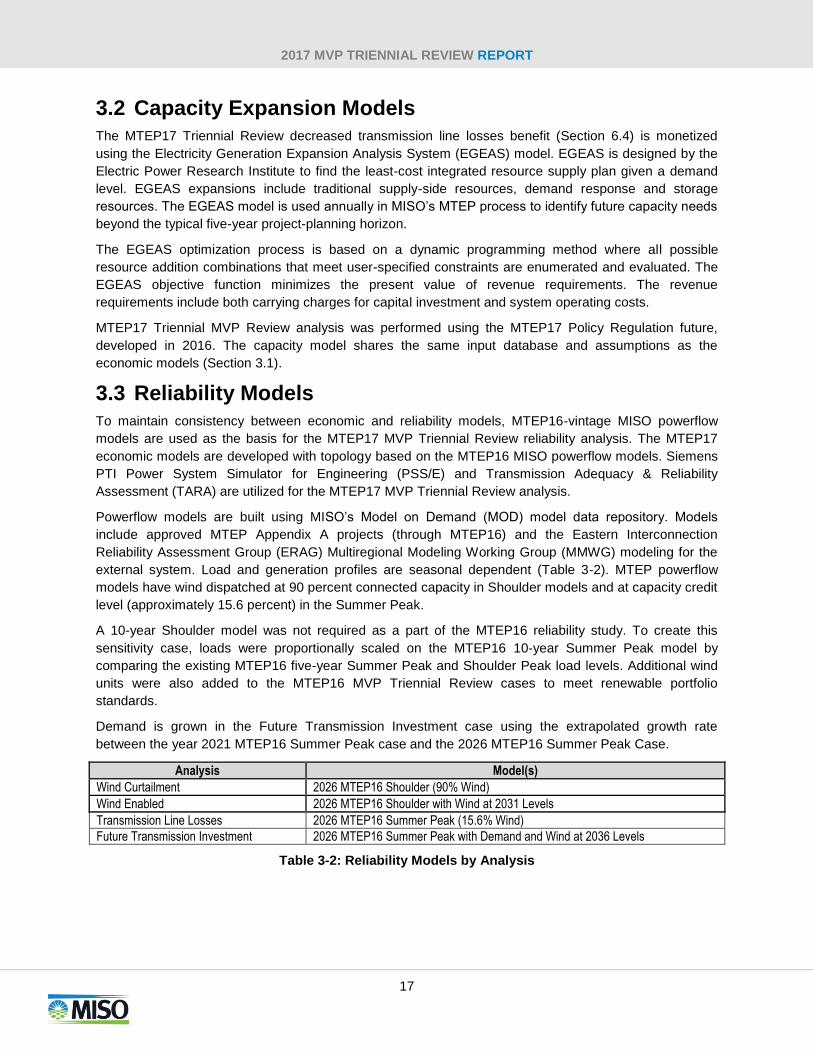
A 10-year Shoulder model was not required as a part of the MTEP16 reliability study. To create this
sensitivity case, loads were proportionally scaled on the MTEP16 10-year Summer Peak model by
comparing the existing MTEP16 five-year Summer Peak and Shoulder Peak load levels. Additional wind
units were also added to the MTEP16 MVP Triennial Review cases to meet renewable portfolio
standards.
Demand is grown in the Future Transmission Investment case using the extrapolated growth rate
between the year 2021 MTEP16 Summer Peak case and the 2026 MTEP16 Summer Peak Case.
Analysis Model(s)
Wind Curtailment 2026 MTEP16 Shoulder (90% Wind)
Wind Enabled 2026 MTEP16 Shoulder with Wind at 2031 Levels
Transmission Line Losses 2026 MTEP16 Summer Peak (15.6% Wind)
Future Transmission Investment 2026 MTEP16 Summer Peak with Demand and Wind at 2036 Levels
Table 3-2: Reliability Models by Analysis
2017 MVP TRIENNIAL REVIEW REPORT
18
3.4 Capacity Import Limit Models
The MTEP16 series of MISO powerflow models are used as the basis for the MTEP17 MVP Triennial
Review capacity import limit analysis. Zonal Local Clearing Requirements are calculated using the
capacity import limits identified through transfer analysis. The MTEP17 MVP Triennial Review
incorporates capacity import limits calculated using a year 2026 model both with and without the MVP
Portfolio. Single-element contingencies in MISO and seam areas are evaluated with subsystem files from
MTEP16 reliability studies. The monitored file includes all facilities under MISO functional control and
seam facilities 100 kV and above.
Additional details on the models used in the Planning Reserve Margin benefit estimation can be found in
the 2017 Loss of Load Expectation Report.
3.5 Loss of Load Expectation Models
For the 2017 Planning Year, MISO utilized the General Electric-developed Multi-Area Reliability
Simulation (MARS) program to calculate the Loss of Load Expectation. GE MARS uses a sequential
Monte Carlo simulation to model a generation system and assess the system’s reliability based on any
number of interconnected areas. GE MARS calculates the annual LOLE for the MISO system and each
Local Resource Zone (LRZ) by stepping through the year chronologically and taking into account
generation, load, load modifying and energy efficiency resources, equipment forced outages, planned and
maintenance outages, load forecast uncertainty and external support.
Going forward, MISO will no longer use GE MARS for LOLE studies. Instead, Astrape Consulting’s
Strategic Energy & Risk Valuation Model (SERVM) will be used to calculate the Loss of Load Expectation
for the applicable Planning Year. The 2017 Planning Year LOLE models, updated to include generation
retirements, were the basis for the MTEP17 MVP Triennial Review models. Additional model details can
be found in the 2017 Loss of Load Expectation Report.
2017 MVP TRIENNIAL REVIEW REPORT
19
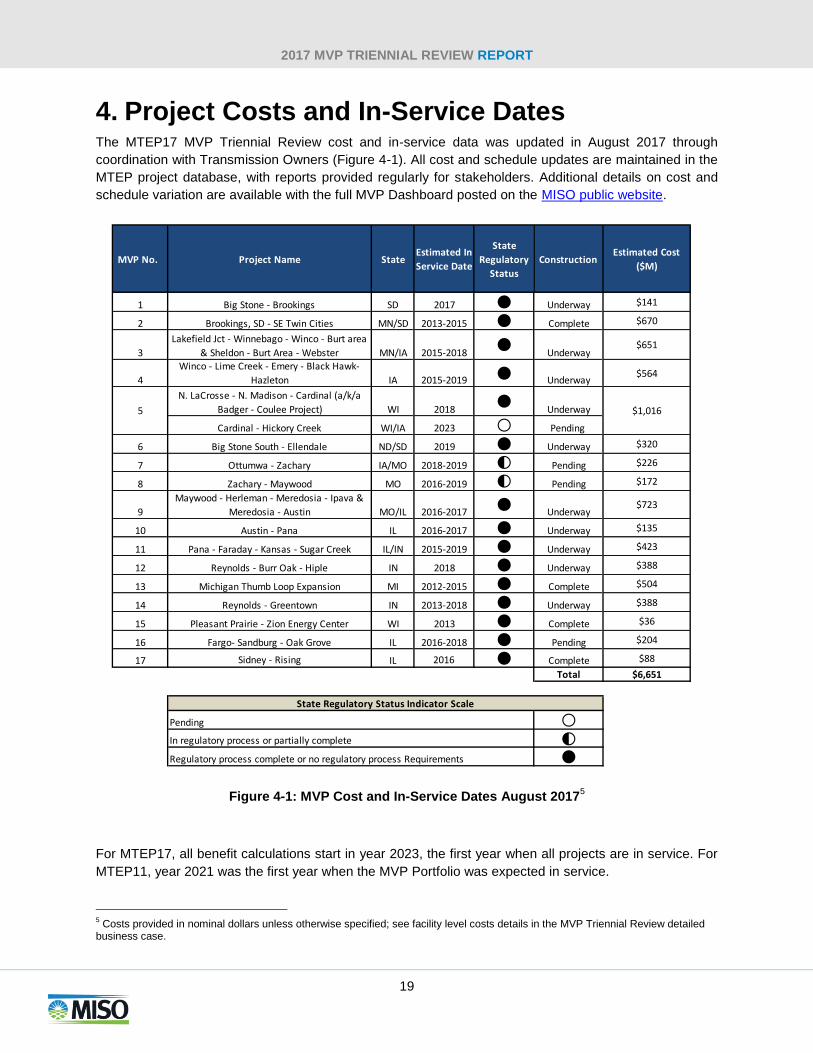
4. Project Costs and In-Service Dates The MTEP17 MVP Triennial Review cost and in-service data was updated in August 2017 through
coordination with Transmission Owners (Figure 4-1). All cost and schedule updates are maintained in the
MTEP project database, with reports provided regularly for stakeholders. Additional details on cost and
schedule variation are available with the full MVP Dashboard posted on the MISO public website.
Figure 4-1: MVP Cost and In-Service Dates August 20175
For MTEP17, all benefit calculations start in year 2023, the first year when all projects are in service. For
MTEP11, year 2021 was the first year when the MVP Portfolio was expected in service.
5 Costs provided in nominal dollars unless otherwise specified; see facility level costs details in the MVP Triennial Review detailed
business case.
MVP No. Project Name StateEstimated In
Service Date
State
Regulatory
Status
ConstructionEstimated Cost
($M)
1 Big Stone - Brookings SD 2017 ● Underway $141
2 Brookings, SD - SE Twin Cities MN/SD 2013-2015 ● Complete $670
3
Lakefield Jct - Winnebago - Winco - Burt area
& Sheldon - Burt Area - Webster MN/IA 2015-2018●
Underway$651
4
Winco - Lime Creek - Emery - Black Hawk-
Hazleton IA 2015-2019 ● Underway$564
N. LaCrosse - N. Madison - Cardinal (a/k/a
Badger - Coulee Project) WI 2018●
Underway
Cardinal - Hickory Creek WI/IA 2023 ○ Pending
6 Big Stone South - Ellendale ND/SD 2019 ● Underway $320
7 Ottumwa - Zachary IA/MO 2018-2019 ◐ Pending $226
8 Zachary - Maywood MO 2016-2019 ◐ Pending $172
9
Maywood - Herleman - Meredosia - Ipava &
Meredosia - Austin MO/IL 2016-2017 ● Underway$723
10 Austin - Pana IL 2016-2017 ● Underway $135
11 Pana - Faraday - Kansas - Sugar Creek IL/IN 2015-2019 ● Underway $423
12 Reynolds - Burr Oak - Hiple IN 2018 ● Underway $388
13 Michigan Thumb Loop Expansion MI 2012-2015 ● Complete $504
14 Reynolds - Greentown IN 2013-2018 ● Underway $388
15 Pleasant Prairie - Zion Energy Center WI 2013 ● Complete $36
16 Fargo- Sandburg - Oak Grove IL 2016-2018 ● Pending $204
17 Sidney - Rising IL 2016 ● Complete $88
Total $6,651
○◐●Regulatory process complete or no regulatory process Requirements
State Regulatory Status Indicator Scale
Pending
In regulatory process or partially complete
5 $1,016
2017 MVP TRIENNIAL REVIEW REPORT
20
The costs contained within the MTEP database are in nominal, as-spent, dollars unless otherwise
specified. Consistent with previous analyses, and to simplify the benefit-to-cost ratio calculations, all MVP
facilities are assumed to go into service in the portfolio in-service year, so nominal costs are escalated
using a 2.5 percent inflation rate from the facility in-service date up to the year 2023.
A load ratio share was developed to allocate the benefit-to-cost ratios in each of the seven MISO
North/Central local resource zones (LRZ). Load ratios are based off the actual 2016 energy withdrawals
with the Policy Regulation (PR) future MTEP growth rate applied.
MTEP17 MVP Triennial Review benefit-to-cost calculations only include direct benefits to MISO North and
Central members. MISO South Region benefits are excluded from all estimations. Export Revenue share,
including PJM exports6, are factored into the calculation at an estimate rate of 1.31 percent.
Total costs are annualized using the MISO North/Central-wide average Transmission Owner annual
charge rate/revenue requirement. Consistent with the MTEP11 analysis and other Market Efficiency
Projects, the MTEP17 MVP Triennial Review assumes that costs start in 2023, such as year one of the
annual charge rate is 2023 and construction work in progress (CWIP) is excluded from the total costs.
6 FERC's July 13, 2016 Order in ER10-1791 directed MISO to charge the MVP rate on exports to PJM
2017 MVP TRIENNIAL REVIEW REPORT
21
5. Portfolio Public Policy Assessment The MTEP17 MVP Triennial Review
redemonstrates the MVP Portfolio’s ability to
enable the renewable energy mandates of the
footprint. Renewable Portfolio Standards
assumptions7 have only had minor changes since
the MTEP11 analysis and any changes in
capacity requirements are solely attributed to
load forecast changes and the actual installation
of wind turbines.
This analysis took place in two parts. The first part demonstrated the wind needed to meet renewable
energy mandates would be curtailed but for the approved MVP Portfolio. The second demonstrated the
additional renewable energy, above the mandate, that will be enabled by the portfolio. This energy could
be used to serve mandated renewable energy needs beyond 2031, as most of the mandates are indexed
to grow with load.
5.1 Wind Curtailment
A wind curtailment analysis was performed to find the percentage of mandated renewable energy that
could not be enabled but for the MVP Portfolio. A list of 277 monitored element/contingent element pairs
(flowgates) that are resolved by MVP portfolio was prepared as the basis for calculating wind curtailment.
These flowgates and a study case representing year 2026 shoulder scenario without MVPs modeled in it
were fed into a security constrained re-dispatch routine. This re-dispatch algorithm then fetched the
amount by which committed wind units and the RGOS energy zones need to be curtailed so as to relieve
the overloaded flowgates.
Results of the re-dispatch algorithm found that 11,295 MW of year 2026 dispatched wind would be
curtailed. As a connected capacity, 12,550 MW would be curtailed since wind is modeled at 90 percent of
its nameplate in the shoulder case. The MTEP17 results are similar in magnitude to both MTEP14 and
MTEP11, which found that 11,697 MW and 12,201 MW of connected wind would be curtailed,
respectively.
The curtailed energy was calculated to be 37.6 million MWh from the connected capacity multiplied by the
capacity factor times 8,760 hours per year. A MISO-wide per-unit capacity factor was averaged from the
2031 incremental wind zone capacities to 34.2 percent. Comparatively, the full 2031 RPS energy is 62.1
million MWh. As a percentage of the 2031 full RPS energy, 60.5 percent would be curtailed in lieu of the
MVP Portfolio. MTEP14 and MTEP11 analysis both showed a similar percentage of full RPS energy
would be curtailed without the installation of the MVP portfolio: 56.4 percent and 63 percent, respectively.
The minor differences between studies can be attributed to new transmission upgrades represented in
the system models and the changes in actual physical locations of installed wind turbines.
5.2 Wind Enabled
Additional analyses were performed to determine the incremental wind energy in excess of the RPS
requirements enabled by the approved MVP Portfolio. This energy could be used to meet renewable
energy mandates beyond 2031, as most of the state mandates are indexed to grow with load. An Optimal
7 Assumptions include Renewable Portflio Standard levels and fulfillment methods
The MVP portfolio enables a total of
52.8 million MWh of renewable
energy to meet the renewable
energy mandates and goals through
2031.
2017 MVP TRIENNIAL REVIEW REPORT
22
Transfer Capability analyses were run on the Shoulder case model to determine how much the wind in
each zone could be ramped up prior to additional reliability constraints occurring.
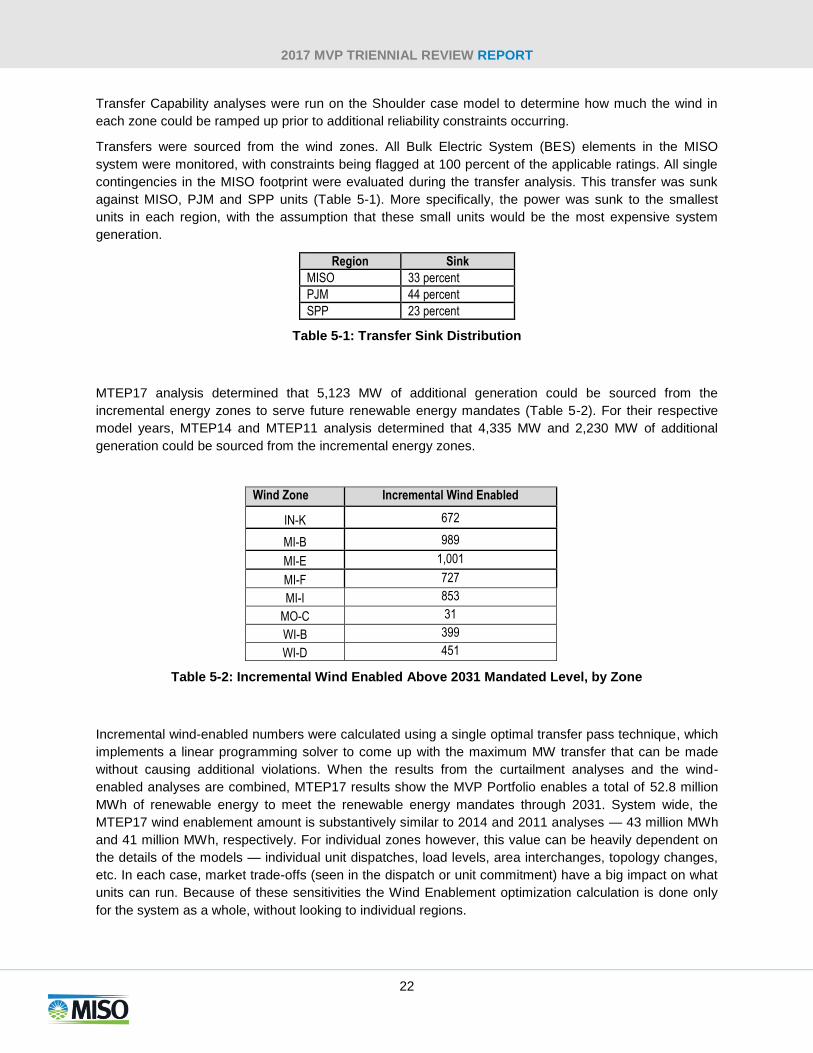
Transfers were sourced from the wind zones. All Bulk Electric System (BES) elements in the MISO
system were monitored, with constraints being flagged at 100 percent of the applicable ratings. All single
contingencies in the MISO footprint were evaluated during the transfer analysis. This transfer was sunk
against MISO, PJM and SPP units (Table 5-1). More specifically, the power was sunk to the smallest
units in each region, with the assumption that these small units would be the most expensive system
generation.
Region Sink
MISO 33 percent
PJM 44 percent
SPP 23 percent
Table 5-1: Transfer Sink Distribution
MTEP17 analysis determined that 5,123 MW of additional generation could be sourced from the
incremental energy zones to serve future renewable energy mandates (Table 5-2). For their respective
model years, MTEP14 and MTEP11 analysis determined that 4,335 MW and 2,230 MW of additional
generation could be sourced from the incremental energy zones.
Wind Zone Incremental Wind Enabled
IN-K 672
MI-B 989
MI-E 1,001
MI-F 727
MI-I 853
MO-C 31
WI-B 399
WI-D 451
Table 5-2: Incremental Wind Enabled Above 2031 Mandated Level, by Zone
Incremental wind-enabled numbers were calculated using a single optimal transfer pass technique, which
implements a linear programming solver to come up with the maximum MW transfer that can be made
without causing additional violations. When the results from the curtailment analyses and the wind-
enabled analyses are combined, MTEP17 results show the MVP Portfolio enables a total of 52.8 million
MWh of renewable energy to meet the renewable energy mandates through 2031. System wide, the
MTEP17 wind enablement amount is substantively similar to 2014 and 2011 analyses — 43 million MWh
and 41 million MWh, respectively. For individual zones however, this value can be heavily dependent on
the details of the models — individual unit dispatches, load levels, area interchanges, topology changes,
etc. In each case, market trade-offs (seen in the dispatch or unit commitment) have a big impact on what
units can run. Because of these sensitivities the Wind Enablement optimization calculation is done only
for the system as a whole, without looking to individual regions.
2017 MVP TRIENNIAL REVIEW REPORT
23
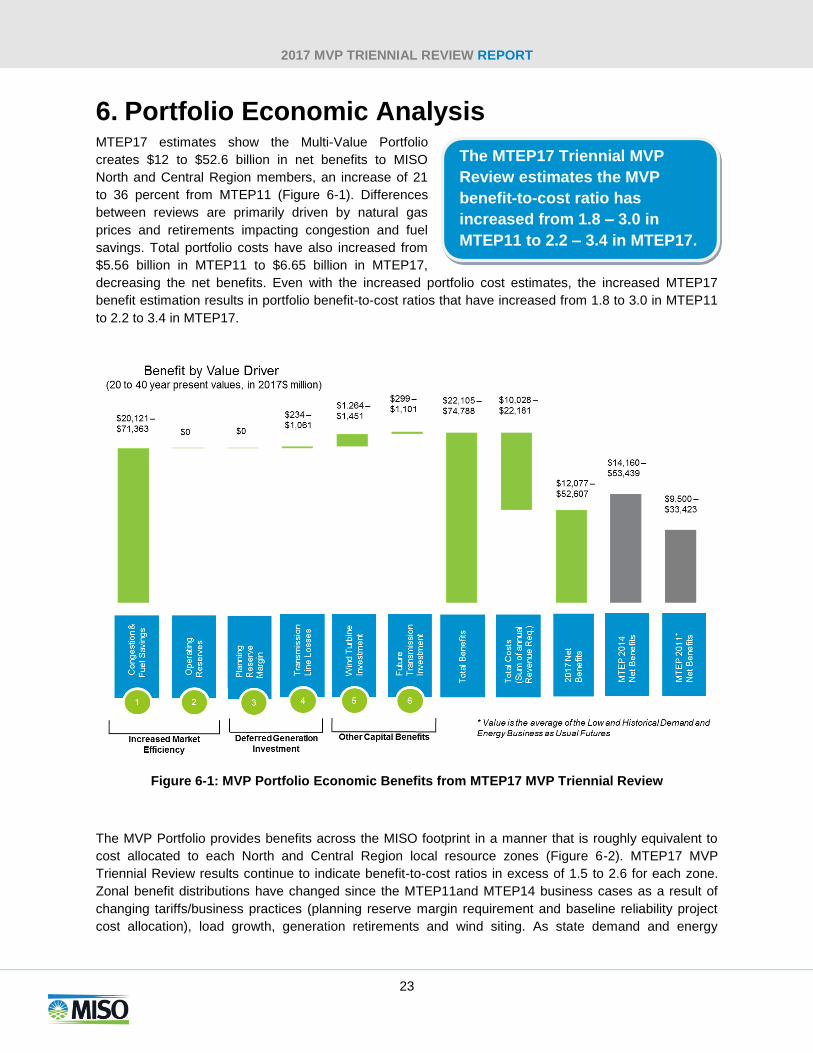
6. Portfolio Economic Analysis MTEP17 estimates show the Multi-Value Portfolio
creates $12 to $52.6 billion in net benefits to MISO
North and Central Region members, an increase of 21
to 36 percent from MTEP11 (Figure 6-1). Differences
between reviews are primarily driven by natural gas
prices and retirements impacting congestion and fuel
savings. Total portfolio costs have also increased from
$5.56 billion in MTEP11 to $6.65 billion in MTEP17,
decreasing the net benefits. Even with the increased portfolio cost estimates, the increased MTEP17
benefit estimation results in portfolio benefit-to-cost ratios that have increased from 1.8 to 3.0 in MTEP11
to 2.2 to 3.4 in MTEP17.
Figure 6-1: MVP Portfolio Economic Benefits from MTEP17 MVP Triennial Review
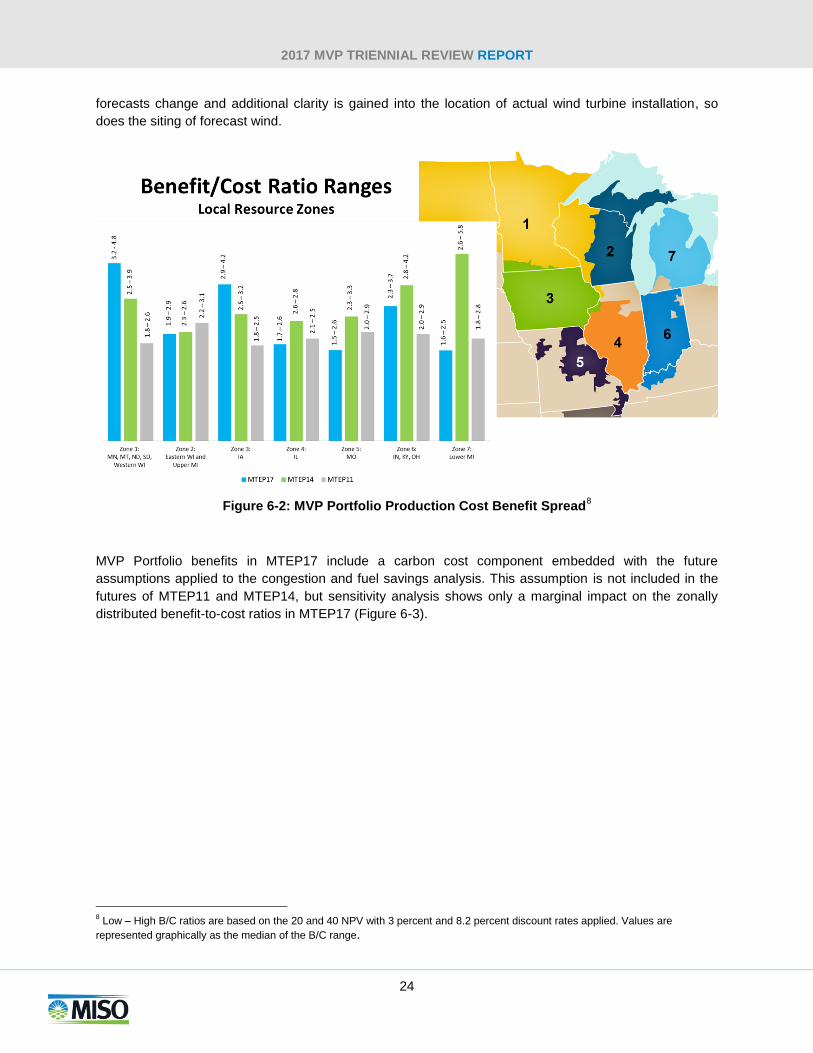
The MVP Portfolio provides benefits across the MISO footprint in a manner that is roughly equivalent to
cost allocated to each North and Central Region local resource zones (Figure 6-2). MTEP17 MVP
Triennial Review results continue to indicate benefit-to-cost ratios in excess of 1.5 to 2.6 for each zone.
Zonal benefit distributions have changed since the MTEP11and MTEP14 business cases as a result of
changing tariffs/business practices (planning reserve margin requirement and baseline reliability project
cost allocation), load growth, generation retirements and wind siting. As state demand and energy
The MTEP17 Triennial MVP
Review estimates the MVP
benefit-to-cost ratio has
increased from 1.8 – 3.0 in
MTEP11 to 2.2 – 3.4 in MTEP17.
2017 MVP TRIENNIAL REVIEW REPORT
24
forecasts change and additional clarity is gained into the location of actual wind turbine installation, so
does the siting of forecast wind.
Figure 6-2: MVP Portfolio Production Cost Benefit Spread8
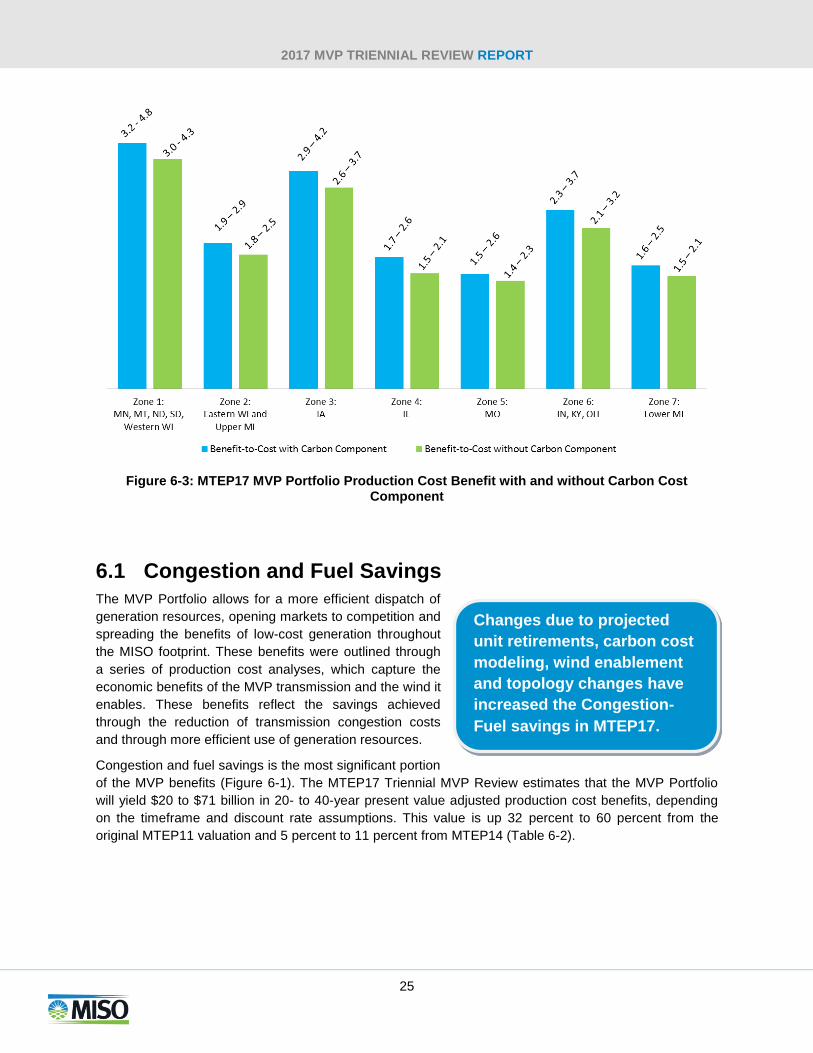
MVP Portfolio benefits in MTEP17 include a carbon cost component embedded with the future
assumptions applied to the congestion and fuel savings analysis. This assumption is not included in the
futures of MTEP11 and MTEP14, but sensitivity analysis shows only a marginal impact on the zonally
distributed benefit-to-cost ratios in MTEP17 (Figure 6-3).
8 Low – High B/C ratios are based on the 20 and 40 NPV with 3 percent and 8.2 percent discount rates applied. Values are
represented graphically as the median of the B/C range.
2017 MVP TRIENNIAL REVIEW REPORT
25
Figure 6-3: MTEP17 MVP Portfolio Production Cost Benefit with and without Carbon Cost Component
6.1 Congestion and Fuel Savings
The MVP Portfolio allows for a more efficient dispatch of
generation resources, opening markets to competition and
spreading the benefits of low-cost generation throughout
the MISO footprint. These benefits were outlined through
a series of production cost analyses, which capture the
economic benefits of the MVP transmission and the wind it
enables. These benefits reflect the savings achieved
through the reduction of transmission congestion costs
and through more efficient use of generation resources.
Congestion and fuel savings is the most significant portion
of the MVP benefits (Figure 6-1). The MTEP17 Triennial MVP Review estimates that the MVP Portfolio
will yield $20 to $71 billion in 20- to 40-year present value adjusted production cost benefits, depending
on the timeframe and discount rate assumptions. This value is up 32 percent to 60 percent from the
original MTEP11 valuation and 5 percent to 11 percent from MTEP14 (Table 6-2).
Changes due to projected
unit retirements, carbon cost
modeling, wind enablement
and topology changes have
increased the Congestion-
Fuel savings in MTEP17.
2017 MVP TRIENNIAL REVIEW REPORT
26
MTEP17 MTEP14 MTEP11
3% Discount Rate; 20 Year NPV 31,797 30,214 23,603
8% Discount Rate; 20 Year NPV 20,121 18,698 15,295
3% Discount Rate; 40 Year NPV 71,363 64,157 44,508
8% Discount Rate; 40 Year NPV 29,783 27,017 20,478
Table 6-2: Congestion and Fuel Savings Benefit ($M-2017)
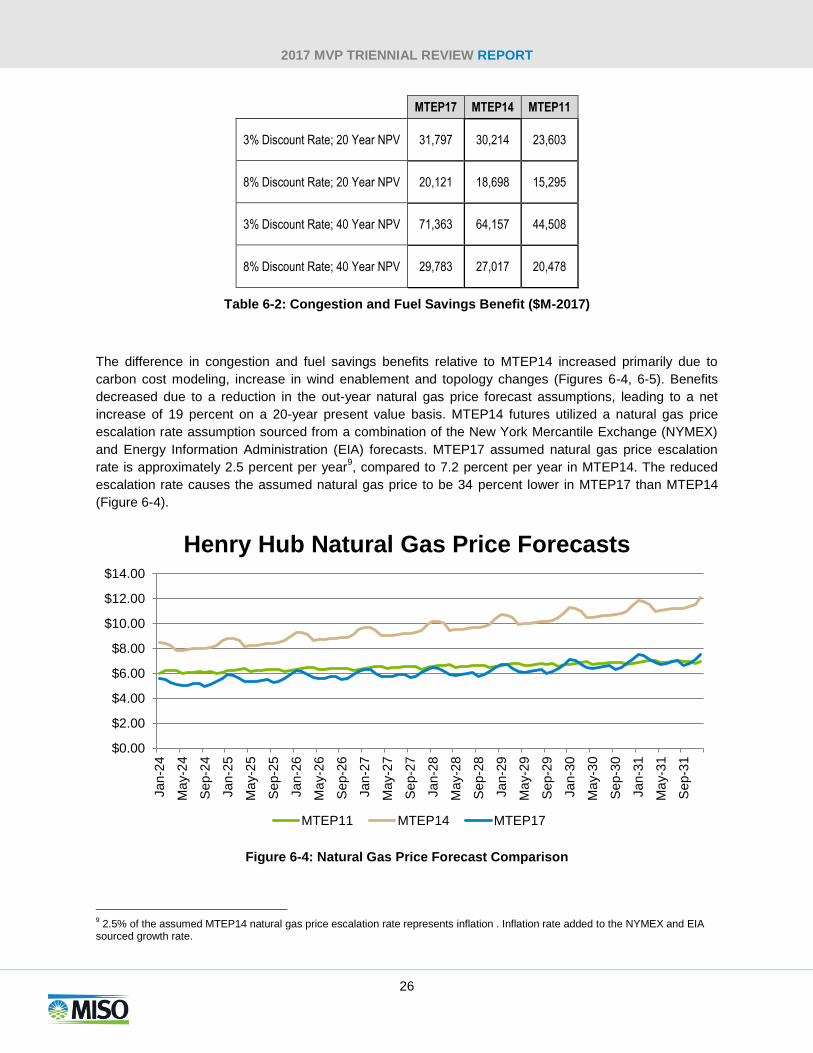
The difference in congestion and fuel savings benefits relative to MTEP14 increased primarily due to
carbon cost modeling, increase in wind enablement and topology changes (Figures 6-4, 6-5). Benefits
decreased due to a reduction in the out-year natural gas price forecast assumptions, leading to a net
increase of 19 percent on a 20-year present value basis. MTEP14 futures utilized a natural gas price
escalation rate assumption sourced from a combination of the New York Mercantile Exchange (NYMEX)
and Energy Information Administration (EIA) forecasts. MTEP17 assumed natural gas price escalation
rate is approximately 2.5 percent per year9, compared to 7.2 percent per year in MTEP14. The reduced
escalation rate causes the assumed natural gas price to be 34 percent lower in MTEP17 than MTEP14
(Figure 6-4).
Figure 6-4: Natural Gas Price Forecast Comparison
9 2.5% of the assumed MTEP14 natural gas price escalation rate represents inflation . Inflation rate added to the NYMEX and EIA
sourced growth rate.
$0.00
$2.00
$4.00
$6.00
$8.00
$10.00
$12.00
$14.00
Jan-2
4
Ma
y-2
4
Sep-2
4
Jan-2
5
Ma
y-2
5
Sep-2
5
Jan-2
6
Ma
y-2
6
Sep-2
6
Jan-2
7
Ma
y-2
7
Sep-2
7
Jan-2
8
Ma
y-2
8
Sep-2
8
Jan-2
9
Ma
y-2
9
Sep-2
9
Jan-3
0
Ma
y-3
0
Sep-3
0
Jan-3
1
Ma
y-3
1
Sep-3
1
Henry Hub Natural Gas Price Forecasts
MTEP11 MTEP14 MTEP17
2017 MVP TRIENNIAL REVIEW REPORT
27
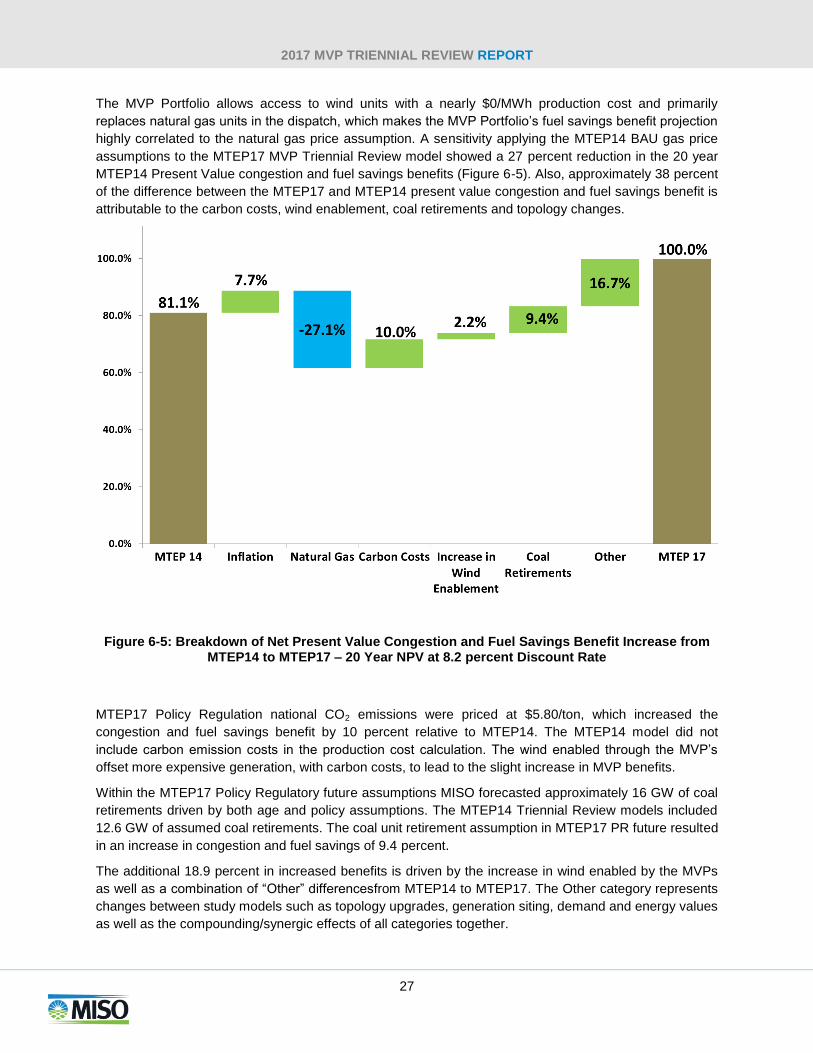
The MVP Portfolio allows access to wind units with a nearly $0/MWh production cost and primarily
replaces natural gas units in the dispatch, which makes the MVP Portfolio’s fuel savings benefit projection
highly correlated to the natural gas price assumption. A sensitivity applying the MTEP14 BAU gas price
assumptions to the MTEP17 MVP Triennial Review model showed a 27 percent reduction in the 20 year
MTEP14 Present Value congestion and fuel savings benefits (Figure 6-5). Also, approximately 38 percent
of the difference between the MTEP17 and MTEP14 present value congestion and fuel savings benefit is
attributable to the carbon costs, wind enablement, coal retirements and topology changes.
Figure 6-5: Breakdown of Net Present Value Congestion and Fuel Savings Benefit Increase from MTEP14 to MTEP17 – 20 Year NPV at 8.2 percent Discount Rate
MTEP17 Policy Regulation national CO2 emissions were priced at $5.80/ton, which increased the
congestion and fuel savings benefit by 10 percent relative to MTEP14. The MTEP14 model did not
include carbon emission costs in the production cost calculation. The wind enabled through the MVP’s
offset more expensive generation, with carbon costs, to lead to the slight increase in MVP benefits.
Within the MTEP17 Policy Regulatory future assumptions MISO forecasted approximately 16 GW of coal
retirements driven by both age and policy assumptions. The MTEP14 Triennial Review models included
12.6 GW of assumed coal retirements. The coal unit retirement assumption in MTEP17 PR future resulted
in an increase in congestion and fuel savings of 9.4 percent.
The additional 18.9 percent in increased benefits is driven by the increase in wind enabled by the MVPs
as well as a combination of “Other” differencesfrom MTEP14 to MTEP17. The Other category represents
changes between study models such as topology upgrades, generation siting, demand and energy values
as well as the compounding/synergic effects of all categories together.
2017 MVP TRIENNIAL REVIEW REPORT
28
The MVP Portfolio is located solely in the MISO North and Central Regions and, therefore, the inclusion
of the South Region to the MISO dispatch pool have little effect on MVP-related production cost savings.
The MTEP17 MVP Triennial Review economic analysis was performed with 2026 and 2031 Policy
Regulation production cost models, with wind curtailments considered for 2026, 2031 and 2036. The
2036 case was used as a proxy case to determine the additional benefits from wind enabled above and
beyond that mandated by the year 2031.
6.2 Operating Reserves
In addition to the energy benefits quantified in the production cost analyses, the 2011 business case
showed the MVP Portfolio also reduces operating
reserve costs. The 2011 business case showed that the
MVP Portfolio decreases congestion on the system,
increasing the transfer capability into several areas that
would otherwise have to hold additional operating
reserves under certain system conditions.
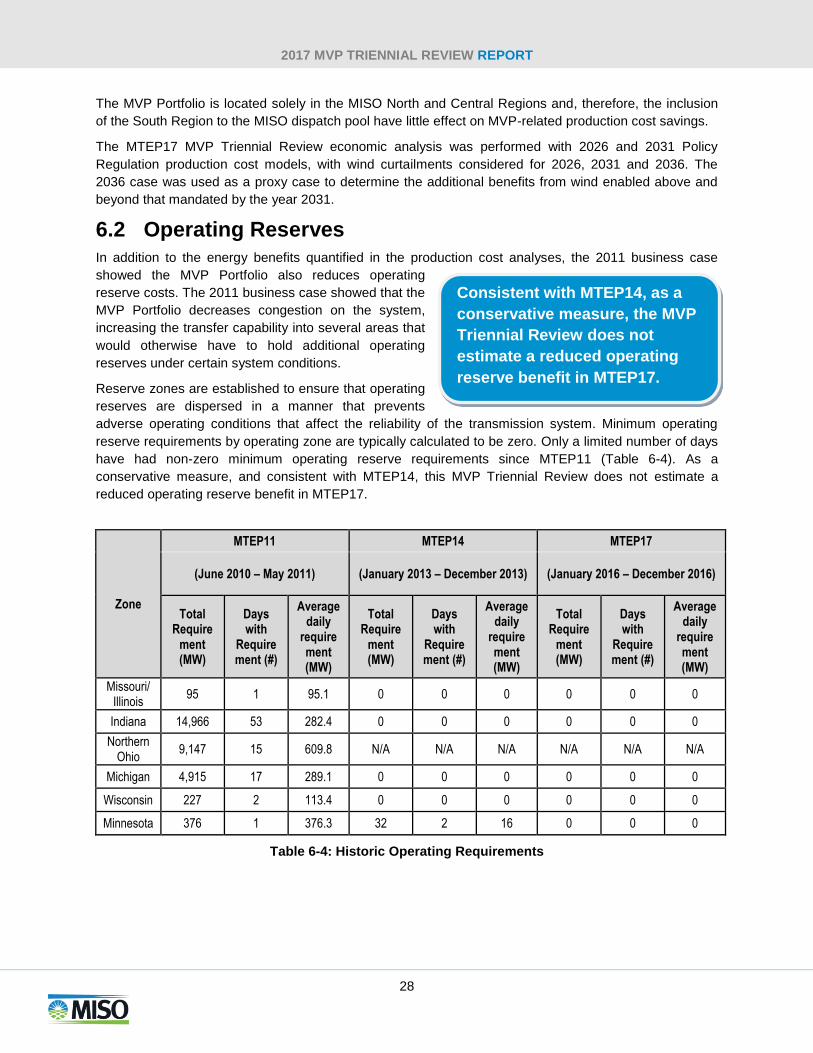
Reserve zones are established to ensure that operating
reserves are dispersed in a manner that prevents
adverse operating conditions that affect the reliability of the transmission system. Minimum operating
reserve requirements by operating zone are typically calculated to be zero. Only a limited number of days
have had non-zero minimum operating reserve requirements since MTEP11 (Table 6-4). As a
conservative measure, and consistent with MTEP14, this MVP Triennial Review does not estimate a
reduced operating reserve benefit in MTEP17.
Zone
MTEP11 MTEP14 MTEP17
(June 2010 – May 2011) (January 2013 – December 2013) (January 2016 – December 2016)
Total Require
ment (MW)
Days with
Requirement (#)
Average daily
requirement (MW)
Total Require
ment (MW)
Days with
Requirement (#)
Average daily
requirement (MW)
Total Require
ment (MW)
Days with
Requirement (#)
Average daily
requirement (MW)
Missouri/ Illinois
95 1 95.1 0 0 0 0 0 0
Indiana 14,966 53 282.4 0 0 0 0 0 0
Northern Ohio
9,147 15 609.8 N/A N/A N/A N/A N/A N/A
Michigan 4,915 17 289.1 0 0 0 0 0 0
Wisconsin 227 2 113.4 0 0 0 0 0 0
Minnesota 376 1 376.3 32 2 16 0 0 0
Table 6-4: Historic Operating Requirements
Consistent with MTEP14, as a
conservative measure, the MVP
Triennial Review does not
estimate a reduced operating
reserve benefit in MTEP17.
2017 MVP TRIENNIAL REVIEW REPORT
29
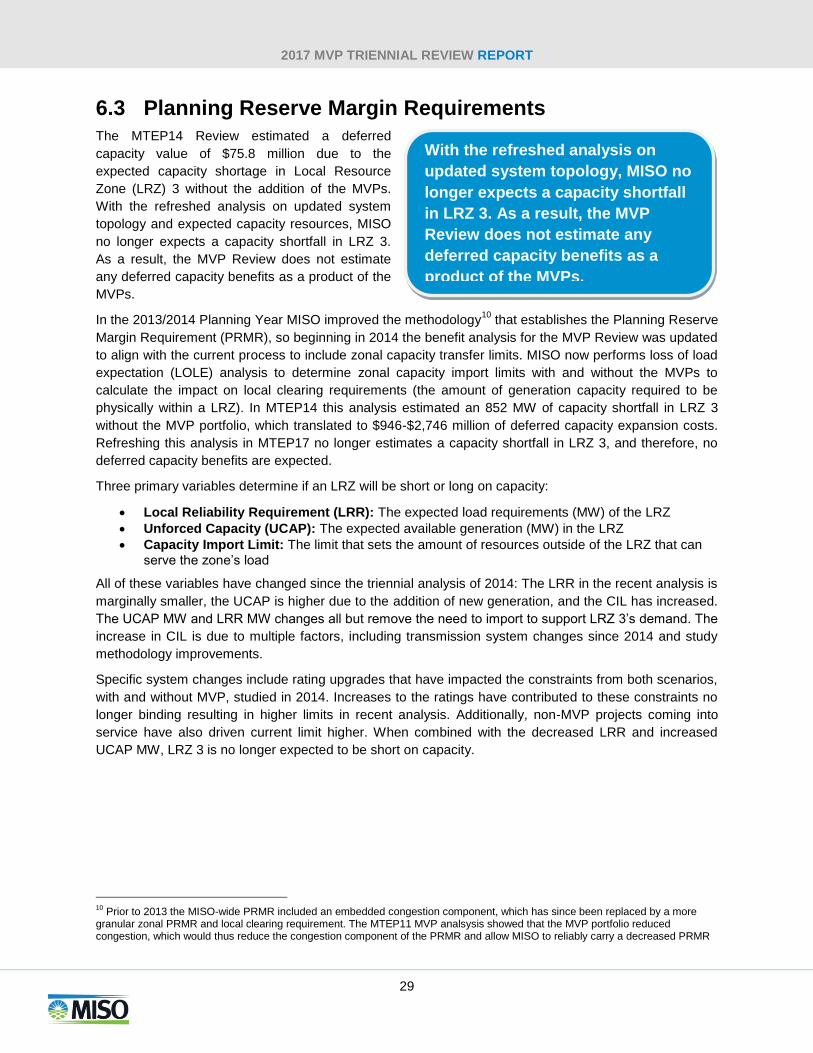
6.3 Planning Reserve Margin Requirements
The MTEP14 Review estimated a deferred
capacity value of $75.8 million due to the
expected capacity shortage in Local Resource
Zone (LRZ) 3 without the addition of the MVPs.
With the refreshed analysis on updated system
topology and expected capacity resources, MISO
no longer expects a capacity shortfall in LRZ 3.
As a result, the MVP Review does not estimate
any deferred capacity benefits as a product of the
MVPs.
In the 2013/2014 Planning Year MISO improved the methodology10
that establishes the Planning Reserve
Margin Requirement (PRMR), so beginning in 2014 the benefit analysis for the MVP Review was updated
to align with the current process to include zonal capacity transfer limits. MISO now performs loss of load
expectation (LOLE) analysis to determine zonal capacity import limits with and without the MVPs to
calculate the impact on local clearing requirements (the amount of generation capacity required to be
physically within a LRZ). In MTEP14 this analysis estimated an 852 MW of capacity shortfall in LRZ 3
without the MVP portfolio, which translated to $946-$2,746 million of deferred capacity expansion costs.
Refreshing this analysis in MTEP17 no longer estimates a capacity shortfall in LRZ 3, and therefore, no
deferred capacity benefits are expected.
Three primary variables determine if an LRZ will be short or long on capacity:
Local Reliability Requirement (LRR): The expected load requirements (MW) of the LRZ
Unforced Capacity (UCAP): The expected available generation (MW) in the LRZ
Capacity Import Limit: The limit that sets the amount of resources outside of the LRZ that can serve the zone’s load
All of these variables have changed since the triennial analysis of 2014: The LRR in the recent analysis is
marginally smaller, the UCAP is higher due to the addition of new generation, and the CIL has increased.
The UCAP MW and LRR MW changes all but remove the need to import to support LRZ 3’s demand. The
increase in CIL is due to multiple factors, including transmission system changes since 2014 and study
methodology improvements.
Specific system changes include rating upgrades that have impacted the constraints from both scenarios,
with and without MVP, studied in 2014. Increases to the ratings have contributed to these constraints no
longer binding resulting in higher limits in recent analysis. Additionally, non-MVP projects coming into
service have also driven current limit higher. When combined with the decreased LRR and increased
UCAP MW, LRZ 3 is no longer expected to be short on capacity.
10
Prior to 2013 the MISO-wide PRMR included an embedded congestion component, which has since been replaced by a more granular zonal PRMR and local clearing requirement. The MTEP11 MVP analsysis showed that the MVP portfolio reduced congestion, which would thus reduce the congestion component of the PRMR and allow MISO to reliably carry a decreased PRMR
With the refreshed analysis on
updated system topology, MISO no
longer expects a capacity shortfall
in LRZ 3. As a result, the MVP
Review does not estimate any
deferred capacity benefits as a
product of the MVPs.
2017 MVP TRIENNIAL REVIEW REPORT
30
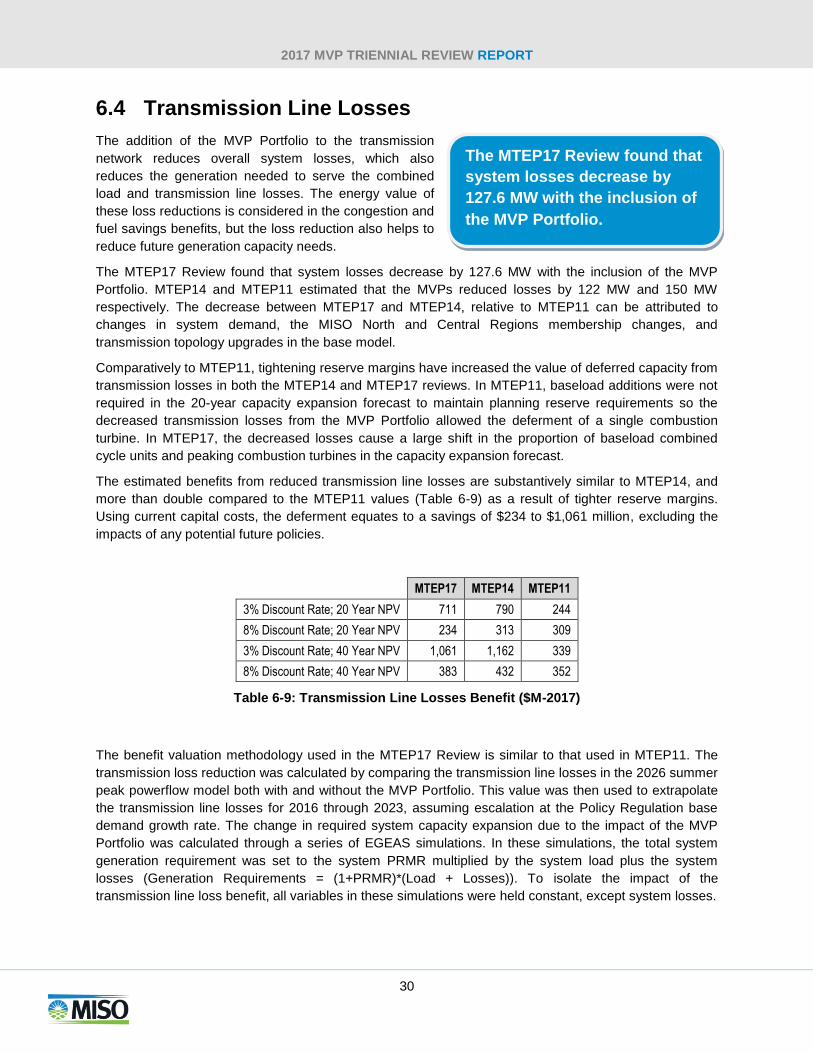
6.4 Transmission Line Losses
The addition of the MVP Portfolio to the transmission
network reduces overall system losses, which also
reduces the generation needed to serve the combined
load and transmission line losses. The energy value of
these loss reductions is considered in the congestion and
fuel savings benefits, but the loss reduction also helps to
reduce future generation capacity needs.
The MTEP17 Review found that system losses decrease by 127.6 MW with the inclusion of the MVP
Portfolio. MTEP14 and MTEP11 estimated that the MVPs reduced losses by 122 MW and 150 MW
respectively. The decrease between MTEP17 and MTEP14, relative to MTEP11 can be attributed to
changes in system demand, the MISO North and Central Regions membership changes, and
transmission topology upgrades in the base model.
Comparatively to MTEP11, tightening reserve margins have increased the value of deferred capacity from
transmission losses in both the MTEP14 and MTEP17 reviews. In MTEP11, baseload additions were not
required in the 20-year capacity expansion forecast to maintain planning reserve requirements so the
decreased transmission losses from the MVP Portfolio allowed the deferment of a single combustion
turbine. In MTEP17, the decreased losses cause a large shift in the proportion of baseload combined
cycle units and peaking combustion turbines in the capacity expansion forecast.
The estimated benefits from reduced transmission line losses are substantively similar to MTEP14, and
more than double compared to the MTEP11 values (Table 6-9) as a result of tighter reserve margins.
Using current capital costs, the deferment equates to a savings of $234 to $1,061 million, excluding the
impacts of any potential future policies.
MTEP17 MTEP14 MTEP11
3% Discount Rate; 20 Year NPV 711 790 244
8% Discount Rate; 20 Year NPV 234 313 309
3% Discount Rate; 40 Year NPV 1,061 1,162 339
8% Discount Rate; 40 Year NPV 383 432 352
Table 6-9: Transmission Line Losses Benefit ($M-2017)
The benefit valuation methodology used in the MTEP17 Review is similar to that used in MTEP11. The
transmission loss reduction was calculated by comparing the transmission line losses in the 2026 summer
peak powerflow model both with and without the MVP Portfolio. This value was then used to extrapolate
the transmission line losses for 2016 through 2023, assuming escalation at the Policy Regulation base
demand growth rate. The change in required system capacity expansion due to the impact of the MVP
Portfolio was calculated through a series of EGEAS simulations. In these simulations, the total system
generation requirement was set to the system PRMR multiplied by the system load plus the system
losses (Generation Requirements = (1+PRMR)*(Load + Losses)). To isolate the impact of the
transmission line loss benefit, all variables in these simulations were held constant, except system losses.
The MTEP17 Review found that
system losses decrease by
127.6 MW with the inclusion of
the MVP Portfolio.
2017 MVP TRIENNIAL REVIEW REPORT
31
The difference in capital fixed charges and fixed operation and maintenance costs in the no-MVP case
and the post-MVP case is equal to the capacity benefit from transmission loss reduction, due to the
addition of the MVP portfolio to the transmission system.
6.5 Wind Turbine Investment
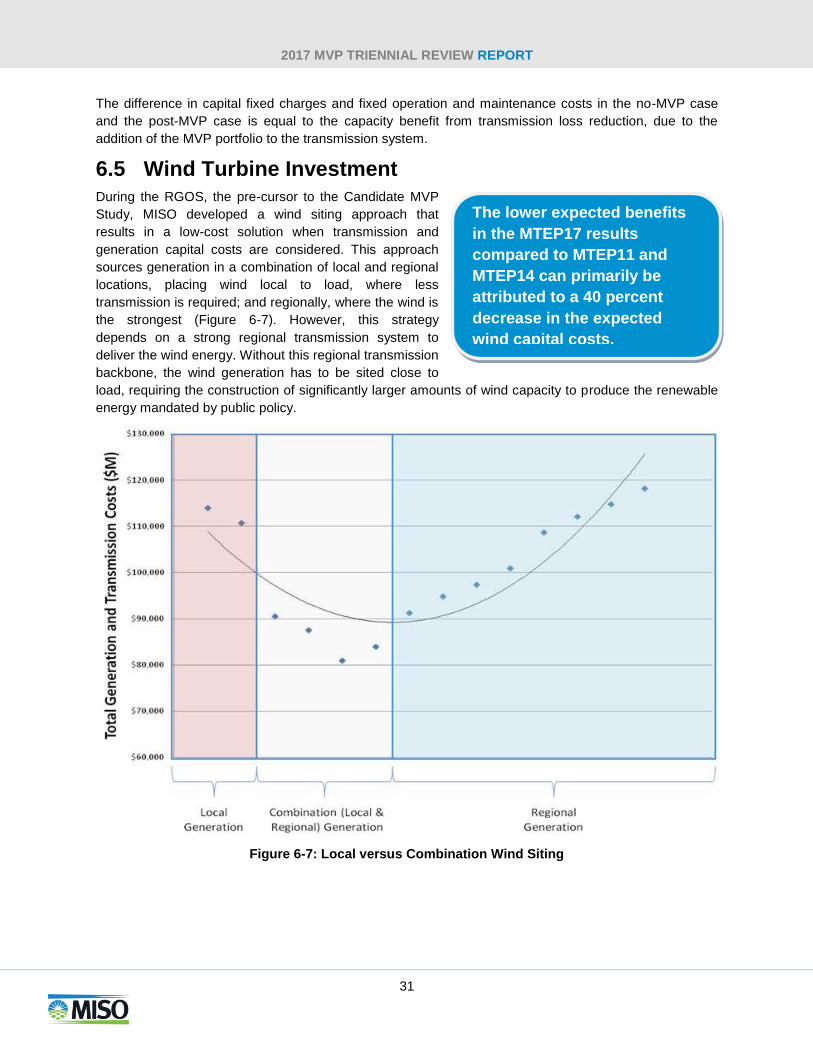
During the RGOS, the pre-cursor to the Candidate MVP
Study, MISO developed a wind siting approach that
results in a low-cost solution when transmission and
generation capital costs are considered. This approach
sources generation in a combination of local and regional
locations, placing wind local to load, where less
transmission is required; and regionally, where the wind is
the strongest (Figure 6-7). However, this strategy
depends on a strong regional transmission system to
deliver the wind energy. Without this regional transmission
backbone, the wind generation has to be sited close to
load, requiring the construction of significantly larger amounts of wind capacity to produce the renewable
energy mandated by public policy.
Figure 6-7: Local versus Combination Wind Siting
The lower expected benefits
in the MTEP17 results
compared to MTEP11 and
MTEP14 can primarily be
attributed to a 40 percent
decrease in the expected
wind capital costs,

2017 MVP TRIENNIAL REVIEW REPORT
32
The MTEP17 Triennial MVP Review found that the benefits from the optimization of wind generation
siting are lower in magnitude when compared with MTEP11 and MTEP14 (Table 6-10). The lower
expected benefits in the MTEP17 results compared to MTEP11 and MTEP14 can primarily be attributed
to a 40 percent decrease in the expected wind capital costs.
MTEP17 MTEP14 MTEP11
3% Discount Rate; 20 Year NPV 1,264 2,361 1,992
8% Discount Rate; 20 Year NPV 1,451 2,717 2,393
3% Discount Rate; 40 Year NPV 1,264 2,361 1,992
8% Discount Rate; 40 Year NPV 1,451 2,717 2,393
Table 6-10: Wind Turbine Investment Benefit ($M-2017)
In the RGOS study, it was determined that 11 percent less wind would need to be built to meet renewable
energy mandates in a combination local/regional methodology relative to a local only approach. This
change in generation was applied to energy required by the renewable energy mandates, as well as the
total wind energy enabled by the MVP Portfolio (Section 5). This resulted in a total of 3.4 GW of avoided
wind generation (Table 6-11).
Year MVP Portfolio Enabled Wind
(MW)
Equivalent Local Wind Generation (MW)
Incremental Cumulative Wind Benefit (MW)
Pre-2021 15,949 17,741 1,792
2021 21,139 23,514 2,375
2026 24,612 27,377 2,765
2031 25,689 28,575 2,886
Full Wind Enabled 30,812 34,273 3,461
Table 6-11: Renewable Energy Requirements, Combination versus Local Approach
The incremental wind benefits were monetized by applying a value of $1.2 to $2 million/MW, based on the
NREL Annual Technology Baseline report that estimates of the capital costs to build onshore wind11
. The
total wind-enabled benefits were then spread over the expected life of a wind turbine. Consistent with the
MTEP11 and MTEP14 business case that avoids overstating the benefits of the combination wind siting, a
transmission cost differential of approximately $1.5 billion was subtracted from the overall wind turbine
capital savings to represent the expected lower transmission costs required by a local-only siting strategy.
11
Updated in 2016
2017 MVP TRIENNIAL REVIEW REPORT
33
6.6 Future Transmission Investment
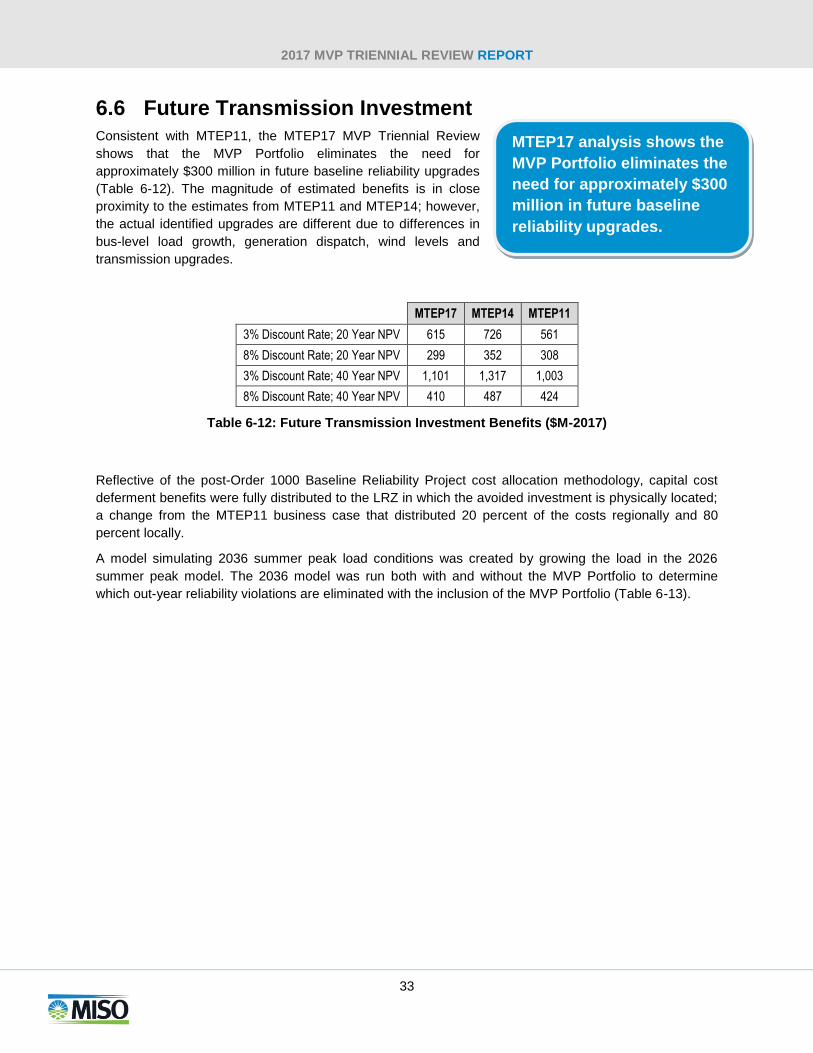
Consistent with MTEP11, the MTEP17 MVP Triennial Review
shows that the MVP Portfolio eliminates the need for
approximately $300 million in future baseline reliability upgrades
(Table 6-12). The magnitude of estimated benefits is in close
proximity to the estimates from MTEP11 and MTEP14; however,
the actual identified upgrades are different due to differences in
bus-level load growth, generation dispatch, wind levels and
transmission upgrades.
MTEP17 MTEP14 MTEP11
3% Discount Rate; 20 Year NPV 615 726 561
8% Discount Rate; 20 Year NPV 299 352 308
3% Discount Rate; 40 Year NPV 1,101 1,317 1,003
8% Discount Rate; 40 Year NPV 410 487 424
Table 6-12: Future Transmission Investment Benefits ($M-2017)
Reflective of the post-Order 1000 Baseline Reliability Project cost allocation methodology, capital cost
deferment benefits were fully distributed to the LRZ in which the avoided investment is physically located;
a change from the MTEP11 business case that distributed 20 percent of the costs regionally and 80
percent locally.
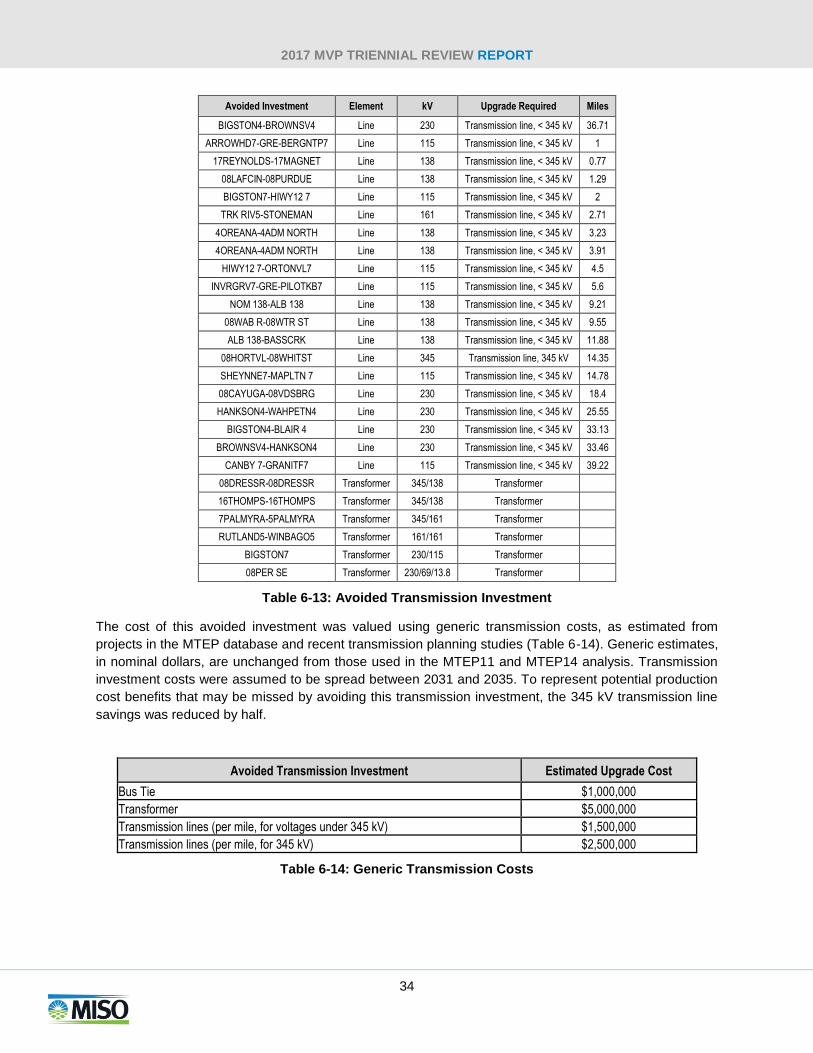
A model simulating 2036 summer peak load conditions was created by growing the load in the 2026
summer peak model. The 2036 model was run both with and without the MVP Portfolio to determine
which out-year reliability violations are eliminated with the inclusion of the MVP Portfolio (Table 6-13).
MTEP17 analysis shows the
MVP Portfolio eliminates the
need for approximately $300
million in future baseline
reliability upgrades.
2017 MVP TRIENNIAL REVIEW REPORT
34
Avoided Investment Element kV Upgrade Required Miles
BIGSTON4-BROWNSV4 Line 230 Transmission line, < 345 kV 36.71
ARROWHD7-GRE-BERGNTP7 Line 115 Transmission line, < 345 kV 1
17REYNOLDS-17MAGNET Line 138 Transmission line, < 345 kV 0.77
08LAFCIN-08PURDUE Line 138 Transmission line, < 345 kV 1.29
BIGSTON7-HIWY12 7 Line 115 Transmission line, < 345 kV 2
TRK RIV5-STONEMAN Line 161 Transmission line, < 345 kV 2.71
4OREANA-4ADM NORTH Line 138 Transmission line, < 345 kV 3.23
4OREANA-4ADM NORTH Line 138 Transmission line, < 345 kV 3.91
HIWY12 7-ORTONVL7 Line 115 Transmission line, < 345 kV 4.5
INVRGRV7-GRE-PILOTKB7 Line 115 Transmission line, < 345 kV 5.6
NOM 138-ALB 138 Line 138 Transmission line, < 345 kV 9.21
08WAB R-08WTR ST Line 138 Transmission line, < 345 kV 9.55
ALB 138-BASSCRK Line 138 Transmission line, < 345 kV 11.88
08HORTVL-08WHITST Line 345 Transmission line, 345 kV 14.35
SHEYNNE7-MAPLTN 7 Line 115 Transmission line, < 345 kV 14.78
08CAYUGA-08VDSBRG Line 230 Transmission line, < 345 kV 18.4
HANKSON4-WAHPETN4 Line 230 Transmission line, < 345 kV 25.55
BIGSTON4-BLAIR 4 Line 230 Transmission line, < 345 kV 33.13
BROWNSV4-HANKSON4 Line 230 Transmission line, < 345 kV 33.46
CANBY 7-GRANITF7 Line 115 Transmission line, < 345 kV 39.22
08DRESSR-08DRESSR Transformer 345/138 Transformer
16THOMPS-16THOMPS Transformer 345/138 Transformer
7PALMYRA-5PALMYRA Transformer 345/161 Transformer
RUTLAND5-WINBAGO5 Transformer 161/161 Transformer
BIGSTON7 Transformer 230/115 Transformer
08PER SE Transformer 230/69/13.8 Transformer
Table 6-13: Avoided Transmission Investment
The cost of this avoided investment was valued using generic transmission costs, as estimated from
projects in the MTEP database and recent transmission planning studies (Table 6-14). Generic estimates,
in nominal dollars, are unchanged from those used in the MTEP11 and MTEP14 analysis. Transmission
investment costs were assumed to be spread between 2031 and 2035. To represent potential production
cost benefits that may be missed by avoiding this transmission investment, the 345 kV transmission line
savings was reduced by half.
Avoided Transmission Investment Estimated Upgrade Cost
Bus Tie $1,000,000
Transformer $5,000,000
Transmission lines (per mile, for voltages under 345 kV) $1,500,000
Transmission lines (per mile, for 345 kV) $2,500,000
Table 6-14: Generic Transmission Costs
2017 MVP TRIENNIAL REVIEW REPORT
35
7. Qualitative and Social Benefits Aside from widespread economic and public policy benefits, the MVP Portfolio also provides benefits
based on qualitative or social values. Consistent with the MTEP11 analysis, these benefits are excluded
from the business case. The quantified values from the economic analysis may be conservative because
they do not account for the full potential benefits of the MVP Portfolio.
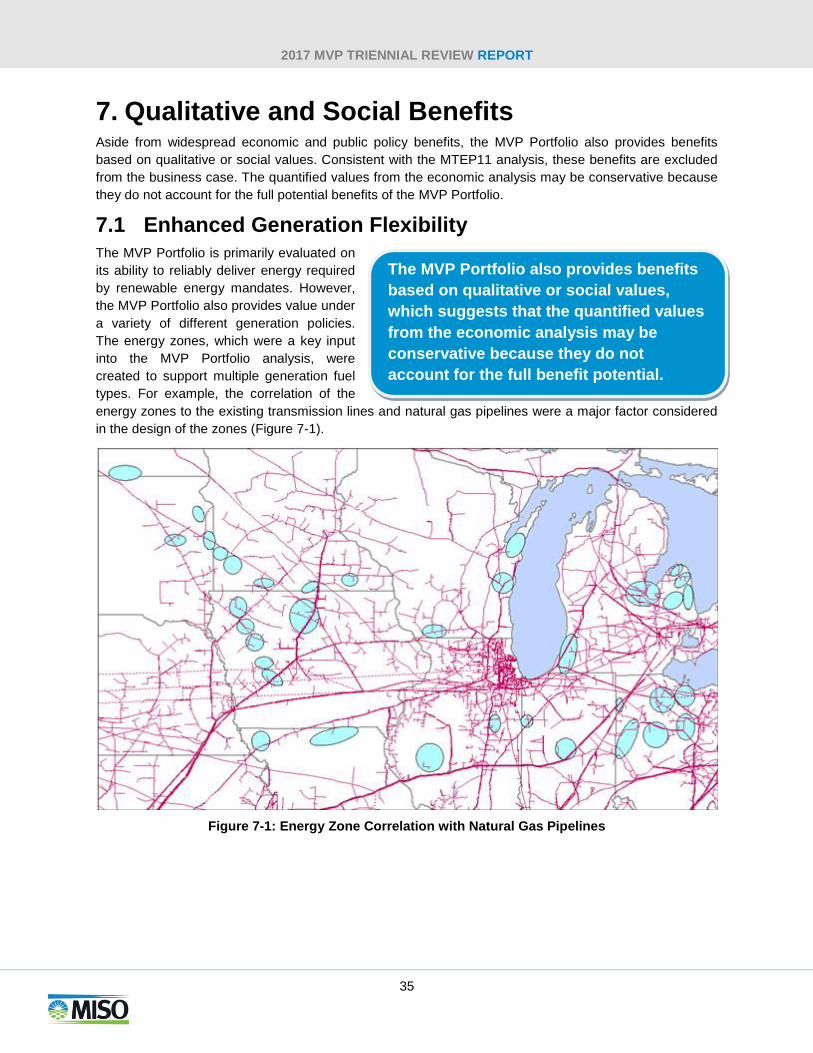
7.1 Enhanced Generation Flexibility
The MVP Portfolio is primarily evaluated on
its ability to reliably deliver energy required
by renewable energy mandates. However,
the MVP Portfolio also provides value under
a variety of different generation policies.
The energy zones, which were a key input
into the MVP Portfolio analysis, were
created to support multiple generation fuel
types. For example, the correlation of the
energy zones to the existing transmission lines and natural gas pipelines were a major factor considered
in the design of the zones (Figure 7-1).
Figure 7-1: Energy Zone Correlation with Natural Gas Pipelines
The MVP Portfolio also provides benefits
based on qualitative or social values,
which suggests that the quantified values
from the economic analysis may be
conservative because they do not
account for the full benefit potential.
2017 MVP TRIENNIAL REVIEW REPORT
36
7.2 Increased System Robustness
A transmission system blackout, or similar event, can have widespread repercussions and result in
billions of dollars of damage. The blackout of the Eastern and Midwestern United States in August 2003
affected more than 50 million people and had an estimated economic impact of between $4 and $10
billion.
The MVP Portfolio creates a more robust regional transmission system that decreases the likelihood of
future blackouts by:
Strengthening the overall transmission system by decreasing the impacts of transmission outages
Increasing access to additional generation under contingent events
Enabling additional transfers of energy across the system during severe conditions
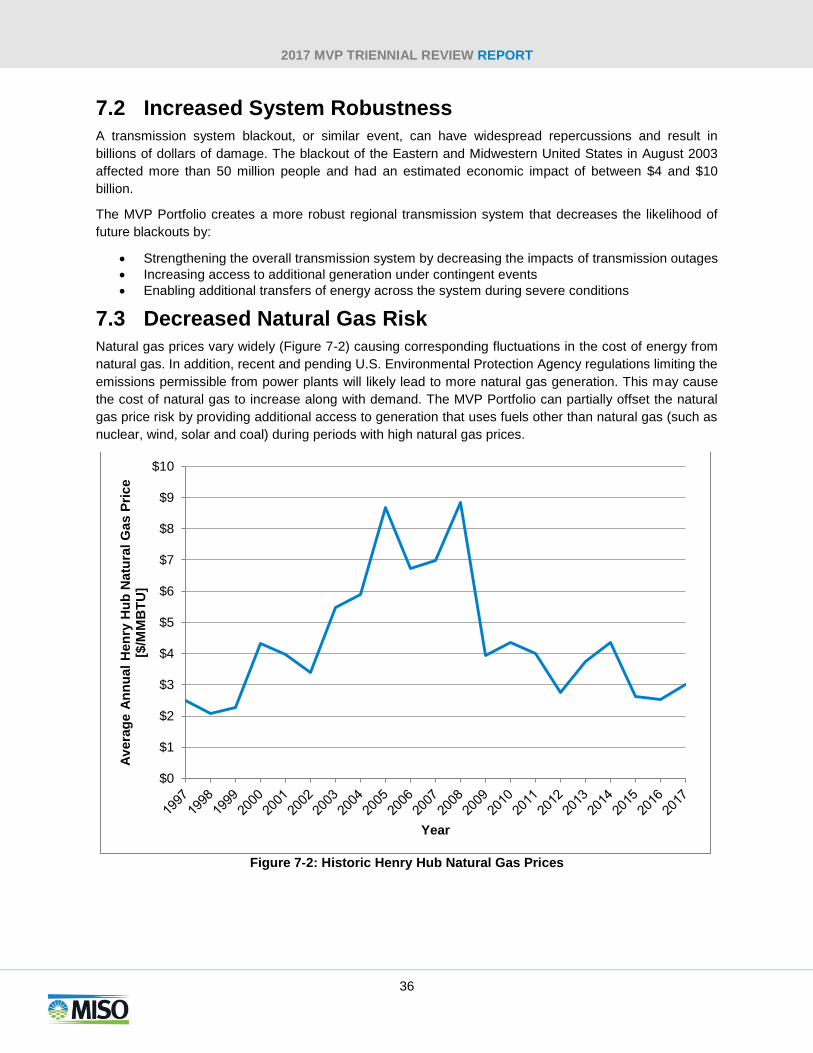
7.3 Decreased Natural Gas Risk
Natural gas prices vary widely (Figure 7-2) causing corresponding fluctuations in the cost of energy from
natural gas. In addition, recent and pending U.S. Environmental Protection Agency regulations limiting the
emissions permissible from power plants will likely lead to more natural gas generation. This may cause
the cost of natural gas to increase along with demand. The MVP Portfolio can partially offset the natural
gas price risk by providing additional access to generation that uses fuels other than natural gas (such as
nuclear, wind, solar and coal) during periods with high natural gas prices.
Figure 7-2: Historic Henry Hub Natural Gas Prices
$0
$1
$2
$3
$4
$5
$6
$7
$8
$9
$10
Av
era
ge A
nn
ual
Hen
ry H
ub
Natu
ral
Gas P
rice
[$/M
MB
TU
]
Year
2017 MVP TRIENNIAL REVIEW REPORT
37
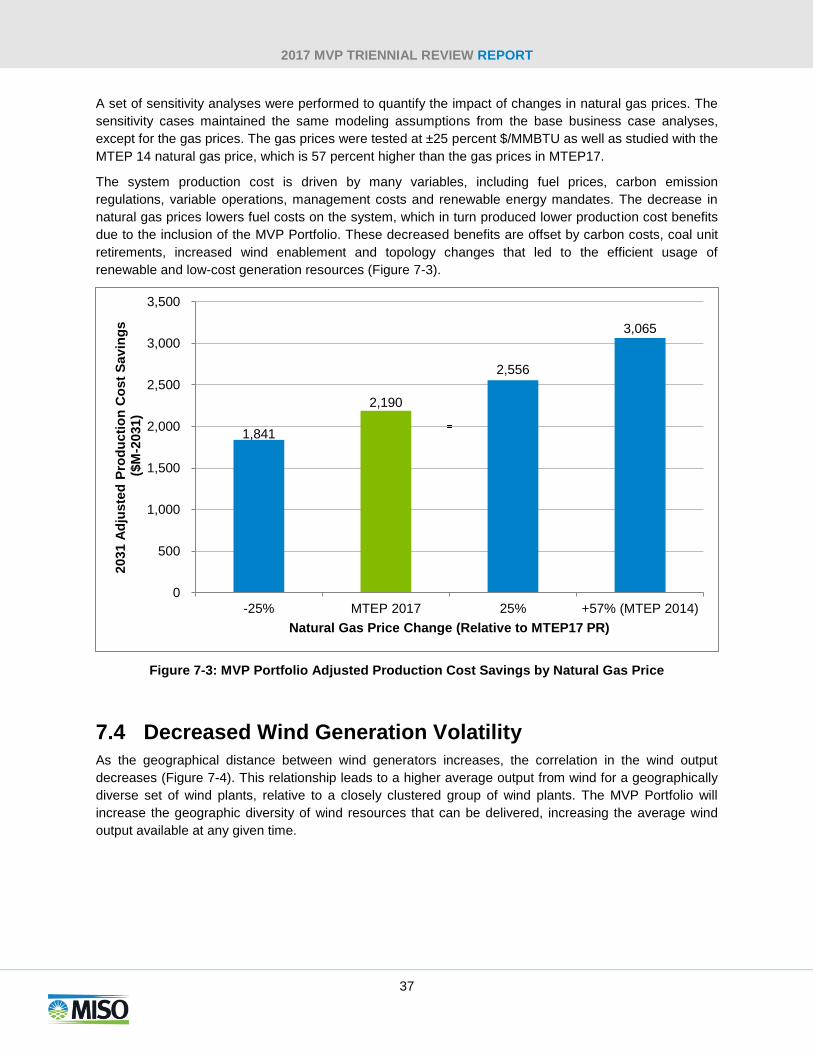
A set of sensitivity analyses were performed to quantify the impact of changes in natural gas prices. The
sensitivity cases maintained the same modeling assumptions from the base business case analyses,
except for the gas prices. The gas prices were tested at ±25 percent $/MMBTU as well as studied with the
MTEP 14 natural gas price, which is 57 percent higher than the gas prices in MTEP17.
The system production cost is driven by many variables, including fuel prices, carbon emission
regulations, variable operations, management costs and renewable energy mandates. The decrease in
natural gas prices lowers fuel costs on the system, which in turn produced lower production cost benefits
due to the inclusion of the MVP Portfolio. These decreased benefits are offset by carbon costs, coal unit
retirements, increased wind enablement and topology changes that led to the efficient usage of
renewable and low-cost generation resources (Figure 7-3).
Figure 7-3: MVP Portfolio Adjusted Production Cost Savings by Natural Gas Price
7.4 Decreased Wind Generation Volatility
As the geographical distance between wind generators increases, the correlation in the wind output
decreases (Figure 7-4). This relationship leads to a higher average output from wind for a geographically
diverse set of wind plants, relative to a closely clustered group of wind plants. The MVP Portfolio will
increase the geographic diversity of wind resources that can be delivered, increasing the average wind
output available at any given time.
1,841
2,190
2,556
3,065
0
500
1,000
1,500
2,000
2,500
3,000
3,500
-25% MTEP 2017 25% +57% (MTEP 2014)
2031 A
dju
ste
d P
rod
ucti
on
Co
st
Sav
ing
s
($M
-2031)
Natural Gas Price Change (Relative to MTEP17 PR)
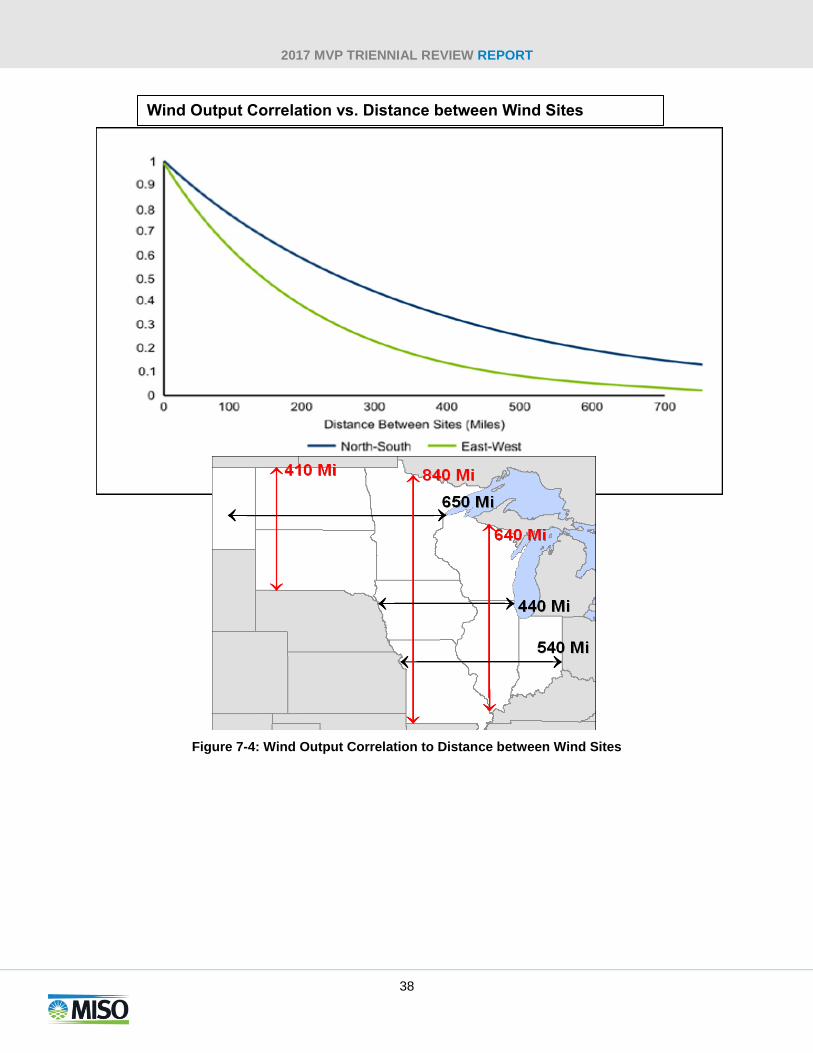
2017 MVP TRIENNIAL REVIEW REPORT
38
Figure 7-4: Wind Output Correlation to Distance between Wind Sites
Wind Output Correlation vs. Distance between Wind Sites
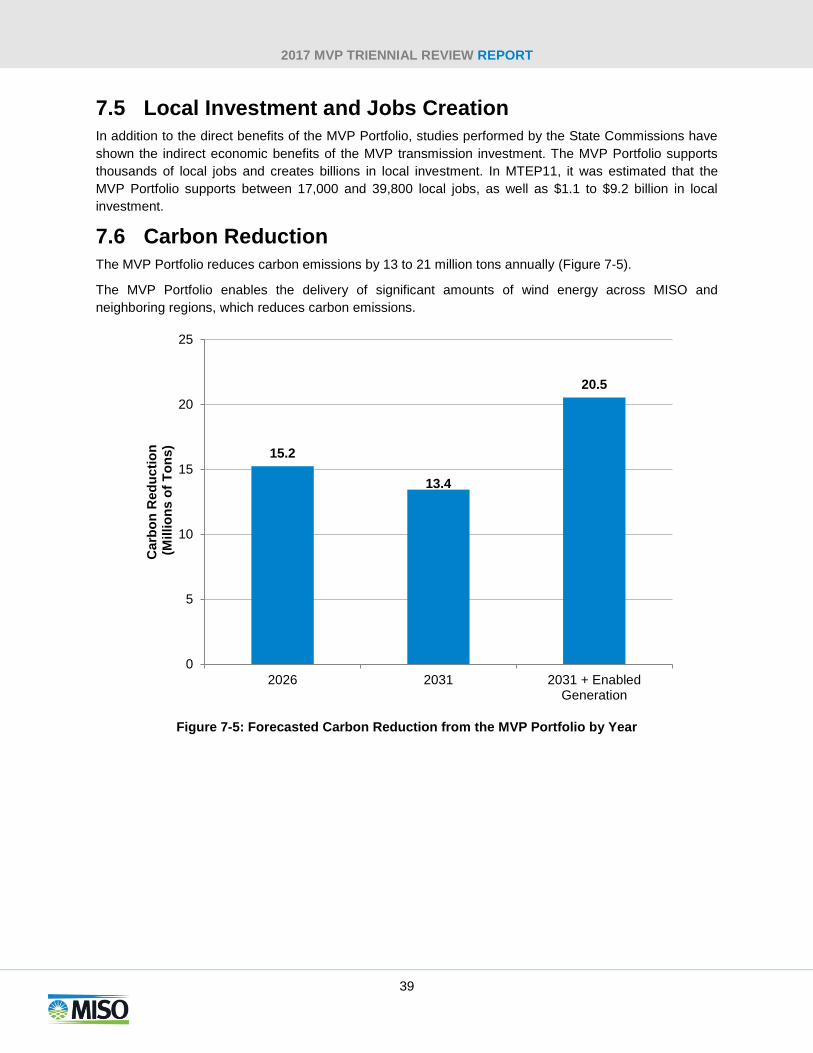
2017 MVP TRIENNIAL REVIEW REPORT
39
7.5 Local Investment and Jobs Creation
In addition to the direct benefits of the MVP Portfolio, studies performed by the State Commissions have
shown the indirect economic benefits of the MVP transmission investment. The MVP Portfolio supports
thousands of local jobs and creates billions in local investment. In MTEP11, it was estimated that the
MVP Portfolio supports between 17,000 and 39,800 local jobs, as well as $1.1 to $9.2 billion in local
investment.
7.6 Carbon Reduction
The MVP Portfolio reduces carbon emissions by 13 to 21 million tons annually (Figure 7-5).
The MVP Portfolio enables the delivery of significant amounts of wind energy across MISO and
neighboring regions, which reduces carbon emissions.
Figure 7-5: Forecasted Carbon Reduction from the MVP Portfolio by Year
15.2
13.4
20.5
0
5
10
15
20
25
2026 2031 2031 + EnabledGeneration
Carb
on
Red
ucti
on
(
Millio
ns o
f T
on
s)
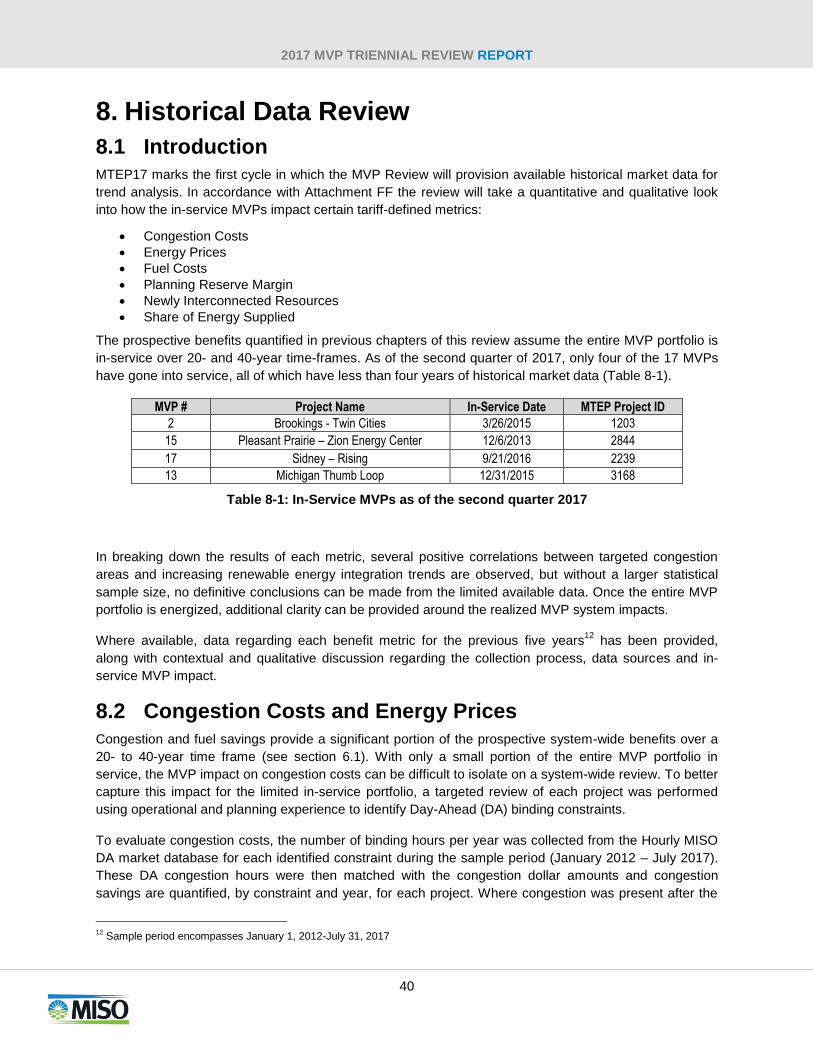
2017 MVP TRIENNIAL REVIEW REPORT
40
8. Historical Data Review
8.1 Introduction
MTEP17 marks the first cycle in which the MVP Review will provision available historical market data for
trend analysis. In accordance with Attachment FF the review will take a quantitative and qualitative look
into how the in-service MVPs impact certain tariff-defined metrics:
Congestion Costs
Energy Prices
Fuel Costs
Planning Reserve Margin
Newly Interconnected Resources
Share of Energy Supplied
The prospective benefits quantified in previous chapters of this review assume the entire MVP portfolio is
in-service over 20- and 40-year time-frames. As of the second quarter of 2017, only four of the 17 MVPs
have gone into service, all of which have less than four years of historical market data (Table 8-1).
MVP # Project Name In-Service Date MTEP Project ID
2 Brookings - Twin Cities 3/26/2015 1203
15 Pleasant Prairie – Zion Energy Center 12/6/2013 2844
17 Sidney – Rising 9/21/2016 2239
13 Michigan Thumb Loop 12/31/2015 3168
Table 8-1: In-Service MVPs as of the second quarter 2017
In breaking down the results of each metric, several positive correlations between targeted congestion
areas and increasing renewable energy integration trends are observed, but without a larger statistical
sample size, no definitive conclusions can be made from the limited available data. Once the entire MVP
portfolio is energized, additional clarity can be provided around the realized MVP system impacts.
Where available, data regarding each benefit metric for the previous five years12
has been provided,
along with contextual and qualitative discussion regarding the collection process, data sources and in-
service MVP impact.
8.2 Congestion Costs and Energy Prices
Congestion and fuel savings provide a significant portion of the prospective system-wide benefits over a
20- to 40-year time frame (see section 6.1). With only a small portion of the entire MVP portfolio in
service, the MVP impact on congestion costs can be difficult to isolate on a system-wide review. To better
capture this impact for the limited in-service portfolio, a targeted review of each project was performed
using operational and planning experience to identify Day-Ahead (DA) binding constraints.
To evaluate congestion costs, the number of binding hours per year was collected from the Hourly MISO
DA market database for each identified constraint during the sample period (January 2012 – July 2017).
These DA congestion hours were then matched with the congestion dollar amounts and congestion
savings are quantified, by constraint and year, for each project. Where congestion was present after the
12
Sample period encompasses January 1, 2012-July 31, 2017
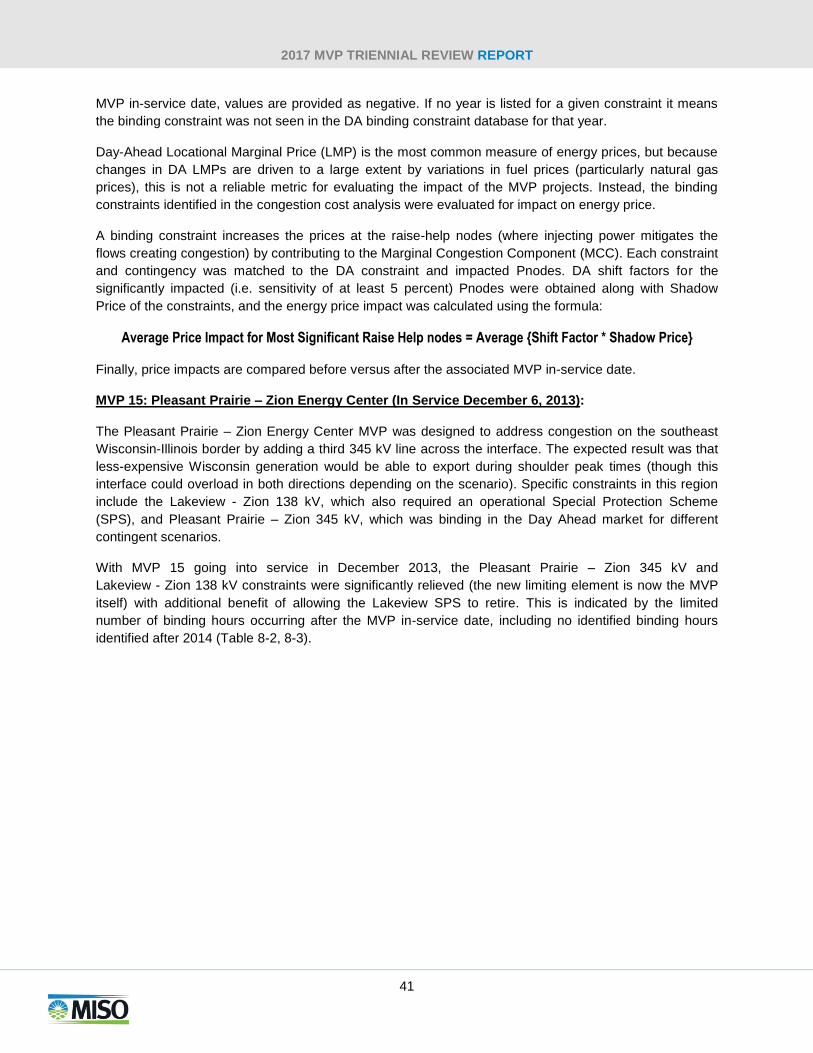
2017 MVP TRIENNIAL REVIEW REPORT
41
MVP in-service date, values are provided as negative. If no year is listed for a given constraint it means
the binding constraint was not seen in the DA binding constraint database for that year.
Day-Ahead Locational Marginal Price (LMP) is the most common measure of energy prices, but because
changes in DA LMPs are driven to a large extent by variations in fuel prices (particularly natural gas
prices), this is not a reliable metric for evaluating the impact of the MVP projects. Instead, the binding
constraints identified in the congestion cost analysis were evaluated for impact on energy price.
A binding constraint increases the prices at the raise-help nodes (where injecting power mitigates the
flows creating congestion) by contributing to the Marginal Congestion Component (MCC). Each constraint
and contingency was matched to the DA constraint and impacted Pnodes. DA shift factors for the
significantly impacted (i.e. sensitivity of at least 5 percent) Pnodes were obtained along with Shadow
Price of the constraints, and the energy price impact was calculated using the formula:
Average Price Impact for Most Significant Raise Help nodes = Average {Shift Factor * Shadow Price}
Finally, price impacts are compared before versus after the associated MVP in-service date.
MVP 15: Pleasant Prairie – Zion Energy Center (In Service December 6, 2013):
The Pleasant Prairie – Zion Energy Center MVP was designed to address congestion on the southeast
Wisconsin-Illinois border by adding a third 345 kV line across the interface. The expected result was that
less-expensive Wisconsin generation would be able to export during shoulder peak times (though this
interface could overload in both directions depending on the scenario). Specific constraints in this region
include the Lakeview - Zion 138 kV, which also required an operational Special Protection Scheme
(SPS), and Pleasant Prairie – Zion 345 kV, which was binding in the Day Ahead market for different
contingent scenarios.
With MVP 15 going into service in December 2013, the Pleasant Prairie – Zion 345 kV and
Lakeview - Zion 138 kV constraints were significantly relieved (the new limiting element is now the MVP
itself) with additional benefit of allowing the Lakeview SPS to retire. This is indicated by the limited
number of binding hours occurring after the MVP in-service date, including no identified binding hours
identified after 2014 (Table 8-2, 8-3).
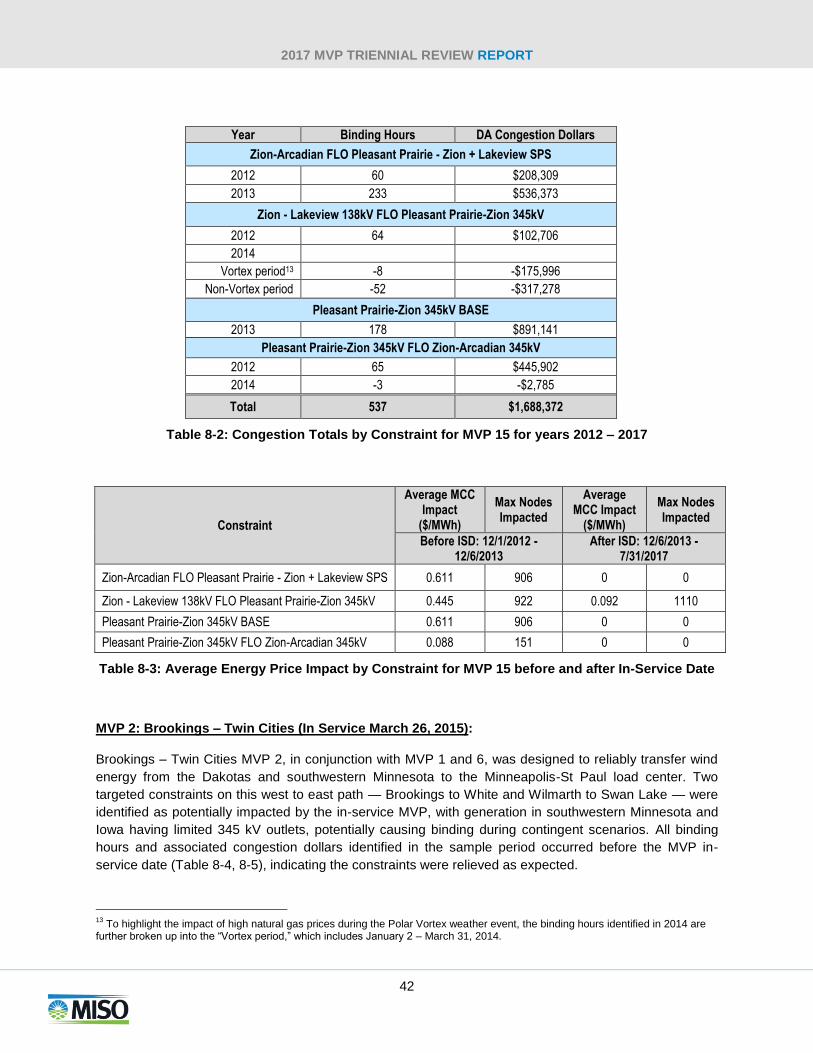
2017 MVP TRIENNIAL REVIEW REPORT
42
Year Binding Hours DA Congestion Dollars
Zion-Arcadian FLO Pleasant Prairie - Zion + Lakeview SPS
2012 60 $208,309
2013 233 $536,373
Zion - Lakeview 138kV FLO Pleasant Prairie-Zion 345kV
2012 64 $102,706
2014
Vortex period13 -8 -$175,996
Non-Vortex period -52 -$317,278
Pleasant Prairie-Zion 345kV BASE
2013 178 $891,141
Pleasant Prairie-Zion 345kV FLO Zion-Arcadian 345kV
2012 65 $445,902
2014 -3 -$2,785
Total 537 $1,688,372
Table 8-2: Congestion Totals by Constraint for MVP 15 for years 2012 – 2017
Constraint
Average MCC Impact
($/MWh)
Max Nodes Impacted
Average MCC Impact
($/MWh)
Max Nodes Impacted
Before ISD: 12/1/2012 - 12/6/2013
After ISD: 12/6/2013 - 7/31/2017
Zion-Arcadian FLO Pleasant Prairie - Zion + Lakeview SPS 0.611 906 0 0
Zion - Lakeview 138kV FLO Pleasant Prairie-Zion 345kV 0.445 922 0.092 1110
Pleasant Prairie-Zion 345kV BASE 0.611 906 0 0
Pleasant Prairie-Zion 345kV FLO Zion-Arcadian 345kV 0.088 151 0 0
Table 8-3: Average Energy Price Impact by Constraint for MVP 15 before and after In-Service Date
MVP 2: Brookings – Twin Cities (In Service March 26, 2015):
Brookings – Twin Cities MVP 2, in conjunction with MVP 1 and 6, was designed to reliably transfer wind
energy from the Dakotas and southwestern Minnesota to the Minneapolis-St Paul load center. Two
targeted constraints on this west to east path — Brookings to White and Wilmarth to Swan Lake — were
identified as potentially impacted by the in-service MVP, with generation in southwestern Minnesota and
Iowa having limited 345 kV outlets, potentially causing binding during contingent scenarios. All binding
hours and associated congestion dollars identified in the sample period occurred before the MVP in-
service date (Table 8-4, 8-5), indicating the constraints were relieved as expected.
13
To highlight the impact of high natural gas prices during the Polar Vortex weather event, the binding hours identified in 2014 are further broken up into the “Vortex period,” which includes January 2 – March 31, 2014.
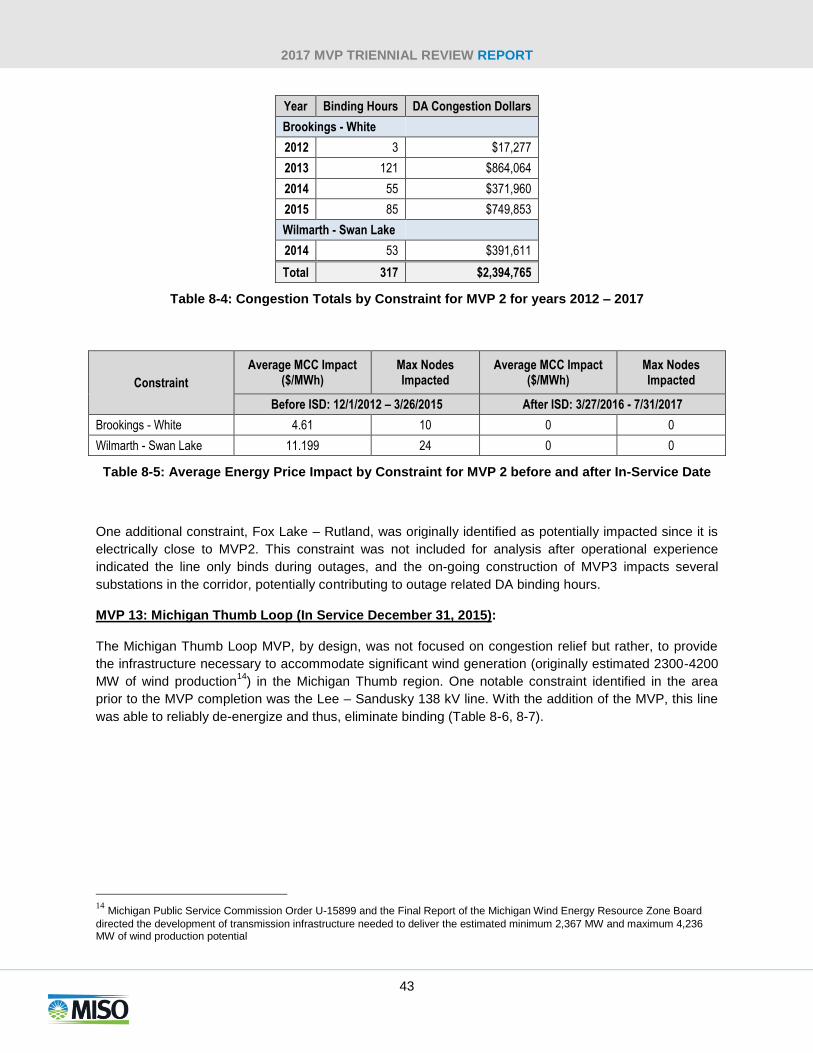
2017 MVP TRIENNIAL REVIEW REPORT
43
Year Binding Hours DA Congestion Dollars
Brookings - White
2012 3 $17,277
2013 121 $864,064
2014 55 $371,960
2015 85 $749,853
Wilmarth - Swan Lake
2014 53 $391,611
Total 317 $2,394,765
Table 8-4: Congestion Totals by Constraint for MVP 2 for years 2012 – 2017
Constraint
Average MCC Impact ($/MWh)
Max Nodes Impacted
Average MCC Impact ($/MWh)
Max Nodes Impacted
Before ISD: 12/1/2012 – 3/26/2015 After ISD: 3/27/2016 - 7/31/2017
Brookings - White 4.61 10 0 0
Wilmarth - Swan Lake 11.199 24 0 0
Table 8-5: Average Energy Price Impact by Constraint for MVP 2 before and after In-Service Date
One additional constraint, Fox Lake – Rutland, was originally identified as potentially impacted since it is
electrically close to MVP2. This constraint was not included for analysis after operational experience
indicated the line only binds during outages, and the on-going construction of MVP3 impacts several
substations in the corridor, potentially contributing to outage related DA binding hours.
MVP 13: Michigan Thumb Loop (In Service December 31, 2015):
The Michigan Thumb Loop MVP, by design, was not focused on congestion relief but rather, to provide
the infrastructure necessary to accommodate significant wind generation (originally estimated 2300-4200
MW of wind production14
) in the Michigan Thumb region. One notable constraint identified in the area
prior to the MVP completion was the Lee – Sandusky 138 kV line. With the addition of the MVP, this line
was able to reliably de-energize and thus, eliminate binding (Table 8-6, 8-7).
14
Michigan Public Service Commission Order U-15899 and the Final Report of the Michigan Wind Energy Resource Zone Board
directed the development of transmission infrastructure needed to deliver the estimated minimum 2,367 MW and maximum 4,236 MW of wind production potential
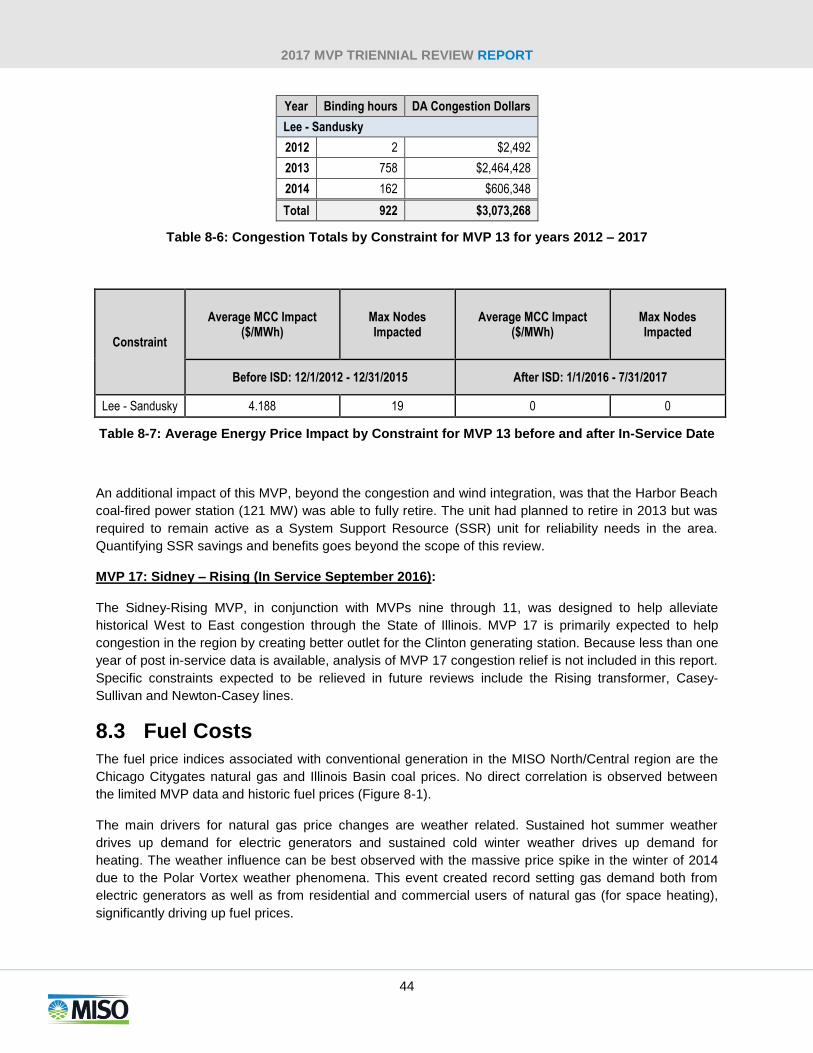
2017 MVP TRIENNIAL REVIEW REPORT
44
Year Binding hours DA Congestion Dollars
Lee - Sandusky
2012 2 $2,492
2013 758 $2,464,428
2014 162 $606,348
Total 922 $3,073,268
Table 8-6: Congestion Totals by Constraint for MVP 13 for years 2012 – 2017
Constraint
Average MCC Impact ($/MWh)
Max Nodes Impacted
Average MCC Impact ($/MWh)
Max Nodes Impacted
Before ISD: 12/1/2012 - 12/31/2015 After ISD: 1/1/2016 - 7/31/2017
Lee - Sandusky 4.188 19 0 0
Table 8-7: Average Energy Price Impact by Constraint for MVP 13 before and after In-Service Date
An additional impact of this MVP, beyond the congestion and wind integration, was that the Harbor Beach
coal-fired power station (121 MW) was able to fully retire. The unit had planned to retire in 2013 but was
required to remain active as a System Support Resource (SSR) unit for reliability needs in the area.
Quantifying SSR savings and benefits goes beyond the scope of this review.
MVP 17: Sidney – Rising (In Service September 2016):
The Sidney-Rising MVP, in conjunction with MVPs nine through 11, was designed to help alleviate
historical West to East congestion through the State of Illinois. MVP 17 is primarily expected to help
congestion in the region by creating better outlet for the Clinton generating station. Because less than one
year of post in-service data is available, analysis of MVP 17 congestion relief is not included in this report.
Specific constraints expected to be relieved in future reviews include the Rising transformer, Casey-
Sullivan and Newton-Casey lines.
8.3 Fuel Costs
The fuel price indices associated with conventional generation in the MISO North/Central region are the
Chicago Citygates natural gas and Illinois Basin coal prices. No direct correlation is observed between
the limited MVP data and historic fuel prices (Figure 8-1).
The main drivers for natural gas price changes are weather related. Sustained hot summer weather
drives up demand for electric generators and sustained cold winter weather drives up demand for
heating. The weather influence can be best observed with the massive price spike in the winter of 2014
due to the Polar Vortex weather phenomena. This event created record setting gas demand both from
electric generators as well as from residential and commercial users of natural gas (for space heating),
significantly driving up fuel prices.
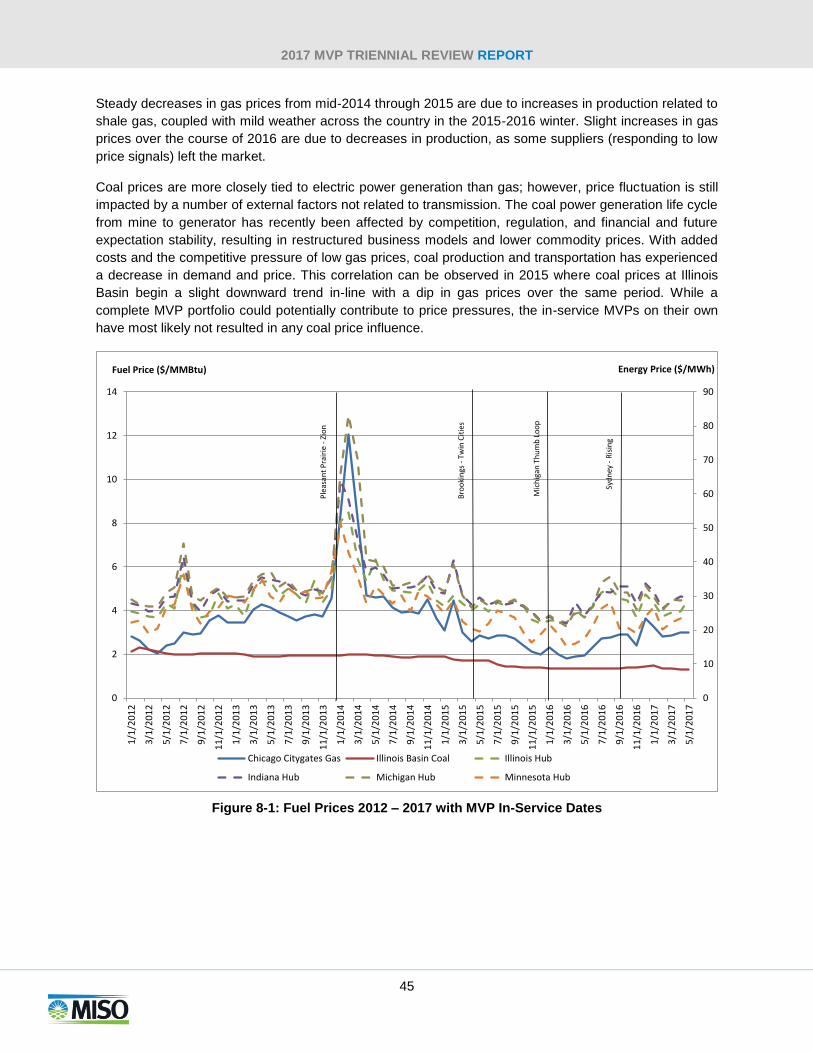
2017 MVP TRIENNIAL REVIEW REPORT
45
Steady decreases in gas prices from mid-2014 through 2015 are due to increases in production related to
shale gas, coupled with mild weather across the country in the 2015-2016 winter. Slight increases in gas
prices over the course of 2016 are due to decreases in production, as some suppliers (responding to low
price signals) left the market.
Coal prices are more closely tied to electric power generation than gas; however, price fluctuation is still
impacted by a number of external factors not related to transmission. The coal power generation life cycle
from mine to generator has recently been affected by competition, regulation, and financial and future
expectation stability, resulting in restructured business models and lower commodity prices. With added
costs and the competitive pressure of low gas prices, coal production and transportation has experienced
a decrease in demand and price. This correlation can be observed in 2015 where coal prices at Illinois
Basin begin a slight downward trend in-line with a dip in gas prices over the same period. While a
complete MVP portfolio could potentially contribute to price pressures, the in-service MVPs on their own
have most likely not resulted in any coal price influence.
Figure 8-1: Fuel Prices 2012 – 2017 with MVP In-Service Dates
0
10
20
30
40
50
60
70
80
90
0
2
4
6
8
10
12
14
1/1
/20
12
3/1
/20
12
5/1
/20
12
7/1
/20
12
9/1
/20
12
11
/1/2
01
2
1/1
/20
13
3/1
/20
13
5/1
/20
13
7/1
/20
13
9/1
/20
13
11
/1/2
01
3
1/1
/20
14
3/1
/20
14
5/1
/20
14
7/1
/20
14
9/1
/20
14
11
/1/2
01
4
1/1
/20
15
3/1
/20
15
5/1
/20
15
7/1
/20
15
9/1
/20
15
11
/1/2
01
5
1/1
/20
16
3/1
/20
16
5/1
/20
16
7/1
/20
16
9/1
/20
16
11
/1/2
01
6
1/1
/20
17
3/1
/20
17
5/1
/20
17
Energy Price ($/MWh)Fuel Price ($/MMBtu)
Chicago Citygates Gas Illinois Basin Coal Illinois Hub
Indiana Hub Michigan Hub Minnesota Hub
Ple
asan
t P
rair
ie -
Zio
n
Bro
oki
ngs
-Tw
in C
itie
s
Mic
hig
an T
hu
mb
Lo
op
Syd
ney
-R
isin
g
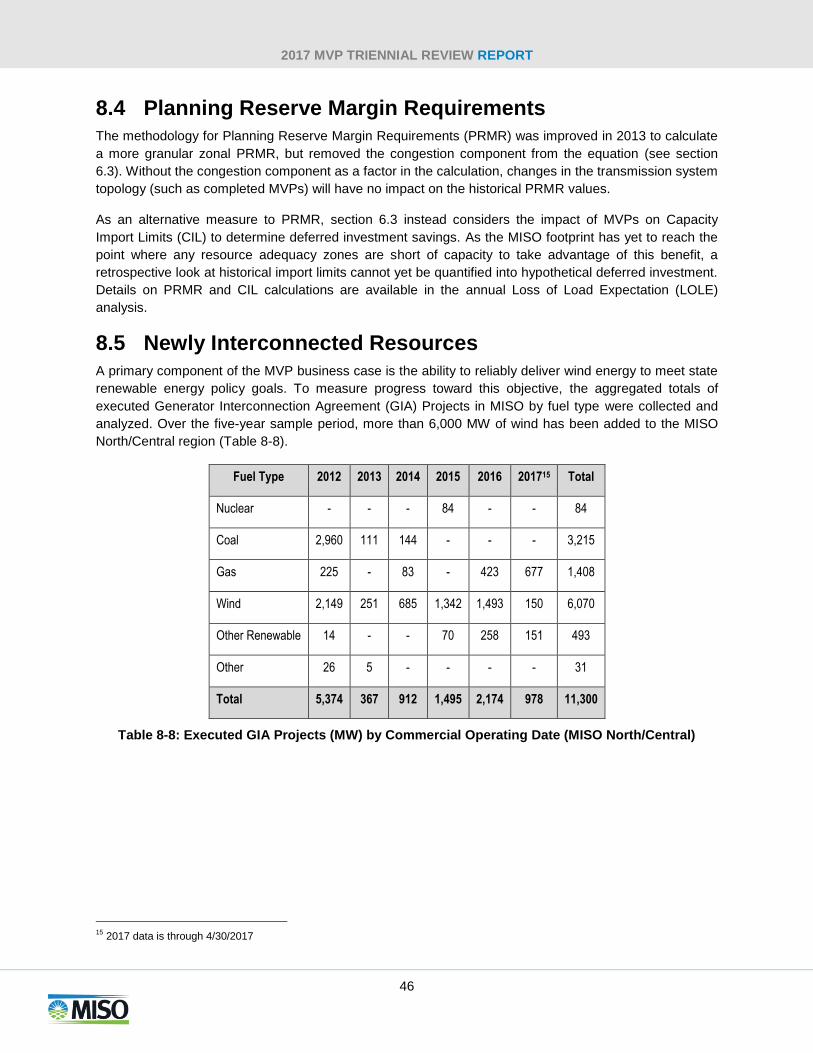
2017 MVP TRIENNIAL REVIEW REPORT
46
8.4 Planning Reserve Margin Requirements
The methodology for Planning Reserve Margin Requirements (PRMR) was improved in 2013 to calculate
a more granular zonal PRMR, but removed the congestion component from the equation (see section
6.3). Without the congestion component as a factor in the calculation, changes in the transmission system
topology (such as completed MVPs) will have no impact on the historical PRMR values.
As an alternative measure to PRMR, section 6.3 instead considers the impact of MVPs on Capacity
Import Limits (CIL) to determine deferred investment savings. As the MISO footprint has yet to reach the
point where any resource adequacy zones are short of capacity to take advantage of this benefit, a
retrospective look at historical import limits cannot yet be quantified into hypothetical deferred investment.
Details on PRMR and CIL calculations are available in the annual Loss of Load Expectation (LOLE)
analysis.
8.5 Newly Interconnected Resources
A primary component of the MVP business case is the ability to reliably deliver wind energy to meet state
renewable energy policy goals. To measure progress toward this objective, the aggregated totals of
executed Generator Interconnection Agreement (GIA) Projects in MISO by fuel type were collected and
analyzed. Over the five-year sample period, more than 6,000 MW of wind has been added to the MISO
North/Central region (Table 8-8).
Fuel Type 2012 2013 2014 2015 2016 201715 Total
Nuclear - - - 84 - - 84
Coal 2,960 111 144 - - - 3,215
Gas 225 - 83 - 423 677 1,408
Wind 2,149 251 685 1,342 1,493 150 6,070
Other Renewable 14 - - 70 258 151 493
Other 26 5 - - - - 31
Total 5,374 367 912 1,495 2,174 978 11,300
Table 8-8: Executed GIA Projects (MW) by Commercial Operating Date (MISO North/Central)
15
2017 data is through 4/30/2017
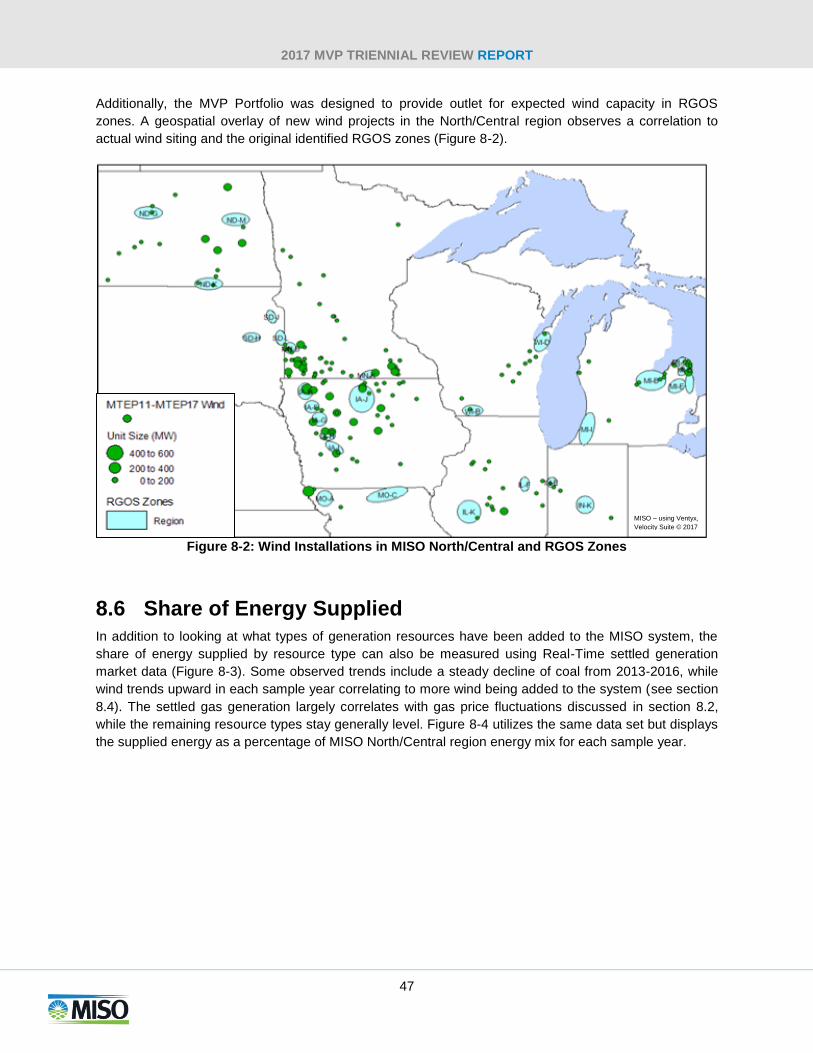
2017 MVP TRIENNIAL REVIEW REPORT
47
Additionally, the MVP Portfolio was designed to provide outlet for expected wind capacity in RGOS
zones. A geospatial overlay of new wind projects in the North/Central region observes a correlation to
actual wind siting and the original identified RGOS zones (Figure 8-2).
Figure 8-2: Wind Installations in MISO North/Central and RGOS Zones
8.6 Share of Energy Supplied
In addition to looking at what types of generation resources have been added to the MISO system, the
share of energy supplied by resource type can also be measured using Real-Time settled generation
market data (Figure 8-3). Some observed trends include a steady decline of coal from 2013-2016, while
wind trends upward in each sample year correlating to more wind being added to the system (see section
8.4). The settled gas generation largely correlates with gas price fluctuations discussed in section 8.2,
while the remaining resource types stay generally level. Figure 8-4 utilizes the same data set but displays
the supplied energy as a percentage of MISO North/Central region energy mix for each sample year.
MISO – using Ventyx,
Velocity Suite © 2017
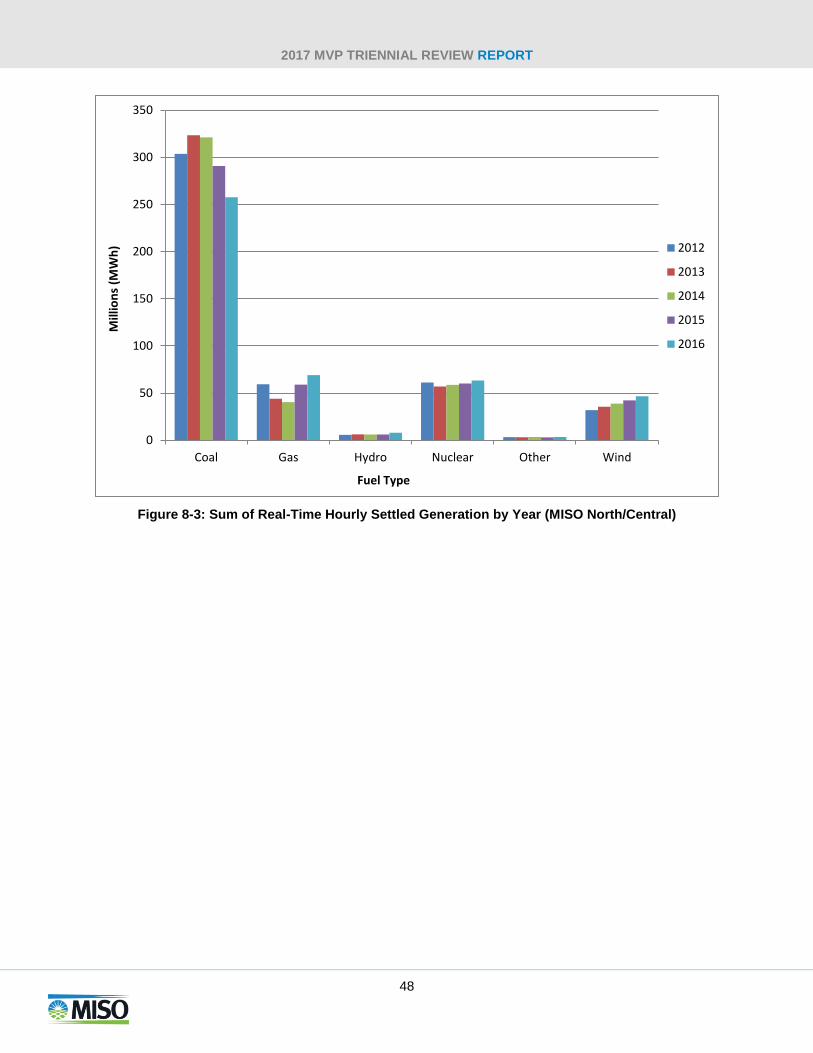
2017 MVP TRIENNIAL REVIEW REPORT
48
Figure 8-3: Sum of Real-Time Hourly Settled Generation by Year (MISO North/Central)
0
50
100
150
200
250
300
350
Coal Gas Hydro Nuclear Other Wind
Mill
ion
s (M
Wh
)
Fuel Type
2012
2013
2014
2015
2016
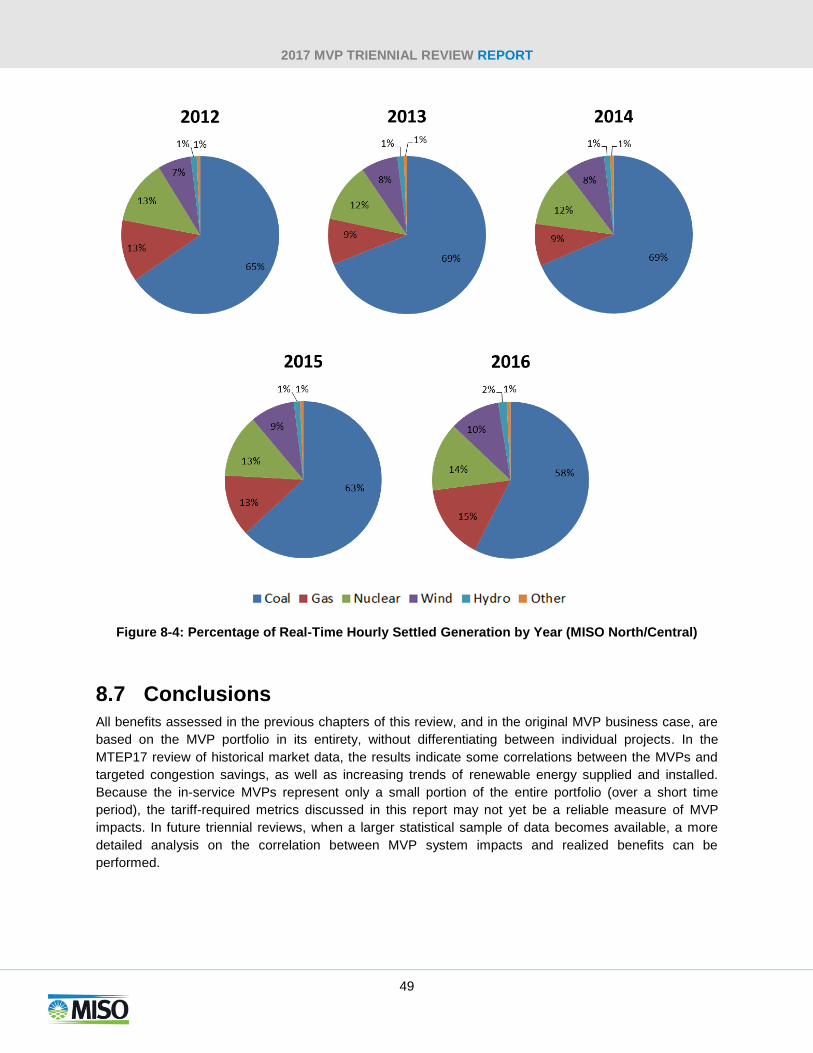
2017 MVP TRIENNIAL REVIEW REPORT
49
Figure 8-4: Percentage of Real-Time Hourly Settled Generation by Year (MISO North/Central)
8.7 Conclusions
All benefits assessed in the previous chapters of this review, and in the original MVP business case, are
based on the MVP portfolio in its entirety, without differentiating between individual projects. In the
MTEP17 review of historical market data, the results indicate some correlations between the MVPs and
targeted congestion savings, as well as increasing trends of renewable energy supplied and installed.
Because the in-service MVPs represent only a small portion of the entire portfolio (over a short time
period), the tariff-required metrics discussed in this report may not yet be a reliable measure of MVP
impacts. In future triennial reviews, when a larger statistical sample of data becomes available, a more
detailed analysis on the correlation between MVP system impacts and realized benefits can be
performed.
2017 MVP TRIENNIAL REVIEW REPORT
50
9. Conclusions and Going Forward The MTEP17 Triennial MVP Review provides an updated view into the projected economic, public policy
and qualitative benefits of the MTEP11 MVP Portfolio. With the second iteration of the full MVP review,
the Multi-Value Projects continue to show benefits in excess of cost, showing benefit-to-cost ratios of 2.2
to 3.4. Differences between previous analyses are primarily driven by natural gas prices, changing
generation fleet and changes to model dispatch and topology.
The MTEP17 MVP Triennial Review’s business case continues to be on par with MTEP11, providing
confidence that the MVP criteria and methodology are working as expected. While the economic cost
savings provide a quantifiable benefit, the updated MTEP17 assessment also corroborates the MVP
Portfolio’s ability to reliably deliver wind generation in support of the renewable energy mandates of the
MISO states in a cost effective manner.
Results prepared through the MTEP17 Triennial Review are for information purposes only and have no
effect on the existing MVP Portfolio status or cost allocation.
MTEP18 and MTEP19 will feature a Limited Review of the MVP Portfolio benefits. Each Limited Review
will provide an updated assessment of the congestion and fuel savings (Section 6.1) using the latest
portfolio costs and in-service dates. The next full Triennial Review will be featured in MTEP20.