MSV D32 v5 - Europa · Multiscale&Spatiotemporal&Visualisation&!Collectionof!exemplary!problems!!!...
26
Multiscale Spatiotemporal Visualisation STREP # FP7248032 MSV Deliverable D3.2 – Collection of exemplary problems Work package 3: Exemplary problems Rubén Cárdenes (UPF) Xavier Planes (UPF) 03/01/2012
Transcript of MSV D32 v5 - Europa · Multiscale&Spatiotemporal&Visualisation&!Collectionof!exemplary!problems!!!...
Multiscale Spatiotemporal
Visualisation STREP # FP7-‐248032
MSV Deliverable
D3.2 – Collection of exemplary problems Work package 3: Exemplary problems
Rubén Cárdenes (UPF)
Xavier Planes (UPF)
03/01/2012
Multiscale Spatiotemporal Visualisation
Collection of exemplary problems
2
DOCUMENT INFORMATION
IST Project Number FP7-‐248032 Acronym MSV
Full title Multiscale Spatiotemporal Visualisation: development of an open-‐source software library for the interactive visualisation of multiscale data
Project URL http://www.msv-‐project.eu
Document URL https://www.biomedtown.org/biomed_town/MSV/associates/reviewers/
EU Project officer Ivo Locatelli
Deliverable Number 3.2 Title Collection of exemplary problems
Work package Number 3 Title Exemplary problems
Date of delivery Planned 31-‐12-‐2011 Actual 03/01/2012
Status Version v5 final
Nature Prototype Report Demonstrator Other
Dissemination Level
Public Consortium
Authors (Partner) Rubén Cárdenes (UPF), Xavier Planes (UPF)
Responsible Author Rubén Cárdenes Email [email protected]
Partner UPF Phone +34-‐93-‐5421447
Abstract (for dissemination)
This document summarizes the output obtained from the MSV problem assessment exercise. In particular, starting from the preliminary information got from the projects approached in order to understand the multiscale visualisation needs, a set of data have been collected and made public after authorisation. The data will be used both during the projects for the assessment of the demonstrators that are being developed and after the end of the project as test data for the MSVTK library. The exemplary problems data collection covers a number of biomedical domains, like orthopaedics and trauma modelling, vascular modelling and treatment planning, the healthy and disease heart modelling, cancer modelling, and others. The data have been mapped to the multiscale challenges defined already in previous deliverables in order to provide a priority scale to the development.
Keywords Assessment exercise, exemplary problems, challenges.
Version Log
Issue Date Rev No. Author Change
Multiscale Spatiotemporal Visualisation
Collection of exemplary problems
3
21/12/2011 V1 Rubens Cardenes First draft with all contents
22/12/2011 V2 Debora Testi Revised version with MSV template and few other additions
31/12/2011 V3 Debora Testi Updated use cases and challenges table
03/01/2012 V4 Xavier Planes Added information on data licences
03/01/2012 V5 Debora Testi Final version consolidation
Multiscale Spatiotemporal Visualisation
Collection of exemplary problems
4
Project Consortium Information
Disclaimer: This document is property of the MSV Consortium. There is no warranty for the accuracy or completeness of the information, text, graphics, links or other items contained within this material. This document represents the common view of the consortium and does not necessarily reflect the view of the individual partners.
Multiscale Spatiotemporal Visualisation
Collection of exemplary problems
5
LIST OF ABBREVIATIONS
SCS SCS srl
BED University of Bedfordshire
UPF University POmpeu Fraba
KIT Kitware
AUK University of Auckland
DTI Diffusion tensor imaging
ECG Electrocardiography
3DRA Three-‐dimensional rotational angiography
CFD Computational Fluid Dynamics
US Ultrasounds
MRI Magnetic Resonance Imaging

Multiscale Spatiotemporal Visualisation
Collection of exemplary problems
6
Summary Summary ....................................................................................................................................... 6
1 Introduction ............................................................................................................................ 9
2 Use cases .............................................................................................................................. 10
2.1 Cardiology ...................................................................................................................... 10
2.1.1 Fiber multiscale visualizacion of the myocardium .................................................. 10
2.1.2 Multiscale visualizacion of the propagation of the electrical signals in the heart .. 10
2.1.3 Electrical simulation of the Heart ........................................................................... 11
2.1.4 Electro-‐physiological dataset .................................................................................. 11
2.1.5 Heart model ............................................................................................................ 12
2.1.6 Heart model ............................................................................................................ 12
2.1.7 Heart tissue ............................................................................................................. 12
2.1.8 Cardiac Coupled Electromechanics and Propagation to Torso Skin ....................... 12
2.2 Cerebral aneurysms ....................................................................................................... 13
2.2.1 Cerebral aneurysm flow dynamics ......................................................................... 13
2.3 Musculoskeletal modelling ............................................................................................ 13
2.3.1 From body to microCT data of the human bones ................................................... 13
2.3.2 Lumbar spine surgery ............................................................................................. 14
2.3.3 Osteoporosis ........................................................................................................... 14
2.4 NeuroImaging ................................................................................................................ 14
2.4.1 DTI with follow up ................................................................................................... 14
2.4.2 SISCOM analysis ...................................................................................................... 15
2.4.3 EEG-‐fMRI ................................................................................................................. 15
2.4.4 Purkinje neuron ...................................................................................................... 15
2.4.5 Cortical neurons from Alzheimers disease patients ............................................... 16
2.5 Oncology ........................................................................................................................ 16
2.5.1 MRI data, histopathology and gene data of a cerebral tumor ............................... 16
2.5.2 Breast Radiotherapy DICOM Data .......................................................................... 16
2.5.3 MR-‐guided prostate interventions ......................................................................... 16
2.5.4 Mammography ....................................................................................................... 17
2.5.5 Lung cancer ............................................................................................................. 17
2.6 Virtual Colonoscopy ....................................................................................................... 17
Multiscale Spatiotemporal Visualisation
Collection of exemplary problems
7
2.6.1 3D high resolution CT image of abdomen .............................................................. 17
2.7 Human Anatomy ............................................................................................................ 18
2.7.1 BodyParts3D ........................................................................................................... 18
2.8 Mouse Atlas ................................................................................................................... 18
2.8.1 µMRI Atlas of Mouse Development ........................................................................ 18
2.9 Zebrafish embryo ........................................................................................................... 19
2.10 Genetics ....................................................................................................................... 19
2.10.1 Cardiac Disorders .................................................................................................. 19
2.11 Clotting ........................................................................................................................ 19
2.11.1 Example 11.1: Constructing a protofibril from fibrin monomers ......................... 20
2.11.2 Example 11.2: Constructing a fiber from protofibrils ........................................... 20
2.11.3 Example 11.3: Constructing a clot from fibers ...................................................... 20
3 Use cases and challenges ...................................................................................................... 21
4 ANNEX: authorisations to data use where applicable .......................................................... 22
4.1 LHDL data ....................................................................................................................... 22
4.2 UPF data ........................................................................................................................ 22
4.3 Cardiac Atlas Project ...................................................................................................... 22
4.4 Cell Centered Database ................................................................................................. 22
4.4.1 Acceptance of Terms .............................................................................................. 23
4.4.2 Copyright ................................................................................................................ 23
4.4.3 Data ........................................................................................................................ 23
4.4.4 Acknowledgements ................................................................................................ 24
4.5 Auckland Bioengineering Institute ................................................................................. 24
4.6 GIB-‐UB research group .................................................................................................. 24
4.7 National Cancer Institute ............................................................................................... 24
4.8 Breast Radiotherapy DICOM Data ................................................................................. 25
4.9 MR-‐guided prostate interventions ................................................................................ 25
4.10 Digital Database for Screening Mammography (DDSM) ............................................. 25
4.11 ELCAP Public Lung Image Database ............................................................................. 25
4.12 OSIRIX .......................................................................................................................... 25
4.13 BodyParts3D ................................................................................................................ 25
4.14 µMRI Atlas of Mouse Development ............................................................................ 26
4.15 EMAP ........................................................................................................................... 26

Multiscale Spatiotemporal Visualisation
Collection of exemplary problems
8
4.16 Digital Fish Project ....................................................................................................... 26
Multiscale Spatiotemporal Visualisation
Collection of exemplary problems
9
1 Introduction After the identification of the challenges to be covered in MSV (see D3.1 for details), and the protential applications and projects, UPF, in collaboration with the other MSV partners, has collected a set of use cases to test the paradigms and prototypes that will be finally integrated as the MSV library. The cases, which are listed below, have been selected based on several criteria. First, they should be cases where one or several of the challenges already identified are present, and secondly they need to have a clear clinical value, and potential usefulness for the scientific community in the near future. All the descriptions, together with the data, file descriptions challenges covered can be found at the MSV public Data wiki (https://www.biomedtown.org/biomed_town/MSV/reception/wikis/Data), while in this report a brief summary of them is reported.
This document ends with a summary table of the challenges and how the collected data examples map on those, so to provide a clear overview to be used to define the development priorities (as reported in D2.1 addendum).
Multiscale Spatiotemporal Visualisation
Collection of exemplary problems
10
2 Use cases This section is an extraction from the public wiki mentioned before.
The data examples have been grouped by biomedical domain and each examples is provided with a description, one or more snapshot, and links to download the data where authorisation have been got.
2.1 Cardiology
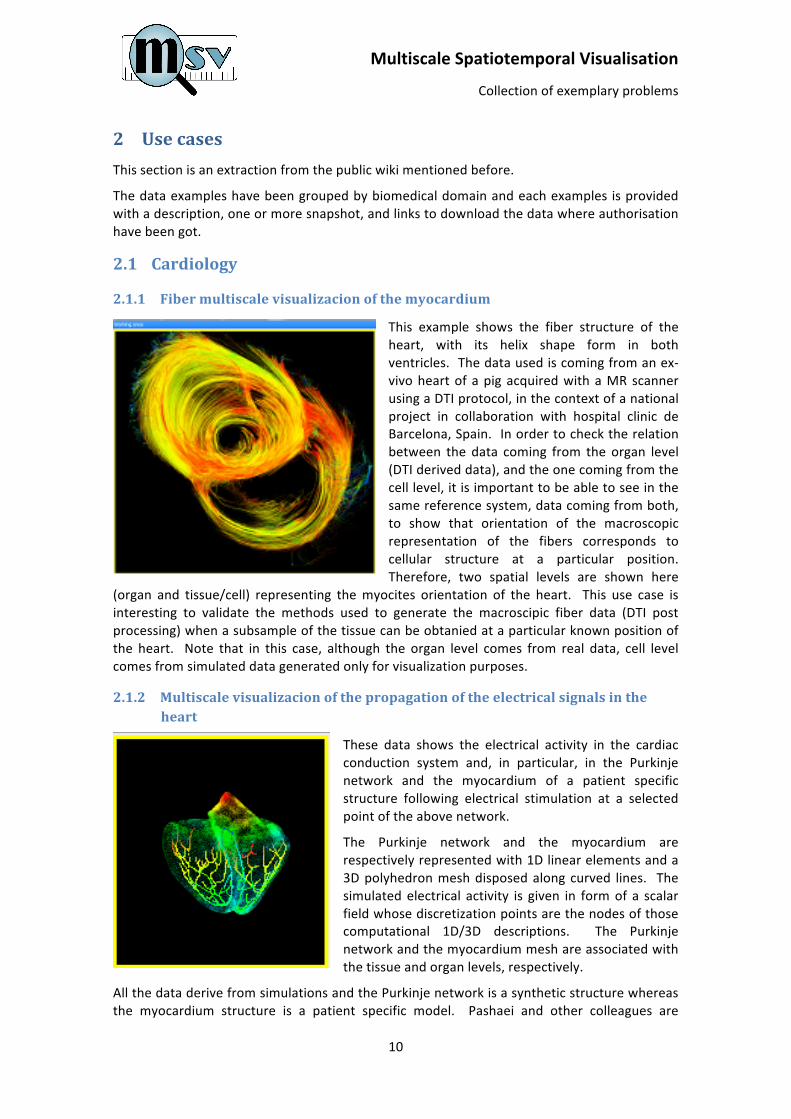
2.1.1 Fiber multiscale visualizacion of the myocardium
This example shows the fiber structure of the heart, with its helix shape form in both ventricles. The data used is coming from an ex-‐vivo heart of a pig acquired with a MR scanner using a DTI protocol, in the context of a national project in collaboration with hospital clinic de Barcelona, Spain. In order to check the relation between the data coming from the organ level (DTI derived data), and the one coming from the cell level, it is important to be able to see in the same reference system, data coming from both, to show that orientation of the macroscopic representation of the fibers corresponds to cellular structure at a particular position. Therefore, two spatial levels are shown here
(organ and tissue/cell) representing the myocites orientation of the heart. This use case is interesting to validate the methods used to generate the macroscipic fiber data (DTI post processing) when a subsample of the tissue can be obtanied at a particular known position of the heart. Note that in this case, although the organ level comes from real data, cell level comes from simulated data generated only for visualization purposes.
2.1.2 Multiscale visualizacion of the propagation of the electrical signals in the heart
These data shows the electrical activity in the cardiac conduction system and, in particular, in the Purkinje network and the myocardium of a patient specific structure following electrical stimulation at a selected point of the above network.
The Purkinje network and the myocardium are respectively represented with 1D linear elements and a 3D polyhedron mesh disposed along curved lines. The simulated electrical activity is given in form of a scalar field whose discretization points are the nodes of those computational 1D/3D descriptions. The Purkinje network and the myocardium mesh are associated with the tissue and organ levels, respectively.
All the data derive from simulations and the Purkinje network is a synthetic structure whereas the myocardium structure is a patient specific model. Pashaei and other colleagues are

Multiscale Spatiotemporal Visualisation
Collection of exemplary problems
11
advancing in understanding processes at the cell-‐level responsible for the complex conduction of the electrical activity between the terminal points of the Purkinje network and the myocardium structure, i.e. the regions called Purkinje-‐Ventricular Junctions. In the case that the corresponding data will not be available soon enough, UPF group can synthetize them so as to have a tree-‐scale dataset (instead of a two-‐scale one).
The electrical activity can be represented in form of a time-‐independent color map, wherein the color represents the arrival time following the electrical stimulus (featuring null time). Here, the aim is to visualize it as a time-‐varying 1D/2D manifold within the Purkinje network/myocardium.
2.1.3 Electrical simulation of the Heart
This use case shows an electrical simulation of a heart using several image modalities as input. Input images have been segmented and a surface heart model is used to create a volumetric mesh that will be the input for the simulation engine. A model for human ventricular tissue is used to simulate the electrical propagation in the Midmyocardial Cells.
Part of this dataset has been generated using the tools of euHeart EC-‐funded project.
2.1.4 Electro-‐physiological dataset
This use case shows a dataset of electro-‐physiological CARTO points with some sample ECG signals. This data allow studying electrical behaviour of the heart and can be used to model and plan the sucess of resynchronization therapy.
Electrical data are sampled at 1KHz for a period of 2.5 s, having a total of 2500 samples for each point. The number of channels and their meaning depends on the catheter that was used for the acquisition. In the cases we worked with, the 22 channels correspond to
superficial unipolar and bipolar ECGs (I, II, III, AvR, AvL, AvF, V1, V2, V3, V4, V5 and V6 derivations), six unipolar signals measured in the tip of the catheter (with six different distances from the catheter tip) and three bipolar signals.
Multiscale Spatiotemporal Visualisation
Collection of exemplary problems
12
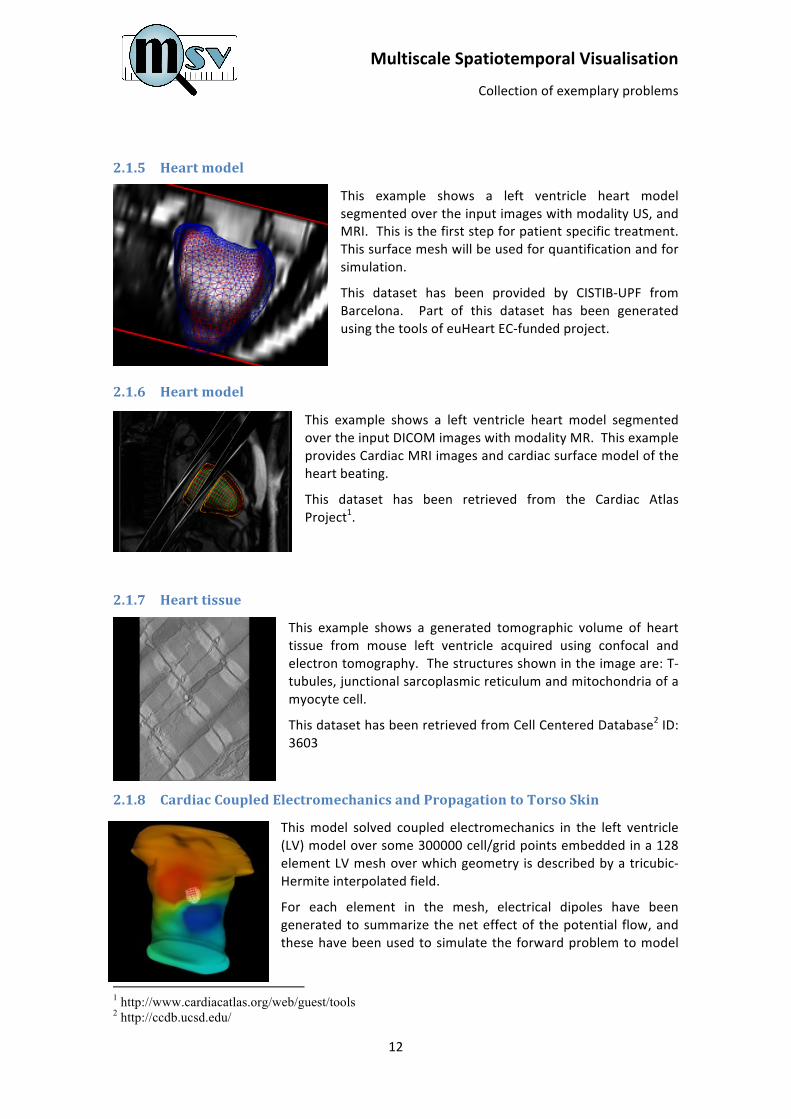
2.1.5 Heart model
This example shows a left ventricle heart model segmented over the input images with modality US, and MRI. This is the first step for patient specific treatment. This surface mesh will be used for quantification and for simulation.
This dataset has been provided by CISTIB-‐UPF from Barcelona. Part of this dataset has been generated using the tools of euHeart EC-‐funded project.
2.1.6 Heart model
This example shows a left ventricle heart model segmented over the input DICOM images with modality MR. This example provides Cardiac MRI images and cardiac surface model of the heart beating.
This dataset has been retrieved from the Cardiac Atlas Project1.
2.1.7 Heart tissue
This example shows a generated tomographic volume of heart tissue from mouse left ventricle acquired using confocal and electron tomography. The structures shown in the image are: T-‐tubules, junctional sarcoplasmic reticulum and mitochondria of a myocyte cell.
This dataset has been retrieved from Cell Centered Database2 ID: 3603
2.1.8 Cardiac Coupled Electromechanics and Propagation to Torso Skin
This model solved coupled electromechanics in the left ventricle (LV) model over some 300000 cell/grid points embedded in a 128 element LV mesh over which geometry is described by a tricubic-‐Hermite interpolated field.
For each element in the mesh, electrical dipoles have been generated to summarize the net effect of the potential flow, and these have been used to simulate the forward problem to model
1 http://www.cardiacatlas.org/web/guest/tools 2 http://ccdb.ucsd.edu/
Multiscale Spatiotemporal Visualisation
Collection of exemplary problems
13
the electrical potential on the torso surface arising from the LV model.
These data were provided by Auckland Bioengineering Institute and can be visualised now using the cmGUI software3.
2.2 Cerebral aneurysms
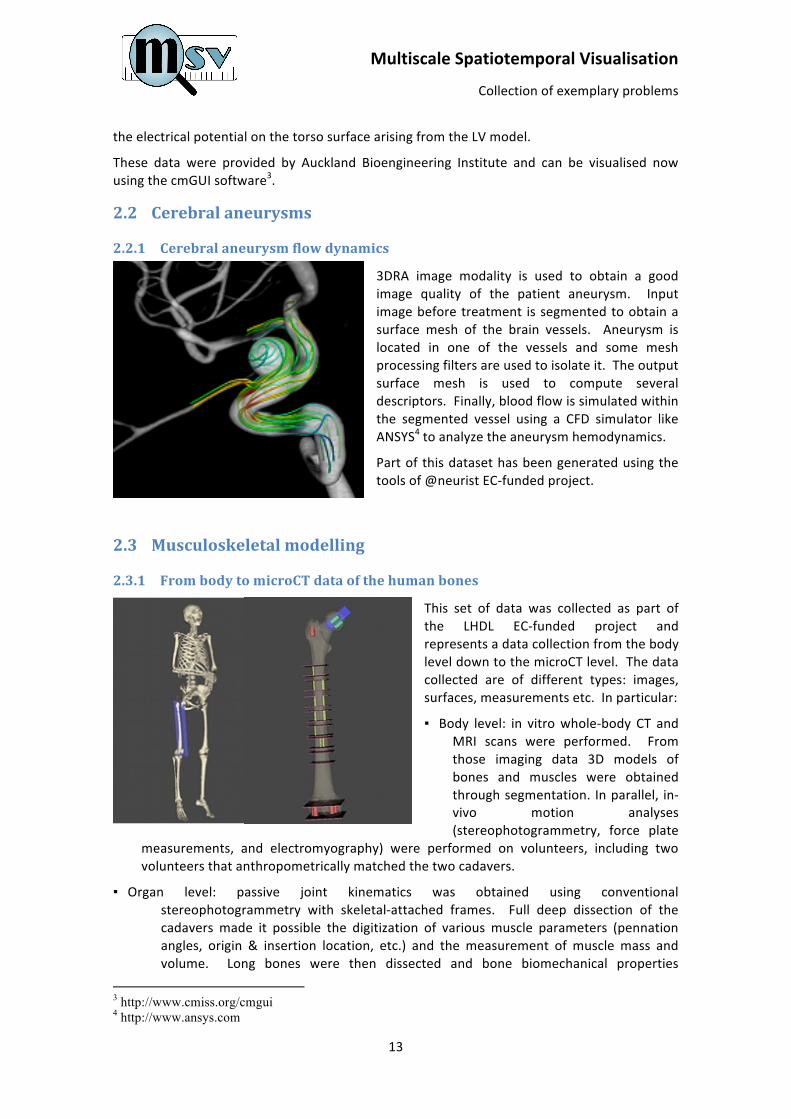
2.2.1 Cerebral aneurysm flow dynamics
3DRA image modality is used to obtain a good image quality of the patient aneurysm. Input image before treatment is segmented to obtain a surface mesh of the brain vessels. Aneurysm is located in one of the vessels and some mesh processing filters are used to isolate it. The output surface mesh is used to compute several descriptors. Finally, blood flow is simulated within the segmented vessel using a CFD simulator like ANSYS4 to analyze the aneurysm hemodynamics.
Part of this dataset has been generated using the tools of @neurist EC-‐funded project.
2.3 Musculoskeletal modelling
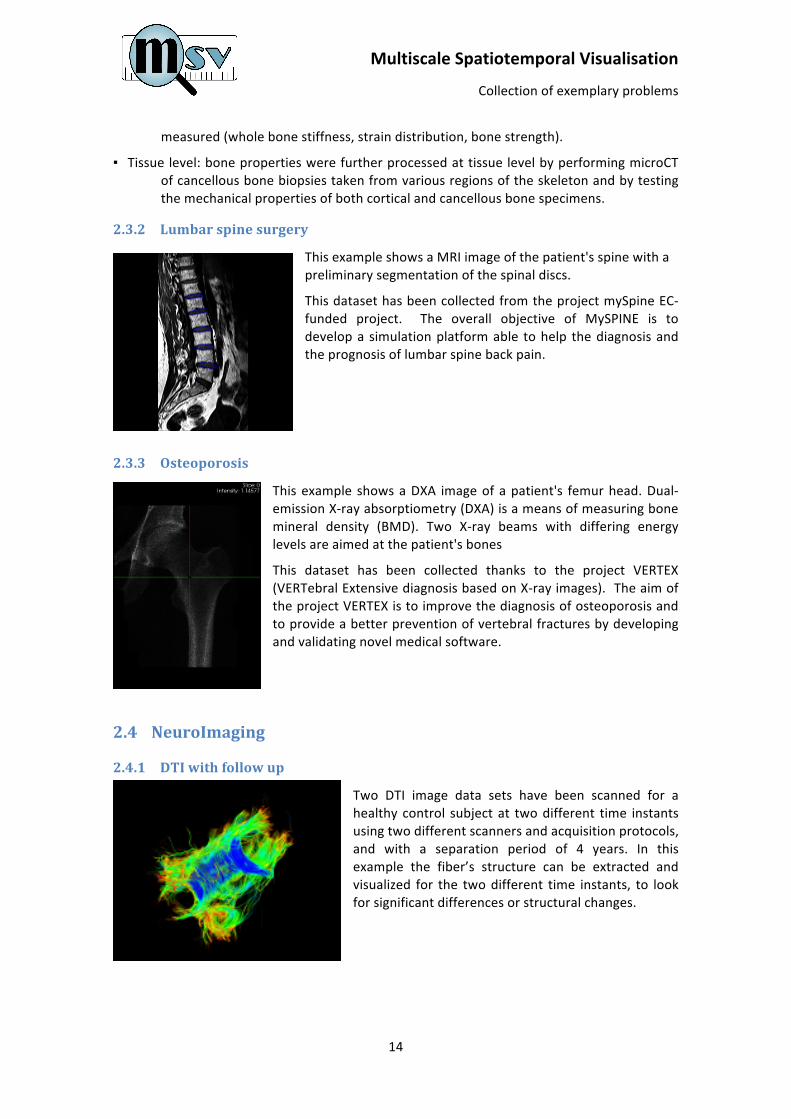
2.3.1 From body to microCT data of the human bones
This set of data was collected as part of the LHDL EC-‐funded project and represents a data collection from the body level down to the microCT level. The data collected are of different types: images, surfaces, measurements etc. In particular:
▪ Body level: in vitro whole-‐body CT and MRI scans were performed. From those imaging data 3D models of bones and muscles were obtained through segmentation. In parallel, in-‐vivo motion analyses (stereophotogrammetry, force plate
measurements, and electromyography) were performed on volunteers, including two volunteers that anthropometrically matched the two cadavers.
▪ Organ level: passive joint kinematics was obtained using conventional stereophotogrammetry with skeletal-‐attached frames. Full deep dissection of the cadavers made it possible the digitization of various muscle parameters (pennation angles, origin & insertion location, etc.) and the measurement of muscle mass and volume. Long bones were then dissected and bone biomechanical properties
3 http://www.cmiss.org/cmgui 4 http://www.ansys.com
Multiscale Spatiotemporal Visualisation
Collection of exemplary problems
14
measured (whole bone stiffness, strain distribution, bone strength).
▪ Tissue level: bone properties were further processed at tissue level by performing microCT of cancellous bone biopsies taken from various regions of the skeleton and by testing the mechanical properties of both cortical and cancellous bone specimens.
2.3.2 Lumbar spine surgery
This example shows a MRI image of the patient's spine with a preliminary segmentation of the spinal discs.
This dataset has been collected from the project mySpine EC-‐funded project. The overall objective of MySPINE is to develop a simulation platform able to help the diagnosis and the prognosis of lumbar spine back pain.
2.3.3 Osteoporosis
This example shows a DXA image of a patient's femur head. Dual-‐emission X-‐ray absorptiometry (DXA) is a means of measuring bone mineral density (BMD). Two X-‐ray beams with differing energy levels are aimed at the patient's bones
This dataset has been collected thanks to the project VERTEX (VERTebral Extensive diagnosis based on X-‐ray images). The aim of the project VERTEX is to improve the diagnosis of osteoporosis and to provide a better prevention of vertebral fractures by developing and validating novel medical software.
2.4 NeuroImaging
2.4.1 DTI with follow up
Two DTI image data sets have been scanned for a healthy control subject at two different time instants using two different scanners and acquisition protocols, and with a separation period of 4 years. In this example the fiber’s structure can be extracted and visualized for the two different time instants, to look for significant differences or structural changes.
Multiscale Spatiotemporal Visualisation
Collection of exemplary problems
15
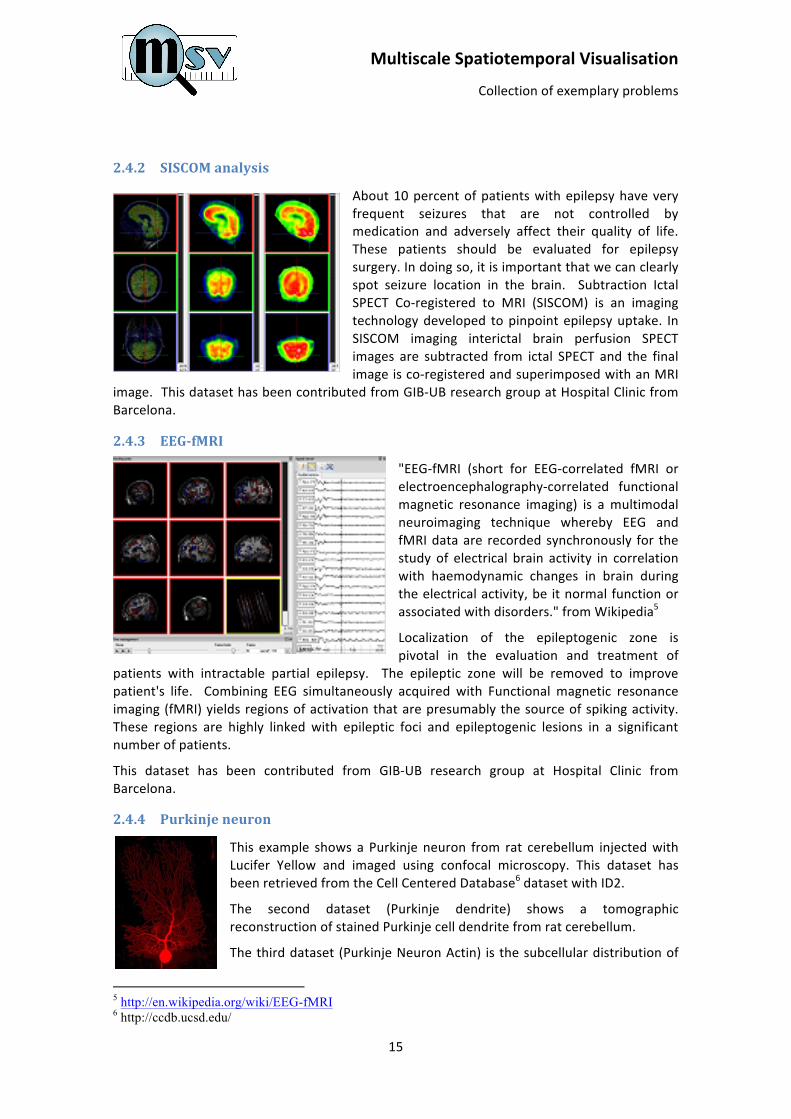
2.4.2 SISCOM analysis
About 10 percent of patients with epilepsy have very frequent seizures that are not controlled by medication and adversely affect their quality of life. These patients should be evaluated for epilepsy surgery. In doing so, it is important that we can clearly spot seizure location in the brain. Subtraction Ictal SPECT Co-‐registered to MRI (SISCOM) is an imaging technology developed to pinpoint epilepsy uptake. In SISCOM imaging interictal brain perfusion SPECT images are subtracted from ictal SPECT and the final image is co-‐registered and superimposed with an MRI
image. This dataset has been contributed from GIB-‐UB research group at Hospital Clinic from Barcelona.
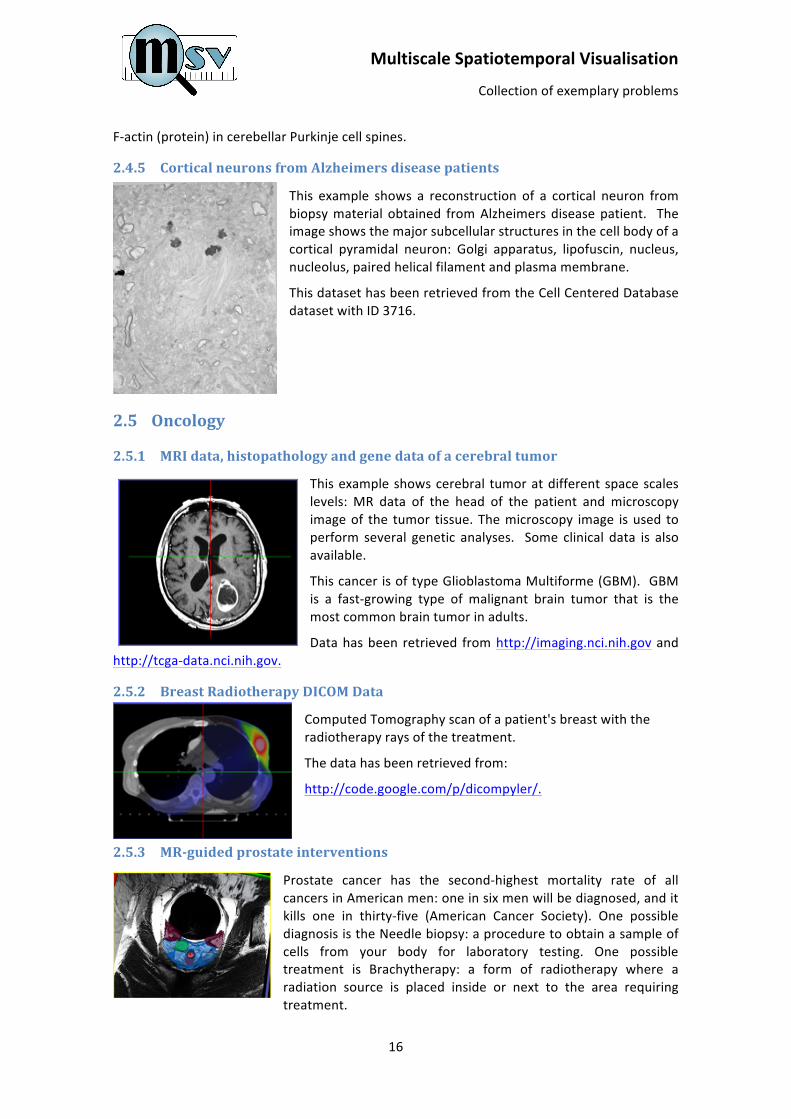
2.4.3 EEG-‐fMRI
"EEG-‐fMRI (short for EEG-‐correlated fMRI or electroencephalography-‐correlated functional magnetic resonance imaging) is a multimodal neuroimaging technique whereby EEG and fMRI data are recorded synchronously for the study of electrical brain activity in correlation with haemodynamic changes in brain during the electrical activity, be it normal function or associated with disorders." from Wikipedia5
Localization of the epileptogenic zone is pivotal in the evaluation and treatment of
patients with intractable partial epilepsy. The epileptic zone will be removed to improve patient's life. Combining EEG simultaneously acquired with Functional magnetic resonance imaging (fMRI) yields regions of activation that are presumably the source of spiking activity. These regions are highly linked with epileptic foci and epileptogenic lesions in a significant number of patients.
This dataset has been contributed from GIB-‐UB research group at Hospital Clinic from Barcelona.
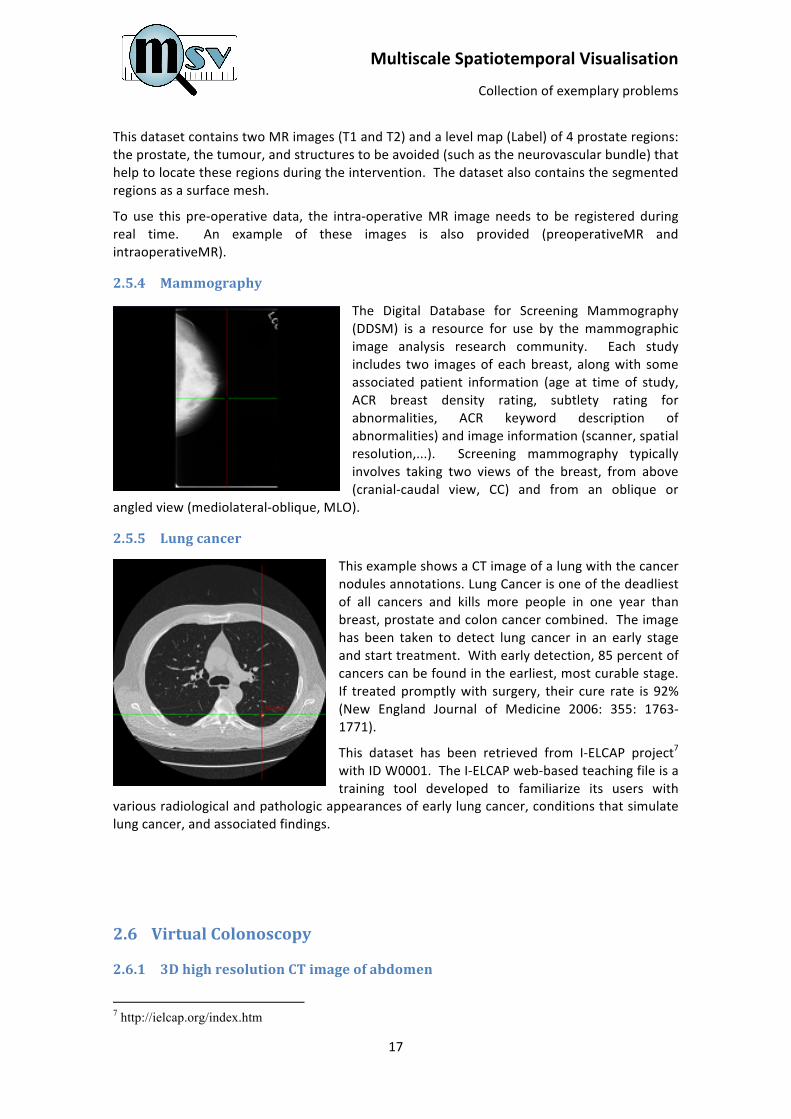
2.4.4 Purkinje neuron
This example shows a Purkinje neuron from rat cerebellum injected with Lucifer Yellow and imaged using confocal microscopy. This dataset has been retrieved from the Cell Centered Database6 dataset with ID2.
The second dataset (Purkinje dendrite) shows a tomographic reconstruction of stained Purkinje cell dendrite from rat cerebellum.
The third dataset (Purkinje Neuron Actin) is the subcellular distribution of
5 http://en.wikipedia.org/wiki/EEG-fMRI 6 http://ccdb.ucsd.edu/
Multiscale Spatiotemporal Visualisation
Collection of exemplary problems
16
F-‐actin (protein) in cerebellar Purkinje cell spines.
2.4.5 Cortical neurons from Alzheimers disease patients
This example shows a reconstruction of a cortical neuron from biopsy material obtained from Alzheimers disease patient. The image shows the major subcellular structures in the cell body of a cortical pyramidal neuron: Golgi apparatus, lipofuscin, nucleus, nucleolus, paired helical filament and plasma membrane.
This dataset has been retrieved from the Cell Centered Database dataset with ID 3716.
2.5 Oncology
2.5.1 MRI data, histopathology and gene data of a cerebral tumor
This example shows cerebral tumor at different space scales levels: MR data of the head of the patient and microscopy image of the tumor tissue. The microscopy image is used to perform several genetic analyses. Some clinical data is also available.
This cancer is of type Glioblastoma Multiforme (GBM). GBM is a fast-‐growing type of malignant brain tumor that is the most common brain tumor in adults.
Data has been retrieved from http://imaging.nci.nih.gov and http://tcga-‐data.nci.nih.gov.
2.5.2 Breast Radiotherapy DICOM Data
Computed Tomography scan of a patient's breast with the radiotherapy rays of the treatment.
The data has been retrieved from:
http://code.google.com/p/dicompyler/.
2.5.3 MR-‐guided prostate interventions
Prostate cancer has the second-‐highest mortality rate of all cancers in American men: one in six men will be diagnosed, and it kills one in thirty-‐five (American Cancer Society). One possible diagnosis is the Needle biopsy: a procedure to obtain a sample of cells from your body for laboratory testing. One possible treatment is Brachytherapy: a form of radiotherapy where a radiation source is placed inside or next to the area requiring treatment.
Multiscale Spatiotemporal Visualisation
Collection of exemplary problems
17
This dataset contains two MR images (T1 and T2) and a level map (Label) of 4 prostate regions: the prostate, the tumour, and structures to be avoided (such as the neurovascular bundle) that help to locate these regions during the intervention. The dataset also contains the segmented regions as a surface mesh.
To use this pre-‐operative data, the intra-‐operative MR image needs to be registered during real time. An example of these images is also provided (preoperativeMR and intraoperativeMR).
2.5.4 Mammography
The Digital Database for Screening Mammography (DDSM) is a resource for use by the mammographic image analysis research community. Each study includes two images of each breast, along with some associated patient information (age at time of study, ACR breast density rating, subtlety rating for abnormalities, ACR keyword description of abnormalities) and image information (scanner, spatial resolution,...). Screening mammography typically involves taking two views of the breast, from above (cranial-‐caudal view, CC) and from an oblique or
angled view (mediolateral-‐oblique, MLO).
2.5.5 Lung cancer
This example shows a CT image of a lung with the cancer nodules annotations. Lung Cancer is one of the deadliest of all cancers and kills more people in one year than breast, prostate and colon cancer combined. The image has been taken to detect lung cancer in an early stage and start treatment. With early detection, 85 percent of cancers can be found in the earliest, most curable stage. If treated promptly with surgery, their cure rate is 92% (New England Journal of Medicine 2006: 355: 1763-‐1771).
This dataset has been retrieved from I-‐ELCAP project7 with ID W0001. The I-‐ELCAP web-‐based teaching file is a training tool developed to familiarize its users with
various radiological and pathologic appearances of early lung cancer, conditions that simulate lung cancer, and associated findings.
2.6 Virtual Colonoscopy
2.6.1 3D high resolution CT image of abdomen
7 http://ielcap.org/index.htm
Multiscale Spatiotemporal Visualisation
Collection of exemplary problems
18
CT scan image at resolution of 512x512x889 of the patient abdomen allows performing virtual colonoscopy, after colon segmentation. Basic segmentation of colon has been performed using connected threshold algorithm and marching cubes.
This image has been retrieved from Osirix public data: http://pubimage.hcuge.ch:8080/
2.7 Human Anatomy
2.7.1 BodyParts3D
BodyParts3D is a dictionary-‐type database for anatomy in which shapes and positions of body parts are represented by 3D human models. This directory contains the models labeled with anatomical terms in BodyParts3D. The original dataset has 865 files in OBJ format. In order to manage the data easily, these files have been grouped depending on the organ system. The number of files has been reduced to 17 VTK files with a size of 217 MB.
This dataset has been retrieved from:
ftp://ftp.dbcls.jp/archive/bodyparts3d/20100816/README_e.html BodyParts3D, ©The Database Center for Life Science licensed under CC Attribution-‐Share Alike 2.1 Japan.
2.8 Mouse Atlas
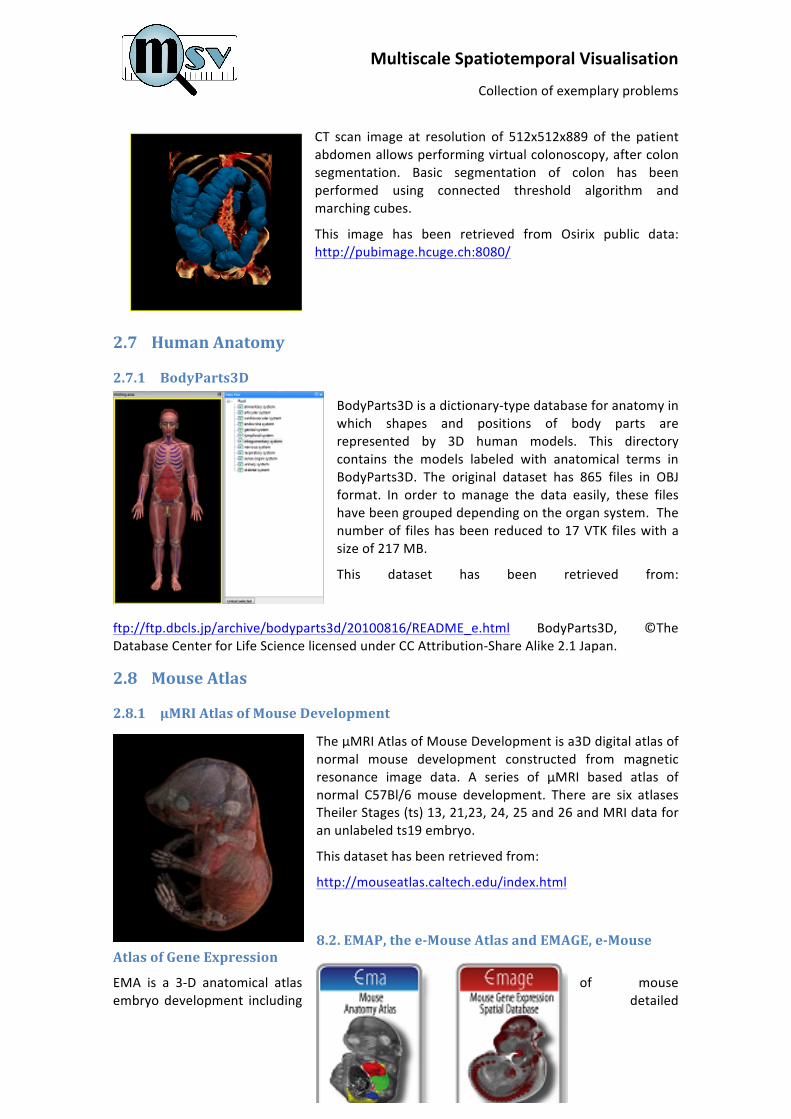
2.8.1 µMRI Atlas of Mouse Development
The µMRI Atlas of Mouse Development is a3D digital atlas of normal mouse development constructed from magnetic resonance image data. A series of µMRI based atlas of normal C57Bl/6 mouse development. There are six atlases Theiler Stages (ts) 13, 21,23, 24, 25 and 26 and MRI data for an unlabeled ts19 embryo.
This dataset has been retrieved from:
http://mouseatlas.caltech.edu/index.html
8.2. EMAP, the e-‐Mouse Atlas and EMAGE, e-‐Mouse
Atlas of Gene Expression EMA is a 3-‐D anatomical atlas of mouse embryo development including detailed
Multiscale Spatiotemporal Visualisation
Collection of exemplary problems
19
histology. EMA includes the EMAP ontology of anatomical structure. EMAGE is a database of in situ gene expression data in the mouse embryo and an accompanying suite of tools to search and analyse the data. mRNA in situ hybridisation, protein immunohistochemistry and transgenic reporter data is included. Link: http://www.emouseatlas.org/emap/home.html
2.9 Zebrafish embryo 9.1. Digital Fish Project
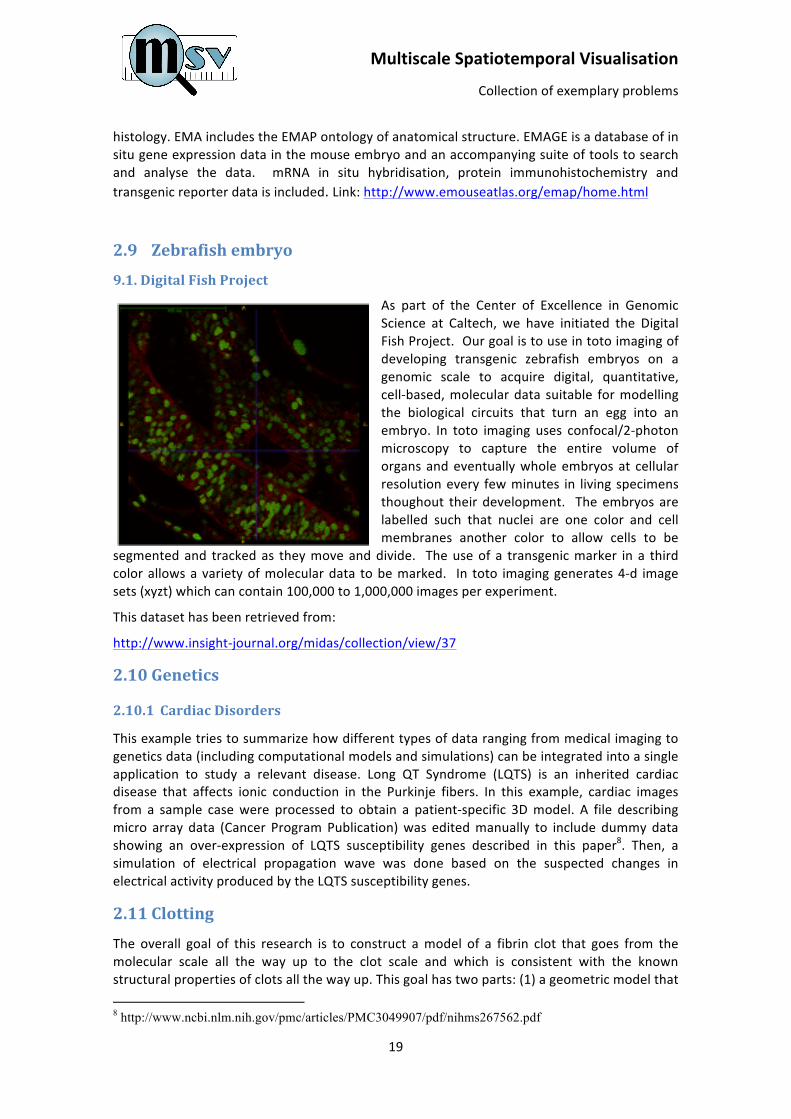
As part of the Center of Excellence in Genomic Science at Caltech, we have initiated the Digital Fish Project. Our goal is to use in toto imaging of developing transgenic zebrafish embryos on a genomic scale to acquire digital, quantitative, cell-‐based, molecular data suitable for modelling the biological circuits that turn an egg into an embryo. In toto imaging uses confocal/2-‐photon microscopy to capture the entire volume of organs and eventually whole embryos at cellular resolution every few minutes in living specimens thoughout their development. The embryos are labelled such that nuclei are one color and cell membranes another color to allow cells to be
segmented and tracked as they move and divide. The use of a transgenic marker in a third color allows a variety of molecular data to be marked. In toto imaging generates 4-‐d image sets (xyzt) which can contain 100,000 to 1,000,000 images per experiment.
This dataset has been retrieved from:
http://www.insight-‐journal.org/midas/collection/view/37
2.10 Genetics
2.10.1 Cardiac Disorders
This example tries to summarize how different types of data ranging from medical imaging to genetics data (including computational models and simulations) can be integrated into a single application to study a relevant disease. Long QT Syndrome (LQTS) is an inherited cardiac disease that affects ionic conduction in the Purkinje fibers. In this example, cardiac images from a sample case were processed to obtain a patient-‐specific 3D model. A file describing micro array data (Cancer Program Publication) was edited manually to include dummy data showing an over-‐expression of LQTS susceptibility genes described in this paper8. Then, a simulation of electrical propagation wave was done based on the suspected changes in electrical activity produced by the LQTS susceptibility genes.
2.11 Clotting The overall goal of this research is to construct a model of a fibrin clot that goes from the molecular scale all the way up to the clot scale and which is consistent with the known structural properties of clots all the way up. This goal has two parts: (1) a geometric model that 8 http://www.ncbi.nlm.nih.gov/pmc/articles/PMC3049907/pdf/nihms267562.pdf
Multiscale Spatiotemporal Visualisation
Collection of exemplary problems
20
is consistent with what is known, and (2) a dynamic model that is consistent with what is known. Within the geometric model, there are several sub-‐parts: one example explores constructing a protofibril from fibrin monomers, while another explores constructing a fibrin fiber from protofibrils.
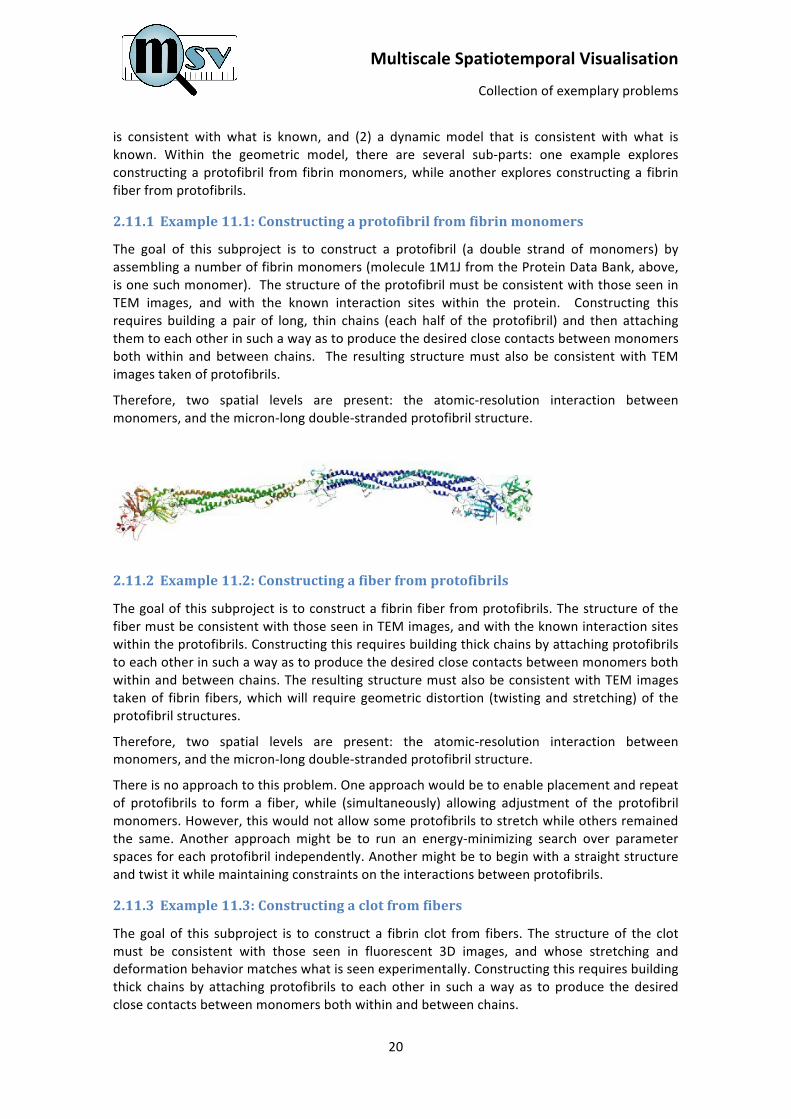
2.11.1 Example 11.1: Constructing a protofibril from fibrin monomers
The goal of this subproject is to construct a protofibril (a double strand of monomers) by assembling a number of fibrin monomers (molecule 1M1J from the Protein Data Bank, above, is one such monomer). The structure of the protofibril must be consistent with those seen in TEM images, and with the known interaction sites within the protein. Constructing this requires building a pair of long, thin chains (each half of the protofibril) and then attaching them to each other in such a way as to produce the desired close contacts between monomers both within and between chains. The resulting structure must also be consistent with TEM images taken of protofibrils.
Therefore, two spatial levels are present: the atomic-‐resolution interaction between monomers, and the micron-‐long double-‐stranded protofibril structure.
2.11.2 Example 11.2: Constructing a fiber from protofibrils
The goal of this subproject is to construct a fibrin fiber from protofibrils. The structure of the fiber must be consistent with those seen in TEM images, and with the known interaction sites within the protofibrils. Constructing this requires building thick chains by attaching protofibrils to each other in such a way as to produce the desired close contacts between monomers both within and between chains. The resulting structure must also be consistent with TEM images taken of fibrin fibers, which will require geometric distortion (twisting and stretching) of the protofibril structures.
Therefore, two spatial levels are present: the atomic-‐resolution interaction between monomers, and the micron-‐long double-‐stranded protofibril structure.
There is no approach to this problem. One approach would be to enable placement and repeat of protofibrils to form a fiber, while (simultaneously) allowing adjustment of the protofibril monomers. However, this would not allow some protofibrils to stretch while others remained the same. Another approach might be to run an energy-‐minimizing search over parameter spaces for each protofibril independently. Another might be to begin with a straight structure and twist it while maintaining constraints on the interactions between protofibrils.
2.11.3 Example 11.3: Constructing a clot from fibers
The goal of this subproject is to construct a fibrin clot from fibers. The structure of the clot must be consistent with those seen in fluorescent 3D images, and whose stretching and deformation behavior matches what is seen experimentally. Constructing this requires building thick chains by attaching protofibrils to each other in such a way as to produce the desired close contacts between monomers both within and between chains.
Multiscale Spatiotemporal Visualisation
Collection of exemplary problems
21
Therefore, three spatial levels are present: the atomic-‐resolution interaction between monomers, the micron-‐long double-‐stranded protofibril structure, and the millimeter-‐sized (or larger) fibrin clot.
There is no approach to this problem even if there are data at the clot scale.
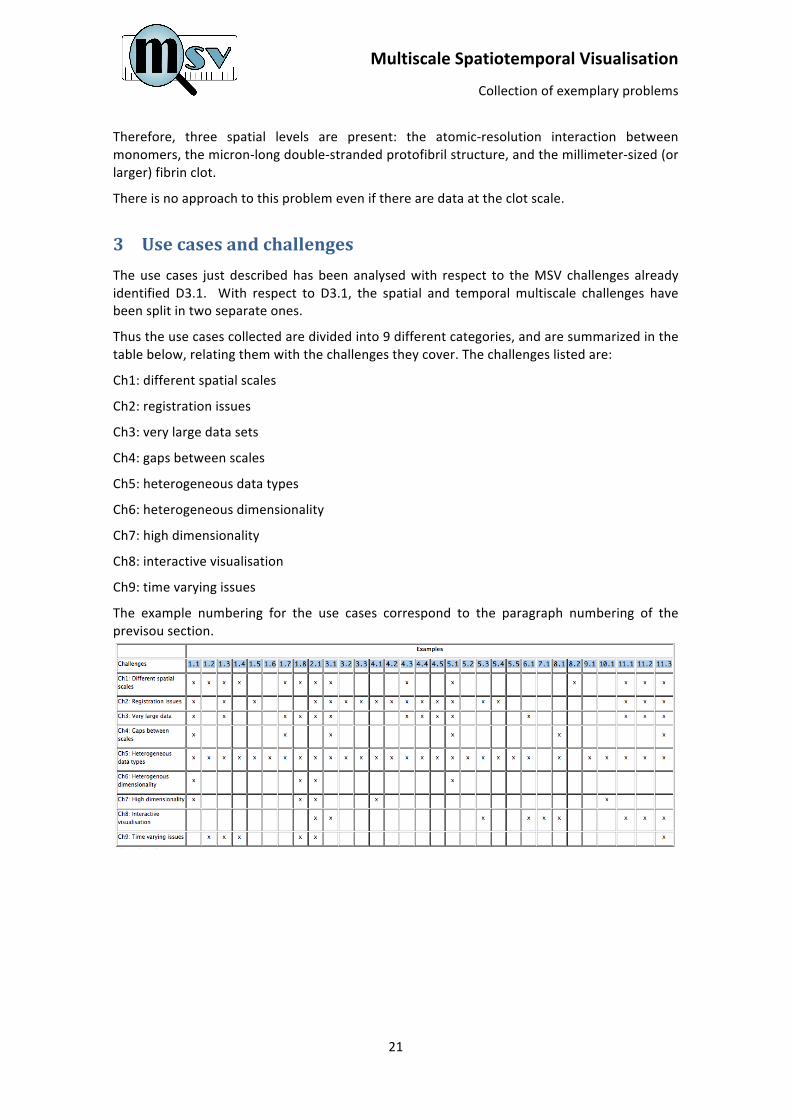
3 Use cases and challenges The use cases just described has been analysed with respect to the MSV challenges already identified D3.1. With respect to D3.1, the spatial and temporal multiscale challenges have been split in two separate ones.
Thus the use cases collected are divided into 9 different categories, and are summarized in the table below, relating them with the challenges they cover. The challenges listed are:
Ch1: different spatial scales
Ch2: registration issues
Ch3: very large data sets
Ch4: gaps between scales
Ch5: heterogeneous data types
Ch6: heterogeneous dimensionality
Ch7: high dimensionality
Ch8: interactive visualisation
Ch9: time varying issues
The example numbering for the use cases correspond to the paragraph numbering of the previsou section.
4 ANNEX: authorisations to data use where applicable
4.1 LHDL data LHDL data available in example #3.1 are publicly available under the following licence.
Non-‐Commercial use
Everyone can download all data resources part of the LHDL collection available on Physiome Space under the following Creative Commons use license
http://creativecommons.org/licenses/by-‐nc-‐sa/2.0/be/deed.en_GB
In simple words, it says that at download:
You are free:
-‐ to copy, distribute, display, and perform the work
-‐ to make derivative works
Under the following conditions:
-‐ Attribution. You must give the original authors credit.
-‐ Non-‐Commercial. You may not use this work for commercial purposes.
-‐ Share Alike. If you alter, transform, or build upon this work, you may distribute the resulting work only under a licence identical to this one.
o For any reuse or distribution, you must make clear to others the licence terms of this work.
o Any of these conditions can be waived if you get permission from the copyright holder.
o Nothing in this license impairs or restricts the author's moral rights.
The license is written according to the Belgian law.
4.2 UPF data The data of the examples #1.1, #1.2, #1.3, #1.4, #1.5, #2.1, #3.2, #3.3, #4.1 and #10.1 are available under the following license and copyright:
http://creativecommons.org/licenses/by-‐nc-‐sa/3.0/
Copyright (c) 2011,
Computational Image and Simulation Technologies in Biomedicine (CISTIB),
Universitat Pompeu Fabra (UPF), Barcelona, Spain. All rights reserved.
All rights reserved.
4.3 Cardiac Atlas Project The data of the example #1.6 is available without restrictions and has been downloaded from http://www.cardiacatlas.org/web/guest/tools.
4.4 Cell Centered Database The data of the examples #1.7, #4.4 and #4.5 are available under the following license and copyright:
Multiscale Spatiotemporal Visualisation
Draft non-‐profit business plan
23
http://ccdb.ucsd.edu/agreement/index.shtm
http://ccdb.ucsd.edu/copyright/index.shtm
4.4.1 Acceptance of Terms
When you access the CCDB website or database, you acknowledge that you have read and have agreed to the terms described below. If you do not agree to these terms, you should exit this site now. If you have any questions about these terms contact the webmaster.
4.4.2 Copyright
Copyright 2002–2007, The Regents of the University of California. All Rights Reserved. Permission to use, copy, modify, and distribute any part of the Cell Centered Database (CCDB) website for educational, research, and non-‐profit purposes, without fee, and without a written agreement is hereby granted, provided that the above copyright notice, this paragraph, and the following three paragraphs appear in all copies.
Those desiring to incorporate this CCDB website into commercial products or use for commercial purposes should contact Dr. Maryann Martone at 858-‐822-‐0745 and Technology Transfer and Intellectual Property Services, University of California, San Diego, 9500 Gilman Drive, La Jolla, CA 92093-‐0910, Phone: (857) 534-‐5815, Fax: (858) 534-‐7345, email: [email protected].
In no event shall the University of California be liable to any party for direct, indirect, special, incidental, or consequential damages, including lost profits, arising out of the use of this CCDB website, even if the University of California has been advised of the possibility of such damage.
The CCDB website provided herein is on an “as is” basis, and the University of California has no obligation to provide maintenance, support, updates, enhancements, or modifications. The University of California makes no representations and extends no warranties of any kind, either implied or express, including, but not limited to, the implied warranties of merchantability or fitness for a particular purpose, or that the use of the CCDB website will not infringe any patent, trademark, or other rights.
4.4.3 Data
Data Sharing Policy: The mission of the CCDB is to promote data sharing among scientists interested in cellular and subcellular anatomy and in developing computer algorithms for 3D reconstruction and modeling of such data. Data sets may be viewed or shared at the discretion of the author of the data. In some cases, the data may be freely viewed and Downloaded without contacting the original author, while in other cases, permission of the author may have to be obtained prior to receiving data. In either case, failure to cite or give credit to the original authors who collected these data in subsequent published articles or presentations is on par with plagiarism, is unacceptable, and unprofessional. Although the CCDB is not in a position to police every intended use of these data, we trust that the scientific community will ensure that this does not happen. However, we do insist that researchers re-‐analyzing these published data reference the original published article and the CCDB. An example of an appropriate acknowledgement is provided in the usage terms agreed to upon data download and is also included below
The CCDB schema is owned by the CCDB. Individual data and data sets remain the property of the principal investigator who contributed it. Any question as to proper use of this data set should be directed to the principal investigator and the CCDB.
Depositing Data to the CCDB: The CCDB will accept data from outside users. Policies for deposition of outside data are still being developed, but it is expected that users will deposit data in accordance with the mission of the CCDB to make 3D cellular and subcellular data available to the greater scientific community. Thus, any data deposited must have sufficient descriptive data that is interpretable by an independent user and as far as possible, original imaging data should be included.
Disclaimer: The data provided by the CCDB is freely distributed. This data is distributed in the hope that it will be useful but without any warranty. This data is provided by CCDB “as is” and any express or implied warranties, including, but not limited to, the implied warranties of merchantability, fitness for a particular purpose, or non-‐infringement, are disclaimed. In no event shall the CCDB be liable for any direct, indirect, incidental, special, exemplary, or consequential damages (including, but not limited to, procurement of substitute goods or services; loss of use, data, or profits; or business interruption) however caused and on any theory of liability, whether in contract, strict liability, or tort (including negligence or otherwise) arising in any way out of the use of this data, even if advised of the possibility of such damage.
Multiscale Spatiotemporal Visualisation
Draft non-‐profit business plan
24
4.4.4 Acknowledgements
Data used from the CCDB should be appropriately referenced, including both the author of the data and the CCDB. If the data were from a published study, the reference is included in the database record. The following reference should be cited for the CCDB:
Martone, M. E., Gupta, A., Wong, M., Qian, X., Sosinsky, G., Ludaescher, B., and Ellisman, M. H. A cell centered database for electron tomographic data. J. Struct. Biology 138: 145-‐155, 2002.
In addition, the support for the Cell Centered Database should be included in the acknolwedgement section of any publication:
The Cell Centered Database is supported by NIH grants from NCRR RR04050, RR RR08605 and the Human Brain Project DA016602 from the National Institute on Drug Abuse, the National Institute of Biomedical Imaging and Bioengineering and the National Institute of Mental Health.
4.5 Auckland Bioengineering Institute The data of the example #1.8 is available under the following restriction:
The data is free to use, but it would be appreciated if people could cite the following articles when they do use it:
• "New developments in a strongly coupled cardiac electromechanical model", David Nickerson, Nicolas Smith and Peter Hunter, Europace (2005) 7 (s2): S118-‐S127. doi: 10.1016/j.eupc.2005.04.009. This one gives a detailed description of the model being simulated in this dataset
• "Computational multiscale modeling in the IUPS Physiome Project: Modeling cardiac electromechanics", Nickerson, D.; Nash, M.; Nielsen, P.; Smith, N.; Hunter, P.; IBM J. RES. & DEV. VOL. 50 NO. 6 NOVEMBER 2006, DOI: 10.1147/rd.506.0617. This one gives details on the numerical and computational methods used in the simulations presented in the first one
4.6 GIB-‐UB research group The data of the examples #4.2 and #4.3 are available without any restriction. These datasets have been contributed from GIB-‐UB research group at Hospital Clinic from Barcelona.
4.7 National Cancer Institute The data of the example #5.1 is available under the following disclaimer:
LEGAL FRAMEWORK AND ETHICAL USE OF THIS RESOURCE The National Cancer Institute (NCI) offers this image repository to encourage cross-‐disciplinary science. Some of this data may already be published or in public domain. In addition, confidential information may be posted which has not yet been published or is subject of patent applications yet to be filed. Data may also be subject to copyright and commercial use may be protected under United States and foreign copyright laws. Other parties may retain rights to publish or reproduce these documents. In addition, some data may be the subject of patent applications or issued patents, and you may need to seek a license for its commercial use. Contact us if in doubt. If you are a contributor submitting data to this image repository, you are certifying that you are the original source of this data and are authorized to release the data that is permitted by your local IRB, when relevant. You also certify that you will consult with your institution's technology development office before posting or disclosing confidential information which may be patentable. You may browse, download, and use the data for non-‐commercial, scientific and educational purposes. However, you may encounter documents or portions of documents contributed by private institutions or organizations. NCI does not warrant or assume any legal liability or responsibility for accuracy, completeness or usefulness of information in this archive. Every effort will have been made to remove private health information (PHI) from images both by the submitter and again by tested automatic de-‐identification processes by the NCI as required by HIPAA for data use agreements [45CFR164.514(e)(4)], i.e., appropriate safeguards to ensure that protected health information (PHI) is not used or disclosed inappropriately. Nonetheless ethical principles command all users to make no attempt to identify individuals from whatever data elements and metadata remain. By continuing with this registration process, you understand that all necessary information describing the use of the system is detailed in the online help PDF documentation accessible from the left-‐menu bar from within the application. USER REGISTRATION PRIVACY ACT NOTIFICATION STATEMENT The National Biomedical Imaging Archive (NBIA) web portal asks users to register. The use of this information is to allow the NCI to continuously improve the image repository as a public service. Collection of this information is authorized under Title IV of the PHS Act, Section 410[285]. This information may be disclosed to researchers for research purposes, contractors
Multiscale Spatiotemporal Visualisation
Draft non-‐profit business plan
25
responsible for the maintenance of the repository and to other registered repository users for non-‐commercial, scientific and educational purposes. Submission of this information is voluntary. However, when registering please complete all fields. The NBIA web portal also records IP addresses and aggregated user query information. However, the IP address is not associated with any user registration information. The user registration data, IP addresses and aggregated user query information are used for NCI internal reporting purposes only to allow for improvement of the NBIA web portal based on users needs. For additional information, please refer to the Legal Rules noted above, and the link to our Privacy Policy. We do not use "cookies" on our web site. We do not give, share, sell or transfer any personal information to a third party. When inquiries are e-‐mailed to us, we store the question and the e-‐mail address information so that we can respond electronically. Unless otherwise required by statute, we do not identify publicly who sends questions or comments to our web site. We will not obtain information that will allow us to personally identify you when you visit our site, unless you chose to provide such information to us. To assure the integrity of information on this server, we reserve the right to monitor system access if malicious actions are taken to disable our on-‐line services or intentionally gain unauthorized access to NCI systems.
4.8 Breast Radiotherapy DICOM Data The data of the example #5.2 is available without restrictions and has been downloaded from the web site http://code.google.com/p/dicompyler/.
4.9 MR-‐guided prostate interventions The data of the example #5.3 is available without restrictions and has been downloaded from the web site http://prostatemrimagedatabase.com/OtherHtml/Slicer.html .
4.10 Digital Database for Screening Mammography (DDSM) The data of the example #5.4 is available under the following restriction:
If I use data from DDSM in publications... Please credit the DDSM project as the source of the data, and reference:
• The Digital Database for Screening Mammography, Michael Heath, Kevin Bowyer, Daniel Kopans, Richard Moore and W. Philip Kegelmeyer, in Proceedings of the Fifth International Workshop on Digital Mammography, M.J. Yaffe, ed., 212-‐218, Medical Physics Publishing, 2001. ISBN 1-‐930524-‐00-‐5.
• Current status of the Digital Database for Screening Mammography, Michael Heath, Kevin Bowyer, Daniel Kopans, W. Philip Kegelmeyer, Richard Moore, Kyong Chang, and S. MunishKumaran, in Digital Mammography, 457-‐460, Kluwer Academic Publishers, 1998; Proceedings of the Fourth International Workshop on Digital Mammography.
Also, please send a copy of your publication to Professor Kevin Bowyer / Computer Science and Engineering / University of Notre Dame / Notre Dame, Indiana 46530.
4.11 ELCAP Public Lung Image Database The data of the example #5.5 is available without restrictions:
http://www.via.cornell.edu/lungdb.html
4.12 OSIRIX The data of the example #6.1 is available without restrictions. It has been downloaded from the web site http://pubimage.hcuge.ch:8080/.
4.13 BodyParts3D The data of the example #7.1 is available under the following license:
You may use this database in compliance with the terms and conditions of the license described below. The license specifies the license terms regarding the use of this database and the requirements you must follow in using this database. The license for this database is specified in the Creative Commons Attribution-‐Share Alike 2.1 Japan. If you use data from this database, please be sure attribute this database as follows: "BodyParts3D, © The Database Center for Life Science licensed under CC Attribution-‐Share Alike 2.1 Japan".With regard to this database, you are licensed to:
Multiscale Spatiotemporal Visualisation
Draft non-‐profit business plan
26
1. freely access part or whole of this database, and acquire data; 2. freely redistribute part or whole of the data from this database; and 3. freely create and distribute database and other derivative works based on part or whole of the data from this database,
under the license, as long as you comply with the following conditions:
1. You must attribute this database in the manner specified by the author or licensor when distributing part or whole of this database or any derivative work.
2. You must distribute any derivative work based on part or whole of the data from this database under the license. 3. You need to contact the Licensor shown below to request a license for use of this database or any part thereof not
licensed under the license.
4.14 µMRI Atlas of Mouse Development The data of the example #8.1 is available without resctictions and has been downloaded from: http://mouseatlas.caltech.edu/index.html.
4.15 EMAP The data of the example #8.2 is available without resctictions and has been downloaded from: http://www.emouseatlas.org/emap/home.html
When citing the EMAP project, or the resources developed as part of EMAP, please use the following text: EMAP eMouse Atlas Project (http://www.emouseatlas.org). When acknowledging the use of data located in the EMAP online resources, please refer to its ID where possible (e.g expressed as EMA:#, where # is the numerical identifier for the EMA anatomy model, EMAP:#, where # is the numerical identifier of the anatomy ontology term etc), and the date (month/year) when the data was retrieved.
4.16 Digital Fish Project The data of the example #9.1 is available without resctictions and has been downloaded from http://www.insight-‐journal.org/midas/collection/view/37 .
Please use this identifier to cite or link to this collection: http://hdl.handle.net/1926/580


![Measurements of the Viscosity and Density Versus ...thermophysics.ru/pdf_doc/AutoPlay/Docs/CollectionOf...4 been performed for alcohol + hydrocarbon systems under pressure [2,3]. Due](https://static.fdocuments.in/doc/165x107/5aa64c3d7f8b9ac8748e413e/measurements-of-the-viscosity-and-density-versus-been-performed-for-alcohol.jpg)