Multidrug resistance drives partial EMT to complete EMT: study the network of EMT mediators
Upload
maurice-lawrenceCategory
view
216download
1
MS SANNA BT TAKINGMS SANNA BT TAKING
[email protected]@kukum.edu.my
04-9798413/985517104-9798413/9855171
July 12, 2006
EMT 361/3: RELIABILITY & FAILURE ANALYSIS

ObjectivesObjectives
Teaching Plan Teaching Plan
Evaluation ContributionEvaluation Contribution
Teaching StaffTeaching Staff
ReferencesReferences
Outline
(1) Learn about the concept and the needs of reliability as (1) Learn about the concept and the needs of reliability as well as failure analysis in the semiconductor industry.well as failure analysis in the semiconductor industry.
(2) Learn about the techniques and equipment used in (2) Learn about the techniques and equipment used in failure analysis processes. failure analysis processes.
(3) Will be able to operate various equipment used in (3) Will be able to operate various equipment used in failure analysis processes, identify various typical failure analysis processes, identify various typical modes and mechanisms of defects and locate typical modes and mechanisms of defects and locate typical sources of failure and suggest ways to overcome the sources of failure and suggest ways to overcome the failure. failure.
Objectives

LectureLecture
Lab SessionLab Session
Teaching Plan
Final examination: 50% Final examination: 50%
Labs/Assignments/Mini Project/Attendance: 40 %Labs/Assignments/Mini Project/Attendance: 40 %
Test (1&2): 10 %Test (1&2): 10 %
Note:Students’ attendance is compulsoryNote:Students’ attendance is compulsory
Evaluation Contribution

Lecturers: Ms Sanna Bt TakingLecturers: Ms Sanna Bt Taking
Assoc. Prof. Dr. Zul Azhar Zahid JamalAssoc. Prof. Dr. Zul Azhar Zahid Jamal
Teaching Engineers: Mr SallehudinTeaching Engineers: Mr Sallehudin
Ms Hasnizah ArisMs Hasnizah Aris
Teaching Staff

Ken Neubeck. (2004). Ken Neubeck. (2004). Practical Reliability Practical Reliability AnalysisAnalysis. Prentice Hall.. Prentice Hall.
Lawrence C. Wagner. ( 1999). Lawrence C. Wagner. ( 1999). Failure Analysis Failure Analysis of Integrated Circuits: Tools and Techniquesof Integrated Circuits: Tools and Techniques .. Kluwer Academic.Kluwer Academic.
Text Books

David L. Burgess and Richard A. Blanchard. (2002). David L. Burgess and Richard A. Blanchard. (2002). Wafer Failure Analysis for Yield Enhancement, Wafer Failure Analysis for Yield Enhancement, Accelerated AnalysisAccelerated Analysis..
Richard J. Ross and Christian Boit. (2002). Richard J. Ross and Christian Boit. (2002). Microelectronic Failure Analysis Desk ReferenceMicroelectronic Failure Analysis Desk Reference. . ASM International.ASM International.
Milton Ohring. (1998). Milton Ohring. (1998). Reliability & Failure of Electronic Reliability & Failure of Electronic Materials & Devices ReviewsMaterials & Devices Reviews.. Academic Press.Academic Press.
Others

Reliability terms & definitions – FR, MTBF, Reliability terms & definitions – FR, MTBF, bathtub curve;bathtub curve;
Reliability distributions – exponential, binomial, Reliability distributions – exponential, binomial, Poisson, Weibull;Poisson, Weibull;
System reliability models – serial, parallel, System reliability models – serial, parallel, standby, k of n, combination.standby, k of n, combination.
#WEEK 1: Overview of Reliability

What is Reliability???What is Reliability???
Reliability can be defined as Reliability can be defined as the probability of a the probability of a devicedevice performing its purpose adequately for the performing its purpose adequately for the period of time intended under the specified period of time intended under the specified conditions encountered.conditions encountered.

What is ‘Failure Rate’ (FR)??What is ‘Failure Rate’ (FR)??
The failure rate is the cornerstone The failure rate is the cornerstone unit of unit of measurementmeasurement used in the field of reliability used in the field of reliability engineering.engineering.

What is ‘Failure Rate’ (FR)??What is ‘Failure Rate’ (FR)??
Failure Rate is expressed as the ratio of the total Failure Rate is expressed as the ratio of the total number of failures to the total operating time.number of failures to the total operating time.
TK

Where Where
= Failure rate (FR)= Failure rate (FR)
K = Number of failuresK = Number of failures
T = Total operating timeT = Total operating time
Note: The FR calculation represents an Note: The FR calculation represents an average value!!!!average value!!!!

Calculate the failure rate for a commercial Calculate the failure rate for a commercial product such as a washing machine that has product such as a washing machine that has accumulated 5 failures that resulted in 5 service accumulated 5 failures that resulted in 5 service calls during 1,200 hours of operation.calls during 1,200 hours of operation.
Failure Rate Example

5 failures/1,200 hours = 0.00417 failures per hour5 failures/1,200 hours = 0.00417 failures per hour
In terms of scientific notation, the answer In terms of scientific notation, the answer calculated above is expressed as:calculated above is expressed as:
4170 failures/ hours or = 4,170 X 104170 failures/ hours or = 4,170 X 10 -6-6
(failures per hour)(failures per hour)
Solution
610

The reciprocal of the failure rate known as the The reciprocal of the failure rate known as the MTBF, and it is the ratio of total operating time to MTBF, and it is the ratio of total operating time to the total number of failures.the total number of failures.
Note: The MTBF calculation represents an average Note: The MTBF calculation represents an average value!!!!value!!!!
Mean Time Between Failures (MTBF)
1 KTMTBF

Calculate the MTBF for the previous example.Calculate the MTBF for the previous example.
1/(0.00417) = 1/(0.00417) = 240 hours240 hours
This number becomes useful in that we can This number becomes useful in that we can expect the machine to break down after 240 expect the machine to break down after 240 hours of use, and this information can be used to hours of use, and this information can be used to establish spares requirements.establish spares requirements.
MTBF Example:
Life History Curve (The Reliability Bathtub Curve)

Represent the reliability performance of Represent the reliability performance of components.components.
Involves observing the reliability performance of a Involves observing the reliability performance of a very large sample of homogeneous components very large sample of homogeneous components that is entering field service or testing at the same that is entering field service or testing at the same start time, T=0.start time, T=0.
Life History Curve (The Reliability Bathtub Curve)

Observing the components over a lifetime, T = TObserving the components over a lifetime, T = Tm m
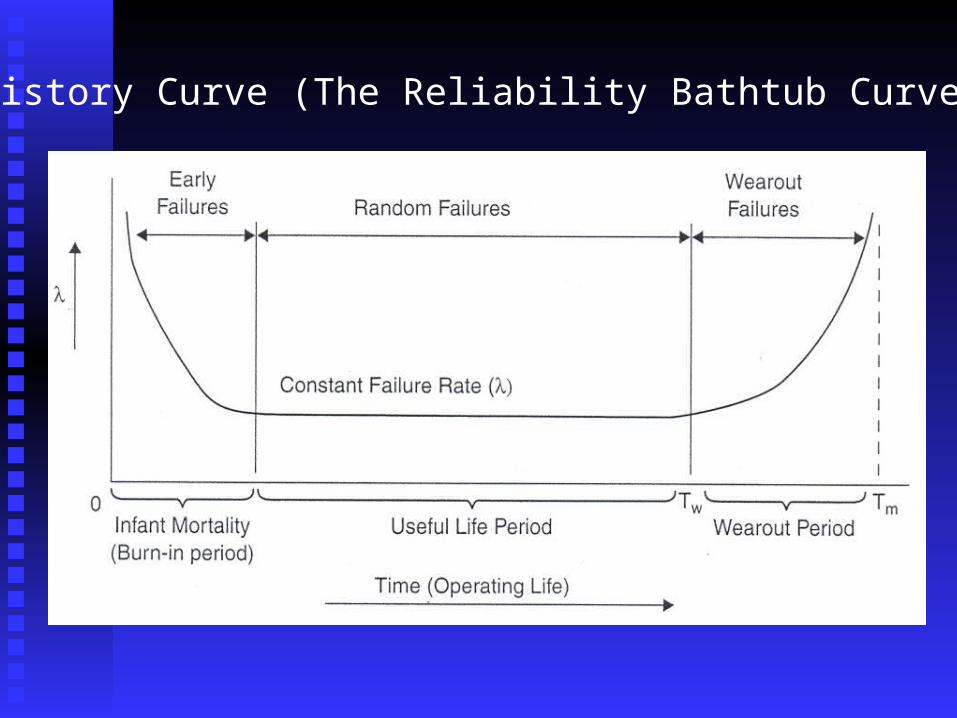
(where m represents the time at the end of life), (where m represents the time at the end of life), and not replace components when they fail, we and not replace components when they fail, we would see 3 basic periods of failure performance:would see 3 basic periods of failure performance:
1-Infant mortality (or early failures)1-Infant mortality (or early failures)
2-Random failures (constant failure rate)2-Random failures (constant failure rate)
3-Wearout failures (or end of life failures)3-Wearout failures (or end of life failures)
Life History Curve (The Reliability Bathtub Curve)

The population of components will initially The population of components will initially experience a high failure rate.experience a high failure rate.
Represents the burn-in or debugging period where Represents the burn-in or debugging period where weak components, as well as failures caused by weak components, as well as failures caused by design mistakes or process errors, are weeded out.design mistakes or process errors, are weeded out.
Infant Mortality

When the initial phase has passed with the weak When the initial phase has passed with the weak components weeded out and the design mistakes components weeded out and the design mistakes corrected, the remaining component population corrected, the remaining component population reaches a relatively constant failure rate period.reaches a relatively constant failure rate period.
Most reliability determinations are usually Most reliability determinations are usually concerned with this useful life or random failure concerned with this useful life or random failure period.period.
Useful Life Period

A number of reliability distributions such as the A number of reliability distributions such as the exponential that are used to describe this phase of exponential that are used to describe this phase of constant failure rate.constant failure rate.
The idea of a constant failure rate is generally an The idea of a constant failure rate is generally an oversimplification, and failures can result from oversimplification, and failures can result from complex , uncontrollable and often unknown complex , uncontrollable and often unknown causes.causes.
Useful Life Period

Begin to occur at time TBegin to occur at time Tww until the end of life is until the end of life is
reached at Treached at Tmm. .
Wearout Failures

The reliability performance of components can The reliability performance of components can often be described by mathematical expressions.often be described by mathematical expressions.
These reliability distributions are derived from the These reliability distributions are derived from the same frequency distributions that are used in the same frequency distributions that are used in the area of probability where the provide an analytical area of probability where the provide an analytical representation of all possible outcomes.representation of all possible outcomes.
Reliability Distributions

Can be defined as the Can be defined as the percentagepercentage or or likelihoodlikelihood that that a specific event will occura specific event will occur and that the and that the frequency frequency distributiondistribution represents an analytical description of represents an analytical description of the probabilities of all possible outcomes.the probabilities of all possible outcomes.
Probability

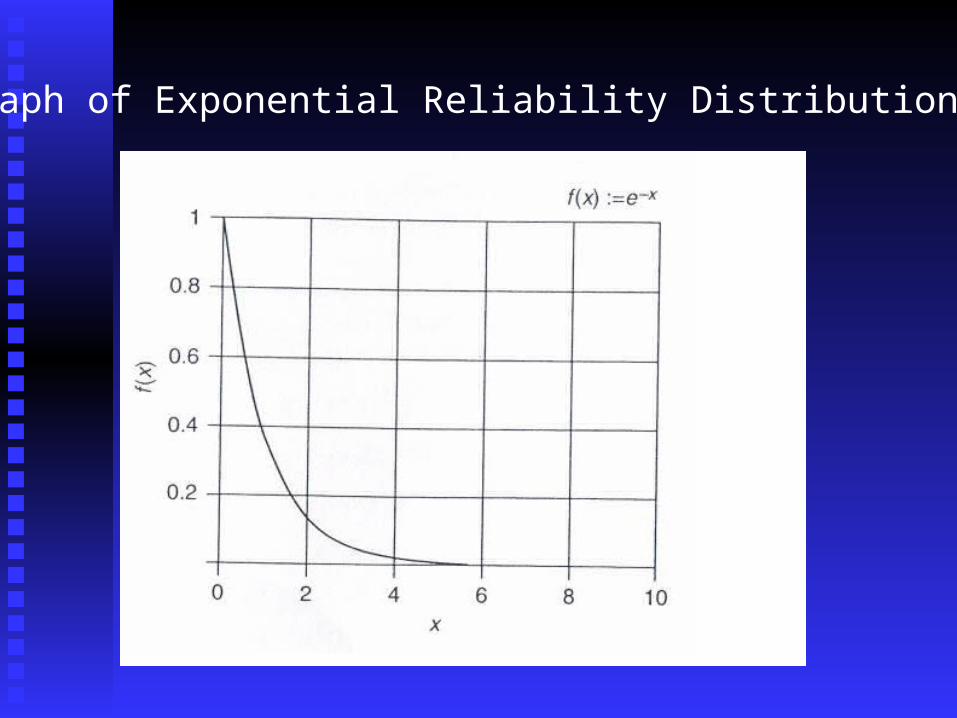
When a device is subject only to failures that When a device is subject only to failures that occur at random intervals, and that expected occur at random intervals, and that expected number of failures is the same for equally long number of failures is the same for equally long operating periods (i.e., the failure rate is operating periods (i.e., the failure rate is constant), its reliability is exponentially based and constant), its reliability is exponentially based and is expressed as:is expressed as:
R(t) = eR(t) = e- t- t
The Exponential Reliability Distribution

Where Where
R = ReliabilityR = Reliability
e = base of the natural logarithme = base of the natural logarithm
= chance of failure (constant)= chance of failure (constant)
t = operating time for which we are measuringt = operating time for which we are measuring
the reliability or R of the device that is knownthe reliability or R of the device that is known
as the exponential case of chance failure.as the exponential case of chance failure.
Graph of Exponential Reliability Distribution

Unreliability, Q = 1 – R(t) = 1 – eUnreliability, Q = 1 – R(t) = 1 – e- t- t

What is the reliability of an electrical device that What is the reliability of an electrical device that has an exponential reliability distribution with a has an exponential reliability distribution with a failure rate ( ) of 9 X 10failure rate ( ) of 9 X 10⁻⁶-6 over time over time
t = 1,000 hours?t = 1,000 hours?
Example

Solution
R(t) = e- t = e-(0.000009)(1000)
= 0.99104Q(t) = 1- 0.99104 = 0.000896
and if the approximation of t is used, Q(t) = (0.000009)(1000) = 0.009

Is a discrete distribution and can be represented Is a discrete distribution and can be represented by:by:
(R+Q)(R+Q)nn = 1 = 1
where, n = total number of trials where, n = total number of trials
The Binomial Reliability Distribution

Flipping coins for heads and tails, we assume Flipping coins for heads and tails, we assume heads = success, while tails = failure, and heads = success, while tails = failure, and R=Q=0.5.R=Q=0.5.
n = 2 (two trials)n = 2 (two trials)
Example
(R+Q)2 = R2 + 2RQ + Q2 = 1 (0.5+0.5)2 = 0.52 + 2(0.5)(0.5)+ 0.52 = 1

The Poisson Reliability Distribution is a discrete is a discrete distribution.distribution.
For a probability of exactly one failure during For a probability of exactly one failure during time period t, time period t,
The Poisson Reliability Distribution
........)(1 321 QQQR
tettQ )()(1
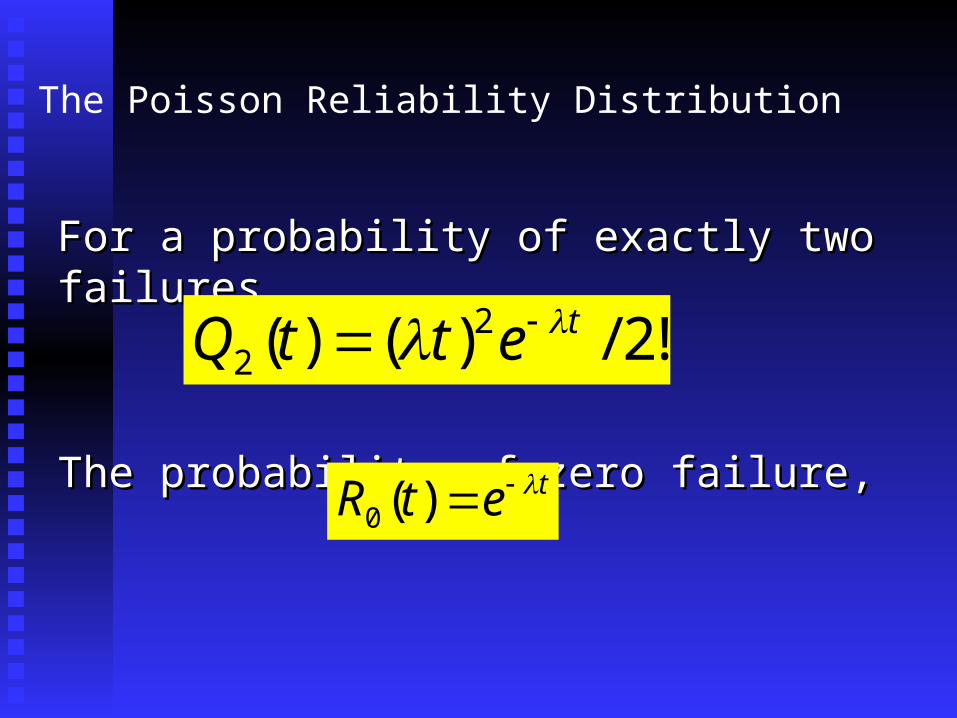
For a probability of exactly two failures,For a probability of exactly two failures,
The probability of zero failure,The probability of zero failure,
The Poisson Reliability Distribution
t
t
etR
ettQ
)(
!2/)()(
0
22 !2/)()( 2
2tettQ
tetR )(0

What is the combined probability of one or two What is the combined probability of one or two failures occuring during a time period of 1,000 failures occuring during a time period of 1,000 hours for an electronic device with a failure rate hours for an electronic device with a failure rate of 100 X 10-6? What is the probability of three or of 100 X 10-6? What is the probability of three or more failures occuring for this device during this more failures occuring for this device during this time period? time period?
Example

The probability of exactly one failure occuring The probability of exactly one failure occuring during time t:during time t:
The probability of exactly two failures occuring The probability of exactly two failures occuring during time t:during time t:
Solution
004524.0!2/)101001000(!2/)()(
09048.0)101001000()()()1000)(0001.0(262
2
)1000)(0001.0(61
eXXettQ
eXXettQt
t
09048.0)101001000()()( )1000)(0001.0(61 eXXettQ t
004524.0!2/)101001000(!2/)()( )1000)(0001.0(2622 eXXettQ t
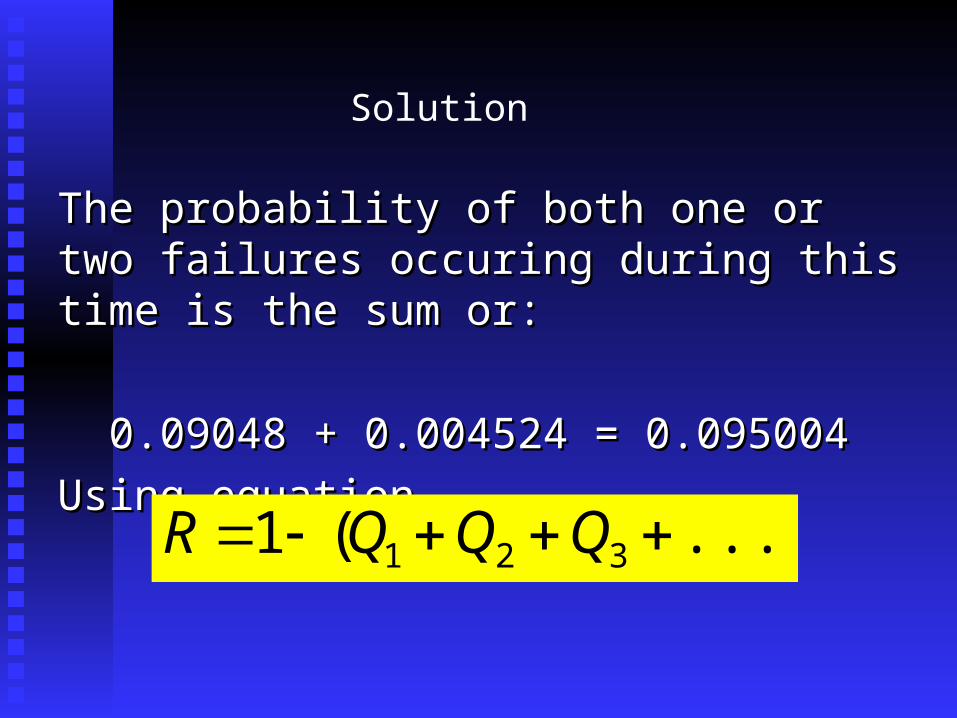
The probability of both one or two failures The probability of both one or two failures occuring during this time is the sum or:occuring during this time is the sum or:
0.09048 + 0.004524 = 0.0950040.09048 + 0.004524 = 0.095004
Using equation,Using equation,
Solution
......)(1 321 QQQR

Solution
000006.0004524.009048.090499.01......)(
1......)(
3
213
Q
QQRQ

The Weibull Reliability Distribution is more complicated continuous reliability distributions.
Frequently used in life data analysis.
Widely used in certain areas ( such as manufacturing) because of its versatility and the fact that the Weibull distribution can assume different shapes depending on the specific parameter values chosen.
The Weibull Reliability Distribution

Very similar to the exponential reliability function Very similar to the exponential reliability function with the addition of a shaping parameter.with the addition of a shaping parameter.
= the shape parameter, indicates whether the = the shape parameter, indicates whether the failure rate is increasing or decreasing as follows:failure rate is increasing or decreasing as follows:
The Weibull Reliability Distribution
)()( tetR
0.10.1
0.1
if
if
and if
the failure rate is decreasing,
the failure rate is constant,
the failure rate is increasing,

How the components are connected to each other How the components are connected to each other determines what type of system reliability model is determines what type of system reliability model is used and, ultimately, the reliability value for the used and, ultimately, the reliability value for the system.system.
SYSTEM RELIABILITY MODELS, Rs

5 types of system reliability model, which are:5 types of system reliability model, which are:
1- seriel reliability model1- seriel reliability model
2- parallel reliability model2- parallel reliability model
3- standby reliability model3- standby reliability model
4- k of n configuration reliability model4- k of n configuration reliability model
5- combination reliability model5- combination reliability model
SYSTEM RELIABILITY MODELS

The simplest reliability model.The simplest reliability model.
Each component of the system needs to be Each component of the system needs to be working for overall system success.working for overall system success.
Seriel Reliability Model
1 N
4
3
2

Seriel Reliability Model
)1().........1)(1)(1(
)1).......(1)(1)(1)(1(
.......
321
4321
4321
tttts
ns
ns
neeeeR
QQQQQR
XRXRXRXRRR
)1().........1)(1)(1(
)1).......(1)(1)(1)(1(
.......
321
4321
4321
tttts
ns
ns
neeeeR
QQQQQR
XRXRXRXRRR
Reliability, Rs , for n component in this system,

What is the reliability of an ATM that consist of the What is the reliability of an ATM that consist of the following components with associated failure probability following components with associated failure probability percentage? Assume that for this example, all ATM percentage? Assume that for this example, all ATM components are required to be working as a seriel components are required to be working as a seriel reliability model with each component being represented reliability model with each component being represented by a failure probability percentage based on field data.by a failure probability percentage based on field data.
Seriel Reliability Model Example
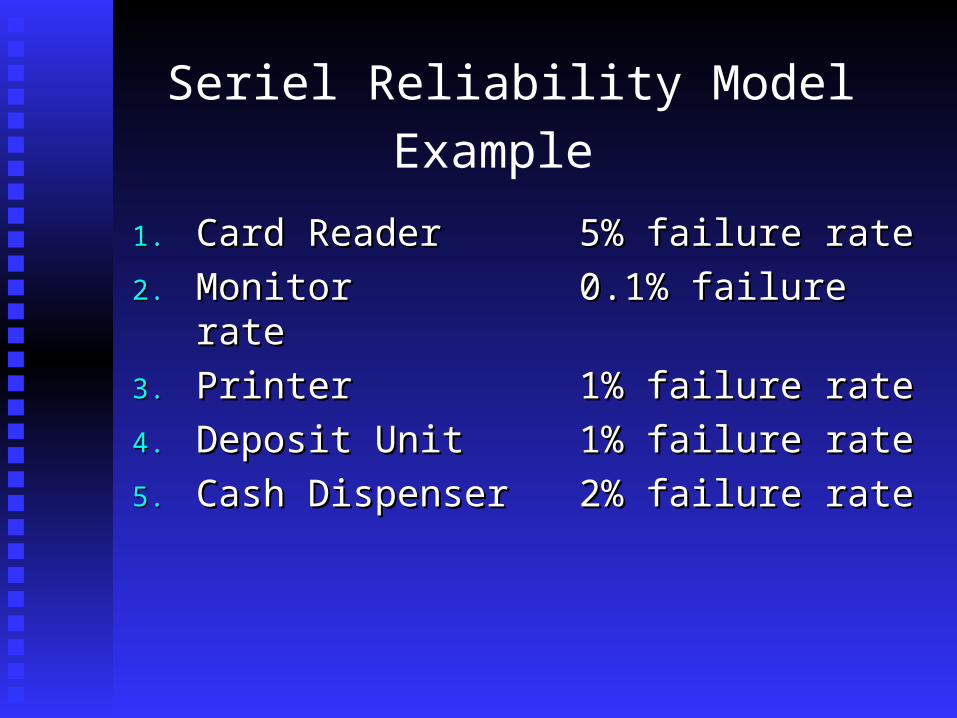
1.1. Card ReaderCard Reader 5% failure rate5% failure rate
2.2. MonitorMonitor 0.1% failure rate0.1% failure rate
3.3. PrinterPrinter 1% failure rate1% failure rate
4.4. Deposit UnitDeposit Unit 1% failure rate1% failure rate
5.5. Cash DispenserCash Dispenser 2% failure rate2% failure rate
Seriel Reliability Model Example

Solution
Card Reader
Monitor Printer
Deposit Unit
CashDispenser
Rs = (1-0.05)(1-0.001)(1-0.01)(1-0.01)(1-0.02) = (0.95)(0.999)(0.99)(0.99)(0.98) = 91.2%

By addding a factor of redundancy to the model, By addding a factor of redundancy to the model, the system reliability can be improved.the system reliability can be improved.
Two items are activated up simultaneously with Two items are activated up simultaneously with either item being used as a path for system either item being used as a path for system success.success.
This setup is often called This setup is often called active redundancyactive redundancy..
Parallel Reliability Model
The failure rate will generally be the same for The failure rate will generally be the same for each item, as in the case of electronic circuitry each item, as in the case of electronic circuitry that uses redundant circuits such as dual power that uses redundant circuits such as dual power supplies, dual microprocessors, or dual relay supplies, dual microprocessors, or dual relay switching and etc.switching and etc.
Parallel Reliability Model
1
2
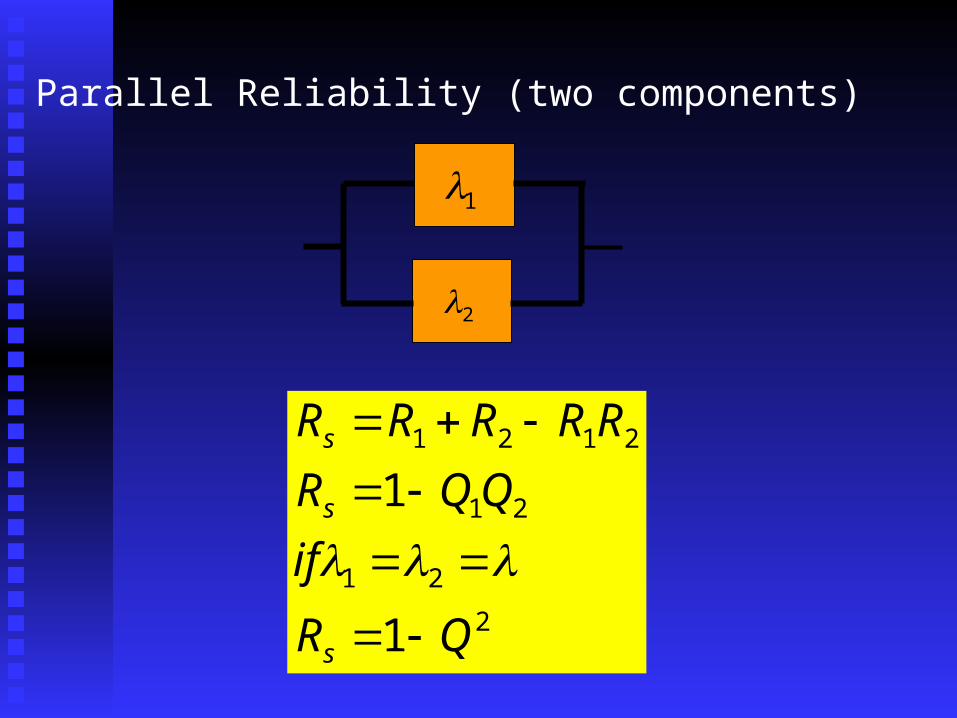
Parallel Reliability (two components)
2
21
21
2121
1
1
QR
if
QQR
RRRRR
s
s
s

1
2
3
Parallel Reliability (three components)
3
32
1
33
QR
RRRR
s
s

Banks have card readers on the outside doors to Banks have card readers on the outside doors to individual branches for access to the ATM lobby individual branches for access to the ATM lobby for off-banking hours. In this example, a bank has for off-banking hours. In this example, a bank has decided to use two card readers hooked up in decided to use two card readers hooked up in parallel redundancy where the customer can use parallel redundancy where the customer can use either card reader to gain entry to the lobby. either card reader to gain entry to the lobby. Assume that the percentage of failure for the card Assume that the percentage of failure for the card reader is 5%.reader is 5%.
Parallel Reliability Model Example

Solution
9975.0)05.0(11
%75.999975.0)05.01)(05.01()05.01()05.01(
22
2121
QR
or
orR
RRRRR
s
s
s
9975.0)05.0(11
%75.999975.0)05.01)(05.01()05.01()05.01(
22
2121
QR
or
orR
RRRRR
s
s
s

1
2
Switch
Standby Reliability
Note: The switch above is initially connected to the first item (with failure rate ) 1

Another way to add redundancy in a system is when Another way to add redundancy in a system is when twotwo or or more componentsmore components that that perform identical functionsperform identical functions are are connected togetherconnected together in a standby mode. in a standby mode.
In the standby reliability model, In the standby reliability model, only one component is only one component is activated at a timeactivated at a time (as opposed to both components being (as opposed to both components being activated in the parallel redundancy model) and if this activated in the parallel redundancy model) and if this component should fail, switching goes to the next component should fail, switching goes to the next component that is hooked up in parallel with the first component that is hooked up in parallel with the first component.component.
Standby Reliability Model

The overall reliability is calculated as a two-part The overall reliability is calculated as a two-part configuration: (1) the reliability of the first configuration: (1) the reliability of the first component and (2) the reliability of the second component and (2) the reliability of the second part after the first part fails. part after the first part fails.
Standby Reliability Model
For this type of system, there is a population of For this type of system, there is a population of n items with identical failure rate; there are f n items with identical failure rate; there are f failures allowed, and k non-failures, where k is failures allowed, and k non-failures, where k is less than n.less than n.
The model is based on the binomial expansion The model is based on the binomial expansion of (R+Q)of (R+Q)nn = 1 = 1
k of n Configuration Reliability Model

The equation can be expanded as:The equation can be expanded as:
Rearrange the binomial expansion into k of n Rearrange the binomial expansion into k of n reliability model as follows:reliability model as follows:
k of n Configuration Reliability Model
1............1
nffnnn QQR
f
nQnRR
nnknknn QnRQQRk
nQnRR
11 .......1.....

Represented by a combination-style reliability Represented by a combination-style reliability modelmodel that that consists of a number of simpler consists of a number of simpler reliability modelsreliability models that were described in the that were described in the previous sections.previous sections.
The The overall reliabilityoverall reliability can be determined by first can be determined by first calculating the calculating the reliability of the smallerreliability of the smaller or or simple simple individual portionsindividual portions first and then first and then combining each of combining each of these portionsthese portions to determine the overall reliability. to determine the overall reliability.
Combination Reliability Model

Combination Reliability Model Example
PowerSupply
(B)
PowerSupply
(A)
Micro-Processor
(A)
Micro-Processor
(B)
EMIBoardLCD
Back-lightingPanel