Moving Towards Relevant & Inclusive Education: the role of ...
63
Professor Asha Kanwar President & CEO, Commonwealth of Learning Photo Credit: Pacific Islands Forum Secretariat — in Kiribati https://www.facebook.com/photo.php?fbid=564736253564046&set=a.349890105048663.73305.162747037096305&type=1&theater Forum Education Ministers’ Meeting Cook Islands, March 31, 2014 Moving Towards Relevant & Inclusive Education: the role of distance learning and technology
Transcript of Moving Towards Relevant & Inclusive Education: the role of ...

Professor Asha Kanwar President & CEO,
Commonwealth of Learning
Photo Credit: Pacific Islands Forum Secretariat — in Kiribati https://www.facebook.com/photo.php?fbid=564736253564046&set=a.349890105048663.73305.162747037096305&type=1&theater
Forum Education Ministers’ Meeting Cook Islands, March 31, 2014
Moving Towards Relevant & Inclusive Education:
the role of distance learning and technology

Access to Learning is the Key to Development Created by the Heads of Commonwealth at CHOGM 1987
COL Vision
1987 Commonwealth Heads of Government Meeting (CHOGM), Vancouver, Canada
Intergovernmental Organization

WHAT IS IT FOR?
To help Commonwealth governments and institutions use various
technologies to improve and expand learning for development

Plan The Context of Education Trends in distance learning and
technology Towards Relevance & Inclusion

THE CONTEXT


The Commonwealth is home to
1/3 of the world’s poor, 2/3 of them are women (ODI, 2009); 23.3 million children out of primary school
(Education in the Commonwealth 2012); 462 million adult illiterates (ibid)

Human development report 2013
Country HDI Maternal Mortality per 100,000 births
Australia 0.938 7 New Zealand 0.919 15 Tonga 0.71 110 Samoa 0.702 Fiji 0.702 26 Kiribati 0.629 Vanuatu 0.626 110 Solomon Islands 0.53 93 Papua New Guinea 0.466 230
Source: Human Development Report 2013, UNDP

Education for All
(The Dakar Goals)
Quality only at goal number 6
Numbers rather than quality

Assumption: learning will happen
School + Teachers + Students

Annual State of Education Report, India: 2005
600 districts in India 35% children 7-14 year old:
unable to read a single para (grade 1 level) 30% could do second-grade
maths (basic division) Banerjee & Duflo, Poor Economics,
2011, p 75
Photo source: Annual Report 2005-06, Department of Elementary Education and Literacy Department of Secondary and Higher Education, Ministry of Human Resource Development, GOVERNMENT OF INDIA, 2006

Uwezo Survey, Kenya: 2010
27% in 5th Grade could not read a simple para in English 23% could not read in Kiswahili 30% could not do basic division
Banerjee & Duflo, 2011, p 76
Photo source: Are Our Children Learning? Numeracy and Literacy across East Africa, uwezo.net, 2011

Secondary & Tertiary enrolment
Country Secondary NER
Tertiary GER
Australia 86 83 New Zealand 97 81 Fiji 84 62 Samoa 80 Vanuatu 52 Solomon Islands 42
Source: UNESCO Institute for Statistics, retrieved in March 2014

Tertiary Enrolment in the Pacific 2004 - 2011
0
200,000
400,000
600,000
800,000
1,000,000
1,200,000
1,400,000
1,600,000
1,800,000
2004 2005 2006 2007 2008 2009 2010 2011
Source: UNESCO Institute for Statistics, Retrieved on March 18, 2014.

Expected Years of Education
Country Expected years of schooling, female
Expected years of schooling, male
Australia 20 19.2 New Zealand 20.5 18.8 Samoa* 12.4 11.8 Kiribati 12.4 11.6 Vanuatu* 10.1 10.1 Nauru 9.9 8.9 Solomon Islands 8.9 9.6
Source: Statistical Yearbook for Asia and the Pacific 2013 UN ESCAP
* from year 2000 and rest from 2012-2013

Rising Costs of Higher Education
Source: The Economist Dec 1st – 7th, 2012, Higher education, Not what it used to be.

And yet… 36% of college
graduates did not show any significant cognitive gains over 4 years Arum & Roksa, Academically Adrift, 2011
Half the employers say they have trouble finding qualified graduates to hire
Chronicle of HE and Marketplace
Cover Credit: PHOTOGRAPHS BY PETER HAPAK FOR TIME

ICT in the Pacific 2004 - 2012
0.0
10.0
20.0
30.0
40.0
50.0
60.0
70.0
80.0
90.0
100.0
2004 2005 2006 2007 2008 2009 2010 2011 2012
Mobile Subscription (Per 100 people) Fixed Broadband (Per 100 people) Internet users (Per 100 people)
Source: The World Bank DataBank, Retrieved on February 25, 2014.

However, without Australia & New Zealand Pacific Island Countries & Territories (PICTs)
have – Broadband penetration only 1% – Monthly fees for basic broadband: USD 25—
USD1000 – Only 30% have ICT policies
Sectt of the Pacific Community, 2010

TRENDS IN DISTANCE AND ONLINE LEARNING

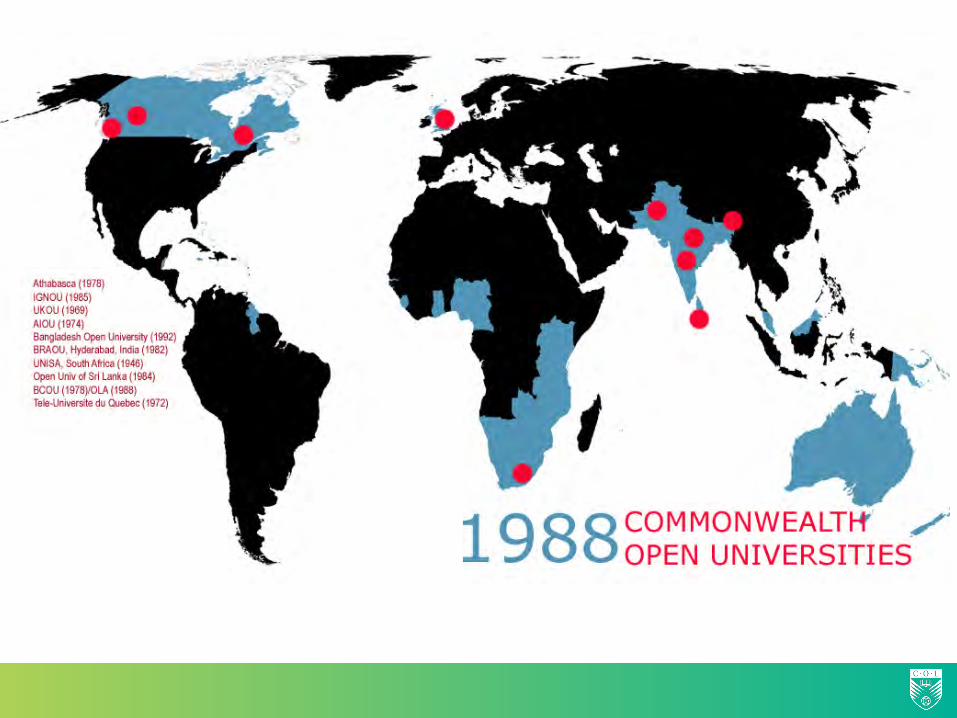
The Rise of Open Universities I


Costs in ODL
Korea (KNOU): annual cost/student $186 as compared to $2880 in a campus university Thailand (STOU): studies show
cost/learner is $226 compared to $876 for conventional learning
Open and Distance learning in the developing world – Perraton (2000)

Dual-mode provision
University of Nairobi: cost/learner of a residential B.Ed was 3 times that of an ODL programme
For dual mode systems: cost in CCIs were 15% of conventional departments
Perraton (2000)

Open and distance education in mega universities
Country Institution Enrolment % of Campus Cost*
Pakistan AIOU 456.126 22
China CCRTVU 2,300,000 40
India IGNOU 1,187,100 35
UK OU 203,744 50
*Unit cost per student as a percentage of the average for other universities in the country, NKC, 2004.

The Open University
Source: http://www.open.ac.uk/about/main/the-ou-explained/facts-and-figures
highest rated for overall student satisfaction in the 2012 National Student Survey rated fifth of 100 UK
universities (2003)

0.0
5.0
10.0
15.0
20.0
25.0
30.0
35.0
40.0
2002 2003 2004 2005 2006 2007 2008 2009 2010 2011 2012
Source: Grade Change - Tracking Online Education in the United States I.E. Allen and Jeff Seaman
II Online enrollment as a % of total enrollment, 2002 to 2012: US

Online enrolments in Asia and Latin America Asia has highest growth in the world at
17.3% e.g. Vietnam: 44.3% Malaysia: 39.4%
The growth rate in Latin America is 14.6% e.g. Brazil: 21.5% Columbia 18.6%
Ambient Insight Regional Report, October, 2012

Open Education Resources (OER) III
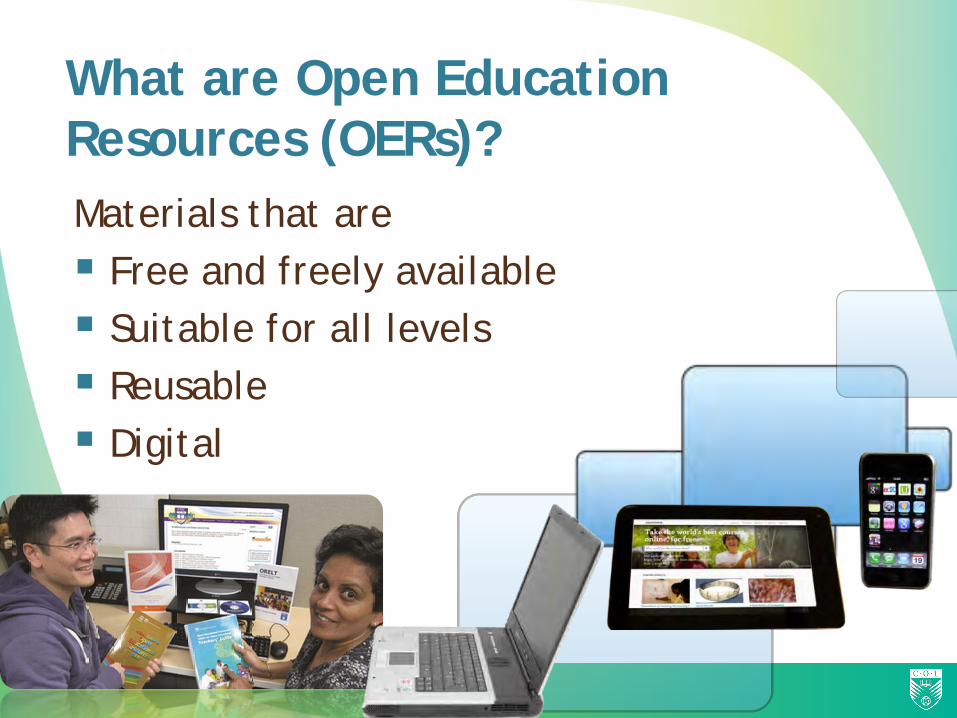
What are Open Education Resources (OERs)? Materials that are Free and freely available Suitable for all levels Reusable Digital

Costs: $ 10 per teacher
20 teacher education programmes in 12 countries Materials available in 4 languages In 2010, 320,000 teachers benefited

OER and Textbooks Brazil: a study found that for 75% of
students at University of São Paulo, the cost of acquiring books was higher than the family’s monthly income. USA: Utah Open Textbooks project: $5
per printed and zero for online content South Africa: R 1.5 billion for
textbooks: Department of Basic Education decides to develop OER textbooks.

OERu
Athabasca University Otago Polytechnic University of Southern
Queensland

The OER university concept. Adapted from Taylor (2007)
James Taylor

Can OER contribute to Quality?
611 institutions in India – KSS Women’s Engineering College, Andhra Pradesh – Maya Devi Educational Foundation, Uttarakhand – Bhilai Institute of Technology, Chattisgarh

Massive Open Online Courses: MOOCs
… a MOOC is a type of online course aimed at large scale participation and open access via the web. MOOCs are a recent development in the area of distance education, and a progression of the kind of open education ideals suggested by OER
Wikipedia, 20/09/12
IV

Massive Open Online Courses:
MOOCs

The ‘Massive’ in the MOOC
270 000 Students enrolled in Udacity’s Computer Science MOOC
200 000 US University first-year students intending to study Computer Science in 2968 4-year degree granting institutions
Source: Waldrop, M. M. (2013). Campus 2.0. Nature, 495, 160-163

Student Origins
United States, 27.7 %
India, 8.8 %
Brazil, 5.1 %
United Kingdom, 4.4 %
Spain, 4 %
Canada, 3.6 %
Australia, 2.3 %
Russia, 2.2 %
Rest of the world, 41.9 %
Source: Waldrop, M. M. (2013). Campus 2.0. Nature, 495, 160-163.

Courses Offered
Mathematics, 6 %
Science, 30 %
Arts and humanities, 28 %
Information technology, 23 %
Business, 13 %
Source: Waldrop, M. M. (2013). Campus 2.0. Nature, 495, 160-163.

MOOC for Development (M4D) Designed and offered by COL and IIT-
Kanpur Content created by IIT, COL and Athabasca
U, Banking Institute Delivery compatible with mobiles using
Android Experts from different countries for online
mentoring – 2286 sign ups; 1462 active; 333
certificates (89 for competence, five high distinction)
– 116 countries – Content as OER
Photo source: http://www.m4dev.org/m4d.pdf

Udacity + Georgia Tech
Masters in Computer Science: $7,000 Existing cost: $40,000 Will reach 10,000 within the next 3 years

Stanford 2011
Artificial Intelligence course 160,000 registered 23,000 completed All countries except
North Korea

Distance and Online Learning can
Enhance access and equity by reducing costs Improve quality by providing free world class
resources Provide flexible learning opportunities using
appropriate technologies
TOWARDS RELEVANCE & INCLUSION

Relevant Learning develops Capability for
Personal autonomy/independence of thought Livelihoods Social relations/identity Walker, 2006

Inclusive education means
“Bringing the benefits of education to the poor, the excluded, to indigenous people, to the marginalised and to those with special needs.”
2008-13 Medium term strategy of UNESCO

Global Youth Unemployment Rate 2004-2013
11.5
12.6
10.8
11.0
11.2
11.4
11.6
11.8
12.0
12.2
12.4
12.6
12.8
2007 2008 2009 2010 2011 2012p 2013p
Source: ILO - Global Employment Trends for Youth 2013
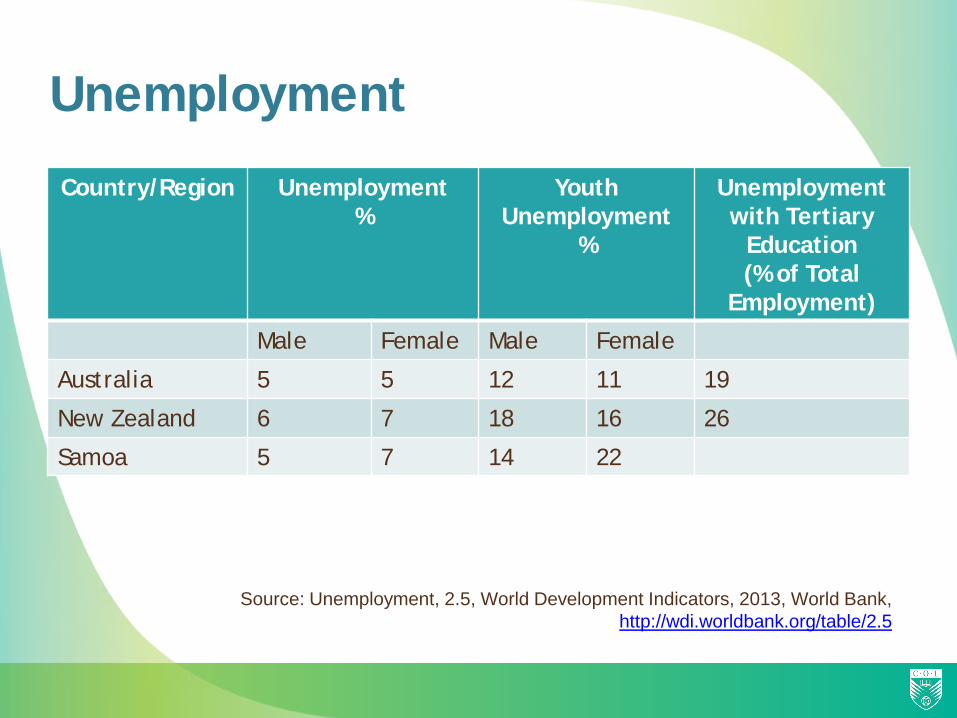
Unemployment
Country/Region Unemployment %
Youth Unemployment
%
Unemployment with Tertiary
Education (% of Total
Employment)
Male Female Male Female
Australia 5 5 12 11 19
New Zealand 6 7 18 16 26
Samoa 5 7 14 22
Source: Unemployment, 2.5, World Development Indicators, 2013, World Bank, http://wdi.worldbank.org/table/2.5

Emigration Rate of Tertiary Educated to OECD Countries
Country/Region % of Tertiary Educated Population Age 25+
Kiribati 55.7 PNG 27.8 Samoa 73.4 Solomon Islands 25.7 Tonga 75.6 Tuvalu 64.9 Source: Movement of People across Borders, 6.13, World Development Indicators, 2013, World Bank,
http://wdi.worldbank.org/table/6.13

“Employers, Education Providers and Youth Live in Parallel Universes”
Country % of youth who believe that their Secondary Education Improved their Employment
Opportunities
% of Employers who believe that new graduates are not
adequately prepared for entry level vacancies
Brazil 59 48
India 54 53
Turkey 46 56
United States 44 45
Source: McKinsey Survey, August-September 2012, in Education to Employment: Designing a System That Works, McKinsey Center of Government

Three types of skills
Foundation skills Transferable skills Technical and vocational skills
UNESCO: GMR, 2012

Skills for employability?
Non-cognitive skills: leadership, communication, honesty/ethics, teamwork and flexibility Cognitive skills: analytical and critical
thinking and the ability to learn Burnett, 2012

Education to Employment Strategy in Europe Innovate with design, course delivery and
financing to make education more affordable and accessible Focus on young people, employers and
education providers on improving employment readiness Build the supporting structures that allow the
best intervention to scale up Share relevant practices on matching labour
market demand and supply Source: Education to Employment: Getting Europe's Youth Into Work, McKinsey Center of Government http://www.mckinsey.com/insights/social_sector/converting_education_to_employment_in_europe

Addressing Challenges
Transform the curriculum to integrate cognitive and non-cognitive skills Harness appropriate technologies Facilitate the convergence
between education, the labour market and the learner
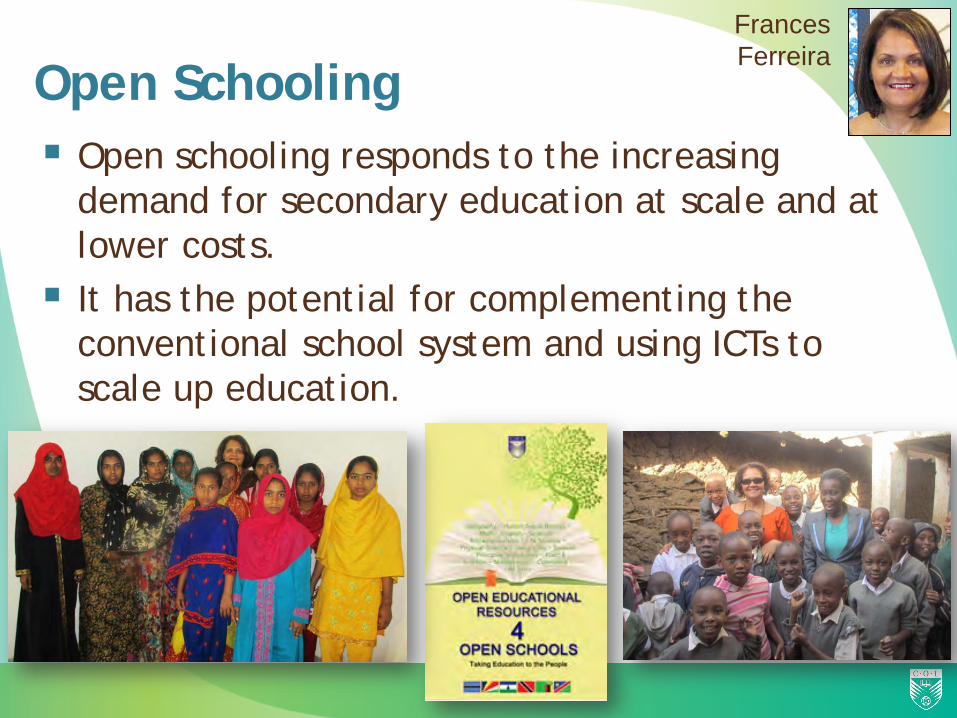
Open Schooling Open schooling responds to the increasing
demand for secondary education at scale and at lower costs. It has the potential for complementing the
conventional school system and using ICTs to scale up education.
Frances Ferreira

Open Schools in the Pacific
OSs in Tonga; Kiribati; Solomon Islands Vanuatu Open School launched Te Kura Correspondence School twins with
Vanuatu Convergence of Academic & Vocational
courses
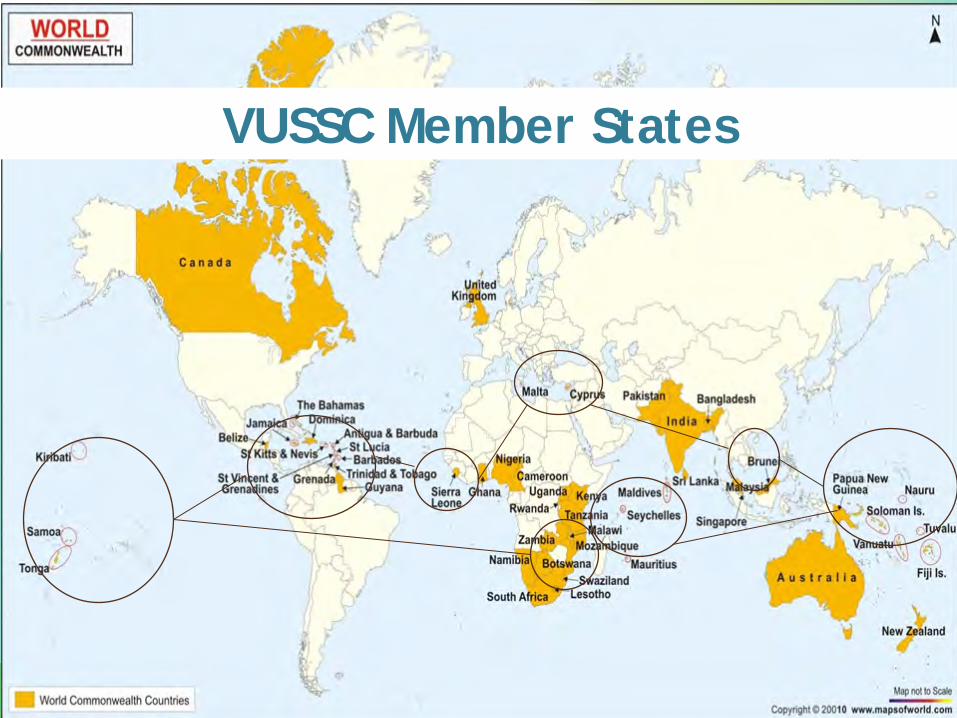
VUSSC Member States

VUSSC in the Pacific
University of Samoa, sustainable agriculture TQF: Vanuatu, Tuvalu, Tonga, PNG, Samoa
and the South Pacific Board for Educational Assessment (SPBEA).
Source: http://talloiresnetwork.tufts.edu/national-university-of-samoa-samoa/
John Lesperance

Some of the Institutions that participate in VUSSC
National University of Samoa National University of Lesotho Botswana College of Distance and Open Learning (BOCODOL) University of Swaziland Maldives College of Higher Education Fondazzjoni Temi Zammit, Malta University of Papua New Guinea Antigua State College Dominica State College University of Belize Clarence Fitzroy Bryant College, St. Kitts & Nevis College of The Bahamas University of Seychelles Namibian Open Learning Network Sir Arthur Lewis Community College, St. Lucia
St. Vincent and the Grenadines Community College St. Vincent and the Grenadines Teachers College University of Cyprus Polytechnic of Namibia University of Mauritius Seychelles Agricultural Agency Samuel Jackman Prescod Polytechnic, Barbados Seychelles Maritime Training Centre Vanuatu Institute of Technology Caribbean Maritime Institute Lesotho College of Education Maldives National University Tonga Institute of Higher Education Open University of Mauritius

If someone can give me the skills and the opportunity to work, I know I can achieve my goals.
young woman, Ethiopia GMR, 2012, p.13
photo: ILRI/Ranjitha Puskur

Learning for Development