“Motor Current Signature Analysis for Fault Diagnosis … - International Journal of Innovative...
12
IJISET - International Journal of Innovative Science, Engineering & Technology, Vol. 1 Issue 5, July 2014. www.ijiset.com ISSN 2348 – 7968 “Motor Current Signature Analysis for Fault Diagnosis and Condition Monitoring of Induction Motors using Interval Type-2 Fuzzy logic” 1 Sulekha Shukla, 2 Manoj Jha, 3 M. F. Qureshi, 1 Ph.D. Scholar, Dr. C.V. Raman University, Kargi Road, Kota,Bilaspur, India 2 Department of Applied Mathematics, Rungta Engg. College, Raipur, India (([email protected]) 3 Department of Electrical Engg., Govt. Polytechnic, Dhamtari, India ([email protected]) Abstract This paper presents the implementation of broken rotor bar fault detection in an induction motor using motor current signal analysis (MCSA) and prognosis with interval type-2 fuzzy logic. The Motor Current Signature Analysis (MCSA) can easily detect the common machine fault such as turn to turn short circuit, cracked /broken rotor bars, bearing deterioration. In this study, MCSA is applied to an induction motor to detect broken rotor bar faults. Here we discuss the fundamentals of Motor Current Signature Analysis (MCSA) plus condition monitoring of the induction motor using MCSA and interval type-2 fuzzy logic. In addition, this paper presents four case studies of induction motor fault diagnosis. The results show that Motor current signature analysis (MCSA) plus interval type-2 fuzzy logic can effectively detect abnormal operating conditions in induction motor applications. The diagnosis of a broken rotor bar fault has been studied for stable, full load condition and has been carried out experimentally by analyzing the power spectrum density (PSD) of the motor stator current. After extracting the characteristic frequencies of the broken rotor bar failure, an interval type-2 fuzzy logic algorithm is implemented for classifying the fault. The implementation results showed that the method is very efficient and useful for prognosis of the rotor faults in induction motor. Key Words: Condition monitoring, power spectral density, interval type-2 fuzzy logic, Stator Current Spectrum, Motor Current Signature Analysis; Fast Fourier Transform I. Introduction In recent years, the problems of failure in large machines have become more significant and of concern in industrial applications. The desire to improve the reliability of industrial drive systems has led to concerted research and development activities in several countries to evaluate the causes and consequences of various fault conditions. In particular, ongoing research work is being focused on rotor bar faults and on the development of diagnostic techniques- Several diagnostic techniques has been proposed in the past to detect faults due to broken rotor bars. Most of them are based on the steady-state analysis of stator voltages and currents via fast Fourier transform (FFT). Induction motors are the workhorses of industry and are frequently used in many applications because of their simple structure, inexpensive cost, and stability. The early detection of anomalies in motor drive systems is very important for safe, economic, and uninterrupted operations. There are many faults that can occur in electrical machines. The induction motor faults can be clearly seen in Fig. 1. These have been categorized according to the main components of a machine i.e. stator related faults, rotor related faults, bearing related faults and other faults. Percentage of fault distribution is shown in fig. 2. These induction motor faults can be classified as stator faults, resulting from opening or shorting one or more of the stator phases, incorrect connection of the motor windings, broken or cracked rotor bars or end rings, motor air-gap irregularities, and bearing or gearbox failures. All of the above faults because symptoms such as unbalanced air-gap voltages and motor currents stemming from an unbalanced magnetic pull, load torque oscillation, reduced average motor torque, increased losses with decreased motor efficiency, and increased motor temperature. The most well-known method for the diagnosis of broken rotor bars in induction motors is based on the monitoring and the 84
Transcript of “Motor Current Signature Analysis for Fault Diagnosis … - International Journal of Innovative...

IJISET - International Journal of Innovative Science, Engineering & Technology, Vol. 1 Issue 5, July 2014. www.ijiset.com
ISSN 2348 – 7968
“Motor Current Signature Analysis for Fault Diagnosis and Condition Monitoring of Induction Motors using Interval Type-2 Fuzzy logic”
1Sulekha Shukla, 2Manoj Jha, 3 M. F. Qureshi,
1Ph.D. Scholar, Dr. C.V. Raman University, Kargi Road, Kota,Bilaspur, India
2 Department of Applied Mathematics, Rungta Engg. College, Raipur, India
(([email protected]) 3 Department of Electrical Engg., Govt. Polytechnic, Dhamtari, India
Abstract This paper presents the implementation of broken rotor bar fault detection in an induction motor using motor
current signal analysis (MCSA) and prognosis with interval type-2 fuzzy logic. The Motor Current Signature Analysis
(MCSA) can easily detect the common machine fault such as turn to turn short circuit, cracked /broken rotor bars,
bearing deterioration. In this study, MCSA is applied to an induction motor to detect broken rotor bar faults. Here we
discuss the fundamentals of Motor Current Signature Analysis (MCSA) plus condition monitoring of the induction
motor using MCSA and interval type-2 fuzzy logic. In addition, this paper presents four case studies of induction motor
fault diagnosis. The results show that Motor current signature analysis (MCSA) plus interval type-2 fuzzy logic can
effectively detect abnormal operating conditions in induction motor applications. The diagnosis of a broken rotor bar
fault has been studied for stable, full load condition and has been carried out experimentally by analyzing the power
spectrum density (PSD) of the motor stator current. After extracting the characteristic frequencies of the broken rotor
bar failure, an interval type-2 fuzzy logic algorithm is implemented for classifying the fault. The implementation results
showed that the method is very efficient and useful for prognosis of the rotor faults in induction motor.
Key Words: Condition monitoring, power spectral density, interval type-2 fuzzy logic, Stator Current Spectrum, Motor
Current Signature Analysis; Fast Fourier Transform
I. Introduction In recent years, the problems of failure in large machines have become more significant and of concern in
industrial applications. The desire to improve the reliability of industrial drive systems has led to concerted research and
development activities in several countries to evaluate the causes and consequences of various fault conditions. In
particular, ongoing research work is being focused on rotor bar faults and on the development of diagnostic techniques-
Several diagnostic techniques has been proposed in the past to detect faults due to broken rotor bars. Most of them are
based on the steady-state analysis of stator voltages and currents via fast Fourier transform (FFT). Induction motors are
the workhorses of industry and are frequently used in many applications because of their simple structure, inexpensive
cost, and stability. The early detection of anomalies in motor drive systems is very important for safe, economic, and
uninterrupted operations. There are many faults that can occur in electrical machines. The induction motor faults can be
clearly seen in Fig. 1. These have been categorized according to the main components of a machine i.e. stator related
faults, rotor related faults, bearing related faults and other faults. Percentage of fault distribution is shown in fig. 2.
These induction motor faults can be classified as stator faults, resulting from opening or shorting one
or more of the stator phases, incorrect connection of the motor windings, broken or cracked rotor bars or end rings,
motor air-gap irregularities, and bearing or gearbox failures. All of the above faults because symptoms such as
unbalanced air-gap voltages and motor currents stemming from an unbalanced magnetic pull, load torque oscillation,
reduced average motor torque, increased losses with decreased motor efficiency, and increased motor temperature. The
most well-known method for the diagnosis of broken rotor bars in induction motors is based on the monitoring and the 84
IJISET - International Journal of Innovative Science, Engineering & Technology, Vol. 1 Issue 5, July 2014. www.ijiset.com
ISSN 2348 – 7968
processing of the stator currents to detect some relevant frequencies. These one are the sidebands close to the
fundamental frequency and other space harmonics present in the line current Induction motor failure surveys have
found the most common failure mechanisms in induction machines.
Fig.1 Induction motor fault scheme. Fig.2 Fault distribution in Induction Motor
The remainder of this paper is organized as following: Section 2 describes motor current signature analysis.
Sections 3 explain power spectrum density (PSD). Section 4 describes fuzzy logic-based fault diagnosis. Application of
MCSA for Induction Motor Fault Detection is described in section 5. The experimental results have been discussed in
Section 6. Finally, the paper concludes in Section 7.
II. Motor Current Signature Analysis Motor Current Signature Analysis (MCSA) is a technique used to determine the operating condition of AC
induction motors without interrupting production. MCSA techniques can be used in conjunction with vibration and
thermal analysis to confirm key machinery diagnostic decisions. MCSA operates on the principle that induction motor
circuits can, in essence, be viewed as a transducer. By clamping a Hall Effect Current sensor on either the primary or
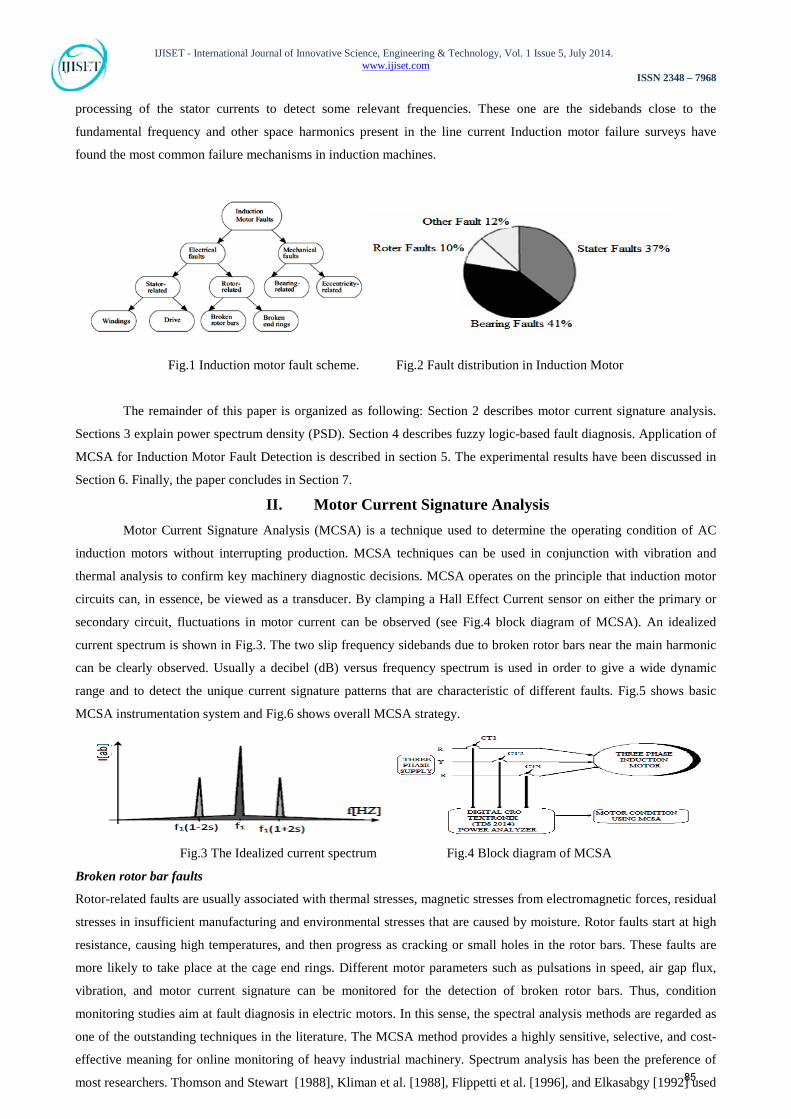
secondary circuit, fluctuations in motor current can be observed (see Fig.4 block diagram of MCSA). An idealized
current spectrum is shown in Fig.3. The two slip frequency sidebands due to broken rotor bars near the main harmonic
can be clearly observed. Usually a decibel (dB) versus frequency spectrum is used in order to give a wide dynamic
range and to detect the unique current signature patterns that are characteristic of different faults. Fig.5 shows basic
MCSA instrumentation system and Fig.6 shows overall MCSA strategy.
Fig.3 The Idealized current spectrum Fig.4 Block diagram of MCSA
Broken rotor bar faults
Rotor-related faults are usually associated with thermal stresses, magnetic stresses from electromagnetic forces, residual
stresses in insufficient manufacturing and environmental stresses that are caused by moisture. Rotor faults start at high
resistance, causing high temperatures, and then progress as cracking or small holes in the rotor bars. These faults are
more likely to take place at the cage end rings. Different motor parameters such as pulsations in speed, air gap flux,
vibration, and motor current signature can be monitored for the detection of broken rotor bars. Thus, condition
monitoring studies aim at fault diagnosis in electric motors. In this sense, the spectral analysis methods are regarded as
one of the outstanding techniques in the literature. The MCSA method provides a highly sensitive, selective, and cost-
effective meaning for online monitoring of heavy industrial machinery. Spectrum analysis has been the preference of
most researchers. Thomson and Stewart [1988], Kliman et al. [1988], Flippetti et al. [1996], and Elkasabgy [1992] used 85
IJISET - International Journal of Innovative Science, Engineering & Technology, Vol. 1 Issue 5, July 2014. www.ijiset.com
ISSN 2348 – 7968
the MCSA spectrum to detect broken bar faults. They demonstrated sideband components fb around the fundamental
frequency to detect broken bar faults. The lower sideband is specific to a broken bar, while the upper sideband is a
consequence of speed oscillation. f0 is the frequency of the supply phase current, s is the motor slip, and k = 0, 1, 2, . . .,
n.
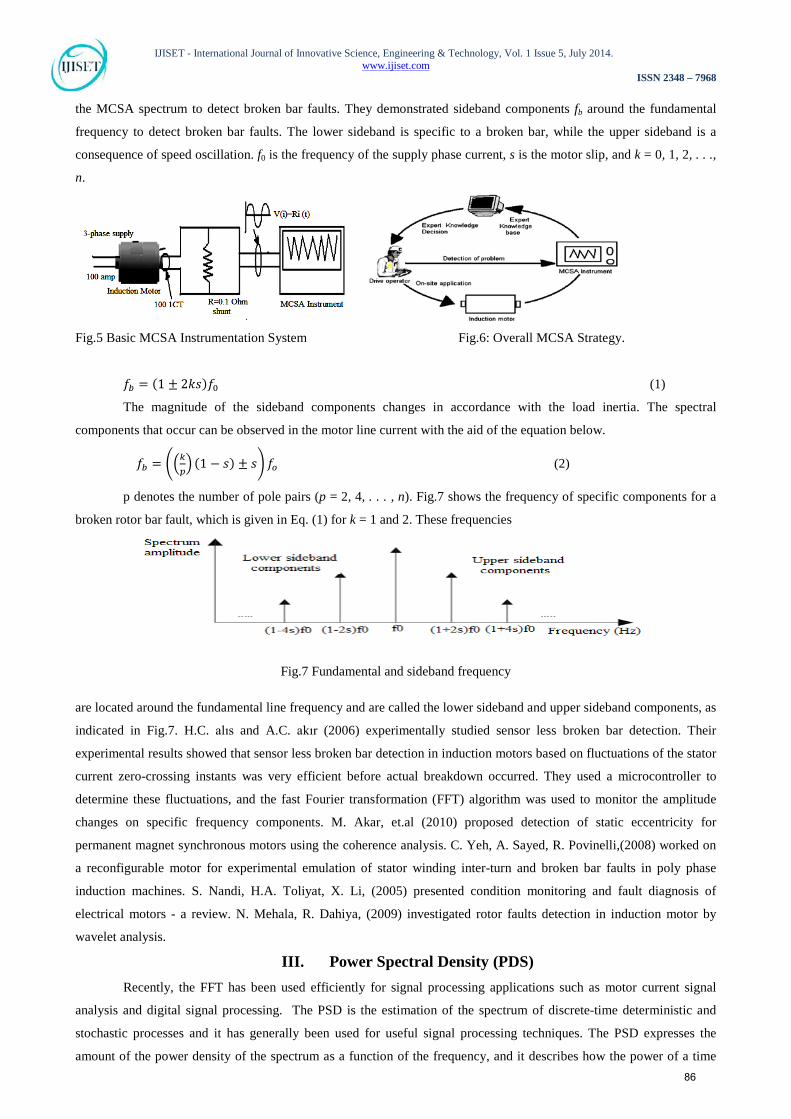
Fig.5 Basic MCSA Instrumentation System Fig.6: Overall MCSA Strategy.
𝑓𝑏 = (1 ± 2𝑘𝑠)𝑓0 (1)
The magnitude of the sideband components changes in accordance with the load inertia. The spectral
components that occur can be observed in the motor line current with the aid of the equation below.
𝑓𝑏 = ��𝑘𝑝� (1 − 𝑠) ± 𝑠� 𝑓𝑜 (2)
p denotes the number of pole pairs (p = 2, 4, . . . , n). Fig.7 shows the frequency of specific components for a
broken rotor bar fault, which is given in Eq. (1) for k = 1 and 2. These frequencies
Fig.7 Fundamental and sideband frequency
are located around the fundamental line frequency and are called the lower sideband and upper sideband components, as
indicated in Fig.7. H.C. alıs and A.C. akır (2006) experimentally studied sensor less broken bar detection. Their
experimental results showed that sensor less broken bar detection in induction motors based on fluctuations of the stator
current zero-crossing instants was very efficient before actual breakdown occurred. They used a microcontroller to
determine these fluctuations, and the fast Fourier transformation (FFT) algorithm was used to monitor the amplitude
changes on specific frequency components. M. Akar, et.al (2010) proposed detection of static eccentricity for
permanent magnet synchronous motors using the coherence analysis. C. Yeh, A. Sayed, R. Povinelli,(2008) worked on
a reconfigurable motor for experimental emulation of stator winding inter-turn and broken bar faults in poly phase
induction machines. S. Nandi, H.A. Toliyat, X. Li, (2005) presented condition monitoring and fault diagnosis of
electrical motors - a review. N. Mehala, R. Dahiya, (2009) investigated rotor faults detection in induction motor by
wavelet analysis.
III. Power Spectral Density (PDS) Recently, the FFT has been used efficiently for signal processing applications such as motor current signal
analysis and digital signal processing. The PSD is the estimation of the spectrum of discrete-time deterministic and
stochastic processes and it has generally been used for useful signal processing techniques. The PSD expresses the
amount of the power density of the spectrum as a function of the frequency, and it describes how the power of a time 86

IJISET - International Journal of Innovative Science, Engineering & Technology, Vol. 1 Issue 5, July 2014. www.ijiset.com
ISSN 2348 – 7968
series is distributed with frequency. With the help of the knowledge of the PSD and system bandwidth, the total power
can be calculated. The FFT can convert time-domain signals wsi(n) into the frequency domain:
𝑤𝑠𝑖(𝑓) = 1𝑀∑ 𝑤𝑠𝑖(𝑛)𝑀−1𝑛=0 𝑒−𝑗2𝜋𝑛
𝑓𝑚 (3)
f = 0, 1, 2, . . .N where f is discrete frequency, and the raw power spectral estimate can be calculated as:
𝑃𝑆𝐷𝑖(𝑓) = 1𝑀𝑤𝑠𝑖(𝑓)𝑥𝑤𝑠𝑖∗(𝑓)
Where * denotes the complex conjugate. Moreover, raw PSD estimates from all of the segments can be
averaged to give the following equation:
𝑃𝑆𝐷𝑖(𝑓) =1𝑘�𝑝𝑠𝐷𝑖(𝑓)𝑘−1
𝑖=0
IV. Fuzzy logic-based fault diagnosis In recent research, the condition monitoring and fault detection of electrical motors have moved to AI
techniques, including neural networks and fuzzy logic, from traditional methods, because no detailed analysis of the
fault mechanism is necessary and no modeling is required. Pereira and Silva studied the practical implementation of a
system for the detection and diagnosis of broken rotor bars in electrical induction motors. Goddu et al. (1998) analyzed
bearing vibration signals using fuzzy logic fault diagnosis methodology. Their study results showed that fuzzy logic can
be used for accurate bearing fault diagnosis if the input data are processed in an advantageous way. In this proposed
work interval type-2 fuzzy logic is proposed along with MCSA for fault diagnosis of induction motor, because it can
better deal with the uncertainty in the signals used for processing.
Type-2 Fuzzy Sets and Interval Type-2 FLS
A. Type-2 Fuzzy Sets
A type-2 fuzzy set, denoted by �̃� , is characterized by a type-2 MF 𝜇𝐴�(𝑥,𝑢) , where xϵ X and uϵ J x ⊆ [0,1] ,
and can be expressed as (T. Joachims 1999):
�̃� = ∫ ∫ 𝜇𝐴�𝑢𝜀𝐽𝑥(𝑥,𝑢)/(𝑥,𝑢)𝑥𝜀𝑋 , 𝐽𝑥 ⊆ [0,1] (4)
Where ∫ ∫ denotes union over all admissible x and u. Jx ⊆ [0,1] is called primary membership of x. The union of
all primary memberships is defined as the footprint of uncertainty (FOU), bounded by the maximum and minimum
type-1 MF called upper MF 𝜇𝐴�(𝑥) and lower MF 𝜇𝐴�(𝑥). When the uncertainties of MFs disappear, type-2 fuzzy sets
reduce to type-1 fuzzy sets whose MFs can be precisely determined. Corresponding to each primary membership, there
is a secondary membership that defines the possibilities of the primary membership. General type-2 FLS is
computationally intensive. However, when secondary MFs are interval fuzzy sets, the computation of type-2 FLS can
be simplified a lot. Therefore, in the paper, we only consider interval type-2 fuzzy sets and FLS. The secondary
memberships of interval type-2 fuzzy sets are either zero or one (𝑓𝑥(𝑢) = 1,∀ 𝑢 𝜀 𝐽𝑥 ⊆ [0,1]). They reflect a uniform
uncertainty at the primary memberships. A type-2 FLS, similar to a type-1 FLS, includes four components in general:
fuzzifier, fuzzy rule base, fuzzy inference engine, and output processor. One significant difference between type-1 and
type-2 FLS is that the output processor of type-2 FLS needs one additional step: type-reducer just before defuzzifier,
which is used to reduce type-2 output fuzzy sets to type-1 output fuzzy sets. After the type reduction, defuzzifier further
reduces type-1 output fuzzy sets into crisp values.
B. Fuzzy Inference of Interval Type-2 FLS
Fuzzy inference engine combines the fired fuzzy rules and maps crisp inputs into type-2 output fuzzy sets. In
our interval type-2 FLS, we use the meet operation under product t-norm, so the firing strength is an interval type-1 set: 87

IJISET - International Journal of Innovative Science, Engineering & Technology, Vol. 1 Issue 5, July 2014. www.ijiset.com
ISSN 2348 – 7968
𝑓𝑖(𝑥) = �𝑓𝑖(𝑥), 𝑓𝑖(𝑥)�
Where 𝑓𝑖(𝑥) and 𝑓𝑖(𝑥) can be written in (8b) and (8c), where * denotes the product operation:
𝑓𝑖(𝑥) = 𝜇𝐹�1𝑖(𝑥1) ∗ … … ∗ 𝜇𝐹�𝑝𝑖 �𝑥𝑝�
𝑓𝑖(𝑥) = 𝜇𝐹�1𝑖(𝑥1) ∗ … … ∗ 𝜇𝐹�𝑝𝑖 �𝑥𝑝�
C. Type Reduction of Interval Type-2 FLS
The outputs from the inference engine are type-2 fuzzy sets which must be reduced to type-1 fuzzy sets before
defuzzifier can be applied to generate crisp outputs. In this study, center-of-sets type reducer is used since it requires
reasonable computational complexity comparing with expensive centroid type reducer. Center-of-sets type reducer can
be divided into two phases. The first phase is to calculate the centroids of all type-2 consequence fuzzy sets. The second
phase is to calculate the reduced fuzzy sets.
● Computing the Centroids of Rule Consequences:
Suppose the output of an interval type-2 FLS is represented by interval type-2 fuzzy sets𝐺�𝑡, where t = 1, … T,
T is the number of output fuzzy sets. The centroid of ith output fuzzy set 𝑦𝑡 = [𝑦𝑙𝑡 ,𝑦𝑟𝑡] is a type-1 interval set with
leftmost point 𝑦𝑙𝑡 and rightmost point 𝑦𝑟𝑡 respectively. Karnik-Mendel iterative algorithm is used to compute the
rightmost point 𝑦𝑟𝑡 for each of T type-2 output fuzzy sets, where Z is the number of discretised points for each output
fuzzy set, 𝐽𝑦𝑧 = [𝐿𝑧 ,𝑅𝑧], ℎ𝑧 = (𝐿𝑧 + 𝑅𝑧)/2 and ∆𝑧= (𝑅𝑧 + 𝐿𝑧)/2 , z = 1…..Z. Fig.2 shows how to calculate hz , Lz ,
Rz and Δz needed by the algorithm. The leftmost point 𝑦𝑙𝑡 can be calculated in the similar way, set 𝜃𝑧 = (ℎ𝑧 + ∆𝑧) for z
≤ e and 𝜃𝑧 = (ℎ𝑧 − ∆𝑧)for z > e+1. It has been proved that this iterative procedure can converge in at most Z iterations
to find 𝑦𝑙𝑡or 𝑦𝑟𝑡.
●Computing Reduced Type-1 Fuzzy Sets:
To compute a type-reduced set, it is sufficient to compute its upper and lower bounds yl and yr, which can be
expressed as follows:
𝑦𝑙 = ∑ 𝑓𝑙𝑖𝑦𝑙𝑖𝑀
𝑖=1∑ 𝑓𝑙
𝑖𝑀𝑖=1
, 𝑦𝑟 = ∑ 𝑓𝑟𝑖𝑦𝑟𝑖𝑀𝑖=1∑ 𝑓𝑟𝑖𝑀𝑖=1
(5)
where 𝑓𝑙𝑖 and 𝑦𝑙𝑖 are the firing strength and the centroid of the output fuzzy set of ith rule (i = 1, …, M)
associated with yl; 𝑓𝑟𝑖 and 𝑦𝑟𝑖 are the firing strength and the centroid of the output fuzzy set of ith rule (i = 1, …, M)
associated with yr. To compute yr, we use the iterative procedure, yl can be computed in the similar way by setting
𝑓𝑟𝑖 = 𝑓𝑖for i ≤ R and 𝑓𝑟𝑖 = 𝑓𝑖for i > R. The iterative procedure is proved to converge in no more than M iterations to
compute yr and yl respectively.
Fig.8 Calculation of the parameters needed by each yz.
D. Defuzzification
The final output of type-2 FLS is set to the average of yr and yl:
(6)
V. Application of MCSA for Induction Motor Fault Detection A. Detection of broken rotor Bars
88

IJISET - International Journal of Innovative Science, Engineering & Technology, Vol. 1 Issue 5, July 2014. www.ijiset.com
ISSN 2348 – 7968
When a broken bar present or an eccentricity in the gap occurs, magnetic field is no longer constant between
rotor and stator, creating slight deviation from the fundamental field. Those deviations induce current in the rotor and
stator with a frequency slightly out of the fundamental frequency called sidebands. With broken rotor bars there is an
additional rotating magnetic field produced. Broken rotor bar produce a backward rotating magnetic field at slip speed
(-ve direction (Ns -Nr) = s × Ns) with respect to rotor as illustrated in Fig.9.
Fig.9 shows the Illustration of forward and backward rotating magnetic fields from rotor currents when a Broken Bar
exists.
Let Nb = backward rotating magnetic field speed produced by the rotor due to broken bars such that: Nb = Ns (
1 - 2 s ). The stationary stator winding now sees a rotating field at Nb = Ns (1 - 2 s) or expressed in terms of frequency fb
= f1 ( 1 - 2 s ). This means that a rotating magnetic field at that frequency cuts the stator windings and induce a current
at that frequency (fb). This in fact means that fb is a twice slip frequency component spaced 2sf1 down from f1. Thus
speed and torque oscillation occur at 2sf1 and this induces an upper sideband at 2sf1 above f1. Classical twice slip
frequency sidebands therefore occur at ± 2sf1 around the supply frequency fb = ( 1 ± 2s) f1 Hz. While lower side band is
specifically due to broken bar and upper side band is due to consequent speed oscillation. The speed oscillation can
reduced the magnitude of the f1(1-2s) sideband , but an upper sideband current component at f1(1+2s) is induced in the
stator winding due to the rotor oscillation. This upper sideband is also enhanced by the third harmonic flux. Broken
rotor bars therefore result in current components being induced in the stator winding at frequencies given by
fb = f1(1 ± 2s ) Hz (7)
In fact, several papers shows that broken bars actually give rise to a sequence of such sidebands given by
fb =(1± 2ks)f1, k = 1, 2,3… (8)
Therefore the appearance in the harmonic spectrum of the sidebands frequencies given by (7) clearly indicates
a rotor fault of the induction machine.
B. Detection of Air gap eccentricity
Air gap eccentricity problems can be detected by identifying the characteristic current signature pattern which
is indicative of abnormal levels of air gap eccentricity and to then trend that signature. The specific frequencies of the
current components indicative of air gap eccentricity may be calculated from:
fac = f1 {(R±nd) (1-s/p)±nws} (9)
Where fac= frequency components which are a function of air gap eccentricity, Hz, nd =±1, nws, = 1, 3,5, 7 .....
Etc. With nd = 0 in “(9”) gives the classical rotor slot passing frequency components - a series of components spaced at
twice the supply frequency, 2.f,, apart. The signature pattern of specific rotor slot passing frequencies and the two
components from “(9)” with nd = ±1 can be used to identify abnormal levels of air gap eccentricity.
C. Detection of Mechanical Influences
Changes in air gap eccentricity result in changes to the air gap flux waveform any mechanical disturbance to
the rotor of the induction motor can result in changes to the air gap flux waveform. Consequently this can induce stator
current components given by:
fe= f1±mfr (10)
Where fr = rotational speed frequency of the rotor, Hz, m = 1, 2, 3 ............. harmonic number, fe = current components
due to air gap disturbance, Hz 89
IJISET - International Journal of Innovative Science, Engineering & Technology, Vol. 1 Issue 5, July 2014. www.ijiset.com
ISSN 2348 – 7968
This means the effects of mechanical disturbances from, for example, slow speed gearboxes, fluid couplings,
belt drives, and recycling in compressors can induce current components. In addition, problems such as shaft / coupling
misalignment, bearing wear, roller element bearing defects and mechanical problems that result in dynamic rotor
disturbances can be potentially detected due to changes in the current spectrum.
D. Detection of Shorted Turns in Stator winding
The objective is to reliably identify current components in the stator winding that are only a function of shorted
turns and are not due to any other problem or mechanical drive characteristics. The diagnosis of shorted turns via CSA
is based on detecting the frequency components given by equation (11) in that these rotating flux waves can induced
corresponding current components in the stator windings.[28-30]
fst = f1{n/p(1-s)±k} (11)
Where, fst = components that are a function of shorted turns, f1= supply frequency, n =1,2,3.., p = pole pairs, s
= slip
E. Application
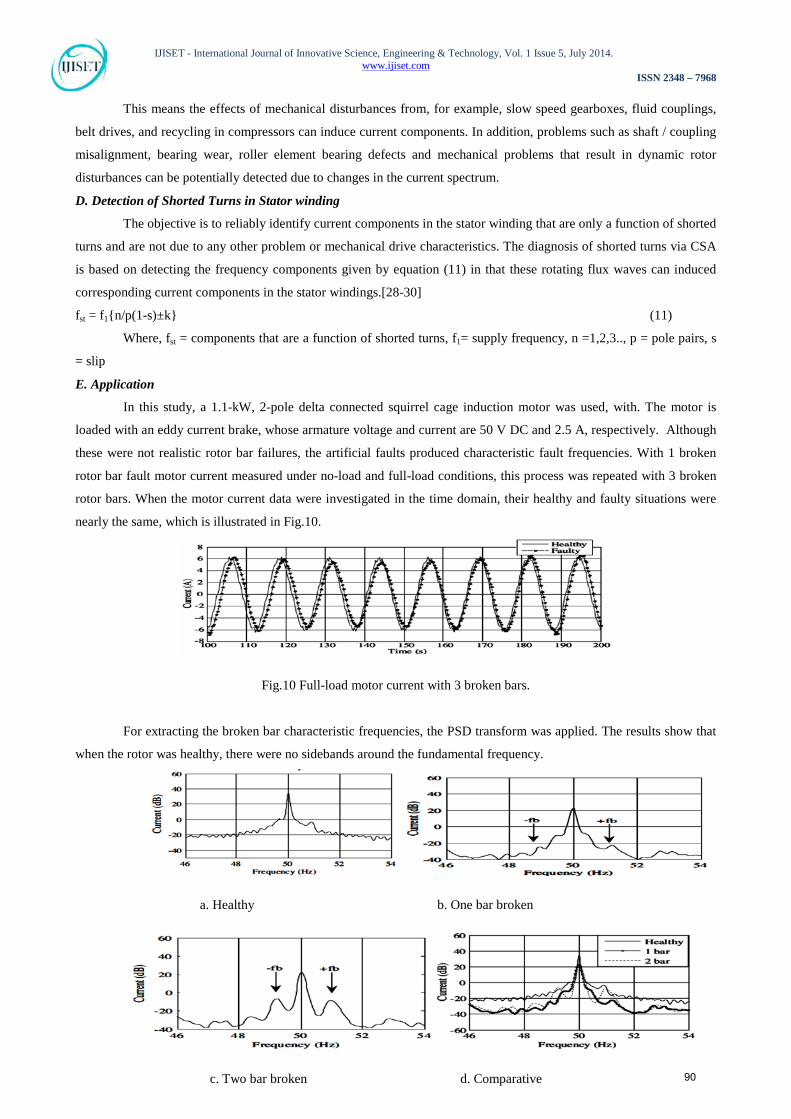
In this study, a 1.1-kW, 2-pole delta connected squirrel cage induction motor was used, with. The motor is
loaded with an eddy current brake, whose armature voltage and current are 50 V DC and 2.5 A, respectively. Although
these were not realistic rotor bar failures, the artificial faults produced characteristic fault frequencies. With 1 broken
rotor bar fault motor current measured under no-load and full-load conditions, this process was repeated with 3 broken
rotor bars. When the motor current data were investigated in the time domain, their healthy and faulty situations were
nearly the same, which is illustrated in Fig.10.
Fig.10 Full-load motor current with 3 broken bars.
For extracting the broken bar characteristic frequencies, the PSD transform was applied. The results show that
when the rotor was healthy, there were no sidebands around the fundamental frequency.
a. Healthy b. One bar broken
c. Two bar broken d. Comparative 90
IJISET - International Journal of Innovative Science, Engineering & Technology, Vol. 1 Issue 5, July 2014. www.ijiset.com
ISSN 2348 – 7968
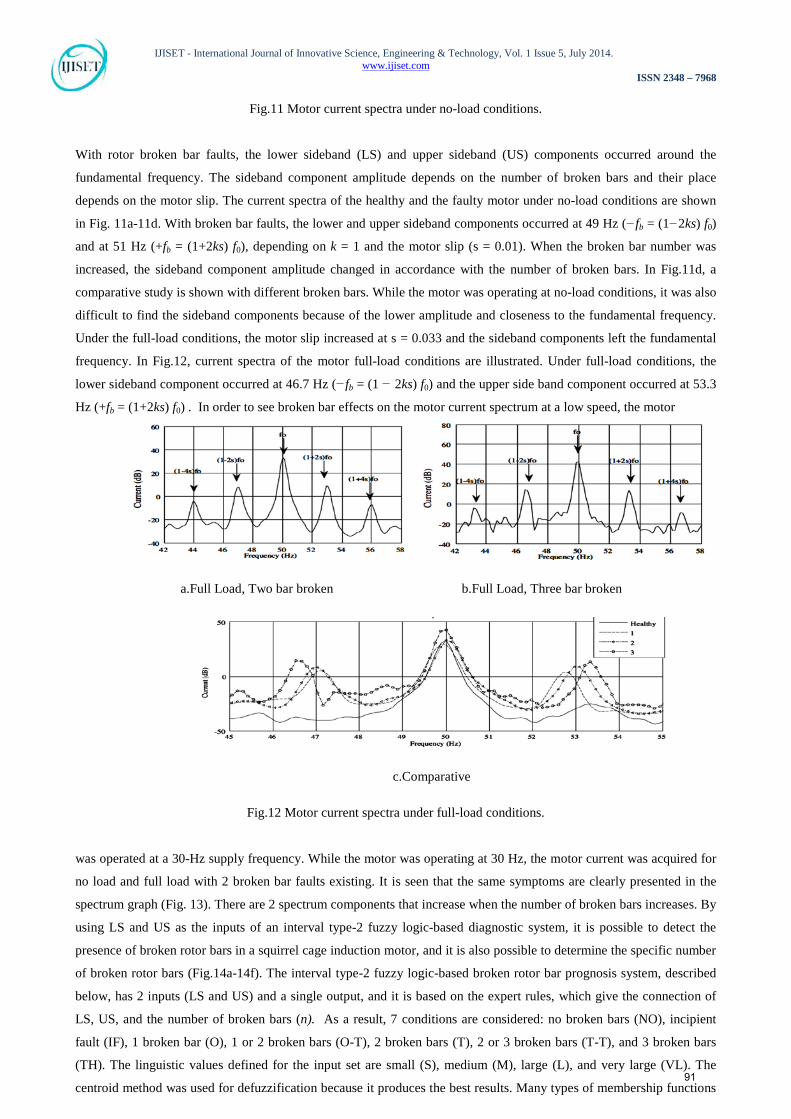
Fig.11 Motor current spectra under no-load conditions.
With rotor broken bar faults, the lower sideband (LS) and upper sideband (US) components occurred around the
fundamental frequency. The sideband component amplitude depends on the number of broken bars and their place
depends on the motor slip. The current spectra of the healthy and the faulty motor under no-load conditions are shown
in Fig. 11a-11d. With broken bar faults, the lower and upper sideband components occurred at 49 Hz (−fb = (1−2ks) f0)
and at 51 Hz (+fb = (1+2ks) f0), depending on k = 1 and the motor slip (s = 0.01). When the broken bar number was
increased, the sideband component amplitude changed in accordance with the number of broken bars. In Fig.11d, a
comparative study is shown with different broken bars. While the motor was operating at no-load conditions, it was also
difficult to find the sideband components because of the lower amplitude and closeness to the fundamental frequency.
Under the full-load conditions, the motor slip increased at s = 0.033 and the sideband components left the fundamental
frequency. In Fig.12, current spectra of the motor full-load conditions are illustrated. Under full-load conditions, the
lower sideband component occurred at 46.7 Hz (−fb = (1 − 2ks) f0) and the upper side band component occurred at 53.3
Hz (+fb = (1+2ks) f0) . In order to see broken bar effects on the motor current spectrum at a low speed, the motor
a.Full Load, Two bar broken b.Full Load, Three bar broken
c.Comparative
Fig.12 Motor current spectra under full-load conditions.
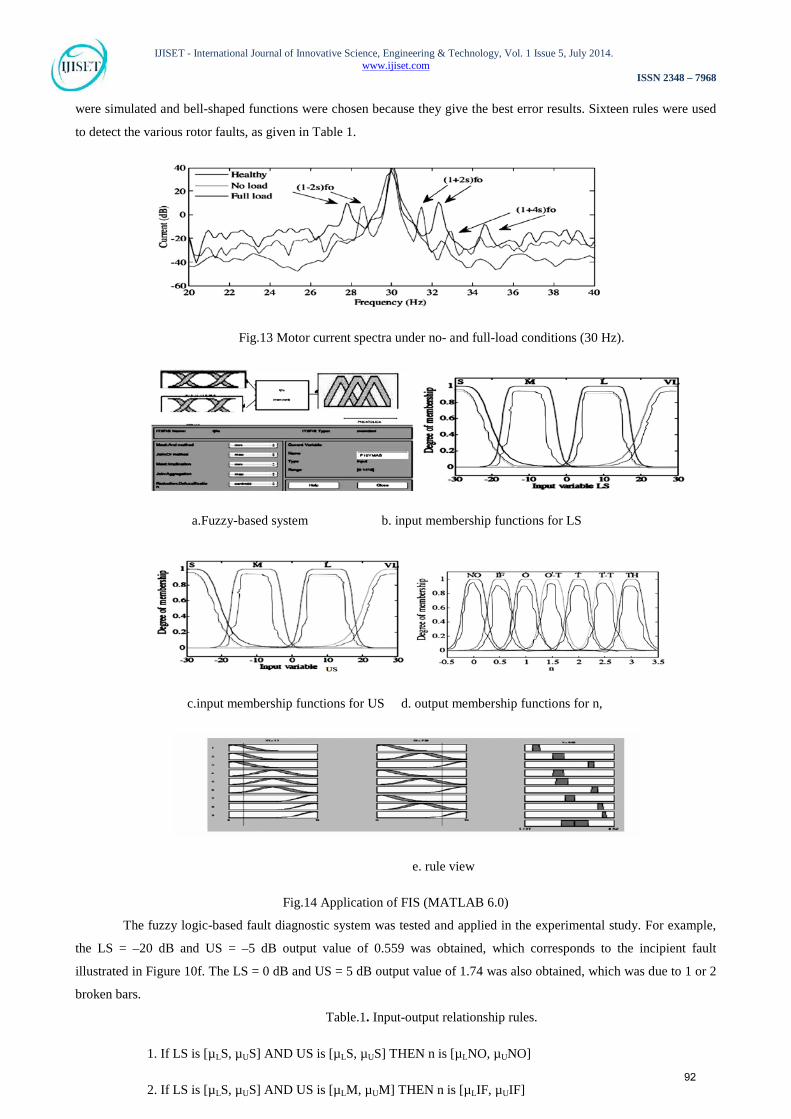
was operated at a 30-Hz supply frequency. While the motor was operating at 30 Hz, the motor current was acquired for
no load and full load with 2 broken bar faults existing. It is seen that the same symptoms are clearly presented in the
spectrum graph (Fig. 13). There are 2 spectrum components that increase when the number of broken bars increases. By
using LS and US as the inputs of an interval type-2 fuzzy logic-based diagnostic system, it is possible to detect the
presence of broken rotor bars in a squirrel cage induction motor, and it is also possible to determine the specific number
of broken rotor bars (Fig.14a-14f). The interval type-2 fuzzy logic-based broken rotor bar prognosis system, described
below, has 2 inputs (LS and US) and a single output, and it is based on the expert rules, which give the connection of
LS, US, and the number of broken bars (n). As a result, 7 conditions are considered: no broken bars (NO), incipient
fault (IF), 1 broken bar (O), 1 or 2 broken bars (O-T), 2 broken bars (T), 2 or 3 broken bars (T-T), and 3 broken bars
(TH). The linguistic values defined for the input set are small (S), medium (M), large (L), and very large (VL). The
centroid method was used for defuzzification because it produces the best results. Many types of membership functions 91
IJISET - International Journal of Innovative Science, Engineering & Technology, Vol. 1 Issue 5, July 2014. www.ijiset.com
ISSN 2348 – 7968
were simulated and bell-shaped functions were chosen because they give the best error results. Sixteen rules were used
to detect the various rotor faults, as given in Table 1.
Fig.13 Motor current spectra under no- and full-load conditions (30 Hz).
a.Fuzzy-based system b. input membership functions for LS
c.input membership functions for US d. output membership functions for n,
e. rule view
Fig.14 Application of FIS (MATLAB 6.0)
The fuzzy logic-based fault diagnostic system was tested and applied in the experimental study. For example,
the LS = –20 dB and US = –5 dB output value of 0.559 was obtained, which corresponds to the incipient fault
illustrated in Figure 10f. The LS = 0 dB and US = 5 dB output value of 1.74 was also obtained, which was due to 1 or 2
broken bars.
Table.1. Input-output relationship rules.
1. If LS is [µLS, µUS] AND US is [µLS, µUS] THEN n is [µLNO, µUNO]
2. If LS is [µLS, µUS] AND US is [µLM, µUM] THEN n is [µLIF, µUIF] 92
IJISET - International Journal of Innovative Science, Engineering & Technology, Vol. 1 Issue 5, July 2014. www.ijiset.com
ISSN 2348 – 7968
3. If LS is [µLS, µUS] AND US is [µLL, µUL] THEN n is [µLO, µUO]
4. If LS is [µLS, µUS] AND US is [µLVL, µUVL] THEN n is [µLNO, µUNO]
5. If LS is [µLM, µUM] AND US is [µLS, µUS] THEN n is [µLIF, µUIF]
6. If LS is [µLM, µUM] AND US is [µLM, µUM] THEN n is [µLO, µUO]
7. If LS is [µLM, µUM] AND US is [µLL, µUL] THEN n is [µLO-T, µUO-T]
8. If LS is [µLM, µUM] AND US is [µLVL, µUVL] THEN n is [µLO-T, µUO-T]
9. If LS is [µLL, µUL] AND US is [µLS, µUS] THEN n is [µLO, µUO]
10. If LS is [µLL, µUL] AND US is [µLM, µUM] THEN n is [µLO-T, µUO-T]
11. If LS is [µLL, µUL] AND US is [µLL, µUL] THEN n is [µLT, µUT]
12. If LS is [µLL, µUL] AND US is [µLVL, µUVL] THEN n is [µLT, µUT]
13. If LS is [µLVL, µUVL] AND US is [µLS, µUS] THEN n is [µLO-T, µUO-T]
14. If LS is [µLVL, µUVL] AND US is [µLM, µUM] THEN n is [µLT, µUT]
15. If LS is [µLVL, µUVL] AND US is [µLL, µUL] THEN n is [µLT-T, µUT-T]
16. If LS is [µLVL, µUVL] AND US is [µLVL, µUVL] THEN n is [µLTH, µUTH]
Here µL indicates lower membership function and µU indicates upper membership function.
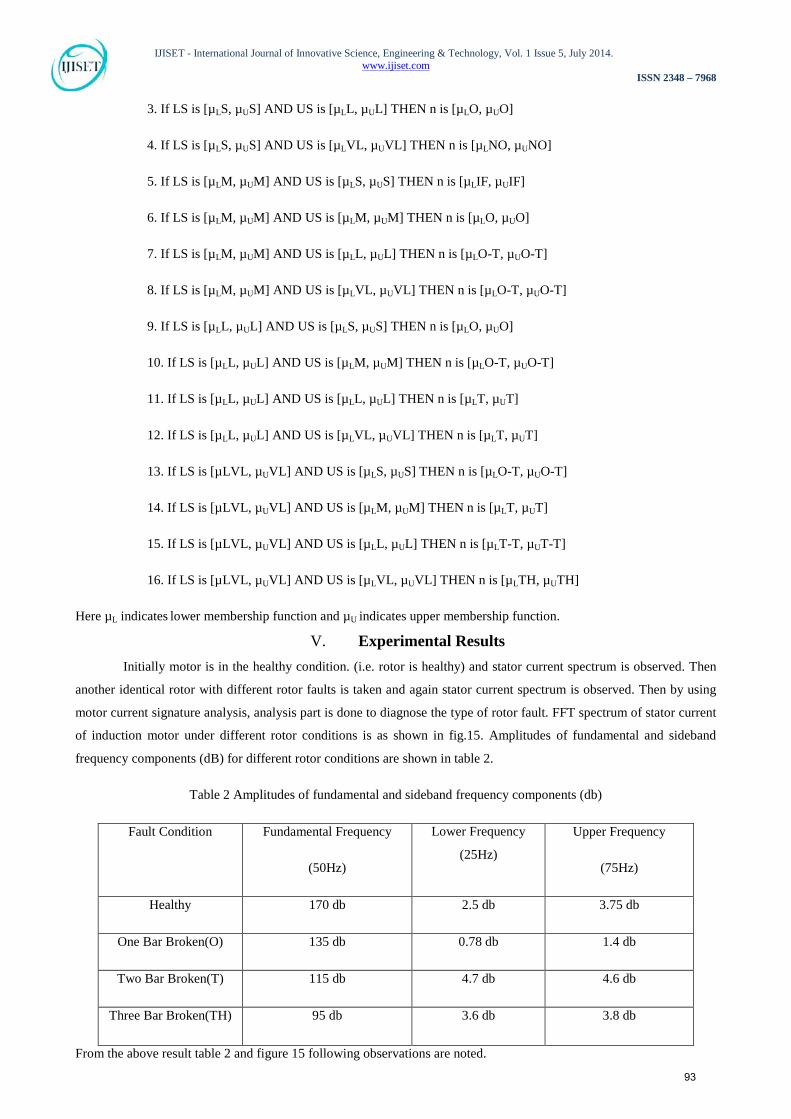
V. Experimental Results Initially motor is in the healthy condition. (i.e. rotor is healthy) and stator current spectrum is observed. Then
another identical rotor with different rotor faults is taken and again stator current spectrum is observed. Then by using
motor current signature analysis, analysis part is done to diagnose the type of rotor fault. FFT spectrum of stator current
of induction motor under different rotor conditions is as shown in fig.15. Amplitudes of fundamental and sideband
frequency components (dB) for different rotor conditions are shown in table 2.
Table 2 Amplitudes of fundamental and sideband frequency components (db)
Fault Condition Fundamental Frequency
(50Hz)
Lower Frequency
(25Hz)
Upper Frequency
(75Hz)
Healthy 170 db 2.5 db 3.75 db
One Bar Broken(O) 135 db 0.78 db 1.4 db
Two Bar Broken(T) 115 db 4.7 db 4.6 db
Three Bar Broken(TH) 95 db 3.6 db 3.8 db
From the above result table 2 and figure 15 following observations are noted.
93

IJISET - International Journal of Innovative Science, Engineering & Technology, Vol. 1 Issue 5, July 2014. www.ijiset.com
ISSN 2348 – 7968
1. If the difference of magnitudes of fundamental components and any one side band frequency component is above 150
dB-Motor is healthy.
2. If the difference of magnitudes of fundamental components and any one side band frequency component is above 130
dB to 150 dB-Motor is normal (One bar broken).
3. If the difference of magnitudes of fundamental components and any one side band frequency component is above 100
dB to 130 dB-Motor is less critical (Two bar broken).
4. If the difference of magnitudes of fundamental components and any one side band frequency component is below 90
dB -Motor is critically damaged (Three bar broken).
(a) FFT Spectrum of stator current healthy condition (b) FFT Spectrum of stator current under one bar broken
Fig.15 Signature Analysis
VI. Conclusions This study investigated the implementation of detecting broken rotor bar faults using interval type-2 fuzzy
logic based Motor Current Signature Analysis for Fault Diagnosis and Condition Monitoring of Induction Motors, and
the motor condition was established with the help of spectrum results. The amplitudes of the harmonic components
were used as inputs of the interval type-2 fuzzy logic-based diagnostic system. The experimental results clearly
illustrate that the interval type-2 fuzzy logic-based system is very effective and capable of detecting the correct number
of broken rotor bars. In the interval type-2 fuzzy logic-based system, it is necessary to know the membership functions,
and the optimum membership functions have been obtained with the help of trial and error. The sidebands that appear in
the FFT spectrum of the stator current allow identifying the fault easily. The advantage of using the Motor current
Signature Analysis plus interval type-2 fuzzy logic system method can detect these problems at an early stage and thus
avoid secondary damage and complete failure of the motor. Another advantage of this method is that it can be also
applied online. These results have clearly demonstrated that MCSA plus IT2FLS is a powerful technique for monitoring
the health of three phase induction motor rotor.
References 1. M. Akar, S. Ta,skın, S. S. eker and I. C. ankaya, (2010) “Detection of static eccentricity for permanent magnet synchronous motors using
the coherence analysis”, Turkish Journal of Electrical Engineering & Computer Sciences, Vol. 18, Issue 6, pp. 963-975.
2. C. Yeh, A. Sayed, R. Povinelli, (2007) “A reconfigurable motor for experimental emulation of stator winding inter-turn and broken bar
faults in poly phase induction machines”, Electric Machines & Drives Conference, 2007. IEMDC '07. IEEE International (Vol.2), pp.
1413 – 1419, 3-5 May 2007
(b) FFT Spectrum of stator current under two bar broken
(d) FFT Spectrum of stator current under three bar
broken
94

IJISET - International Journal of Innovative Science, Engineering & Technology, Vol. 1 Issue 5, July 2014. www.ijiset.com
ISSN 2348 – 7968
3. S. Nandi, H.A. Toliyat, X. Li, (2005) “Condition monitoring and fault diagnosis of electrical motors - a review”, IEEE Transactions on
Energy Conversion, Vol. 20, Issue 4, pp. 719-729.
4. H. C,alıs, A. C. akır, (2006) “Rotor bar fault diagnosis in three phase induction motors by monitoring fluctuations of motor current zero
crossing instants”, Electric Power System Research, Vol. 77, Issues 5–6, April 2007, Pages 385–392.
5. W.T. Thomson, I.D. Stewart, (1988) “Online current monitoring for fault diagnosis in inverter fed induction motors”, Third International
Conference on Power Electronics and Variable-Speed Drives, pp. 432-435, 13-15 Jul 1988, London.
6. G.B. Kliman, R.A. Koegl, J. Stein, R.D. Endicott, M.W. Madden, (1988) “Noninvasive detection of broken rotor bars in operating
induction motors”, IEEE Transactions on Energy Conversion, Vol. 3, Issue 4, pp. 873-879.
7. F. Filippetti, G. Franceschini, C. Tassoni, P. Vas, (1996) “AI techniques in induction machines diagnosis including the speed ripple
effect”, IEEE Industry Applications Society Annual Meeting Conference, Industry Applications Conference, 1996. Thirty-First IAS
Annual Meeting, IAS '96., Conference Record of the 1996 IEEE (Volume:1), pp. 655 – 662, 6-10 Oct 1996.
8. N.M. Elkasabgy, A.R. Eastham, G.E. Dawson, (1992) “Detection of broken bars in the cage rotor on an induction machine”, IEEE
Transactions on Industry Applications, Vol. 28, Issue 1, pp. 165-171.
9. M. Haji, H.A. Toliyat (2001) “Pattern recognition - a technique for induction machines rotor broken bar detection”, IEEE Transactions on
Energy Conversion, Vol. 16, Issue 4, pp. 312-317.
---------------------------
95