MOTIONS OF THE NIGHT SKY What will you learn in … OF THE NIGHT SKY What will you learn in this...
18
© 2015 Arizona State University Page 1 of 18 MOTIONS OF THE NIGHT SKY What will you learn in this Lab? You will learn how the Earth’s rotation and orbiting around the Sun combine to change our view of the night sky over time. You will also analyze movement of stars over a few hours to answer the seemingly obvious question – “How long does it take the Earth to make one complete 360 degree rotation?” What do I need to bring to the Class with me to do this Lab? For this lab you will need: • A copy of this lab script • A pencil • A calculator • Audubon Sky Guide • Red Flashlight Introduction: This lab looks at the motion of the night sky over time periods of a month and over a single day. The first part of tonight’s lab will probe the question of how long it takes for the Earth to make one complete rotation on its axis using star movements over a period of hours. The second part includes sketching using Starry Night and a sketch of the night sky for purpose of observing how the night sky changes over many weeks. The last section summarizes our various measurements to make a final assessment of the why and how Earth’s rotation and orbiting of the Sun affect the where and when we see specific stars in the night sky. Before we begin tonight’s lab, write down an answer to the following question: 1. How long do you think it takes for the Earth to make one complete rotation on its axis? In other words, what is the period of Earth’s rotation? ANSWER ________
Transcript of MOTIONS OF THE NIGHT SKY What will you learn in … OF THE NIGHT SKY What will you learn in this...

© 2015 Arizona State University Page 1 of 18
MOTIONS OF THE NIGHT SKY What will you learn in this Lab? You will learn how the Earth’s rotation and orbiting around the Sun combine to change our view of the night sky over time. You will also analyze movement of stars over a few hours to answer the seemingly obvious question – “How long does it take the Earth to make one complete 360 degree rotation?” What do I need to bring to the Class with me to do this Lab? For this lab you will need: • A copy of this lab script • A pencil • A calculator • Audubon Sky Guide • Red Flashlight Introduction: This lab looks at the motion of the night sky over time periods of a month and over a single day. The first part of tonight’s lab will probe the question of how long it takes for the Earth to make one complete rotation on its axis using star movements over a period of hours. The second part includes sketching using Starry Night and a sketch of the night sky for purpose of observing how the night sky changes over many weeks. The last section summarizes our various measurements to make a final assessment of the why and how Earth’s rotation and orbiting of the Sun affect the where and when we see specific stars in the night sky. Before we begin tonight’s lab, write down an answer to the following question:
1. How long do you think it takes for the Earth to make one complete rotation on its axis? In other words, what is the period of Earth’s rotation?
ANSWER ________
© 2015 Arizona State University Page 2 of 18
Calculating a Sidereal Day Sidereal time is time it takes the Earth to rotate once with respect to the 'fixed' stars in the sky. From the earth, a sidereal day is the time it takes the stars revolve around the Earth once. In this section of the lab you will use both your own observations made tonight and a long-exposure photograph to determine the length of a sidereal day. By analyzing how the position of the stars and constellations change as the Earth rotates, we can determine the length of a sidereal day. SECTION 1 – Observation of the Night Sky Go to the roof and, using the first template sketch the Northern circumpolar stars and constellations. Find Polaris and make sure your drawing is centered on that location. Be sure to also note the time the drawing was made. Note: About 2 hours after you did the first observation, you will go back to the roof and sketch the Northern circumpolar stars and constellations again, also noting the time the drawing was made. Until that second drawing is complete, move on to Section 2. Wait to do the analysis for this section until you have completed Section 2 and both observational measurements. Analysis Using your drawings of the Northern circumpolar stars and constellations, perform the same analysis you did for the photograph.
A. Place Observation 1 on top of Observation 2 and transfer the second set of bright star positions onto the first set of observations.
B. Choose three bright stars, preferably ones that are farther from the North Celestial Pole, and connect their locations between the first and second observations using short, straight lines. Choose star trails that do not run off the edges of the sketch!
C. Now draw a pair of straight lines from these starting and ending marks to Polaris.
D. Center your protractor on the North Pole, and measure the angular distance from the starting and end mark for each star trail. Take the average for your three stars:
1. ___________ 2. ___________ 3. ___________ AVERAGE: ____________

© 2015 Arizona State University Page 3 of 18
2. Determine the change in time between the first and second set of observations. Along with your average angular distance, calculate the time it takes for the Earth to rotate so the stars make one complete circuit through the sky. (Hint: When the Earth rotates once, how many degrees through the sky should the stars move?
3. Do your calculations from your observational measurements match the answer you
gave before lab began? Do they match your result from the photographic measurement in Section 2? If not, explain why you think they are different.

© 2015 Arizona State University Page 4 of 18
Northern sky sketch – Observation 1
Date: Time:
Instructor verification:
Polaris
North
© 2015 Arizona State University Page 5 of 18
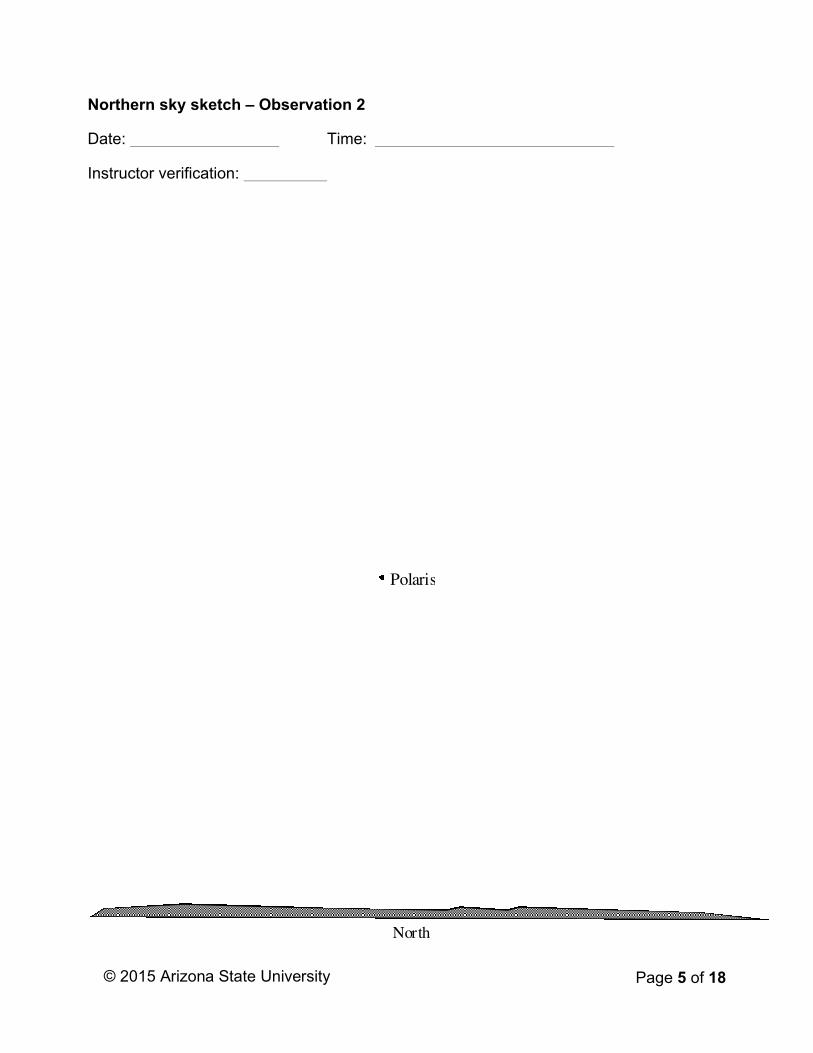
Northern sky sketch – Observation 2
Date: Time:
Instructor verification:
Polaris
North

© 2015 Arizona State University Page 6 of 18
SECTION 2 – Measuring the Sidereal Day Using a Photograph The photograph provided in Figure 1 (below) was taken by a camera mounted on a tripod with the shutter left open. The camera was pointed toward the North Celestial Pole, so the picture shows Polaris (α Ursa Minoris) and the surrounding stars. Because the earth turned during the exposure, all of the stars are seen as trails of starlight. Note: The total time elapsed from the beginning of the photograph until the end is 115 minutes. The interruption in the star trails represents a brief period when the shutter was accidentally closed. Analysis The Earth rotates once in one sidereal day. By measuring the time it takes to complete part of a rotation, you can calculate how long it would take to complete a full rotation.
A. Looking at the photograph, locate and mark the true North Celestial Pole.
B. Choose three bright star trails that do not run off the edges of the image. They do not have to be already labeled, but generally ones farther from the North Celestial Pole work better than ones closer in. Mark the starting and end points of your three star trails.
C. Now draw a pair of straight lines from these starting and ending marks to Polaris.
D. Center your protractor on the North, and measure the angular distance from the
starting and end mark for each star trail. Take the average for your three stars:
1. ___________ 2. ___________ 3. ___________ AVERAGE: ____________
Using the starting and ending times for the photograph, along with your average angular distance, calculate the time it takes for the Earth to rotate so the stars make one complete circuit through the sky.

© 2015 Arizona State University Page 7 of 18
4. Does your calculation in above match the answer you gave before starting the lab?
If not, explain why you think they are different.
5. It takes approximately 23 hours, 56 minutes and 4 seconds for the Earth to make one complete rotation so that a star is seen in the exact position from one night to the next. Astronomers call this a “sidereal day”. Compare your calculations with the given sidereal day, and calculate the percent difference.
% 𝑑𝑖𝑓𝑓𝑒𝑟𝑒𝑛𝑐𝑒 =|𝑦𝑜𝑢𝑟 𝑣𝑎𝑙𝑢𝑒 − 𝑘𝑛𝑜𝑤𝑛 𝑣𝑎𝑙𝑢𝑒|
𝑘𝑛𝑜𝑤𝑛 𝑣𝑎𝑙𝑢𝑒 ∗ 100%

© 2015 Arizona State University Page 8 of 18

© 2015 Arizona State University Page 9 of 18
Investigating Long-Term Stellar Movement In this section, you will use the Starry Night program to investigate how the stars move over a series of several weeks.
A. Initiate Starry Night. (“Appendix: Starry Night” may help you get started.)
B. In the Time Window, set the date to September 1st of this year, and set the time to 8:00pm. Use the "hand" tool to pan around until you are looking at the northern horizon (or click the "N" button). On the templates provided below, draw the three or four of the major constellations surrounding Polaris.
C. Pan around to the Southern horizon (or click the "S" button). Draw three or four of
the major constellations. Ideally, choose bright ones that your TA has pointed out to you during the course of the semester.
D. Now, change the settings on Starry Night to show today’s date at 8:00pm. Redo
your South and North sky drawings to reflect the new positions of the constellations. Label the visible constellations and bright stars, including any new constellations that were not originally visible on September 1st.
Analysis Compare your two sets of drawings and answer the following questions:
6. Are any of the constellations or bright stars that were visible in September that are no longer visible today? Which ones?
7. Are there any new bright constellations in the sky that were not visible in September that are visible today?
8. How does the motion of the stars in the northern sky differ from the motions of the stars in the southern sky? Why are they different?
9. Looking at your southern sky sketches, which direction have the constellations appeared to have moved?
© 2015 Arizona State University Page 10 of 18
10. Referring to your sketches and considering the dates they were made, explain why the motion you see between your different sketches cannot be caused by the rotation of the Earth on its axis every 24 hours.
It should be clear that things in the sky have moved; you made your sketches at the same time for both nights, but the constellations are in different locations in each sketch. But how fast is the motion? You can calculate the rate at which the sky appears to rotate with the use of your sketches of the northern sky.
A. First, find and label a reference star that appears in of your Northern sky sketches. Also, find and label Polaris.
B. On both sketches use a straight edge to draw a line straight up and down through
Polaris. What is this line called?
C. On both sketches draw another straight line from Polaris to the reference star. Use the protractor to measure the position angle (angle from north) between the two lines.
Position angle (Sept): _________ degrees Position angle (Today): _________ degrees Change in position angle: _________ degrees Days elapsed between: _________ days Make an estimate of the average rate of motion of the sky (in degrees per day) using the time elapsed between when the two sketches were made.
11. At this point in the lab, provide a brief explanation of what you think is happening to cause this shift in our view of the stars. (Drawing diagrams are often helpful.)

© 2015 Arizona State University Page 11 of 18
Northern sky sketch – Starry Night #1 (September)
Date: Time:
Instructor verification:
Polaris
North
© 2015 Arizona State University Page 12 of 18
Northern sky sketch – Starry Night #2 (Today)
Date: Time:
Instructor verification:
Polaris
North
© 2015 Arizona State University Page 13 of 18
Southern sky sketch – Starry Night #1 (September)
Date: Time:
Instructor verification:
South

© 2015 Arizona State University Page 14 of 18
Southern sky sketch – Starry Night #2 (Today)
Date: Time:
Instructor verification:
South

© 2015 Arizona State University Page 15 of 18
Summary Review Questions: 12. If you face north, in which direction (clockwise or counterclockwise) did the sky appear
to rotate over a few hours? What about over multiple weeks? 13. What causes the constellations to move during the night? What causes the
constellations to move over many nights? 14. Is Polaris directly at the North Celestial Pole? Explain how you can tell this from the
star trails photograph. 15. We use the solar day (24h 00m) as our standard of time on clocks and watches. The
length of the solar day differs from the sidereal day (23h 56m 4s) by three minutes and 56 seconds. Explain why the two are not equal and why the solar day is longer (a diagram may help in this explanation).
© 2015 Arizona State University Page 16 of 18
16. Calculate the number of sidereal days in a calendar year, and compare this value with the number of solar days in a calendar year.
17. Where will the stars you looked at tonight be found six months from now? Explain the
reasoning that led to your answer. Summarize what you have learned in tonight’s lab:
© 2015 Arizona State University Page 17 of 18
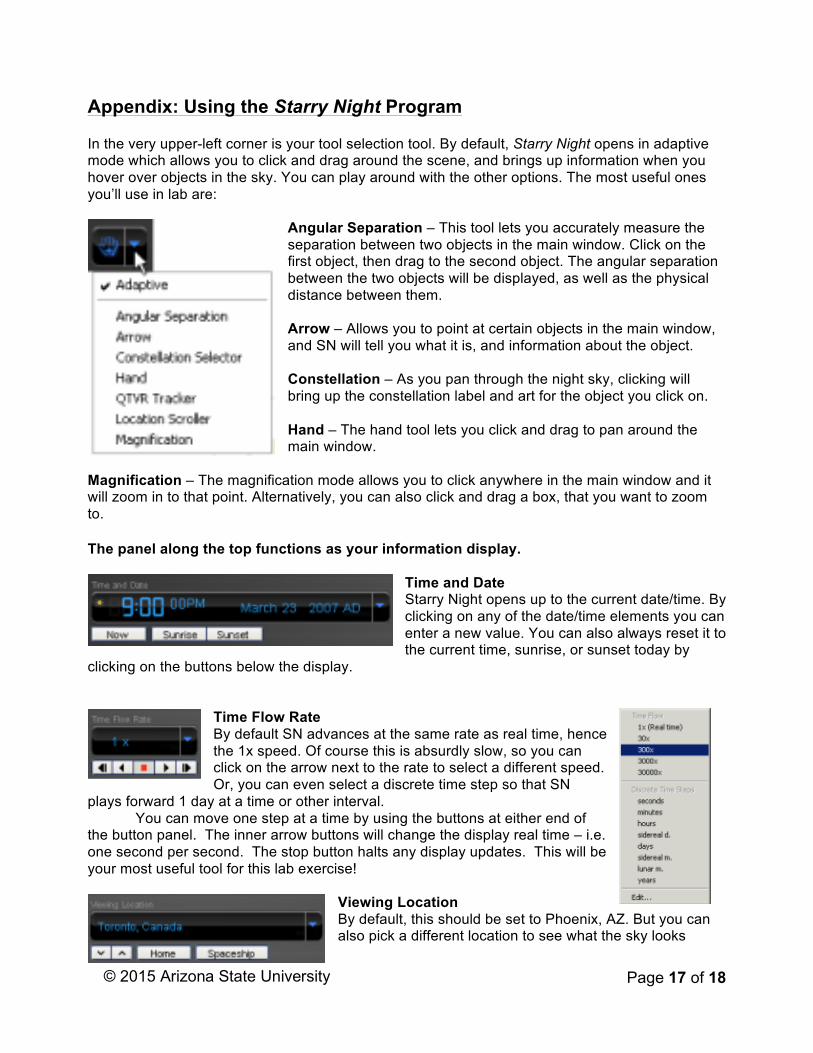
Appendix: Using the Starry Night Program In the very upper-left corner is your tool selection tool. By default, Starry Night opens in adaptive mode which allows you to click and drag around the scene, and brings up information when you hover over objects in the sky. You can play around with the other options. The most useful ones you’ll use in lab are:
Angular Separation – This tool lets you accurately measure the separation between two objects in the main window. Click on the first object, then drag to the second object. The angular separation between the two objects will be displayed, as well as the physical distance between them. Arrow – Allows you to point at certain objects in the main window, and SN will tell you what it is, and information about the object. Constellation – As you pan through the night sky, clicking will bring up the constellation label and art for the object you click on. Hand – The hand tool lets you click and drag to pan around the main window.
Magnification – The magnification mode allows you to click anywhere in the main window and it will zoom in to that point. Alternatively, you can also click and drag a box, that you want to zoom to. The panel along the top functions as your information display.
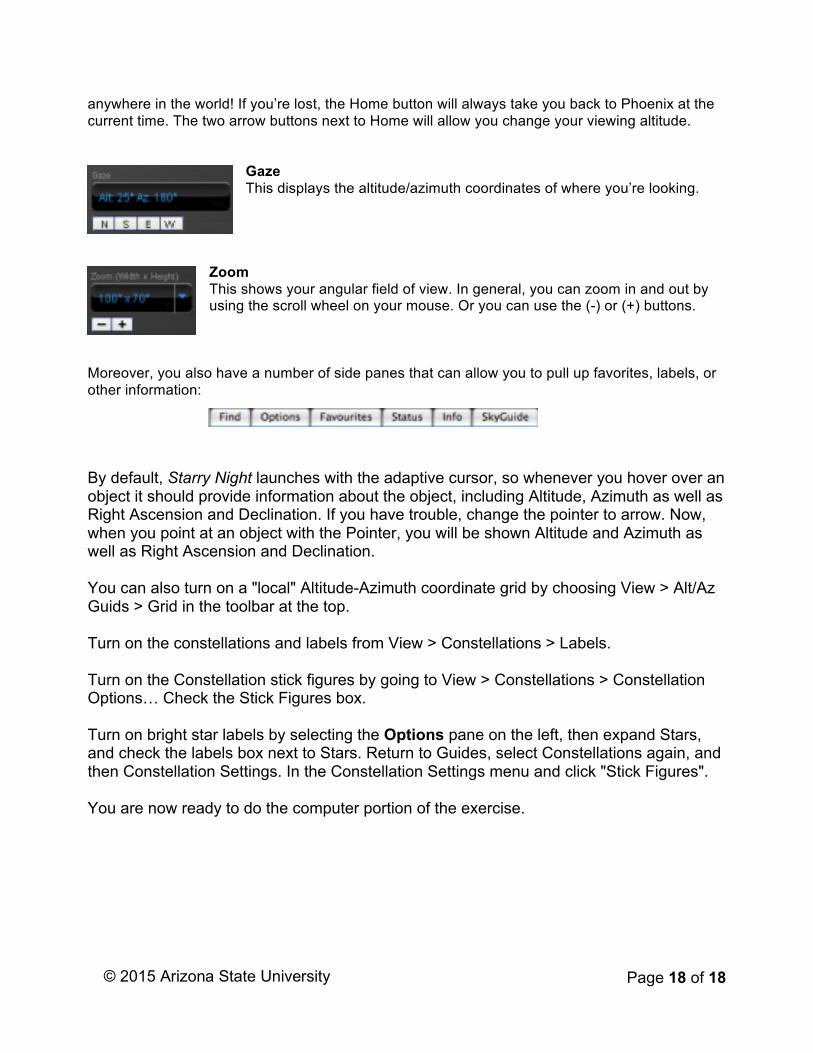
Time and Date Starry Night opens up to the current date/time. By clicking on any of the date/time elements you can enter a new value. You can also always reset it to the current time, sunrise, or sunset today by
clicking on the buttons below the display.
Time Flow Rate By default SN advances at the same rate as real time, hence the 1x speed. Of course this is absurdly slow, so you can click on the arrow next to the rate to select a different speed. Or, you can even select a discrete time step so that SN
plays forward 1 day at a time or other interval. You can move one step at a time by using the buttons at either end of
the button panel. The inner arrow buttons will change the display real time – i.e. one second per second. The stop button halts any display updates. This will be your most useful tool for this lab exercise!
Viewing Location By default, this should be set to Phoenix, AZ. But you can also pick a different location to see what the sky looks
© 2015 Arizona State University Page 18 of 18
anywhere in the world! If you’re lost, the Home button will always take you back to Phoenix at the current time. The two arrow buttons next to Home will allow you change your viewing altitude.
Gaze This displays the altitude/azimuth coordinates of where you’re looking.
Zoom This shows your angular field of view. In general, you can zoom in and out by using the scroll wheel on your mouse. Or you can use the (-) or (+) buttons.
Moreover, you also have a number of side panes that can allow you to pull up favorites, labels, or other information: By default, Starry Night launches with the adaptive cursor, so whenever you hover over an object it should provide information about the object, including Altitude, Azimuth as well as Right Ascension and Declination. If you have trouble, change the pointer to arrow. Now, when you point at an object with the Pointer, you will be shown Altitude and Azimuth as well as Right Ascension and Declination. You can also turn on a "local" Altitude-Azimuth coordinate grid by choosing View > Alt/Az Guids > Grid in the toolbar at the top. Turn on the constellations and labels from View > Constellations > Labels. Turn on the Constellation stick figures by going to View > Constellations > Constellation Options… Check the Stick Figures box. Turn on bright star labels by selecting the Options pane on the left, then expand Stars, and check the labels box next to Stars. Return to Guides, select Constellations again, and then Constellation Settings. In the Constellation Settings menu and click "Stick Figures". You are now ready to do the computer portion of the exercise.