Most Livable States ppt
43
MOST LIVABLE STATES IN THE U.S. By Vic Setlur Supervisor: Mr. Borne
-
Upload
vikram-setlur -
Category
Data & Analytics
-
view
126 -
download
0
Transcript of Most Livable States ppt

MOST LIVABLE STATES
IN THE U.S.By Vic Setlur
Supervisor: Mr. Borne

Methodology
• I ranked the 50 states using 10 variables
• Minimized bias by using the 2010 census and reputable
websites• Ranked states by either percentage or per 1000 population
• However the report is still subject to bias due to the selection of the
variables

Variables
• Life Expectancy
• Health Care
• Medicaid
• Divorces
• Motor Vehicle accidents
• Educational Attainment
• Crime Rates
• Unemployment
• Annual Wage
• Poverty Rate

Top Ten – Best of the best

#1 – Massachusetts- Average: 44.1
- First in Annual Wage, educational
attainment, and motor vehicle
accident rate
- Lowest ranked variable is
unemployment rate at 34 (going
from 1=worst,50=best)

#2 – Connecticut- Average: 41.6
- Top ten in every single category other
than unemployment, where they rank 14

#3 – New Hampshire- Average: 40.2
- Lowest rank: Number of divorces
per 1000 at 6th worst
- Highest rank: Poverty rate at 50

#4 – Vermont- Average rank: 39.9
- Highest rank is unemployment,
poverty rate, and health care
all at 48
- Lowest rank is divorces at 24

#5 – Minnesota- Minnesota didn’t have
any rankings that were
below average
- Their lowest rank is
Medicaid at 25
- 2nd highest life
expectancy
- Average rank of 38.8

#6 – New York- Average: 38.1
- Lowest rank: Poverty rate at
13
- Highest rank: Annual Wage,
Life Expectancy, and Motor
vehicle accidents all at 48
- Third highest annual wage
and life expectancy in the
U.S

#7 - Hawaii- Hawaii averaged 36.3
- They ranked above average for
everything except crime rate
(does not include violent crime)
- Unsurprisingly ranked first in
life expectancy at 81.5 years
and also had the best ranked
Medicare

#8 – New Jersey- New Jersey ranked below average
in only two categories,
unemployment at 7 and Medicaid at
14
- Average of 36.1
- 2nd lowest poverty rate

#9 – Maryland- Average 35.5
- Lowest rank is life expectancy
at 19
- 2nd highest ranked in
educational attainment

#10 – Rhode Island- Rhode Island averaged 32.9
- Lowest rank is unemployment rate at 6
- Highest rank is motor vehicle accident rate at 49

#1-10 analysis

#11-20, Above Average

#11-20, Above Average
• Colorado
• Washington
• Pennsylvania
• North Dakota
• Virginia
• California
• Wisconsin
• South Dakota
• Nebraska
• Utah

#11-20 analysis

#21-30, Roughly Average

#21-30
• 21 – Iowa
• 22 – Delaware
• 23 – Maine
• 24 – Michigan
• 25 – Alaska
• 26 – Illinois
• 27 – Oregon
• 28 – Idaho
• 29 – Montana
• 30 – Kansas

#21-30 analysis

#31-40, Below Average
• 31 – Ohio
• 32 – Arizona
• 33 – Wyoming
• 34 – Florida
• 35 – Missouri
• 36 – Georgia
• 37 – New Mexico
• 38 – Texas
• 39 – Nevada
• 40 – South Carolina

Map

#41-50 The Worst of the Worst

#41 – Indiana

#42 – North Carolina

#43 – Kentucky

#44 – West Virginia

#45 – Oklahoma

#46 – Louisiana
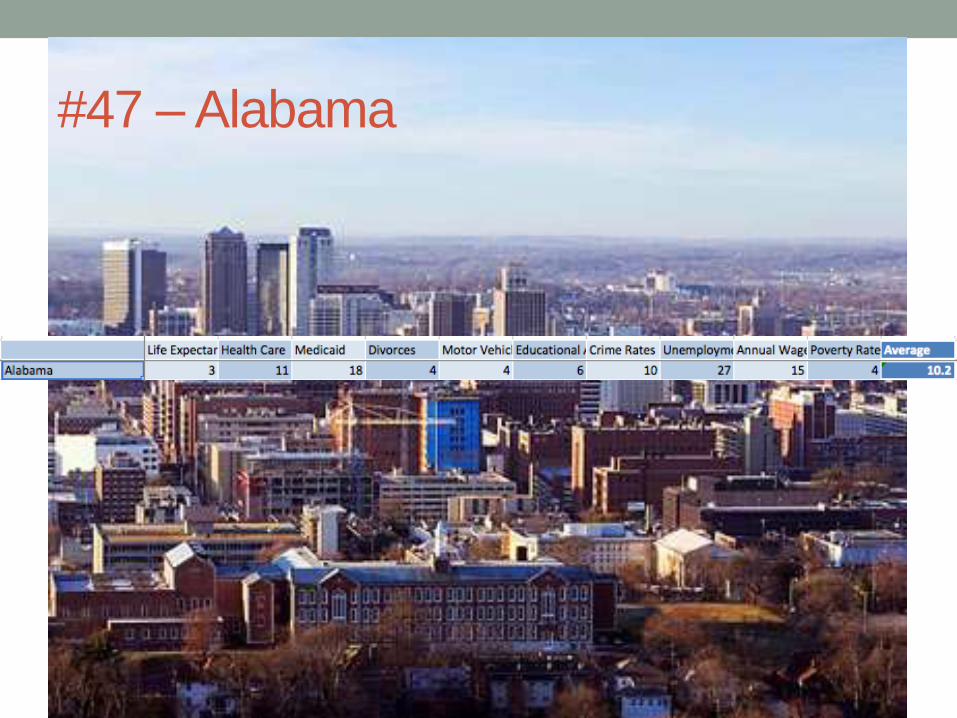
#47 – Alabama

#48 – Tennessee

#49 – Arkansas

#50 – Mississippi

Excel Chart – Sorted Worst to BestGoing from 1=Worst to 50=Best
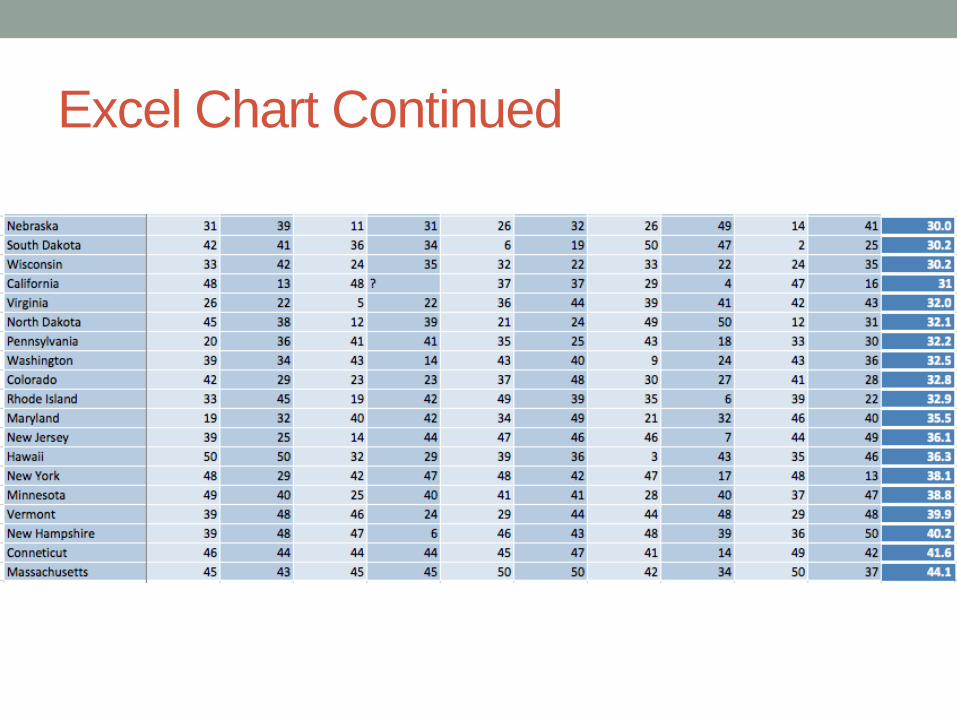
Excel Chart Continued

Final Map

Heat MapRank 1-10 is colored in red, 11-20 is orange, 21 -30 is yellow, 31-40 is light blue, 41-50 is
dark blue

Analysis
• Gap between rich and poor evident
• Variables show that the top ranked states are in the North-
East
• 8 of the 10 states in the top 10 are in the North-East
• Worst ranked states highly concentrated in the South-East

Test on Virginia
• The test on Virginia: Because Virginia is vastly different in
the top 1/3 and the bottom 2/3, (top 1/3 is more like north
east, bottom 2/3 is more like south east) I did a test with
picking two cities in the north, two in the south, and picked
a few variables to rank and compare them to see if it is
similar to the trend I was seeing with the northeast being
very livable and the southeast not so livable.

Test on Virginia Continued
Fairfax City Alexandria Roanoke Norfolk
Percent aged
25+ who
achieved B.A.
52.7% 60.1% 22.4% 24.7%
Median
Household
Income
$99,300 $82,899 $37,753 $43,914
Percent living
below poverty
level
5.9% 7.8% 20.8% 17.1%


The End!