MORTGAGEMONITOR · MORTGAGEMONITOR MARCH 2018 Con dential, Proprietary and/or Trade Secret TM SM ®...
25
MARCH 2018 REPORT MONITOR MORTGAGE
Transcript of MORTGAGEMONITOR · MORTGAGEMONITOR MARCH 2018 Con dential, Proprietary and/or Trade Secret TM SM ®...
MARCH 2018 REPORT
MONITORMORTGAGE
MARCH 2018MONITORMORTGAGE
Confidential, Proprietary and/or Trade SecretTM SM ® Trademark(s) of Black Knight IP Holding Company, LLC, and/or an affiliate.
© 2018 Black Knight Financial Technology Solutions, LLC. All Rights Reserved.
CONTENTS
1 | MARCH FIRST LOOK RELEASE
2 | MARCH PERFORMANCE HIGHLIGHTS
3 | EARLY-2018 HOME PRICE METRICS
4 | REFINANCEABLE POPULATION UPDATE
5 | APPENDIX
6 | DISCLOSURES

MARCH 2018MONITORMORTGAGE
Confidential, Proprietary and/or Trade SecretTM SM ® Trademark(s) of Black Knight IP Holding Company, LLC, and/or an affiliate.
© 2018 Black Knight Financial Technology Solutions, LLC. All Rights Reserved.
MARCH 2018 OVERVIEW
Each month, the Black Knight Mortgage Monitor looks at a variety of issues related to the mortgage and financial services industry.
This month, as always, we begin with a review of some of the high-level mortgage performance statistics reported in the company’s most recent First Look report, with an update on delinquency, foreclosure and prepayment trends. We then segue into a breakdown of the significant decline in delinquency rates seen in March, while providing additional details as to how the “hurricane effect” is impacting foreclosure starts. In addition, we look at the current state of delinquencies in hurricane-affected areas
From there, we turn to early-2018 home price metrics, using the most recent data available from the Black Knight Home Price Index to provide insights on home price appreciation (HPA) levels, with a closer look at surging prices in the Bay Area and Las Vegas. Finally, given that 30-year fixed mortgage rates hit 4.58% in the last week of April, we take a look at how that has impacted the declining population of refinance candidates, while providing a road map to locating those few who remain.
In producing the Mortgage Monitor, the Data & Analytics division of Black Knight aggregates, analyzes and reports upon the most recently available mortgage performance data from the company’s McDash loan-level database. For more information on McDash or Black Knight Data & Analytics in general, please call 844-474-2537 or email [email protected].
Stay connected with Black Knight Data & Analytics

MARCH 2018MONITORMORTGAGE
Confidential, Proprietary and/or Trade SecretTM SM ® Trademark(s) of Black Knight IP Holding Company, LLC, and/or an affiliate.
© 2018 Black Knight Financial Technology Solutions, LLC. All Rights Reserved.
MARCH FIRST LOOK RELEASE
Here we have an overview of findings from Black Knight’s ‘First Look’ at March mortgage performance data. This information has been compiled from Black Knight’s McDash loan-level mortgage performance database. You may click on each chart to see its contents in high-resolution.
» While a 13.2% decline in the national delinquency rate may seem drastic, large declines in March are relatively common
» March is typically the calendar-year low for delinquencies as borrowers utilize tax refunds and/or bonus payouts to get back on track financially
» The inventory of loans in active foreclosure fell to its lowest level since September 2006, but still remains slightly above long-term norms
» Despite interest rates remaining above 4.4% throughout the month, prepayment activity increased by 22% over February
» As prepayment activity has become more housing-turnover-driven and February is typically the seasonal low for home sales, increased levels of housing turnover are likely at least a partial driver behind the March increase
» Overall, the number of past-due mortgages declined by nearly 300K in March, leaving 2.23M remaining as of month's end
» Foreclosure starts increased by nearly 12% month-over-month
» While starts were also up in non-hurricane-affected areas, FEMA-declared disaster counties in Texas and Florida accounted for 70% of the monthly rise in foreclosure starts
Mar-18Month-over-month
changeYear-over-year
change
3.73% -13.24% 3.09%
0.63% -3.21% -29.29%
52,100 11.56% -13.60%
0.88% 22.04% -9.08%
1.70% 21.25% -25.79%
1,912,000 -286,000 81,000
632,000 -65,000 43,000
321,000 -10,000 -127,000
2,232,000 -296,000 -47,000
Total U.S. foreclosure pre-sale inventory rate:
12 Month Trend
Total U.S. loan delinquency rate (loans 30 or more days past due, but not in foreclosure):
Total U.S. foreclosure starts:
Monthly Prepayment Rate (SMM):
Foreclosure Sales as % of 90+:
Number of properties that are 30 or more days past due, but not in foreclosure:
Number of properties that are 90 or more days past due, but not in foreclosure:
Number of properties in foreclosure pre-sale inventory:
Number of properties that are 30 or more days past due or in foreclosure:
© 2018 - Black Knight Financial Services, Inc.: Unauthorized use is strictly prohibited. Based on data believed to be reliable, not guaranteed as to accuracy or completeness. Page 1 of 1

MARCH 2018MONITORMORTGAGE
Confidential, Proprietary and/or Trade SecretTM SM ® Trademark(s) of Black Knight IP Holding Company, LLC, and/or an affiliate.
© 2018 Black Knight Financial Technology Solutions, LLC. All Rights Reserved.
» As mentioned, March's 13.2% decline in delinquencies was certainly eye-catching – and the second largest since the housing recovery began – but not as unexpected as one might think
» In fact, the average March decline in the national delinquency rate since the turn of the century is just under 11%
» Approximately 569K borrowers paid themselves current from some stage of delinquency or active foreclosure, a 12-month high (since last March)
» Of those, some 52K brought themselves current from 90 days delinquent or more (but not yet in active foreclosure), the highest such cure volume in more than three years
Mar-10-10.1% Mar-11
-11.7%
Sept-12+8.2%
Jun-13+9.4%
Mar-14-7.6%
Nov-14+11.2%
Mar-15-12.0%
Jan-16+6.6%
Feb-16-12.6% Mar-17
-14.1%
Apr-17+12.9% Sept-17
+11.8%
Mar-18-13.2%
-20%
-15%
-10%
-5%
0%
5%
10%
15%
20%
2010
-03
2010
-05
2010
-07
2010
-09
2010
-11
2011
-01
2011
-03
2011
-05
2011
-07
2011
-09
2011
-11
2012
-01
2012
-03
2012
-05
2012
-07
2012
-09
2012
-11
2013
-01
2013
-03
2013
-05
2013
-07
2013
-09
2013
-11
2014
-01
2014
-03
2014
-05
2014
-07
2014
-09
2014
-11
2015
-01
2015
-03
2015
-05
2015
-07
2015
-09
2015
-11
2016
-01
2016
-03
2016
-05
2016
-07
2016
-09
2016
-11
2017
-01
2017
-03
2017
-05
2017
-07
2017
-09
2017
-11
2018
-01
2018
-03
1-Month Change in National Delinquency Rate
© 2018 - Black Knight Financial Services, Inc.: Unauthorized use is strictly prohibited. Based on data believed to be reliable, not guaranteed as to accuracy or completeness.Page 1 of 1
Here, we break down the significant decline in delinquency rates seen in March, while providing additional details as to the “hurricane effect” on foreclosure starts and updates on delinquencies in hurricane-affected areas. This information has been compiled from Black Knight’s McDash loan-level mortgage performance database. You may click on each chart to see its contents in high-resolution.
MARCH PERFORMANCE HIGHLIGHTS

MARCH 2018MONITORMORTGAGE
Confidential, Proprietary and/or Trade SecretTM SM ® Trademark(s) of Black Knight IP Holding Company, LLC, and/or an affiliate.
© 2018 Black Knight Financial Technology Solutions, LLC. All Rights Reserved.
» For the most part, what we’re observing in March of 2018 this year is common
» FHA loans tend to see the most seasonal fluctuation in terms of delinquencies and, likewise, the highest rates of improvement in March
» Historically, GSEs also tend to see strong March declines, as was the case this year as well
» Much lower improvement rates are typically seen among Portfolio and Private Label Security (PLS) mortgages, which is what we’re seeing this year as well
» From a geographical perspective, coastal areas (both west and east) tend to see fewer seasonal effects on delinquencies than the central U.S.
» Therefore, it’s not surprising to see moderate-to-high levels of declines in the central U.S. with lighter declines overall along the northeast coast and in California and Nevada
-17% -17%
-10%
-8%
-13%
GSE FHA/VA PORTFOLIO PRIVATE Grand Total
1-Month Change in Delinquency Rate by Investor
1-Month Change in Deliquency Rate by State
-16% -11%
MARCH PERFORMANCE HIGHLIGHTS

MARCH 2018MONITORMORTGAGE
Confidential, Proprietary and/or Trade SecretTM SM ® Trademark(s) of Black Knight IP Holding Company, LLC, and/or an affiliate.
© 2018 Black Knight Financial Technology Solutions, LLC. All Rights Reserved.
» Here, we look at March's delinquency declines on a state-by-state level
» Utah, Arizona and Oregon stand out as having slightly higher declines than might be expected from a seasonal perspective
» Conversely, declines in Oklahoma, Missouri, Indiana, Ohio, Mississippi, Tennessee and Alabama are a little lighter than might be expected
» Given the high rates of delinquency in Mississippi and Alabama, this could be a sign of continued struggle in those areas
» Florida saw unusually high – but most likely hurricane-driven – improvement
» Delinquency rate improvements of at least 10% were observed in every state in the union
» For more in depth information on the typical seasonal behavior of mortgage delinquencies, please see our January 2017 Mortgage Monitor report
MARCH PERFORMANCE HIGHLIGHTS
-16%-15%-14%-13%-12%-11%-10%
MOHI
TNRI
OKMSOHIN
MDALNHNJPAWINYMTID
MAMECAVACTARKSNVND
OverallNCWVDEKYNEWYSDTXGACODCSCWANM
ILUTMNORLAIAFLAZMIVI
AKVT
1-Month Change in Delinquency Rate by State (March 2018)

MARCH 2018MONITORMORTGAGE
Confidential, Proprietary and/or Trade SecretTM SM ® Trademark(s) of Black Knight IP Holding Company, LLC, and/or an affiliate.
© 2018 Black Knight Financial Technology Solutions, LLC. All Rights Reserved.
» Prior to the 2017 hurricanes, Texas and Florida accounted for approximately 15% of all default activity for the last 5+ years
» The post-hurricane surge in defaults drove that share as high as 50% in November 2017; it has since subsided to roughly one in five defaults coming from the two states
» Default activity (which includes borrowers temporarily missing payments associated with forbearance plans) spiked from 51K in Q3 2017 to 184K in Q4
» Default activity remained elevated in January and February as well, with 65K defaults in Q1 2018 as a whole
» As of March, default volumes for Texas and Florida declined to 14,4K, only ~1K above the long-term (2000-2005) March average for the two states
» Nationally, Q1 2017 saw 282K defaults, just slightly below the 2000-2005 benchmark average (286K)
» In non-hurricane-affected areas, default volumes haven now fallen below these long-term benchmarks in each of the past 10 months
» This improvement is largely due to favorable macroeconomic trends, improved performance from seasoned mortgages and the overarching pristine quality of post-recession vintages
» Overall default activity for the 12 months ending March 2018 increased by 10% year-over year, driven by a 90% increase in default activity in Texas and Florida
» However, in non-hurricane affected states defaults were down by 5% year-over-year for the lowest 12-month total since 2004/2005
MARCH PERFORMANCE HIGHLIGHTS
0K
10K
20K
30K
40K
50K
60K
70K
80K
90K
2013
-03
2013
-06
2013
-09
2013
-12
2014
-03
2014
-06
2014
-09
2014
-12
2015
-03
2015
-06
2015
-09
2015
-12
2016
-03
2016
-06
2016
-09
2016
-12
2017
-03
2017
-06
2017
-09
2017
-12
2018
-03
90-Day Default Activity(Texas & Florida)
90-Day Default Volume 2000-2005 Average
0K
20K
40K
60K
80K
100K
120K
140K
2013
-03
2013
-06
2013
-09
2013
-12
2014
-03
2014
-06
2014
-09
2014
-12
2015
-03
2015
-06
2015
-09
2015
-12
2016
-03
2016
-06
2016
-09
2016
-12
2017
-03
2017
-06
2017
-09
2017
-12
2018
-03
90-Day Default Activity(All Other States)
90-Day Default Volume 2000-2005 Average
MARCH 2018MONITORMORTGAGE
Confidential, Proprietary and/or Trade SecretTM SM ® Trademark(s) of Black Knight IP Holding Company, LLC, and/or an affiliate.
© 2018 Black Knight Financial Technology Solutions, LLC. All Rights Reserved.
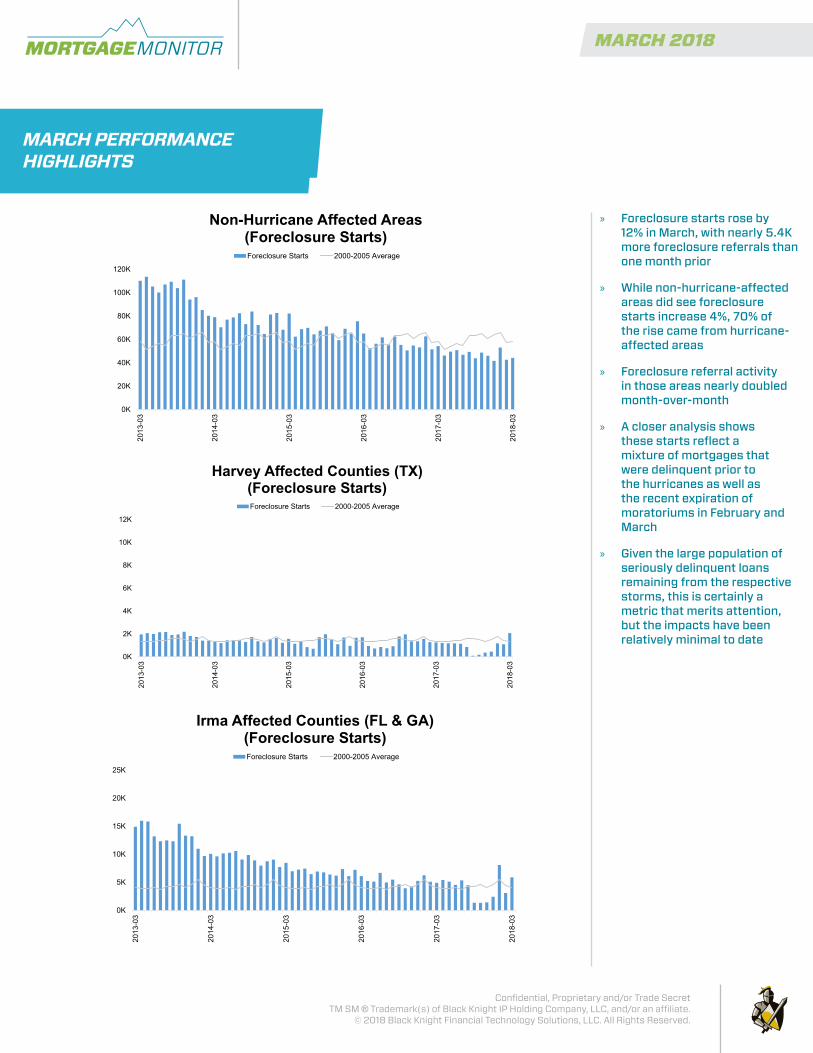
» Foreclosure starts rose by 12% in March, with nearly 5.4K more foreclosure referrals than one month prior
» While non-hurricane-affected areas did see foreclosure starts increase 4%, 70% of the rise came from hurricane-affected areas
» Foreclosure referral activity in those areas nearly doubled month-over-month
» A closer analysis shows these starts reflect a mixture of mortgages that were delinquent prior to the hurricanes as well as the recent expiration of moratoriums in February and March
» Given the large population of seriously delinquent loans remaining from the respective storms, this is certainly a metric that merits attention, but the impacts have been relatively minimal to date
MARCH PERFORMANCE HIGHLIGHTS
0K
20K
40K
60K
80K
100K
120K
2013
-03
2014
-03
2015
-03
2016
-03
2017
-03
2018
-03
Non-Hurricane Affected Areas(Foreclosure Starts)Foreclosure Starts 2000-2005 Average
0K
2K
4K
6K
8K
10K
12K
2013
-03
2014
-03
2015
-03
2016
-03
2017
-03
2018
-03
Harvey Affected Counties (TX)(Foreclosure Starts)Foreclosure Starts 2000-2005 Average
0K
5K
10K
15K
20K
25K
2013
-03
2014
-03
2015
-03
2016
-03
2017
-03
2018
-03
Irma Affected Counties (FL & GA)(Foreclosure Starts)Foreclosure Starts 2000-2005 Average

MARCH 2018MONITORMORTGAGE
Confidential, Proprietary and/or Trade SecretTM SM ® Trademark(s) of Black Knight IP Holding Company, LLC, and/or an affiliate.
© 2018 Black Knight Financial Technology Solutions, LLC. All Rights Reserved.
» Strong improvement in active foreclosure inventory continues in non-hurricane affected areas
» These areas have 116K fewer active cases than one year ago, representing a 29% reduction
» Active foreclosure cases in hurricane-affected areas are also down from a year ago; -7% Texas and -23% in Florida
» However, those numbers likely reflect foreclosure cases that have been suspended/deactivated due to the storms
» While it will be a number of months before the true foreclosure impact from these storms is revealed, so far the impact has been relatively muted as a result of ongoing forbearance programs in place to assist affected borrowers
» Note: Puerto Rico is not currently factored into national foreclosure start metrics, but there has been a slight rise in starts there as well; it is still too early to tell if this is hurricane-related or not
MARCH PERFORMANCE HIGHLIGHTS
0K
200K
400K
600K
800K
1,000K
1,200K
1,400K
2013
-03
2014
-03
2015
-03
2016
-03
2017
-03
2018
-03
Non-Hurricane Affected Areas(Foreclosure Inventory)
Foreclosure Inventory 2000-2005 Average
0K
5K
10K
15K
20K
25K
30K
35K
40K
45K
50K
2013
-03
2014
-03
2015
-03
2016
-03
2017
-03
2018
-03
Harvey Affected Counties (TX)(Foreclosure Inventory)
Foreclosure Inventory 2000-2005 Average
0K
50K
100K
150K
200K
250K
300K
350K
400K
450K
500K
2013
-03
2014
-03
2015
-03
2016
-03
2017
-03
2018
-03
Irma Affected Counties (FL & GA)(Foreclosure Inventory)
Foreclosure Inventory 2000-2005 Average
MARCH 2018MONITORMORTGAGE
Confidential, Proprietary and/or Trade SecretTM SM ® Trademark(s) of Black Knight IP Holding Company, LLC, and/or an affiliate.
© 2018 Black Knight Financial Technology Solutions, LLC. All Rights Reserved.
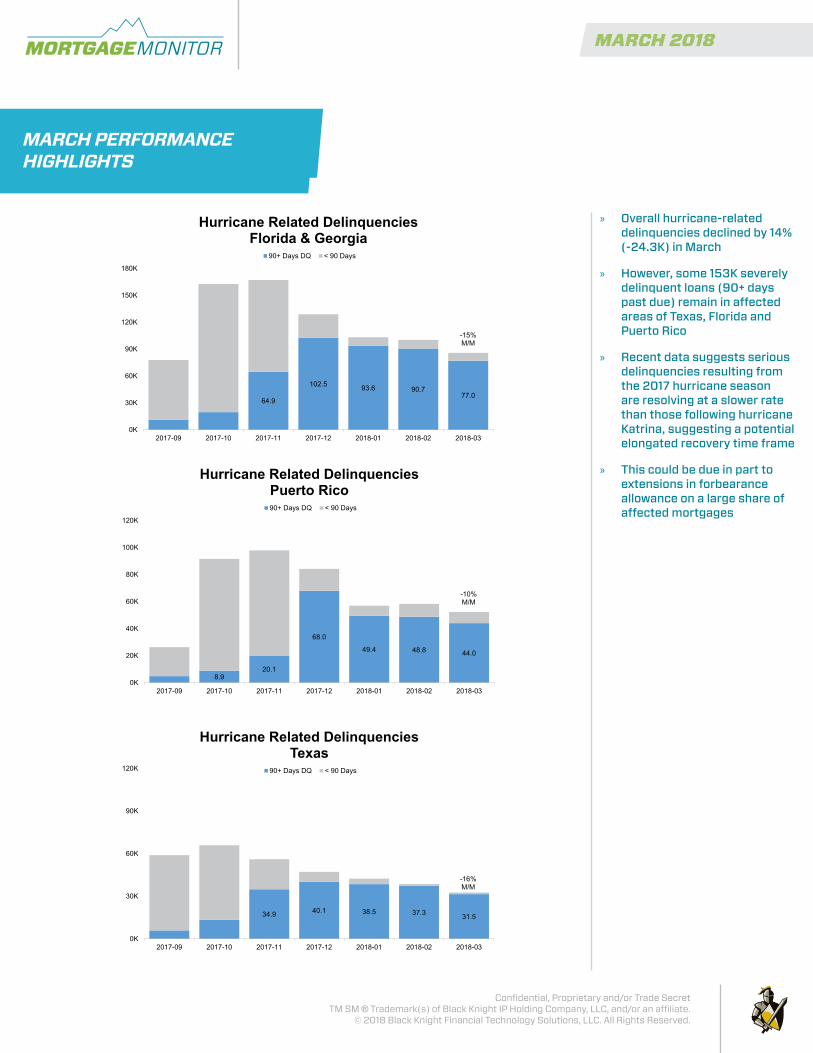
» Overall hurricane-related delinquencies declined by 14% (-24.3K) in March
» However, some 153K severely delinquent loans (90+ days past due) remain in affected areas of Texas, Florida and Puerto Rico
» Recent data suggests serious delinquencies resulting from the 2017 hurricane season are resolving at a slower rate than those following hurricane Katrina, suggesting a potential elongated recovery time frame
» This could be due in part to extensions in forbearance allowance on a large share of affected mortgages
MARCH PERFORMANCE HIGHLIGHTS
64.9
102.593.6 90.7
77.0
0K
30K
60K
90K
120K
150K
180K
2017-09 2017-10 2017-11 2017-12 2018-01 2018-02 2018-03
Hurricane Related Delinquencies Florida & Georgia
90+ Days DQ < 90 Days
-15% M/M
8.920.1
68.0
49.4 48.8 44.0
0K
20K
40K
60K
80K
100K
120K
2017-09 2017-10 2017-11 2017-12 2018-01 2018-02 2018-03
Hurricane Related Delinquencies Puerto Rico90+ Days DQ < 90 Days
-10% M/M
34.9 40.1 38.5 37.331.5
0K
30K
60K
90K
120K
2017-09 2017-10 2017-11 2017-12 2018-01 2018-02 2018-03
Hurricane Related Delinquencies Texas
90+ Days DQ < 90 Days
-16% M/M
MARCH 2018MONITORMORTGAGE
Confidential, Proprietary and/or Trade SecretTM SM ® Trademark(s) of Black Knight IP Holding Company, LLC, and/or an affiliate.
© 2018 Black Knight Financial Technology Solutions, LLC. All Rights Reserved.
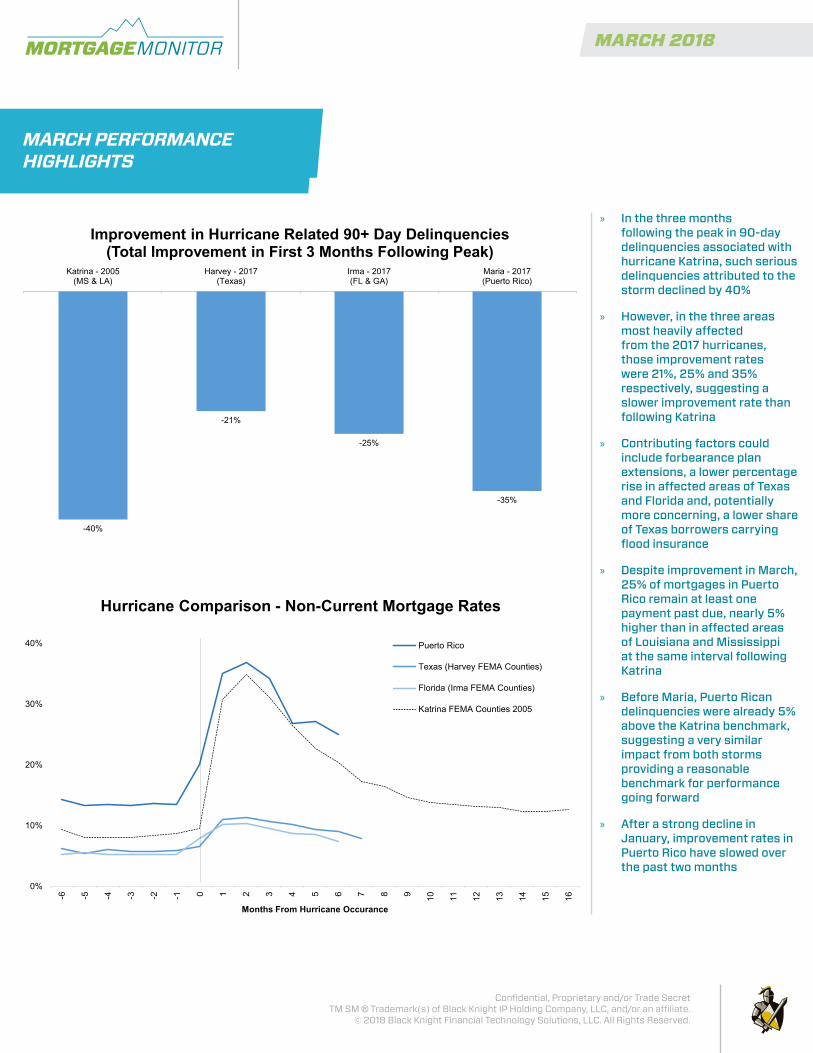
» In the three months following the peak in 90-day delinquencies associated with hurricane Katrina, such serious delinquencies attributed to the storm declined by 40%
» However, in the three areas most heavily affected from the 2017 hurricanes, those improvement rates were 21%, 25% and 35% respectively, suggesting a slower improvement rate than following Katrina
» Contributing factors could include forbearance plan extensions, a lower percentage rise in affected areas of Texas and Florida and, potentially more concerning, a lower share of Texas borrowers carrying flood insurance
» Despite improvement in March, 25% of mortgages in Puerto Rico remain at least one payment past due, nearly 5% higher than in affected areas of Louisiana and Mississippi at the same interval following Katrina
» Before Maria, Puerto Rican delinquencies were already 5% above the Katrina benchmark, suggesting a very similar impact from both storms providing a reasonable benchmark for performance going forward
» After a strong decline in January, improvement rates in Puerto Rico have slowed over the past two months
MARCH PERFORMANCE HIGHLIGHTS
-40%
-21%
-25%
-35%
Katrina - 2005(MS & LA)
Harvey - 2017(Texas)
Irma - 2017(FL & GA)
Maria - 2017(Puerto Rico)
Improvement in Hurricane Related 90+ Day Delinquencies (Total Improvement in First 3 Months Following Peak)
0%
10%
20%
30%
40%
-6 -5 -4 -3 -2 -1 0 1 2 3 4 5 6 7 8 9 10 11 12 13 14 15 16
Months From Hurricane Occurance
Hurricane Comparison - Non-Current Mortgage Rates
Puerto Rico
Texas (Harvey FEMA Counties)
Florida (Irma FEMA Counties)
Katrina FEMA Counties 2005
MARCH 2018MONITORMORTGAGE
Confidential, Proprietary and/or Trade SecretTM SM ® Trademark(s) of Black Knight IP Holding Company, LLC, and/or an affiliate.
© 2018 Black Knight Financial Technology Solutions, LLC. All Rights Reserved.
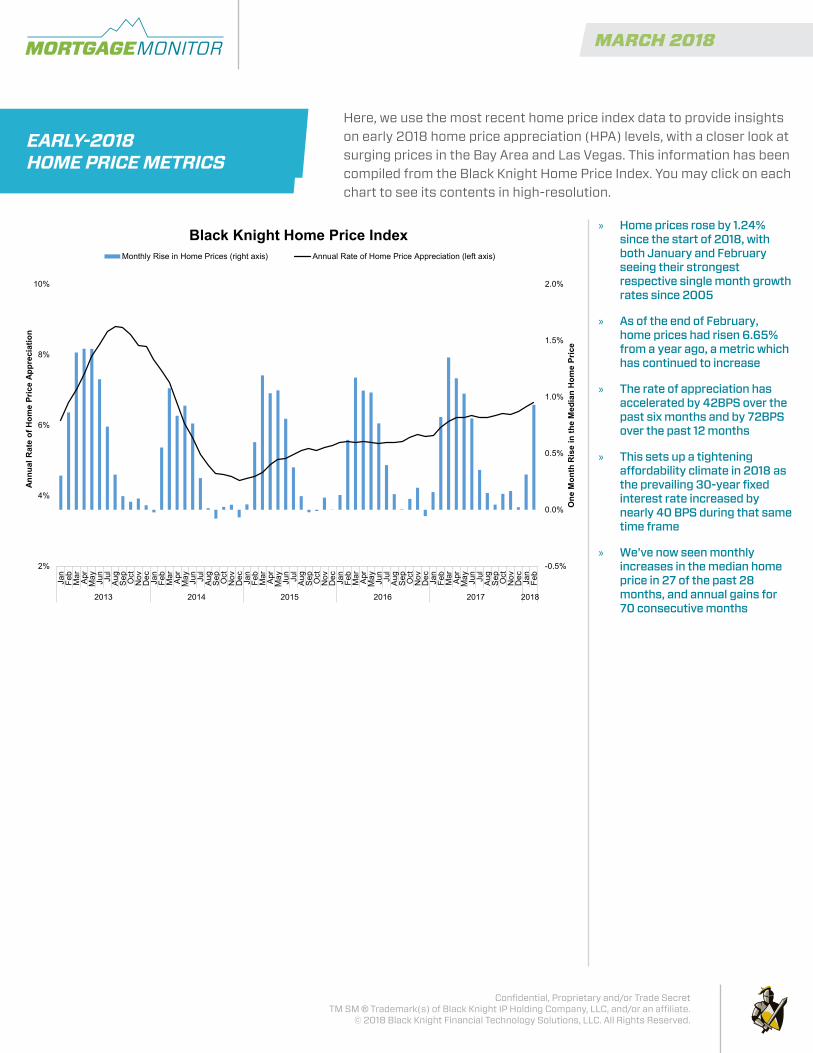
» Home prices rose by 1.24% since the start of 2018, with both January and February seeing their strongest respective single month growth rates since 2005
» As of the end of February, home prices had risen 6.65% from a year ago, a metric which has continued to increase
» The rate of appreciation has accelerated by 42BPS over the past six months and by 72BPS over the past 12 months
» This sets up a tightening affordability climate in 2018 as the prevailing 30-year fixed interest rate increased by nearly 40 BPS during that same time frame
» We’ve now seen monthly increases in the median home price in 27 of the past 28 months, and annual gains for 70 consecutive months
-0.5%
0.0%
0.5%
1.0%
1.5%
2.0%
2%
4%
6%
8%
10%
Jan
Feb
Ma
rA
prM
ay Jun
Jul
Aug
Sep Oct
No
vD
ec
Jan
Feb
Ma
rA
prM
ay
Jun
Jul
Aug
Sep Oct
No
vD
ec
Jan
Feb
Ma
rA
prM
ay
Jun
Jul
Aug
Sep Oct
No
vD
ec
Jan
Feb
Ma
rA
prM
ay
Jun
Jul
Aug
Sep Oct
No
vD
ec
Jan
Feb
Ma
rA
prM
ay
Jun
Jul
Aug
Sep Oct
No
vD
ec
Jan
Feb
2013 2014 2015 2016 2017 2018
One
Mon
th R
ise
in th
e M
edia
n H
ome
Pric
e
Annu
al R
ate
of H
ome
Pric
e Ap
prec
iatio
n
Black Knight Home Price IndexMonthly Rise in Home Prices (right axis) Annual Rate of Home Price Appreciation (left axis)
EARLY-2018 HOME PRICE METRICS
Here, we use the most recent home price index data to provide insights on early 2018 home price appreciation (HPA) levels, with a closer look at surging prices in the Bay Area and Las Vegas. This information has been compiled from the Black Knight Home Price Index. You may click on each chart to see its contents in high-resolution.

MARCH 2018MONITORMORTGAGE
Confidential, Proprietary and/or Trade SecretTM SM ® Trademark(s) of Black Knight IP Holding Company, LLC, and/or an affiliate.
© 2018 Black Knight Financial Technology Solutions, LLC. All Rights Reserved.
» While home price growth has been widespread – 98 of the largest markets and 97% of 916 observed CBSAs have all had annual increases – the western United States is seeing some of the greatest gains
» San Jose, CA, leads all markets, with home prices up 24% from one year ago, followed by Las Vegas and Seattle
» As mentioned, acceleration in the annual rate of home price appreciation (HPA) has continued at the national level, but that acceleration isn’t seen in all markets
» Across the country, we see an approximately 60-40 split in the number of markets seeing HPA acceleration vs. those experiencing some degree of deceleration
» The bottom map shows the geographic diversity between markets that are heating and those that are cooling
» Many western markets are actually slowing a bit, despite still seeing strong overall rates of HPA
» Cooling is also observed across much of the central U.S. and down into portions of Florida
» The Rocky Mountain region, extending across into Las Vegas and parts of Arizona and New Mexico, is accelerating, as is a broad swath of the northeast.
Annual Rate of Home Price Appreciation
-12.5% +12.5%
6-Month Change in Annual Rate of Appreciation
-1.5% +1.5%
EARLY-2018 HOME PRICE METRICS

MARCH 2018MONITORMORTGAGE
Confidential, Proprietary and/or Trade SecretTM SM ® Trademark(s) of Black Knight IP Holding Company, LLC, and/or an affiliate.
© 2018 Black Knight Financial Technology Solutions, LLC. All Rights Reserved.
» 11 markets have seen home price gains of more than 10% over the past 12 months
» All 11 are located in the western United States, with California and Utah containing six, Washington two and Colorado, Idaho and Nevada holding one each
» San Jose, Las Vegas, and San Francisco have also seen some of the highest rates of acceleration over the past six months as well
» In each of those markets acceleration has been more than 7X the national average over the past six months.
Metropolitan Statistical Area Annual Rate of Home Price Appreciation 6-Month Change
San Jose, CA +24.1% +10.4%Las Vegas, NV +14.8% +3.0%
Seattle, WA +14.6% +0.4%San Francisco, CA +12.9% +3.1%
Spokane, WA +12.6% +2.7%Stockton, CA +10.9% -1.3%
Colorado Springs, CO +10.9% +1.5%Boise City, ID +10.7% +1.1%
Ogden, UT +10.5% +2.0%Salt Lake City, UT +10.4% +0.1%
Provo, UT +10.3% +0.7%
EARLY-2018 HOME PRICE METRICS

MARCH 2018MONITORMORTGAGE
Confidential, Proprietary and/or Trade SecretTM SM ® Trademark(s) of Black Knight IP Holding Company, LLC, and/or an affiliate.
© 2018 Black Knight Financial Technology Solutions, LLC. All Rights Reserved.
» While low-priced homes continue to lead with an annual appreciation rate of 8.4% (more than 25% above the market average), the high end of the market is starting to pick up speed as well
» Over the past six months the annual appreciation rate among the lowest price tier has decelerated by 18BPS (counter to the 42 BPS increase in the overall rate of appreciation)
» Meanwhile, the appreciation rate among the highest-priced homes has increased by 150 BPS (1.5%)
» Over the past year we see a greater than 2.5% rise in the annual rate of appreciation among high-end properties, from a lackluster 3% one year ago to 5.6% today
» Acceleration is even more noticeable among high-end condos, where the annual rate of appreciation has climbed more than 3.6% over the past 12 months.
8.4%
6.7%
5.6%
0%
1%
2%
3%
4%
5%
6%
7%
8%
9%
10%
Annual Home Price Appreciation by Price TierTier 1 (Bottom 20% of Market) Overall Tier 5 (Top 20% of Market)
0%
2%
4%
6%
8%
10%
12%
Annual Home Price Appreciation of Tier 5 PropertiesAll Property Types Single Family Condo
EARLY-2018 HOME PRICE METRICS

MARCH 2018MONITORMORTGAGE
Confidential, Proprietary and/or Trade SecretTM SM ® Trademark(s) of Black Knight IP Holding Company, LLC, and/or an affiliate.
© 2018 Black Knight Financial Technology Solutions, LLC. All Rights Reserved.
10.0%
12.9%
24.1%
0%
5%
10%
15%
20%
25%
30%
Annual Home Price AppreciationCalifornia San Francisco, CA (MSA) San Jose, CA (MSA)
$941,000
$794,000
$268,000
$1,167,000
$897,000
$286,000
San Jose, CA (MSA) San Francisco, CA (MSA) United States
Median Home PriceFebruary 2017 February 2018
EARLY-2018 HOME PRICE METRICS
» Acceleration is most noticeable among two of the most expensive markets in the country, San Jose and San Francisco, Calif.
» After seeing double-digit growth from late 2012 through 2015, both markets began to cool in 2016, before turning upward again in early 2017
» The annual rate of appreciation in San Jose has increased by more than 18% over the past 12 months, from less than 6% entering 2017 to 24.1% today, the highest of any metro area
» The rate of appreciation in San Francisco has increased by more than 6% over the past 12 months (the third highest increase of any of the top 100 markets, behind only San Jose and Las Vegas)
» San Francisco's HPA rate grew from less than 7% at the start of 2017 to 12.9% today
» San Jose's median home price is now $1.17M (the highest of any metro in the U.S) up from $941K one year ago, marking a $226K annual increase
» To put that in perspective, more than half of the nation’s 100 largest markets have median home prices below just the annual growth seen in San Jose
» The median home price in San Francisco is now just below $900K, a $103K increase from last year
» Both San Jose and San Francisco's annual increases dwarf an otherwise impressive $18K average increase in the median home price across the U.S. at large

MARCH 2018MONITORMORTGAGE
Confidential, Proprietary and/or Trade SecretTM SM ® Trademark(s) of Black Knight IP Holding Company, LLC, and/or an affiliate.
© 2018 Black Knight Financial Technology Solutions, LLC. All Rights Reserved.
» Las Vegas has surpassed Seattle as the second fastest appreciating market nationwide, behind only San Jose
» Home prices are up 14.8% from last year, with condos appreciating exceptionally quickly; the average condo price is up 20.9% from last year
» That is a 7% higher rate of appreciation than single family residences (SFR) in the area and more than 14% faster than the average condo nationwide
» The median price on a SFR in Las Vegas is up 13.9% from last year, more than 2X the national average
» In the wake of the financial crisis, home values declined by more than 60% from the 2006 peak, with condos dropping by 68%, both 2X the national average declines seen during that time
» Overall, home prices in Las Vegas are still 22 % below their 2006 peaks (-20% SFR, -35% Condo)
» Despite touting the nation's second highest growth rate, Las Vegas remains in the bottom 5% of home price recovery
» Even at today’s levels of HPA, it would take roughly 18 months for home prices in Las Vegas to reach pre-recession peaks
» High-end condos in Vegas continue to linger well below pre-recession peaks
» Although currently appreciating at 12.4% per year - well above the national average - the median home price of a high-end Las Vegas condo is still 50% below the height of the market in 2006
14.8%
6.7%
0%
5%
10%
15%
20%
25%
30%
Annual Rate of Home Price AppreciationLas Vegas, NV (MSA) National
14.8%
13.9%
20.9%
0%
5%
10%
15%
20%
25%
30%
Las Vegas (MSA) Annual Rate of Home Price Appreciation
All Property Types Single Family Condo
EARLY-2018 HOME PRICE METRICS
+8.4%
-1.8%
-20.0%
-34.8%
-80%
-60%
-40%
-20%
0%
20%
Median Home Price Compared to 2006 PeakNational - Single Family National - Condo Las Vegas - Single Family Las Vegas - Condo

MARCH 2018MONITORMORTGAGE
Confidential, Proprietary and/or Trade SecretTM SM ® Trademark(s) of Black Knight IP Holding Company, LLC, and/or an affiliate.
© 2018 Black Knight Financial Technology Solutions, LLC. All Rights Reserved.
» As of April 26, 2018, interest rates had risen yet again, with the 30-year fixed rate reaching 4.58% tying August 22, 2013 for the highest fixed rate average of any week since July 2011
» Rising rates continue to suppress refinance incentive in the market; just 2.29M traditional refinance candidates remain (30-year mortgage holders with 720 or higher credit scores and at least 20% equity)
» The number of refinance candidates has been shrinking in 2018, declining by 12% (300K) over the past 30 days, and 46% (nearly 2M) since the start of the year
» The population of refinance candidates is at its lowest point since November 2008, when interest rates were above 6%
» The sharp reduction of rate incentive suggests it is likely cash-out activity (while also dampened) will dominate refinance originations in coming months
» A similar situation was observed during the 2004-2008 time frame (albeit with better credit quality and overall lower risk characteristics today)
0.0%
1.0%
2.0%
3.0%
4.0%
5.0%
6.0%
7.0%
8.0%
0M
1M
2M
3M
4M
5M
6M
7M
8M
9M
10M
2001
-04
2002
-04
2003
-04
2004
-04
2005
-04
2006
-04
2007
-04
2008
-04
2009
-04
2010
-04
2011
-04
2012
-04
2013
-04
2014
-04
2015
-04
2016
-04
2017
-04
2018
-04
Refinance Candidates Refinance Candidates (left axis) Freddie 30-Year Fixed Interest Rate (right axis)
REFINANCEABLE POPULATION UPDATE
Here, we take a look at the declining population of refinance candidates driven by recent interest rate increases, while providing a road map to locating those few remaining candidates. This information has been compiled from Black Knight’s McDash loan-level mortgage performance database. You may click on each chart to see its contents in high-resolution.

MARCH 2018MONITORMORTGAGE
Confidential, Proprietary and/or Trade SecretTM SM ® Trademark(s) of Black Knight IP Holding Company, LLC, and/or an affiliate.
© 2018 Black Knight Financial Technology Solutions, LLC. All Rights Reserved.
» Interest rate incentive is all but non-existent for borrowers who have taken out a mortgage in the past five years
» Of the nearly 28M 30-year mortgages originated in 2012 or later, fewer than 45K have both 75BPS of interest rate incentive to refi and meet broad-based eligibility requirements
» Lenders seeking to source traditional rate/term refinances are going to have to attract borrowers in seasoned mortgages in order to do so
» Pre-2009 GSE loans account for 60% of all remaining refinance candidates, with the heaviest concentration in the 2003 vintage (over 250K borrowers, or roughly 10% of all remaining refi candidates)
» In the PLS market, 250K loans have high enough credit scores and equity levels to make good candidates, as well as interest rate incentive to refinance
» These loans were primarily originated near the 2006 home price peak, suggesting a newfound, equity-driven, ability to refinance
» Roughly 8% of 2004-2008 vintage PLS loans exhibit the characteristics of good refi candidates
» As the vast majority of remaining refi candidates are in seasoned mortgages, 30 to 15 year conversions will likely become increasingly popular
Share of Borrowers with Remaining Interest RateIncentive to Refinance By State
REFINANCEABLE POPULATION UPDATE

MARCH 2018MONITORMORTGAGE
Confidential, Proprietary and/or Trade SecretTM SM ® Trademark(s) of Black Knight IP Holding Company, LLC, and/or an affiliate.
© 2018 Black Knight Financial Technology Solutions, LLC. All Rights Reserved.
» Just 5.4% of 30-year fixed rate mortgage holders have at least 75BPS of incentive to refinance and also meet broad-based eligibility requirements
» Refinance candidate populations vary by geography, with the south and northeast having a higher per capita share of borrowers with incentive and ability to refinance
» One reason for this geographic distribution is that borrowers with lower principal balances tend to be less reactive to interest rate incentive as their monthly savings are smaller and the timeline to break even on the cost to refi is longer
» Refinance offerings with low up-front costs may be an attractive solution for these borrowers as they would shorten that break-even timeline
» Despite being higher-priced areas of the country (borrowers in which tend to carry higher balances), Florida (6.5%) and New York (6.9%) have higher than average shares of refinance candidate populations
» 35% of remaining candidates are located in four, more heavily-populated, states: California, Texas, Florida and New York
» Despite California having among the lowest share of borrowers with incentive remaining, it is home to the largest volume at nearly 250K borrowers
0
50000
100000
150000
200000
250000
300000
350000
400000
<2000 2000 2001 2002 2003 2004 2005 2006 2007 2008 2009 2010 2011 2012 2013 2014 2015 2016
Vintage
Refinance Candidates Distributed By Current Mortgage Characteristics
GSE FHA/VA Portfolio Private Securities
REFINANCEABLE POPULATION UPDATE

MARCH 2018MONITORMORTGAGE
Confidential, Proprietary and/or Trade SecretTM SM ® Trademark(s) of Black Knight IP Holding Company, LLC, and/or an affiliate.
© 2018 Black Knight Financial Technology Solutions, LLC. All Rights Reserved.
APPENDIX
» March 2018 Data SummaryMar-18
Monthly Change
YTD Change
Yearly Change
Delinquencies 3.73% -13.24% -13.42% 3.09%
Foreclosure 0.63% -3.21% -4.97% -29.29%
Foreclosure Starts 52,100 11.56% -16.37% -13.60%
Seriously Delinquent (90+) or in Foreclosure
1.86% -7.48% -8.89% -9.20%
New Originations (data as of Feb-18)
414K -7.9% -25.5% -8.1%
Mar-18 Feb-18 Jan-18 Dec-17 Nov-17 Oct-17 Sep-17 Aug-17 Jul-17 Jun-17 May-17 Apr-17 Mar-17
Delinquencies 3.73% 4.30% 4.31% 4.71% 4.55% 4.44% 4.40% 3.93% 3.90% 3.80% 3.79% 4.08% 3.62%
Foreclosure 0.63% 0.65% 0.66% 0.65% 0.66% 0.68% 0.70% 0.76% 0.78% 0.81% 0.83% 0.85% 0.88%
Foreclosure Starts 52,100 46,700 62,300 44,500 47,840 50,200 45,200 54,700 53,300 56,500 55,800 52,800 60,300
Seriously Delinquent (90+) or in Foreclosure
1.86% 2.01% 2.04% 2.06% 1.97% 1.84% 1.83% 1.85% 1.87% 1.90% 1.93% 2.00% 2.05%
New Originations 414K 450K 556K 556K 608K 579K 642K 585K 659K 624K 530K 574K
3.62
%
4.08
%
3.79
%
3.80
%
3.90
%
3.93
%
4.40
%
4.44
%
4.55
%
4.71
%
4.31
%
4.30
%
3.73
%
Total Delinquencies
574K
530K 62
4K
659K
585K
642K
579K
608K
556K
556K
450K
414K
New Originations
© 2016 - Black Knight Financial Services, Inc.: Unauthorized use is strictly prohibited. Based on data believed to be reliable, not guaranteed as to accuracy or completeness.

MARCH 2018MONITORMORTGAGE
Confidential, Proprietary and/or Trade SecretTM SM ® Trademark(s) of Black Knight IP Holding Company, LLC, and/or an affiliate.
© 2018 Black Knight Financial Technology Solutions, LLC. All Rights Reserved.
APPENDIX
» Loan counts and average days delinquentMonth
TOTAL ACTIVE COUNT
30 DAYS 60 DAYS 90+ DAYS FC Total Non-Current
FC Starts
Average Days Delinquent
for 90+
Average Days Delinquent
for FC
Ratio of 90+ to FC
1/31/2000 40,192,541 1,176,769 296,820 374,724 234,074 2,082,387 55,426 241 331 160.1%
1/31/2001 42,340,690 1,321,334 346,119 438,737 223,602 2,329,792 63,753 211 304 196.2%
1/31/2002 43,454,963 1,353,355 380,012 515,985 340,401 2,589,754 90,160 219 289 151.6%
1/31/2003 44,275,177 1,331,861 365,393 494,180 344,037 2,535,471 101,211 231 297 143.6%
1/31/2004 44,769,847 1,186,809 352,515 501,740 321,294 2,362,357 77,360 269 344 156.2%
1/31/2005 47,706,128 1,197,062 339,920 458,719 276,745 2,272,446 50,922 242 324 165.8%
1/31/2006 50,900,620 1,242,434 387,907 542,378 258,613 2,431,332 76,477 207 308 209.7%
1/31/2007 53,900,458 1,425,030 468,441 551,439 393,973 2,838,883 117,419 203 267 140.0%
1/31/2008 55,478,782 1,743,420 676,266 950,639 813,560 4,183,885 195,033 190 256 116.8%
1/31/2009 55,788,441 2,001,314 932,436 1,878,981 1,321,029 6,133,760 250,621 193 323 142.2%
1/31/2010 55,098,009 1,945,589 903,778 2,972,983 2,068,572 7,890,922 292,308 253 418 143.7%
1/31/2011 53,861,778 1,750,601 746,634 2,078,130 2,245,250 6,820,615 277,374 333 527 92.6%
1/31/2012 52,687,781 1,592,463 652,524 1,796,698 2,205,818 6,247,503 223,394 395 666 81.5%
1/31/2013 51,229,692 1,464,583 587,661 1,551,415 1,742,689 5,346,348 156,654 460 803 89.0%
1/31/2014 50,380,779 1,341,074 529,524 1,278,955 1,213,046 4,362,599 97,467 486 935 105.4%
1/31/2015 50,412,744 1,238,453 465,849 1,060,002 884,901 3,649,204 93,280 509 1,031 119.8%
1/31/2016 50,541,353 1,298,682 444,594 831,284 659,237 3,233,797 71,900 495 1,047 126.1%
1/31/2017 50,871,357 1,108,712 389,768 663,521 480,598 2,642,599 70,357 454 1,013 138.1%
1/31/2018 51,155,753 1,083,162 412,676 706,623 336,613 2,539,074 62,312 364 932 209.9%
2/28/2018 51,154,575 1,114,486 386,518 696,802 330,505 2,528,312 46,720 367 930 210.8%
3/31/2018 51,282,283 942,600 336,892 632,157 320,686 2,232,335 52,094 388 928 197.1%
© 2018 - Black Knight Financial Services, Inc.: Unauthorized use is strictly prohibited. Based on data believed to be reliable, not guaranteed as to accuracy or completeness.Page 1 of 1

MARCH 2018MONITORMORTGAGE
Confidential, Proprietary and/or Trade SecretTM SM ® Trademark(s) of Black Knight IP Holding Company, LLC, and/or an affiliate.
© 2018 Black Knight Financial Technology Solutions, LLC. All Rights Reserved.
APPENDIX
State Del % FC % Non-Curr %
Yr/Yr Change in
NC%State Del % FC % Non-
Curr %
Yr/Yr Change in
NC%State Del % FC % Non-
Curr %
Yr/Yr Change in
NC%
National 3.7% 0.6% 4.4% -3.3% National 3.7% 0.6% 4.4% -3.3% National 3.7% 0.6% 4.4% -3.3%
MS 8.8% 0.6% 9.4% -2.6% MD * 4.3% 0.7% 5.1% -5.1% NV 2.6% 0.9% 3.4% -13.9%
LA * 6.8% 1.0% 7.8% -8.3% SC * 4.3% 0.7% 5.0% -8.8% VA 3.1% 0.2% 3.4% -7.3%
FL * 6.0% 1.1% 7.2% 36.8% TN 4.7% 0.3% 5.0% -7.9% WY 2.9% 0.4% 3.4% -6.6%
AL 6.2% 0.5% 6.7% -3.1% OH * 4.0% 0.9% 4.9% -5.8% AK 2.8% 0.4% 3.3% 5.1%
WV 5.4% 0.7% 6.1% -7.7% NM * 3.5% 1.1% 4.5% -12.9% DC 2.3% 0.8% 3.2% -20.5%
ME * 4.1% 1.7% 5.8% -10.2% VT * 3.4% 1.1% 4.5% -6.6% NE * 2.8% 0.3% 3.1% 0.4%
RI 4.8% 0.9% 5.7% -9.5% HI * 2.8% 1.6% 4.5% -14.8% AZ 2.5% 0.2% 2.8% -3.8%
TX 5.2% 0.4% 5.7% 11.7% NC 3.9% 0.4% 4.3% -8.5% UT 2.4% 0.2% 2.6% -14.1%
PA * 4.7% 0.9% 5.6% -4.9% KS * 3.7% 0.6% 4.3% -4.6% CA 2.3% 0.2% 2.5% -10.2%
IN * 4.7% 0.9% 5.5% -5.1% KY * 3.5% 0.7% 4.3% -7.9% SD * 2.0% 0.4% 2.5% -7.9%
NY * 3.7% 1.8% 5.5% -14.5% MA 3.5% 0.7% 4.2% -10.4% MT 2.0% 0.4% 2.4% -6.0%
AR 5.0% 0.5% 5.5% -5.0% IL * 3.4% 0.8% 4.2% -7.4% ID 2.0% 0.3% 2.3% -12.3%
OK * 4.5% 1.0% 5.5% -6.3% MO 3.7% 0.3% 4.1% -5.0% ND * 1.7% 0.6% 2.3% 7.8%
DE * 4.4% 1.0% 5.4% -6.5% MI 3.6% 0.2% 3.8% -1.6% MN 2.1% 0.2% 2.3% -4.4%
NJ * 4.0% 1.4% 5.3% -19.6% NH 3.3% 0.4% 3.7% -4.6% WA 1.8% 0.4% 2.2% -18.7%
GA 4.9% 0.4% 5.3% -2.8% WI * 3.1% 0.6% 3.7% -8.8% OR 1.8% 0.4% 2.2% -20.1%
CT * 4.2% 1.1% 5.2% -8.0% IA * 2.9% 0.6% 3.5% -5.1% CO 1.7% 0.1% 1.8% -11.5%* - Indicates Judicial State
© 2018 - Black Knight Financial Services, Inc.: Unauthorized use is strictly prohibited. Based on data believed to be reliable, not guaranteed as to accuracy or completeness.
» State-by-staterankings by non-currentloan population

MARCH 2018MONITORMORTGAGE
Confidential, Proprietary and/or Trade SecretTM SM ® Trademark(s) of Black Knight IP Holding Company, LLC, and/or an affiliate.
© 2018 Black Knight Financial Technology Solutions, LLC. All Rights Reserved.
DISCLOSURESPlease refer to the links below for specific disclosures relating to Product Definitions, Metrics Definitions and Extrapolation Methodology.
>> PRODUCT DEFINITIONS>> METRICS DEFINITIONS>> EXTRAPOLATION METHODOLOGY