Mortality for Standard Individually Underwritten Life Insurance
22
Page 1 Report of the Individual Life Insurance Experience Committee Mortality for Standard Individually Underwritten Life Insurance Between 2004 and 2005 Policy Anniversaries Introduction This study is the latest in the continuing reports from the Society of Actuaries (SOA) on inter-company mortality experience. The previous report discussed experience over 2002-2004 policy anniversaries, a two year study period. While some high level comparisons to the 2002-2004 study are presented in this report, there is not yet a sufficient time period to develop longer term averages and trends. The next report will cover a two year time period (2005-2007 policy anniversaries). At that time, it is anticipated that five year averages and additional trend analysis will be presented. The purpose of this report is to present an overview of mortality results relative to the 2001 Valuation Basic Tables and present some comparisons to the prior 2002-2004 study period. Consistent with prior reports, the study is performed on a gross basis without consideration of reinsurance. The reader should exercise caution in any direct application of these results as they are generally presented in a one dimensional view. Results can be influenced by the distributions by face amounts, issue ages, and policy durations within the one dimensional view. The user is encouraged to use the detailed Excel pivot tables that go along with this study in order to examine the multi-dimensional views (e.g., by age, sex and policy duration) most relevant to the user. Forty-two companies contributed data to the SOA for the 2004-05 study period compared to 35 companies for the 2002-2004 study. The face amount exposure is over $4.6 trillion in the select period (policy years 1-25) and the number of deaths is 111,810 for the one-year study. This compares to just over $7.4 trillion in face amount exposure and just over 200,000 deaths in the prior two-year study. Although not discussed in detail in this report, actual-to-expected experience has been separately studied for the 26 common companies that contributed to each of the three policy-year studies 2002-2003, 2003- 2004 and 2004-2005. A high-level summary of all-company to common-company experience over these three policy years is shown in Appendix E and in greater detail in Appendix F for a subset of this data. Since the 2004-2005 study was advertised to concentrate on preferred mortality, the new contributors represented companies with significant amounts of preferred mortality. The 16 new companies have lower mortality than the 26 common companies in both the select and the ultimate period. Therefore, reductions in actual-to-expected ratios from 2002-2003 to 2004-2005 (on both a by-policy and a by- amount basis) are considerably less on the common-company basis than on the all-company basis. For a variety of reasons, including changes in the list of contributing companies and their relative contributions, changes in the mix of experience by risk class, issue age, gender and duration and the fact that underwriting requirements generally change from one study to the next, the trends in the results described in this report should not be assumed to be indicative of mortality improvement. For the 2002-2004 ILEC study, contributors were asked for the first time to provide information related to their preferred risk class structure. More extensive data validation and analysis was performed in connection with development of the Underwriting Criteria Score (UCS) approach for the Preferred Mortality project than was done with the data presented in the Individual Life Insurance Experience Committee (ILEC) study. ILEC study results were also presented for only three non-smoker risk classes with the middle class representing all experience other than the best or residual standard classes. For
Transcript of Mortality for Standard Individually Underwritten Life Insurance

Page 1
Report of the Individual Life Insurance Experience Committee
Mortality for Standard Individually Underwritten Life Insurance Between 2004 and 2005 Policy Anniversaries
Introduction This study is the latest in the continuing reports from the Society of Actuaries (SOA) on inter-company mortality experience. The previous report discussed experience over 2002-2004 policy anniversaries, a two year study period. While some high level comparisons to the 2002-2004 study are presented in this report, there is not yet a sufficient time period to develop longer term averages and trends. The next report will cover a two year time period (2005-2007 policy anniversaries). At that time, it is anticipated that five year averages and additional trend analysis will be presented. The purpose of this report is to present an overview of mortality results relative to the 2001 Valuation Basic Tables and present some comparisons to the prior 2002-2004 study period. Consistent with prior reports, the study is performed on a gross basis without consideration of reinsurance. The reader should exercise caution in any direct application of these results as they are generally presented in a one dimensional view. Results can be influenced by the distributions by face amounts, issue ages, and policy durations within the one dimensional view. The user is encouraged to use the detailed Excel pivot tables that go along with this study in order to examine the multi-dimensional views (e.g., by age, sex and policy duration) most relevant to the user. Forty-two companies contributed data to the SOA for the 2004-05 study period compared to 35 companies for the 2002-2004 study. The face amount exposure is over $4.6 trillion in the select period (policy years 1-25) and the number of deaths is 111,810 for the one-year study. This compares to just over $7.4 trillion in face amount exposure and just over 200,000 deaths in the prior two-year study. Although not discussed in detail in this report, actual-to-expected experience has been separately studied for the 26 common companies that contributed to each of the three policy-year studies 2002-2003, 2003-2004 and 2004-2005. A high-level summary of all-company to common-company experience over these three policy years is shown in Appendix E and in greater detail in Appendix F for a subset of this data. Since the 2004-2005 study was advertised to concentrate on preferred mortality, the new contributors represented companies with significant amounts of preferred mortality. The 16 new companies have lower mortality than the 26 common companies in both the select and the ultimate period. Therefore, reductions in actual-to-expected ratios from 2002-2003 to 2004-2005 (on both a by-policy and a by-amount basis) are considerably less on the common-company basis than on the all-company basis. For a variety of reasons, including changes in the list of contributing companies and their relative contributions, changes in the mix of experience by risk class, issue age, gender and duration and the fact that underwriting requirements generally change from one study to the next, the trends in the results described in this report should not be assumed to be indicative of mortality improvement. For the 2002-2004 ILEC study, contributors were asked for the first time to provide information related to their preferred risk class structure. More extensive data validation and analysis was performed in connection with development of the Underwriting Criteria Score (UCS) approach for the Preferred Mortality project than was done with the data presented in the Individual Life Insurance Experience Committee (ILEC) study. ILEC study results were also presented for only three non-smoker risk classes with the middle class representing all experience other than the best or residual standard classes. For

Page 2
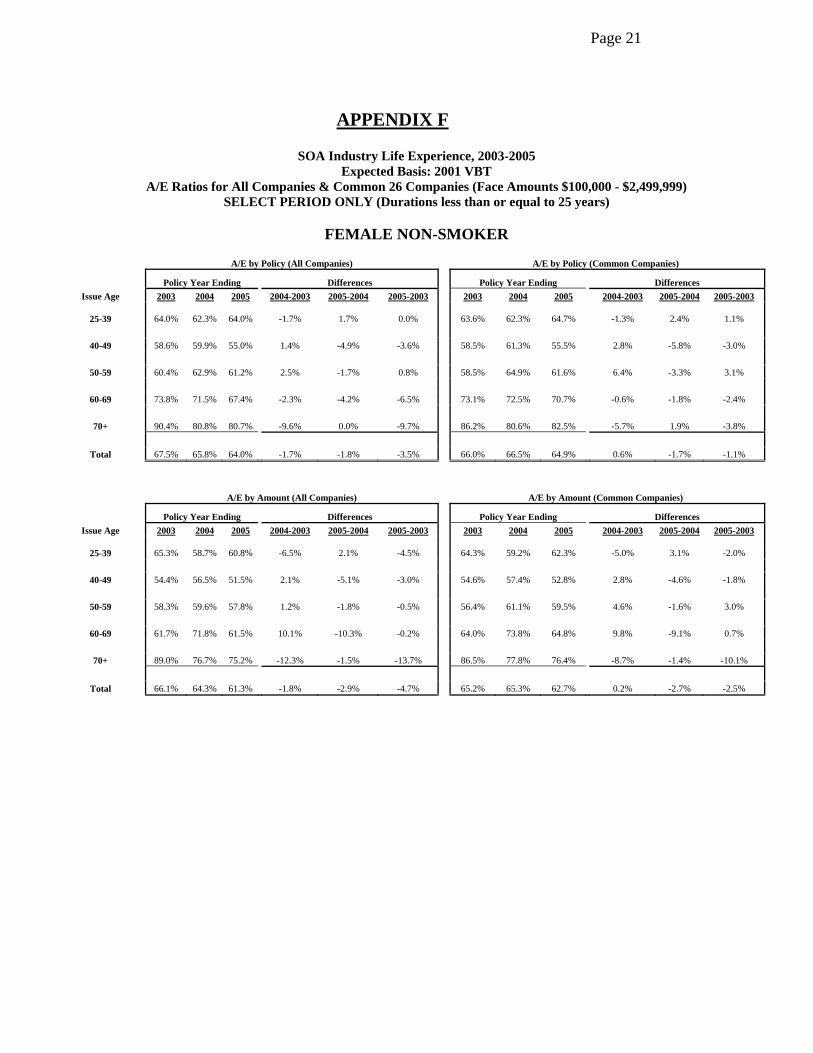
smoker experience, only two classes were presented. For this study, the same data validation techniques applied to the UCS study were applied. Further details on the data are described in the preferred risk class section below. Consistent with previous studies, this report examines mortality under standard individually underwritten life insurance and excludes rated, converted, and other guaranteed or simplified issues as indicated by the individual company data submissions. Policies in force under non-forfeiture provisions are also excluded. It should be noted that the definition of standard may not be consistent across companies. In addition, higher mortality ratios, particularly at the lower face amount bands for recent issues, suggest that the data may include policies that are not fully underwritten. Although the volume relative to the total in-force is probably not yet significant, term policies that have reached durations with large premium increases have not been explicitly excluded. Going forward, as larger blocks of in-force level term are anticipated to reach the end of the level premium period, this issue will need to be addressed. As noted above, expected mortality used to compute actual-to-expected ratios is equal to the 2001 Valuation Basic Tables (2001 VBT), which have composite and smoker-distinct versions and were based on experience from contributors to the SOA intercompany studies for the 1990-95 study period. The Age Nearest Birthday (ANB) and Age Last Birthday (ALB) versions of the tables are used consistent with the issue basis coded for the individual policy records. The application of the composite or smoker distinct tables in the expected calculations relies on the smoking status information provided in the individual company submissions. Composite tables apply to policies with unknown smoking status. For consistency, all policies with issue dates prior to 1980 are assumed to be of unknown smoking status. Some inaccuracies in the smoker and non-smoker coding may exist for certain companies, particularly for policies issued in the 1980s. Juvenile policies are included as either non-smoker or smokers depending on the individual company coding; however, the expected basis is composite for these policies regardless of the coding. Although high level summaries are provided at the end of this report, more detailed results are available in Excel pivot table format from the SOA. Results based on the 1975-80 Basic Tables, with the Milliman extension for issue ages 71-87, are also available in the Excel pivot format. There are two sets of pivot tables—one for the full set of experience data and the other for just the data with a preferred/residual risk class structure. These files are located on the SOA website (www.SOA.org) under Research, Experience Studies, Individual Life. This report does not present results relative to the new 2008 Valuation Basic Table (2008 VBT) because additional time is needed to develop and analyze results on this basis. Results by product type (e.g., Term, UL, Traditional Permanent) have also not been presented as additional data validation and analysis efforts are also needed. The committee intends to provide both of these extra breakdowns in the next report. Select Period Results Based On 2001 VBT (Appendix A) Overall, mortality experience in the 25-year select period for the 2004-05 study was 83% of the 2001 VBT by policy and 67% by face amount. The corresponding 2002-2004 study ratios were 88% by policy and 71% by amount. The mortality experience (by amount) for the 26 common companies for 2004-2005 was 69.3% compared to 67.4% for all companies. The results for 2002-03, 2003-04 and 2004-05 for the common companies by face amount was 73.4%, 71.0% and 69.3% compared to 72.9%, 70.3% and 67.4% for all companies included in each of the study years. Additional details for the 26 common companies by individual study years, gender and smoking status, as well as results on a policy basis, are included in Appendices E and F. The common company results can be viewed as a more reliable indicator of trends

Page 3
in overall improvement as this measure removes the impact on experience due to changes in the list of participating companies. The variability between results by policy and by face amount is seen for all breakdowns except results by policy size. Therefore, differences between policy count results and face amount results may be attributed to the mix of business by face amount within individual reporting categories. Policies under $100,000 comprise 54% of the exposure by policy, but only 11% of the exposure by amount. Therefore, overall results on a policy count basis are weighted heavily towards the higher A/E ratios in the lower face amount bands. The actual-to-expected ratio (by amount) for females is slightly higher than for males at 69% compared to 67% for males, each ratio being four percentage points lower than the corresponding ratios in the 2002-2004 study. The higher concentration of female experience at the smaller policy sizes and (to a lesser extent) at the older issue ages is a likely contributing factor. By issue age, actual-to-expected ratios (by amount) drop significantly after age 24, with age 25+ actual-to-expected ratios ranging from 61% to 73%. At ages below 25, actual-to-expected ratios range from 77% to 94%. Unlike in the 2002-2004 study, we do not see a spike in the ratio (to 81% in the 2002-2004 study) at ages 70-79 when the ratio is on a face amount basis. On a policy count basis, the spike in age 70-79 mortality ratios is exhibited in both the 2004-2005 and 2002-2004 studies. Drilling further into multi-dimensional views often shows other distinctive patterns. For example, for male policies below $500,000, the actual-to-expected ratios (by amount) exhibit a “U” shape with the lowest ratios at issue ages 40-59. As with the female-to-male relationship discussed above, the source of such relationships can often be traced to the distribution of business. In this instance, one contributing factor to the significantly higher actual-to-expected ratios at issue ages below 25 is the smaller size policies purchased at these ages. Mortality ratios are very low in the first duration (56% by amount), increasing to 70%-74% in durations 2 to 5, but notably, without the duration 3 (end of contestable period) spike exhibited in the 2002-2004 study. Ratios drop to the 63%-68% range at durations 6-20 (a significant improvement over the 2002-2004 study), and increase to 77% at select durations 21-25. Mortality ratios (by amount) steadily decrease with increasing policy size, from 102% for policies with face amounts between $1 and $9,999 to 55% for policies with face amounts of $1,000,000 to $2,499,999. Ratios increased to 60% (based on 105 deaths) in the $2,500,000 to $4,999,999 size band and to 74% (based on 57 deaths) in the $5,000,000+ size band. Although actual experience (death counts) at the highest sized bands is very limited, past studies have shown similar up-ticks in the mortality ratio. Unlike in the 2002-2004 study, we do not see a similar up-tick in the $2,500,000 and over size band mortality ratios on a policy count basis. The general trend of decreasing mortality ratios with increasing policy size is assumed to be attributed to an increase in underwriting as the face amount increases. Drilling into the detail for policies below $25,000 shows very high actual-to-expected ratios (by amount) at durations 5 and under. Although a definitive cause is not known, this experience may include guaranteed or simplified-issue business (not properly coded for exclusion from this study) or conversions with the date of conversion (instead of the date of issue of the original policy) listed as the policy issue date. The non-smoker mortality ratio is 64% of the non-smoker 2001 VBT (by amount) compared to 84% for smokers using the smoker 2001 VBT. Notably, comparable 2002-2004 study ratios of 68% for non-smokers and 85% for smokers suggest that mortality improvement has been concentrated in the non-smoker category. The ratio for policies with unknown smoking habits is 83% of the composite VBT.

Page 4
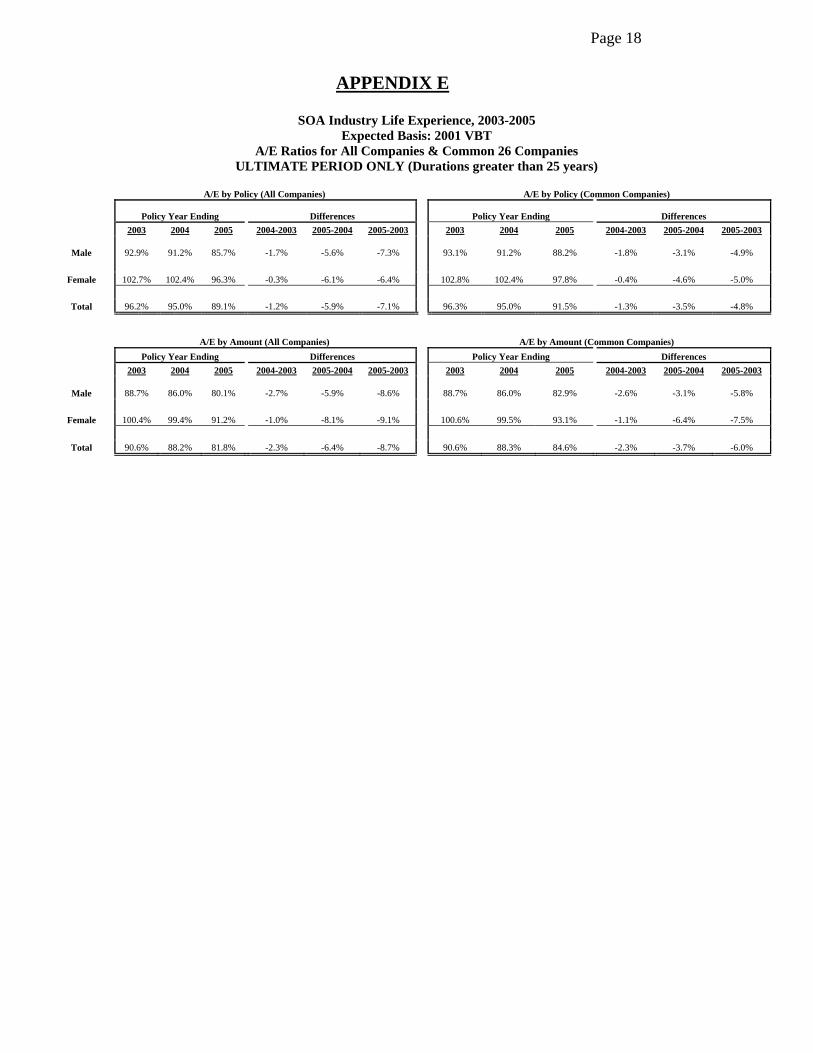
The overall mortality ratio (by amount) of 67% for the 2004-2005 study continues the overall apparent trend of improvement over time, with the prior 2002-2004 study showing mortality ratios of 70% for single year 2003-2004, and 73% for single year 2002-2003. Ultimate Period Results Based On 2001 VBT (Appendix B) Overall, the actual-to-expected ratio (by amount) in the ultimate period (durations 26+) was 82% of the 2001 VBT. This ratio dropped significantly from 91% for 2002-03 and 88% for 2003-04 observation years, but some of the change is due to differences in mix of companies in each study period. The mortality experience for the 26 common companies for 2002-03, 2003-04, and 2004-05 by face amount was 90.6%, 88.3%, and 84.6%. Additional details by individual study years and for the 26 common companies by gender and smoking status are included in Appendices E and F. Results differ significantly for males and females. The female actual-to-expected ratio (by amount) is 91%, while the male mortality ratio (by amount) is 80%. Mortality ratios for both males and females tend to be higher at the younger and older attained ages. Mortality ratios for males are highest between attained ages 25-49 at 103-145%, lowest between ages 60-69 at 75%, and increase to 86% at ages 90+. Mortality ratios for females are highest between ages 25-39 at 103-137%, lowest between ages 50-59 at 70% and increase to 111% at ages 90+. Interestingly, mortality ratios generally decrease by increasing face amount in the ultimate durations (as they did in the select period) suggesting that lower mortality associated with higher socio-economic status and/or, some impact of underwriting may persist beyond the 25-year select period. One exception is the female highest face amount band ($100,000 and over) where the mortality ratio is the highest at 100%. This may be due to lack of credibility as there are only 135 deaths in this band. Results By Preferred Class Structure (PCS) Based On 2001 VBT (Appendix C, Appendix D) As was true for the 2002-2004 study, contributors to the 2004-2005 Intercompany Study were asked to provide information related to their preferred risk class structure. In particular, companies were asked to provide a rank for each preferred class policy using "1" for the most restrictive preferred class,"2" for the next most restrictive preferred class, up to the total number of classes in their preferred structure. Companies were also asked to provide the total number of preferred classes in their preferred structure. Overall, 31 of the 42 companies contributing to the 2004-2005 study contributed at least some data by number of risk classes and risk class rank. For the 2002-2004 study, the many different preferred class structures were aggregated over all companies into one combined structure with three (3) non-smoker classes (or risk class ranks (PCS)) and two (2) smoker classes. For non-smokers, results in PCS Band 1 were the aggregate results of companies’ best preferred class. Results in PCS Band 3 were the results of companies’ residual standard class. Lastly, results for PCS Band 2 were the results for policies that fit into neither Band 1 nor Band 3. For example, if a company had four non-smoker classes, the experience for classes 2 and 3 would have been combined and reported in PCS Band 2. For smokers, results were provided for PCS Band 1 and PCS Band 3. Results for PCS Band 2 were immaterial because most companies with more than one smoker class had only two smoker classes. It should be noted that companies with a preferred class structure for non-smokers, but one class for smokers had only risk class rank data included for non-smokers.

Page 5
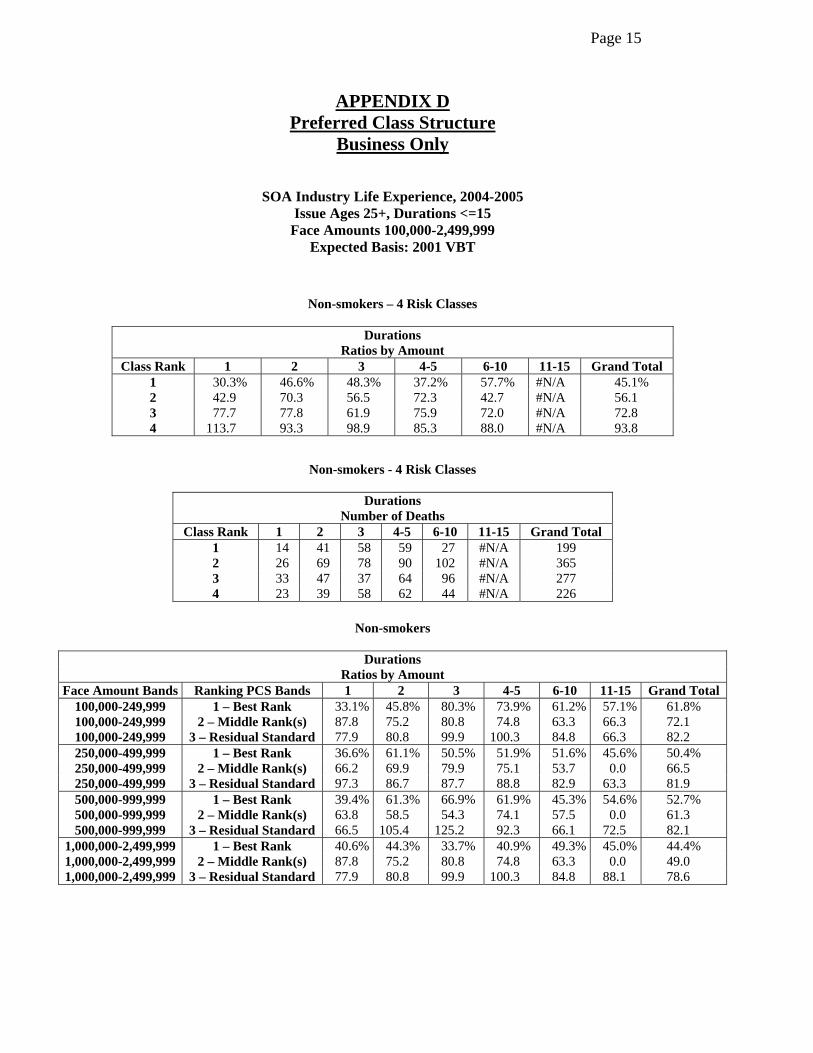
For the 2004-2005 study, preferred/residual standard experience is provided by number of risk classes and risk class rank. Preferred Indicator = 1 in the pivot tables indicates that the business was underwritten in a preferred class structure. The data request for both the 2002-2004 report and this report asked companies to classify the smoking status of each policy as unknown, no tobacco usage, non-smoker, cigarette smoker or tobacco user. The non-smoker category in the pivot table and experience summaries for this report consists of business classified as non-smoker or no tobacco usage and the smoker category is the business classified by contributing companies as cigarette smoker or tobacco user. Some companies allow some tobacco usage within a non-smoker classification (e.g. occasional cigar). This data would be classified as non-smoker. Only data for issue ages greater than or equal to 25, durations 1 to 15 and face amounts of $100,000 up to $2,500,000 are summarized in Appendices C and D. For 2004-2005, this block had just under $2 trillion of exposure and 7,935 deaths. Experience may include some lapse anti-selection effects since we were not able to exclude experience beyond the level premium period for level premium term plans. There may also be significant variations in experience by company. Overall (smoker/non-smoker and male/female combined), actual-to-expected ratios (2001 VBT S/NS expected basis) for this block of PCS business were 70% by policy and 65% by amount. Corresponding ratios for the 2002-2004 experience were 71% by policy and 67% by amount. It is not clear if the apparent decrease in mortality is real, due to changes in the contributing companies (i.e., different companies and/or different relative contributions) or due to other factors. For the non-smoker business, actual-to-expected ratios by amount increase by risk class rank from 52% for the best preferred classes (PCS Band 1, as described in the second paragraph of this section), to 60% for classes in the middle ranks (PCS Band 2), and to 81% for the residual standard group (PCS Band 3). Corresponding ratios from the 2002-2004 experience were 54%, 64% and 77%, respectively. For the smoker classes, ratios by amount for 2004-2005 were 79% for the preferred class and 102% for the residual group. Corresponding ratios for 2002-2004 were 74% and 96%, respectively. Although differences in mortality experience between risk classes appear to persist for the first 10-15 years (see Appendix D), there is insufficient experience to draw firm conclusions about whether (or how rapidly) A/E’s are converging, particularly when considering how convergence rates may differ by issue age, gender, face amount band, etc. When non-smoker experience is grouped into PCS Bands 1, 2 and 3, and each PCS Band is then split by face amount band, ratios tend to decrease as face amount band increases for a given PCS Band, although the decrease is very slight for PCS Band 3. The disparity between the best and worst classes, as measured by the ratio of the A/E for PCS Band 3 to the A/E for PCS Band 1, tends to increase as face amount band increases. When developing assumptions for multi-class business, actuaries sometimes use aggregate experience by smoking status and then make assumptions about relative mortality among classes and the proportion of the business that will be in each class. The table below summarizes the 2004-2005 experience by issue age band for two- and three-class non-smoker business and two-class smoker business. The experience for companies with four or more non-smoker classes is still too sparse to be very credible when broken down by issue age band.

Page 6
Table 1
2004-2005 Experience $100,000 - $2,499,999 – Male/Female Combined – Durations 1-15
(Expected Basis: 2001 VBT) % of Age Band Exposure
S/NS
# of Risk Class
Risk Class
Issue Ages
# of Deaths Dur 1 Dur 1-15 A/E
Ratio of A/Es*
NS 2 1 25-49 999 65.6% 71.5% 49.7% 100.0% 50-59 515 56.4 61.6 54.8 100.0 60+ 548 46.8 54.0 61.7 100.0 All 2,062 60.4% 69.4% 54.2% 100.0% 2 25-49 704 34.4% 28.5% 72.9% 146.7% 50-59 461 43.6 38.4 76.2 139.1 60+ 742 53.2 46.0 80.8 131.0 All 1,907 39.6% 30.6% 77.2% 142.4% 3 1 25-49 191 38.0% 40.3% 44.4% 100.0% 50-59 107 27.4 28.5 53.2 100.0 60+ 74 19.4 21.2 60.9 100.0 All 372 36.0% 38.1% 48.7% 100.0% 2 25-49 239 33.5% 33.2% 55.5% 125.0% 50-59 177 35.4 35.9 54.5 102.4 60+ 143 37.3 36.9 66.1 108.5 All 559 33.8% 33.7% 57.4% 117.9% 3 25-49 295 28.5% 26.5% 89.5% 201.6% 50-59 234 37.2 35.6 85.6 160.9 60+ 246 43.3 41.9 86.6 142.2 All 775 30.2% 28.2% 87.5% 179.7%
S 2 1 25-49 333 64.2% 65.5% 63.6% 100.0% 50-59 193 60.9 59.4 90.4 100.0 60+ 90 55.7 52.4 125.9 100.0 All 616 63.5% 64.3 78.6% 100.0% 2 25-49 218 35.8% 34.5% 86.7% 136.3% 50-59 133 39.1 40.6 89.2 98.7 60+ 117 44.3 47.6 160.2 127.2 All 468 36.5% 35.7% 101.8% 129.5%
* Ratio of A/E (in the adjacent column) to corresponding best class A/E for the same issue age group. Some observations based on the results summarized in the preceding table are:
1. For a given risk class structure, the percentage of the exposure in the best preferred class decreases as issue age increases. For the three non-smoker class structure, most of the decrease in best preferred class exposure appears as an increase in the residual class exposure since the exposure percentage for class 2 increases only slightly as issue age increases.
2. With few exceptions, A/E’s for a given risk class increase with issue age.
3. Looking at ratios of A/E’s to the best class A/E by issue age group in the last column of Table 1,
we can also see that ratios of A/E’s by issue age band for the 2004-2005 experience generally decrease as issue age increases. In other words, the differential in mortality results between the best and worst risk classes becomes smaller as issue age increases.
Ratios of A/E’s to the A/E for the best class, for all ages combined, are summarized below and compared to corresponding ratios for 2002-2004 experience of companies able to assign an underwriting criteria score (UCS) to their experience (see Appendix E of the PM/POG Interim Report on the SOA website under Individual Life Experience Studies – 2008 Preferred Mortality Reports). The differences in the ratios among the classes appear to be significantly less for the 2004-2005 experience study than for the 2002-2004 UCS data. One driver of the difference is a different mix of participating companies. Thirty-

Page 7
one companies contributed preferred data to the 2004-2005 study, while only 18 of these companies were included in the 2002-2004 UCS results.
Table 2 $100,000 - $2,499,999 – Male/Female Combined – Issue Ages 25+
Durations 1-10 for 2002-2004 UCS Durations 1-15 for 2004-2005 (Expected Basis: 2001 VBT)
2002-2004 UCS 2004-2005
S/NS # of Risk Classes
Risk Class # of Deaths A/E
Ratios of A/Es # of Deaths A/E
Ratios of A/Es
NS 2 1 811 49.9% 100.0% 2,062 54.2% 100.0% 2 965 95.6 191.6 1,907 77.2 142.4 3 1 565 51.6% 100.0% 372 48.7% 100.0% 2 661 67.8 131.4 559 57.4 117.9 3 978 101.5 196.7 775 87.5 179.7 S 2 1 404 73.4% 100.0% 616 78.6% 100.0% 2 349 113.2 154.2 468 101.8 129.5
The A/E Ratios in the last column of Table 2 come from corresponding all ages A/E ratios in the last column of Table 1.

Page 8
The Individual Life Insurance Experience Committee of the Society of Actuaries wishes to thank the following companies that contributed to the 2004-2005 study: AAA Life Insurance Mutual of Omaha Amerus (Aviva) North American Co-Life/Health AUL - OneAmerica (NACOLAH) AXA Financial – AXA-Equitable Nationwide Financial AXA Financial - MONY Nationwide Life & Annuity Columbus Life New York Life Connecticut Mutual Northwestern Mutual Empire General Ohio National Farm Bureau Financial Pacific Life Farm Family Penn Mutual Fidelity Investments Protective Life Genworth Financial Protective Life & Annuity Government Personnel Mutual Life Prudential Guardian Life State Farm Horace Mann Sun Life Financial ING Thrivent Financial Jackson National Life TIAA-CREF John Hancock Transamerica Occidental Liberty Mutual USAA Life Massachusetts Mutual Life West Coast Life Metropolitan Life Western & Southern Minnesota Life (Securian Financial) Members of the Individual Life Insurance Experience Committee:
Mary J. Bahna-Nolan Paul Langevin** Rick Bergstrom (Chairperson) Melvin C. McFall Sharon Brody (Vice-Chairperson) Tony R. Phipps Jeffery T. Dukes Mark P. Rosa Barry Edenbaum Lynn A. Ruezinsky Jill A. Garofalo Nick James Sales Dieter S. Gaubatz Jeffrey Steven Schwartz Anna Hart* (Secretary) Eric T. Sondergeld Edward Hui Edward J. Wright Douglas A. Ingle* Society of Actuaries Representatives: Korrel Crawford and John A. Luff MIB Representatives: Jaron Arboleda, Jan Palmbach and Tom Rhodes Report Peer Reviewers: Faye Albert, Doug Doll and Susan Miner *Underwriting professional. ** Quantitative specialist.

Page 9
APPENDIX A
SOA Industry Life Experience, 2004-2005 Expected Basis: 2001 VBT
SELECT PERIOD ONLY (Dur <=25) Amounts in $1,000,000 Units
Actual Deaths by
Policy
Expected Deaths by
Policy
Ratio by
Policy Actual Deaths
by Amount
Expected Deaths by Amount
Ratio by
AmountExposure by Policy
% Exposure by Policy
Exposure by Amount
% Exposure
by Amount
% Expected
by AmountOverall 111,810 135,203 83% $8,605 $12,767 67% 29,014,145 100.0% $4,676,777 100.0% 100.0%
Issue Age 0 433 485 89% $11 $14 77% 1,346,009 4.6% $44,849 1.0% 0.1%
1-4 470 483 97% $13 $16 83% 1,288,547 4.4% $49,380 1.1% 0.1% 5-9 528 451 117% $15 $16 93% 932,806 3.2% $37,326 0.8% 0.1% 10-17 1,080 954 113% $34 $36 94% 1,387,833 4.8% $57,221 1.2% 0.3% 18-24 1,969 2,035 97% $88 $109 81% 2,249,453 7.8% $152,991 3.3% 0.9% 25-29 3,084 3,741 82% $224 $322 70% 3,130,498 10.8% $405,850 8.7% 2.5% 30-34 4,973 6,638 75% $525 $772 68% 4,097,460 14.1% $813,798 17.4% 6.0% 35-39 7,089 9,605 74% $749 $1,228 61% 4,033,208 13.9% $939,831 20.1% 9.6% 40-49 20,394 27,018 75% $2,053 $3,222 64% 5,910,735 20.4% $1,361,103 29.1% 25.2% 50-59 30,586 37,539 81% $2,246 $3,338 67% 3,162,522 10.9% $604,200 12.9% 26.1% 60-69 31,327 35,908 87% $1,717 $2,390 72% 1,237,799 4.3% $164,836 3.5% 18.7% 70-79 9,172 9,514 96% $744 $1,016 73% 221,042 0.8% $38,127 0.8% 8.0% 80+ 705 832 85% $185 $288 64% 16,233 0.1% $7,264 0.2% 2.3%
Gender Female 45,189 54,153 83% $2,261 $3,294 69% 12,902,540 44.5% $1,452,087 31.0% 25.8% Male 66,621 81,050 82% $6,345 $9,473 67% 16,111,604 55.5% $3,224,690 69.0% 74.2%
Duration 1 1,059 1,265 84% $256 $455 56% 1,838,661 6.3% $597,538 12.8% 3.6% 2 1,557 1,746 89% $417 $598 70% 1,804,825 6.2% $586,181 12.5% 4.7% 3 1,980 2,120 93% $466 $642 73% 1,805,590 6.2% $532,100 11.4% 5.0% 4-5 4,075 4,418 92% $870 $1,169 74% 2,993,008 10.3% $746,100 16.0% 9.2% 6-10 13,584 16,083 84% $1,873 $2,994 63% 6,320,323 21.8% $1,182,019 25.3% 23.5% 11-15 22,962 29,291 78% $1,839 $2,825 65% 5,556,270 19.2% $550,068 11.8% 22.1% 16-20 36,434 46,302 79% $1,987 $2,916 68% 5,453,575 18.8% $365,120 7.8% 22.8% 21-25 30,159 33,978 89% $897 $1,168 77% 3,241,892 11.2% $117,651 2.5% 9.1%
Size 1-9,999 25,749 25,353 102% $124 $121 102% 1,399,714 4.8% $7,075 0.2% 0.9%
10,000-24,999 24,308 27,075 90% $299 $338 89% 4,159,472 14.3% $54,009 1.2% 2.6%
25,000-49,999 17,781 21,514 83% $510 $621 82% 4,325,901 14.9% $120,898 2.6% 4.9%
50,000-99,999 19,135 24,987 77% $1,078 $1,415 76% 5,645,202 19.5% $312,882 6.7% 11.1%
100,000-249,999 17,192 24,253 71% $2,114 $3,034 70% 7,763,731 26.8% $972,985 20.8% 23.8%
250,000-499,999 4,465 6,758 66% $1,296 $1,984 65% 3,183,387 11.0% $912,247 19.5% 15.5%
500,000-999,999 2,034 3,256 62% $1,153 $1,852 62% 1,621,199 5.6% $901,627 19.3% 14.5%
1,000,000-2,499,999 984 1,741 57% $1,184 $2,151 55% 828,314 2.9% $998,002 21.3% 16.8%
2,500,000-4,999,999 105 174 60% $331 $553 60% 59,368 0.2% $184,756 4.0% 4.3%
5,000,000+ 57 91 62% $517 $698 74% 27,857 0.1% $212,297 4.5% 5.5%
Smkr Status Non-Smoker 67,710 89,241 76% $6,857 $10,673 64% 22,560,794 77.8% $4,254,250 91.0% 83.6% Smoker 28,853 30,925 93% $1,498 $1,793 84% 3,646,719 12.6% $336,993 7.2% 14.0% Unknown 15,247 15,038 101% $250 $301 83% 2,806,632 9.7% $85,534 1.8% 2.4%
Page 10
APPENDIX A
SOA Industry Life Experience, 2004-2005Expected Basis: 2001 VBT
SELECT PERIOD ONLY (Dur<=25)A/E Ratios by Gender and Smoker Status
Actual Deaths by
PolicyA/E Ratio by Policy
A/E Ratio by
Amount
Actual Deaths by
PolicyA/E Ratio by Policy
A/E Ratio by
Amount
Actual Deaths by
PolicyA/E Ratio by Policy
A/E Ratio by
Amount
Actual Deaths by
PolicyA/E Ratio by Policy
A/E Ratio by
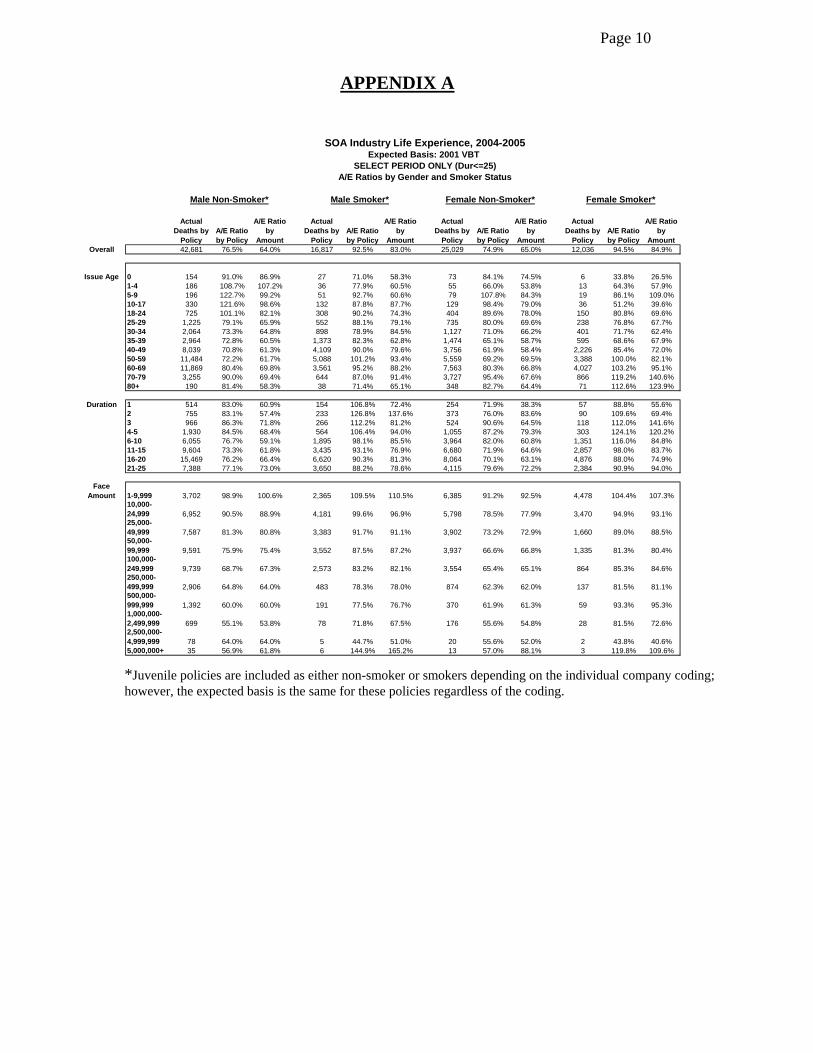
AmountOverall 42,681 76.5% 64.0% 16,817 92.5% 83.0% 25,029 74.9% 65.0% 12,036 94.5% 84.9%
Issue Age 0 154 91.0% 86.9% 27 71.0% 58.3% 73 84.1% 74.5% 6 33.8% 26.5%1-4 186 108.7% 107.2% 36 77.9% 60.5% 55 66.0% 53.8% 13 64.3% 57.9%5-9 196 122.7% 99.2% 51 92.7% 60.6% 79 107.8% 84.3% 19 86.1% 109.0%10-17 330 121.6% 98.6% 132 87.8% 87.7% 129 98.4% 79.0% 36 51.2% 39.6%18-24 725 101.1% 82.1% 308 90.2% 74.3% 404 89.6% 78.0% 150 80.8% 69.6%25-29 1,225 79.1% 65.9% 552 88.1% 79.1% 735 80.0% 69.6% 238 76.8% 67.7%30-34 2,064 73.3% 64.8% 898 78.9% 84.5% 1,127 71.0% 66.2% 401 71.7% 62.4%35-39 2,964 72.8% 60.5% 1,373 82.3% 62.8% 1,474 65.1% 58.7% 595 68.6% 67.9%40-49 8,039 70.8% 61.3% 4,109 90.0% 79.6% 3,756 61.9% 58.4% 2,226 85.4% 72.0%50-59 11,484 72.2% 61.7% 5,088 101.2% 93.4% 5,559 69.2% 69.5% 3,388 100.0% 82.1%60-69 11,869 80.4% 69.8% 3,561 95.2% 88.2% 7,563 80.3% 66.8% 4,027 103.2% 95.1%70-79 3,255 90.0% 69.4% 644 87.0% 91.4% 3,727 95.4% 67.6% 866 119.2% 140.6%80+ 190 81.4% 58.3% 38 71.4% 65.1% 348 82.7% 64.4% 71 112.6% 123.9%
Duration 1 514 83.0% 60.9% 154 106.8% 72.4% 254 71.9% 38.3% 57 88.8% 55.6%2 755 83.1% 57.4% 233 126.8% 137.6% 373 76.0% 83.6% 90 109.6% 69.4%3 966 86.3% 71.8% 266 112.2% 81.2% 524 90.6% 64.5% 118 112.0% 141.6%4-5 1,930 84.5% 68.4% 564 106.4% 94.0% 1,055 87.2% 79.3% 303 124.1% 120.2%6-10 6,055 76.7% 59.1% 1,895 98.1% 85.5% 3,964 82.0% 60.8% 1,351 116.0% 84.8%11-15 9,604 73.3% 61.8% 3,435 93.1% 76.9% 6,680 71.9% 64.6% 2,857 98.0% 83.7%16-20 15,469 76.2% 66.4% 6,620 90.3% 81.3% 8,064 70.1% 63.1% 4,876 88.0% 74.9%21-25 7,388 77.1% 73.0% 3,650 88.2% 78.6% 4,115 79.6% 72.2% 2,384 90.9% 94.0%
Face Amount 1-9,999 3,702 98.9% 100.6% 2,365 109.5% 110.5% 6,385 91.2% 92.5% 4,478 104.4% 107.3%
10,000-24,999 6,952 90.5% 88.9% 4,181 99.6% 96.9% 5,798 78.5% 77.9% 3,470 94.9% 93.1%25,000-49,999 7,587 81.3% 80.8% 3,383 91.7% 91.1% 3,902 73.2% 72.9% 1,660 89.0% 88.5%50,000-99,999 9,591 75.9% 75.4% 3,552 87.5% 87.2% 3,937 66.6% 66.8% 1,335 81.3% 80.4%100,000-249,999 9,739 68.7% 67.3% 2,573 83.2% 82.1% 3,554 65.4% 65.1% 864 85.3% 84.6%250,000-499,999 2,906 64.8% 64.0% 483 78.3% 78.0% 874 62.3% 62.0% 137 81.5% 81.1%500,000-999,999 1,392 60.0% 60.0% 191 77.5% 76.7% 370 61.9% 61.3% 59 93.3% 95.3%1,000,000-2,499,999 699 55.1% 53.8% 78 71.8% 67.5% 176 55.6% 54.8% 28 81.5% 72.6%2,500,000-4,999,999 78 64.0% 64.0% 5 44.7% 51.0% 20 55.6% 52.0% 2 43.8% 40.6%5,000,000+ 35 56.9% 61.8% 6 144.9% 165.2% 13 57.0% 88.1% 3 119.8% 109.6%
Male Non-Smoker* Male Smoker* Female Non-Smoker* Female Smoker*
*Juvenile policies are included as either non-smoker or smokers depending on the individual company coding; however, the expected basis is the same for these policies regardless of the coding.

Page 11
APPENDIX B
SOA Industry Life Experience, 2004-2005
Expected Basis: 2001 VBT ULTIMATE PERIOD ONLY (Dur 26+)
Amounts in $1,000,000 Units
Actual Deaths
by Policy
Expected Deaths by
Policy Ratio
by Policy Actual Deaths
by Amount
Expected Deaths by Amount
Ratio by
AmountExposure by Policy
% Exposure by Policy
Exposure by Amount
% Exposure
by Amount
% Expected
by Amount
Overall 269,974 302,860 89% $1,457 $1,780 82% 11,327,363 100.0% $79,112 100.0% 100.0%
Gender Female 95,181 98,815 96% $253 $278 91% 4,553,175 40.2% $19,406 24.5% 15.6%
Male 174,793 204,045 86% $1,204 $1,503 80% 6,774,188 59.8% $59,705 75.5% 84.4%
MALE Only Ultimate Period Data
Attained Age 25-29 152 129 118% $1 $1 103% 129,256 1.1% $1,132 1.4% 0.1%
30-34 217 168 129% $2 $1 128% 175,450 1.5% $1,237 1.6% 0.1%
35-39 365 244 150% $2 $1 145% 214,765 1.9% $1,274 1.6% 0.1%
40-49 2,153 1,693 127% $14 $13 111% 734,752 6.5% $5,383 6.8% 0.7%
50-59 7,550 8,249 92% $73 $89 82% 1,477,094 13.0% $15,678 19.8% 5.0%
60-69 18,556 23,005 81% $176 $234 75% 1,570,723 13.9% $16,191 20.5% 13.1%
70-79 47,223 55,229 86% $358 $461 78% 1,439,848 12.7% $12,203 15.4% 25.9%
80-89 74,001 86,277 86% $457 $562 81% 890,332 7.9% $5,916 7.5% 31.6%
90+ 24,576 29,050 85% $121 $141 86% 141,968 1.3% $691 0.9% 7.9%
Size 1-9,999 132,679 151,195 88% $413 $466 89% 4,378,476 38.7% $15,091 19.1% 26.2%
10,000-24,999 33,944 42,158 81% $399 $500 80% 1,940,069 17.1% $23,294 29.4% 28.1%
25,000-49,999 5,143 6,721 77% $145 $192 75% 307,328 2.7% $8,758 11.1% 10.8%
50,000-99,999 2,134 2,728 78% $118 $152 78% 102,182 0.9% $5,731 7.2% 8.6%
100,000+ 893 1,242 72% $128 $192 66% 46,133 0.4% $6,832 8.6% 10.8%
FEMALE Only Ultimate Period Data
Attained Age 25-29 63 54 116% $0 $0 116% 113,771 1.0% $881 1.1% 0.0%
30-34 87 94 93% $1 $1 137% 149,695 1.3% $884 1.1% 0.0%
35-39 158 161 98% $1 $1 103% 180,749 1.6% $829 1.0% 0.0%
40-49 1,011 959 105% $5 $5 96% 582,488 5.1% $2,872 3.6% 0.3%
50-59 3,185 4,336 73% $17 $24 70% 969,429 8.6% $5,334 6.7% 1.3%
60-69 6,587 8,181 81% $29 $38 77% 790,534 7.0% $3,746 4.7% 2.1%
70-79 22,535 24,256 93% $66 $74 89% 936,403 8.3% $2,950 3.7% 4.2%
80-89 43,729 43,842 100% $97 $101 96% 708,906 6.3% $1,662 2.1% 5.7%
90+ 17,826 16,932 105% $38 $34 111% 121,200 1.1% $248 0.3% 1.9%
Size 1-9,999 90,297 92,910 97% $159 $166 96% 3,929,523 34.7% $9,700 12.3% 9.3%
10,000-24,999 3,899 4,730 82% $44 $55 81% 544,239 4.8% $6,280 7.9% 3.1%
25,000-49,999 604 745 81% $17 $21 81% 56,992 0.5% $1,584 2.0% 1.2%
50,000-99,999 246 300 82% $13 $16 82% 15,785 0.1% $870 1.1% 0.9%
100,000+ 135 131 103% $19 $19 100% 6,635 0.1% $972 1.2% 1.1%

Page 12
APPENDIX C*
SOA Industry Life Experience, 2004-2005Preferred Class Structure Business Only
Expected Basis: 2001 VBT
Issue Ages 25+, Duration <=15, Face Amt 100K up to 2.5M
Actual Deaths by Policy
Expected Deaths by
PolicyRatio
by PolicyActual Deaths
by Amount
Expected Deaths by Amount
Ratio by Amount
Exposure by Policy
% Exposure by Policy
Exposure by Amount
% Exposure by Amount
% Expected by Amount
Overall 7,935 11,313 70% $2,171 $3,354 65% 6,108,316 100.0% $1,989,943 100.0% 100.0%
Issue Age 25-29 220 318 69% $49 $75 66% 628,825 10.3% $161,582 8.1% 2.2%30-34 436 701 62% $120 $201 60% 1,113,883 18.2% $361,859 18.2% 6.0%35-39 739 1,097 67% $208 $331 63% 1,242,914 20.3% $433,115 21.8% 9.9%40-49 1,995 3,118 64% $541 $935 58% 1,911,677 31.3% $655,656 32.9% 27.9%50-59 2,224 3,163 70% $579 $908 64% 928,349 15.2% $292,264 14.7% 27.1%60-69 1,526 1,877 81% $409 $521 79% 237,701 3.9% $69,046 3.5% 15.5%70-79 608 804 76% $180 $276 65% 39,546 0.6% $13,770 0.7% 8.2%80+ 187 235 80% $85 $107 79% 5,422 0.1% $2,652 0.1% 3.2%
Gender Female 2,264 3,328 68% $563 $856 66% 2,380,637 39.0% $609,300 30.6% 25.5%Male 5,671 7,984 71% $1,609 $2,498 64% 3,727,679 61.0% $1,380,643 69.4% 74.5%
Duration 1 411 614 67% $138 $242 57% 859,701 14.1% $352,586 17.7% 7.2%2 642 874 73% $218 $327 67% 870,578 14.3% $340,486 17.1% 9.8%3 841 1,026 82% $242 $351 69% 840,078 13.8% $295,723 14.9% 10.5%4-5 1,529 1,935 79% $438 $608 72% 1,240,893 20.3% $390,136 19.6% 18.1%6-10 3,006 4,475 67% $806 $1,290 63% 1,772,320 29.0% $508,869 25.6% 38.4%11-15 1,506 2,390 63% $330 $537 61% 524,746 8.6% $102,144 5.1% 16.0%
Face Amount 100,000-249,999 4,769 6,363 75% $589 $797 74% 2,855,114 46.7% $365,044 18.3% 23.8%250,000-499,999 1,798 2,754 65% $514 $789 65% 1,823,186 29.8% $515,027 25.9% 23.5%500,000-999,999 896 1,382 65% $504 $770 65% 929,512 15.2% $509,842 25.6% 23.0%1,000,000-2,499,999 472 814 58% $564 $998 57% 500,505 8.2% $600,030 30.2% 29.7%
PCS Nonsmoker 1 - Best Rank 2,664 4,691 57% $749 $1,453 52% 2,825,355 46.3% $932,778 46.9% 43.3%2 - Middle Rank(s) 1,271 1,873 68% $390 $650 60% 1,295,405 21.2% $494,350 24.8% 19.4%3 - Residual Standard 2,916 3,529 83% $793 $978 81% 1,589,987 26.0% $468,202 23.5% 29.2%
PCS Smoker 1 - Best Rank 616 767 80% $132 $168 79% 256,249 4.2% $60,835 3.1% 5.0%3 - Residual Standard 468 452 103% $106 $104 102% 141,321 2.3% $33,779 1.7% 3.1%
Class Rank 1 2062 3,531 58% $533 $984 54% 1,730,436 28.3% $457,044 23.0% 29.3%2 1907 2,452 78% $495 $641 77% 817,898 13.4% $201,540 10.1% 19.1%
Class Rank 1 372 711 52% $126 $258 49% 703,527 11.5% $288,427 14.5% 7.7%2 559 827 68% $161 $280 57% 691,494 11.3% $255,186 12.8% 8.4%3 775 832 93% $229 $262 88% 616,668 10.1% $213,903 10.7% 7.8%
Class Rank 1 199 378 53% $85 $188 45% 358,528 5.9% $175,694 8.8% 5.6%2 365 571 64% $118 $210 56% 330,784 5.4% $136,572 6.9% 6.3%3 277 375 74% $95 $131 73% 239,603 3.9% $92,115 4.6% 3.9%4 226 238 95% $68 $73 94% 152,699 2.5% $51,950 2.6% 2.2%
Amounts in $1,000,000 Units
PCS Nonsmoker - 2 Risk Classes
PCS Nonsmoker - 3 Risk Classes
PCS Nonsmoker - 4 Risk Classes
∗ Data in Appendix C includes small amount of data with more than 4 risk classes, but not considered credible enough to report separately.

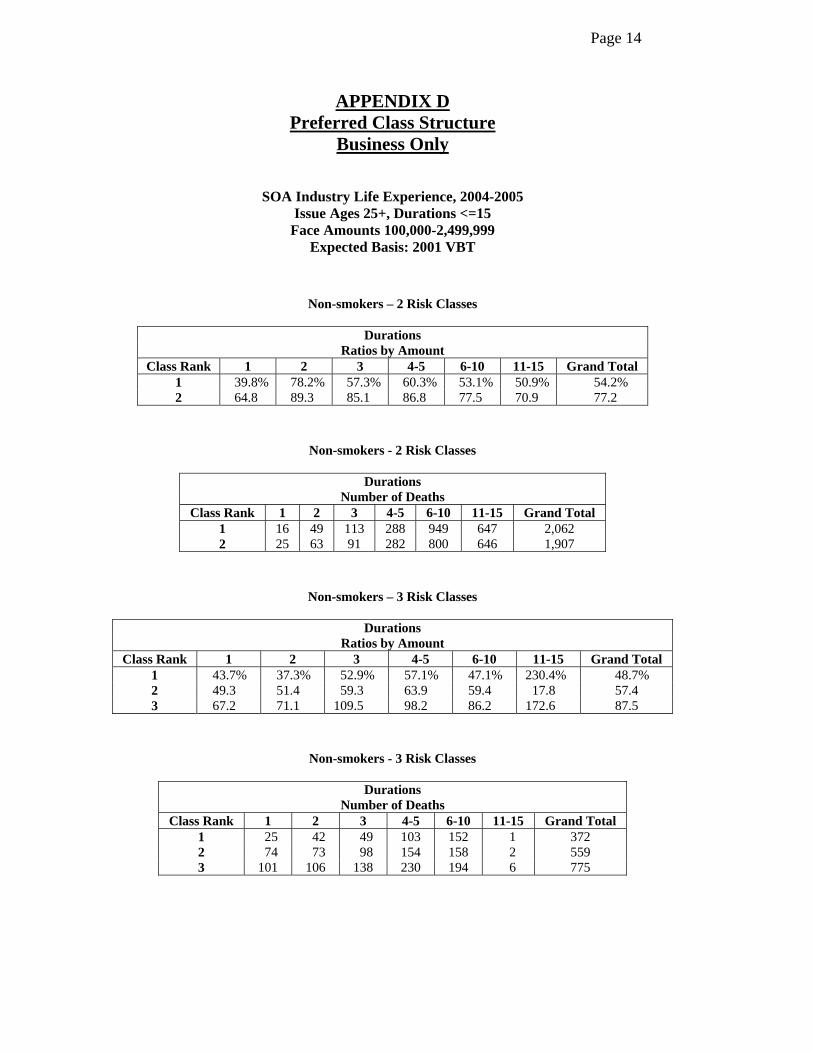
Page 13
APPENDIX D Preferred Class Structure
Business Only
SOA Industry Life Experience, 2004-2005 Issue Ages 25+, Durations <=15
Face Amounts 100,000-2,499,999 Expected Basis: 2001 VBT
Non-smokers
Durations Ratios by Amount
Ranking PCS Bands 1 2 3 4-5 6-10 11-15 Grand Total
1 – Best Rank 38.9% 52.5% 52.5% 54.9% 51.6% 51.1% 51.6% 2 – Middle Rank(s) 53.4 63.5 58.6 68.1 56.5 17.8 60.0
3 – Residual Standard 72.3 80.3 99.0 90.9 79.4 71.4 81.1
Non-smokers
Durations Number of Deaths
Ranking PCS Bands 1 2 3 4-5 6-10 11-15 Grand Total 1 – Best Rank 55 132 220 450 1,159 648 2,664
2 – Middle Rank(s) 133 189 214 311 422 2 1,271 3 – Residual Standard 149 208 287 574 1,046 652 2,916
Smokers
Durations Ratios by Amount
Ranking PCS Bands 1 2 3 4-5 6-10 11-15 Grand Total 1 - Best Rank 71.4% 102.4% 81.9% 82.3% 77.2% 66.0% 54.2%
3 - Residual Standard 86.0 80.2 86.6 117.1 106.9 105.2 77.2
Smokers
Durations Number of Deaths
Ranking PCS Bands 1 2 3 4-5 6-10 11-15 Grand Total 1 - Best Rank 41 65 64 99 211 136 616
3 - Residual Standard 33 48 56 95 168 68 468
Page 14
APPENDIX D
Preferred Class Structure Business Only
SOA Industry Life Experience, 2004-2005 Issue Ages 25+, Durations <=15
Face Amounts 100,000-2,499,999 Expected Basis: 2001 VBT
Non-smokers – 2 Risk Classes
Durations Ratios by Amount
Class Rank 1 2 3 4-5 6-10 11-15 Grand Total 1 39.8% 78.2% 57.3% 60.3% 53.1% 50.9% 54.2% 2 64.8 89.3 85.1 86.8 77.5 70.9 77.2
Non-smokers - 2 Risk Classes
Durations Number of Deaths
Class Rank 1 2 3 4-5 6-10 11-15 Grand Total 1 16 49 113 288 949 647 2,062 2 25 63 91 282 800 646 1,907
Non-smokers – 3 Risk Classes
Durations Ratios by Amount
Class Rank 1 2 3 4-5 6-10 11-15 Grand Total 1 43.7% 37.3% 52.9% 57.1% 47.1% 230.4% 48.7% 2 49.3 51.4 59.3 63.9 59.4 17.8 57.4 3 67.2 71.1 109.5 98.2 86.2 172.6 87.5
Non-smokers - 3 Risk Classes
Durations Number of Deaths
Class Rank 1 2 3 4-5 6-10 11-15 Grand Total 1 25 42 49 103 152 1 372 2 74 73 98 154 158 2 559 3 101 106 138 230 194 6 775
Page 15
APPENDIX D
Preferred Class Structure Business Only
SOA Industry Life Experience, 2004-2005 Issue Ages 25+, Durations <=15
Face Amounts 100,000-2,499,999 Expected Basis: 2001 VBT
Non-smokers – 4 Risk Classes
Durations Ratios by Amount
Class Rank 1 2 3 4-5 6-10 11-15 Grand Total 1 30.3% 46.6% 48.3% 37.2% 57.7% #N/A 45.1% 2 42.9 70.3 56.5 72.3 42.7 #N/A 56.1 3 77.7 77.8 61.9 75.9 72.0 #N/A 72.8 4 113.7 93.3 98.9 85.3 88.0 #N/A 93.8
Non-smokers - 4 Risk Classes
Durations
Number of Deaths Class Rank 1 2 3 4-5 6-10 11-15 Grand Total
1 14 41 58 59 27 #N/A 199 2 26 69 78 90 102 #N/A 365 3 33 47 37 64 96 #N/A 277 4 23 39 58 62 44 #N/A 226
Non-smokers
Durations
Ratios by Amount Face Amount Bands Ranking PCS Bands 1 2 3 4-5 6-10 11-15 Grand Total
100,000-249,999 1 – Best Rank 33.1% 45.8% 80.3% 73.9% 61.2% 57.1% 61.8% 100,000-249,999 2 – Middle Rank(s) 87.8 75.2 80.8 74.8 63.3 66.3 72.1 100,000-249,999 3 – Residual Standard 77.9 80.8 99.9 100.3 84.8 66.3 82.2 250,000-499,999 1 – Best Rank 36.6% 61.1% 50.5% 51.9% 51.6% 45.6% 50.4% 250,000-499,999 2 – Middle Rank(s) 66.2 69.9 79.9 75.1 53.7 0.0 66.5 250,000-499,999 3 – Residual Standard 97.3 86.7 87.7 88.8 82.9 63.3 81.9 500,000-999,999 1 – Best Rank 39.4% 61.3% 66.9% 61.9% 45.3% 54.6% 52.7% 500,000-999,999 2 – Middle Rank(s) 63.8 58.5 54.3 74.1 57.5 0.0 61.3 500,000-999,999 3 – Residual Standard 66.5 105.4 125.2 92.3 66.1 72.5 82.1
1,000,000-2,499,999 1 – Best Rank 40.6% 44.3% 33.7% 40.9% 49.3% 45.0% 44.4% 1,000,000-2,499,999 2 – Middle Rank(s) 87.8 75.2 80.8 74.8 63.3 0.0 49.0 1,000,000-2,499,999 3 – Residual Standard 77.9 80.8 99.9 100.3 84.8 88.1 78.6

Page 16
APPENDIX D Preferred Class Structure Only SOA Industry Life Experience, 2004-2005
Issue Ages 25+, Durations <=15 Face Amounts 100,000-2,499,999
Expected Basis: 2001 VBT
Non-smokers
Durations Number of Deaths
Face Amount Bands Ranking PCS Bands 1 2 3 4-5 6-10 11-15 Grand Total 100,000-249,999 1 - Best Rank 13 37 116 258 677 466 1,567 100,000-249,999 2 - Middle Rank(s) 64 83 108 156 229 2 642 100,000-249,999 3 - Residual Standard 60 94 160 339 671 465 1,789 250,000-499,999 1 - Best Rank 18 46 49 100 287 108 608 250,000-499,999 2 - Middle Rank(s) 38 57 67 86 96 0 344 250,000-499,999 3 - Residual Standard 57 60 61 135 240 103 656 500,000-999,999 1 - Best Rank 13 32 40 66 121 50 322 500,000-999,999 2 - Middle Rank(s) 23 28 26 47 62 0 186 500,000-999,999 3 - Residual Standard 20 39 46 66 80 50 301
1,000,000-2,499,999 1 - Best Rank 11 17 15 26 74 24 167 1,000,000-2,499,999 2 - Middle Rank(s) 8 21 13 22 35 0 99 1,000,000-2,499,999 3 - Residual Standard 12 15 20 34 55 34 170
Smokers
Durations Ratios by Amount
Face Amount Bands Ranking PCS Bands 1 2 3 4-5 6-10 11-15 Grand Total 100,000-249,999 1 – Best Rank 75.5% 108.8% 104.3% 78.5% 76.3% 78.2% 81.7% 100,000-249,999 3 – Residual Standard 104.0 138.1 134.5 117.6 99.4 80.1 107.4 250,000-499,999 1 – Best Rank 78.1% 117.4% 68.8% 82.4% 55.4% 60.6% 71.0% 250,000-499,999 3 – Residual Standard 83.7 68.5 85.0 90.0 98.6 120.0 93.8 500,000-999,999 1 – Best Rank 77.1% 112.4% 101.2% 103.9% 74.2% 32.1% 83.9% 500,000-999,999 3 – Residual Standard 109.5 44.3 101.7 113.8 105.7 218.5 114.2
1,000,000-2,499,999 1 – Best Rank 55.3% 68.4% 49.4% 67.1% 110.3% 38.0% 76.9% 1,000,000-2,499,999 3 – Residual Standard 46.8 41.9 0.0 151.1 136.2 38.0 89.6%
Smokers
Durations
Number of Deaths Face Amount
Bands Ranking PCS Bands 1 2 3 4-5 6-10 11-15 Grand Total 100,000-249,999 1 - Best Rank 24 38 44 61 157 122 446 100,000-249,999 3 - Residual Standard 21 38 43 65 114 44 325 250,000-499,999 1 - Best Rank 10 18 12 22 30 11 103 250,000-499,999 3 - Residual Standard 7 7 8 16 34 15 87 500,000-999,999 1 - Best Rank 5 7 6 12 15 2 47 500,000-999,999 3 - Residual Standard 4 2 5 8 13 8 40
1,000,000-2,499,999 1 - Best Rank 2 2 2 4 9 1 20 1,000,000-2,499,999 3 - Residual Standard 1 1 0 6 7 1 16

Page 17
APPENDIX E
SOA Industry Life Experience, 2003-2005 Expected Basis: 2001 VBT
A/E Ratios for All Companies & Common 26 Companies SELECT PERIOD ONLY (Durations less than or equal to 25 years)
A/E by Policy (All Companies) A/E by Policy (Common Companies)
Policy Year Ending Differences Policy Year Ending Differences 2003 2004 2005 2004-2003 2005-2004 2005-2003 2003 2004 2005 2004-2003 2005-2004 2005-2003
Male Non-smoker 82.9% 79.8% 76.5% -3.1% -3.3% -6.4% 83.0% 79.5% 76.7% -3.5% -2.8% -6.3%
Male Smoker 97.6% 95.9% 92.5% -1.7% -3.4% -5.1% 97.7% 95.8% 93.0% -2.0% -2.8% -4.8%
Male Unknown 107.0% 103.6% 100.9% -3.5% -2.7% -6.1% 107.1% 103.4% 100.5% -3.6% -2.9% -6.5%
Female Non-
smoker 80.6% 78.0% 74.9% -2.6% -3.2% -5.8% 80.6% 78.3% 75.6% -2.3% -2.7% -5.0%
Female Smoker 97.5% 98.5% 94.5% 1.0% -4.0% -3.0% 97.6% 98.0% 95.9% 0.4% -2.1% -1.8%
Female Unknown 102.8% 105.5% 101.8% 2.7% -3.7% -0.9% 102.9% 105.7% 101.5% 2.7% -4.1% -1.4%
Total 89.6% 86.8% 82.7% -2.8% -4.1% -6.9% 89.9% 86.9% 83.3% -3.0% -3.7% -6.6%
A/E by Amount (All Companies) A/E by Amount (Common Companies)
Policy Year Ending Differences Policy Year Ending Differences 2003 2004 2005 2004-2003 2005-2004 2005-2003 2003 2004 2005 2004-2003 2005-2004 2005-2003
Male Non-smoker 70.1% 66.3% 64.0% -3.8% -2.4% -6.1% 70.5% 66.7% 65.3% -3.8% -1.4% -5.2%
Male Smoker 82.9% 84.0% 83.0% 1.1% -0.9% 0.1% 83.2% 83.5% 86.4% 0.3% 2.9% 3.1%
Male Unknown 81.9% 86.2% 81.1% 4.3% -5.1% -0.8% 81.1% 86.3% 79.1% 5.3% -7.3% -2.0%
Female Non-
smoker 69.4% 68.5% 65.0% -0.9% -3.5% -4.4% 70.0% 70.7% 67.8% 0.8% -2.9% -2.2%
Female Smoker 89.2% 89.1% 84.9% -0.1% -4.2% -4.3% 90.0% 88.8% 89.1% -1.2% 0.3% -0.9%
Female Unknown 91.4% 84.1% 87.3% -7.3% 3.2% -4.2% 89.5% 87.0% 83.4% -2.4% -3.6% -6.1%
Total 72.9% 70.3% 67.4% -2.6% -2.9% -5.5% 73.4% 71.0% 69.3% -2.3% -1.7% -4.0%
Page 18
APPENDIX E
SOA Industry Life Experience, 2003-2005 Expected Basis: 2001 VBT
A/E Ratios for All Companies & Common 26 Companies ULTIMATE PERIOD ONLY (Durations greater than 25 years)
A/E by Policy (All Companies) A/E by Policy (Common Companies)
Policy Year Ending Differences Policy Year Ending Differences 2003 2004 2005 2004-2003 2005-2004 2005-2003 2003 2004 2005 2004-2003 2005-2004 2005-2003
Male 92.9% 91.2% 85.7% -1.7% -5.6% -7.3% 93.1% 91.2% 88.2% -1.8% -3.1% -4.9%
Female 102.7% 102.4% 96.3% -0.3% -6.1% -6.4% 102.8% 102.4% 97.8% -0.4% -4.6% -5.0%
Total 96.2% 95.0% 89.1% -1.2% -5.9% -7.1% 96.3% 95.0% 91.5% -1.3% -3.5% -4.8%
A/E by Amount (All Companies) A/E by Amount (Common Companies) Policy Year Ending Differences Policy Year Ending Differences 2003 2004 2005 2004-2003 2005-2004 2005-2003 2003 2004 2005 2004-2003 2005-2004 2005-2003
Male 88.7% 86.0% 80.1% -2.7% -5.9% -8.6% 88.7% 86.0% 82.9% -2.6% -3.1% -5.8%
Female 100.4% 99.4% 91.2% -1.0% -8.1% -9.1% 100.6% 99.5% 93.1% -1.1% -6.4% -7.5%
Total 90.6% 88.2% 81.8% -2.3% -6.4% -8.7% 90.6% 88.3% 84.6% -2.3% -3.7% -6.0%

Page 19
APPENDIX F
SOA Industry Life Experience, 2003-2005 Expected Basis: 2001 VBT
A/E Ratios for All Companies & Common 26 Companies (Face Amounts $100,000 - $2,499,999) SELECT PERIOD ONLY (Durations less than or equal to 25 years)
MALE NON-SMOKER
A/E by Policy (All Companies) A/E by Policy (Common Companies)
Policy Year Ending Differences Policy Year Ending Differences Issue Age 2003 2004 2005 2004-2003 2005-2004 2005-2003 2003 2004 2005 2004-2003 2005-2004 2005-2003
25-39 71.8% 64.5% 65.0% -7.2% 0.4% -6.8% 71.3% 64.4% 65.2% -6.9% 0.7% -6.1%
40-49 66.3% 66.3% 61.7% 0.0% -4.6% -4.6% 66.9% 66.1% 60.7% -0.8% -5.4% -6.2%
50-59 69.1% 67.2% 64.5% -1.9% -2.6% -4.6% 68.8% 66.7% 64.0% -2.1% -2.7% -4.8%
60-69 77.4% 72.1% 73.7% -5.2% 1.5% -3.7% 77.5% 73.0% 74.4% -4.5% 1.5% -3.0%
70+ 84.7% 79.6% 74.3% -5.1% -5.3% -10.4% 85.6% 81.2% 83.7% -4.5% 2.5% -1.9%
Total 71.2% 67.8% 66.0% -3.4% -1.8% -5.1% 71.1% 67.8% 66.1% -3.3% -1.7% -5.0%
A/E by Amount (All Companies) A/E by Amount (Common Companies)
Policy Year Ending Differences Policy Year Ending Differences Issue Age 2003 2004 2005 2004-2003 2005-2004 2005-2003 2003 2004 2005 2004-2003 2005-2004 2005-2003
25-39 67.4% 59.6% 60.4% -7.8% 0.9% -7.0% 67.1% 59.8% 61.2% -7.2% 1.3% -5.9%
40-49 63.7% 62.0% 57.5% -1.7% -4.5% -6.2% 65.1% 61.9% 56.6% -3.2% -5.3% -8.5%
50-59 65.7% 63.3% 59.8% -2.4% -3.5% -5.9% 64.0% 63.6% 60.8% -0.4% -2.8% -3.2%
60-69 72.9% 67.4% 69.3% -5.6% 1.9% -3.7% 74.4% 68.2% 70.6% -6.2% 2.4% -3.8%
70+ 74.6% 76.2% 67.3% 1.6% -8.9% -7.3% 76.4% 81.2% 79.9% 4.8% -1.3% 3.5%
Total 67.2% 63.5% 61.3% -3.7% -2.2% -5.9% 67.4% 64.1% 62.3% -3.3% -1.8% -5.1%

Page 20
APPENDIX F
SOA Industry Life Experience, 2003-2005
Expected Basis: 2001 VBT A/E Ratios for All Companies & Common 26 Companies (Face Amounts $100,000 - $2,499,999)
SELECT PERIOD ONLY (Durations less than or equal to 25 years)
MALE SMOKER
A/E by Policy (All Companies) A/E by Policy (Common Companies)
Policy Year Ending Differences Policy Year Ending Differences Issue Age 2003 2004 2005 2004-2003 2005-2004 2005-2003 2003 2004 2005 2004-2003 2005-2004 2005-2003
25-39 72.0% 73.8% 69.5% 1.8% -4.3% -2.5% 72.4% 74.5% 69.0% 2.1% -5.4% -3.3%
40-49 81.7% 74.9% 81.3% -6.9% 6.5% -0.4% 83.6% 74.9% 82.7% -8.7% 7.8% -0.9%
50-59 97.7% 93.4% 93.6% -4.3% 0.2% -4.2% 97.2% 93.7% 94.1% -3.5% 0.4% -3.1%
60-69 85.4% 77.9% 90.0% -7.5% 12.2% 4.7% 85.0% 77.0% 90.3% -8.0% 13.3% 5.3%
70+ 88.5% 86.9% 84.3% -1.6% -2.6% -4.2% 89.2% 91.5% 82.6% 2.3% -8.9% -6.6%
Total 83.3% 79.6% 82.0% -3.8% 2.5% -1.3% 83.8% 79.9% 82.3% -3.9% 2.4% -1.4%
A/E by Amount (All Companies) A/E by Amount (Common Companies)
Policy Year Ending Differences Policy Year Ending Differences Issue Age 2003 2004 2005 2004-2003 2005-2004 2005-2003 2003 2004 2005 2004-2003 2005-2004 2005-2003
25-39 67.1% 72.1% 61.9% 5.0% -10.2% -5.2% 66.8% 73.4% 61.8% 6.6% -11.6% -5.0%
40-49 73.8% 71.8% 78.6% -1.9% 6.7% 4.8% 75.5% 69.1% 81.6% -6.4% 12.5% 6.1%
50-59 95.4% 94.2% 87.4% -1.2% -6.8% -8.0% 95.3% 96.6% 92.1% 1.3% -4.5% -3.2%
60-69 87.9% 78.8% 88.2% -9.2% 9.4% 0.2% 90.9% 80.1% 93.4% -10.8% 13.3% 2.5%
70+ 77.8% 56.9% 90.7% -20.9% 33.8% 12.9% 81.8% 63.9% 93.9% -17.9% 30.0% 12.2%
Total 79.5% 77.9% 78.2% -1.6% 0.2% -1.4% 80.4% 78.5% 80.8% -2.0% 2.3% 0.4%
Page 21
APPENDIX F
SOA Industry Life Experience, 2003-2005 Expected Basis: 2001 VBT
A/E Ratios for All Companies & Common 26 Companies (Face Amounts $100,000 - $2,499,999) SELECT PERIOD ONLY (Durations less than or equal to 25 years)
FEMALE NON-SMOKER
A/E by Policy (All Companies) A/E by Policy (Common Companies)
Policy Year Ending Differences Policy Year Ending Differences Issue Age 2003 2004 2005 2004-2003 2005-2004 2005-2003 2003 2004 2005 2004-2003 2005-2004 2005-2003
25-39 64.0% 62.3% 64.0% -1.7% 1.7% 0.0% 63.6% 62.3% 64.7% -1.3% 2.4% 1.1%
40-49 58.6% 59.9% 55.0% 1.4% -4.9% -3.6% 58.5% 61.3% 55.5% 2.8% -5.8% -3.0%
50-59 60.4% 62.9% 61.2% 2.5% -1.7% 0.8% 58.5% 64.9% 61.6% 6.4% -3.3% 3.1%
60-69 73.8% 71.5% 67.4% -2.3% -4.2% -6.5% 73.1% 72.5% 70.7% -0.6% -1.8% -2.4%
70+ 90.4% 80.8% 80.7% -9.6% 0.0% -9.7% 86.2% 80.6% 82.5% -5.7% 1.9% -3.8%
Total 67.5% 65.8% 64.0% -1.7% -1.8% -3.5% 66.0% 66.5% 64.9% 0.6% -1.7% -1.1%
A/E by Amount (All Companies) A/E by Amount (Common Companies)
Policy Year Ending Differences Policy Year Ending Differences Issue Age 2003 2004 2005 2004-2003 2005-2004 2005-2003 2003 2004 2005 2004-2003 2005-2004 2005-2003
25-39 65.3% 58.7% 60.8% -6.5% 2.1% -4.5% 64.3% 59.2% 62.3% -5.0% 3.1% -2.0%
40-49 54.4% 56.5% 51.5% 2.1% -5.1% -3.0% 54.6% 57.4% 52.8% 2.8% -4.6% -1.8%
50-59 58.3% 59.6% 57.8% 1.2% -1.8% -0.5% 56.4% 61.1% 59.5% 4.6% -1.6% 3.0%
60-69 61.7% 71.8% 61.5% 10.1% -10.3% -0.2% 64.0% 73.8% 64.8% 9.8% -9.1% 0.7%
70+ 89.0% 76.7% 75.2% -12.3% -1.5% -13.7% 86.5% 77.8% 76.4% -8.7% -1.4% -10.1%
Total 66.1% 64.3% 61.3% -1.8% -2.9% -4.7% 65.2% 65.3% 62.7% 0.2% -2.7% -2.5%

Page 22
APPENDIX F
SOA Industry Life Experience, 2003-2005 Expected Basis: 2001 VBT
A/E Ratios for All Companies & Common 26 Companies (Face Amounts $100,000 - $2,499,999) SELECT PERIOD ONLY (Durations less than or equal to 25 years)
FEMALE SMOKER
A/E by Policy (All Companies) A/E by Policy (Common Companies)
Policy Year Ending Differences Policy Year Ending Differences Issue Age 2003 2004 2005 2004-2003 2005-2004 2005-2003 2003 2004 2005 2004-2003 2005-2004 2005-2003
25-39 74.9% 75.7% 67.6% 0.9% -8.1% -7.3% 77.6% 73.1% 67.7% -4.5% -5.3% -9.8%
40-49 75.6% 66.7% 73.8% -8.9% 7.1% -1.8% 74.1% 68.1% 76.1% -6.0% 8.0% 2.0%
50-59 82.3% 91.0% 90.4% 8.8% -0.7% 8.1% 82.7% 91.7% 91.2% 9.0% -0.5% 8.5%
60-69 99.8% 107.1% 106.0% 7.3% -1.1% 6.2% 96.6% 104.4% 107.6% 7.8% 3.3% 11.1%
70+ 100.1% 93.3% 128.3% -6.8% 35.0% 28.2% 95.6% 90.2% 130.6% -5.4% 40.4% 35.0%
Total 83.3% 83.0% 85.7% -0.3% 2.7% 2.4% 82.7% 82.5% 87.0% -0.2% 4.5% 4.3%
A/E by Amount (All Companies) A/E by Amount (Common Companies)
Policy Year Ending Differences Policy Year Ending Differences Issue Age 2003 2004 2005 2004-2003 2005-2004 2005-2003 2003 2004 2005 2004-2003 2005-2004 2005-2003
25-39 69.7% 69.3% 62.7% -0.4% -6.6% -7.0% 72.0% 68.5% 64.7% -3.6% -3.7% -7.3%
40-49 74.2% 71.7% 68.8% -2.4% -2.9% -5.4% 76.6% 75.3% 72.7% -1.3% -2.6% -3.8%
50-59 88.3% 90.7% 81.7% 2.4% -9.0% -6.6% 93.4% 83.3% 88.9% -10.1% 5.7% -4.4%
60-69 103.7% 98.1% 102.5% -5.5% 4.4% -1.1% 104.6% 95.2% 114.0% -9.4% 18.8% 9.4%
70+ 101.7% 92.6% 120.3% -9.1% 27.7% 18.6% 103.6% 90.3% 120.5% -13.3% 30.2% 16.9%
Total 86.7% 83.6% 84.1% -3.2% 0.5% -2.6% 89.3% 82.0% 89.1% -7.3% 7.2% -0.2%