USD 27.5m Fully Underwritten Private Placement
48
USD 27.5m Fully Underwritten Private Placement 6 July 2020
Transcript of USD 27.5m Fully Underwritten Private Placement
USD 27.5m Fully Underwritten Private Placement
6 July 2020
IMPORTANT INFORMATION
2
THIS PRESENTATION AND ITS CONTENTS ARE CONFIDENTIAL AND ARE NOT FOR DISTRIBUTION OR RELEASE, IN WHOLE OR IN PART, DIRECTLY OR INDIRECTLY, IN OR INTO THE UNITED STATES OF AMERICA (INCLUDING ITS TERRITORIES AND
POSSESSIONS, ANY STATE OF THE UNITED STATES OF AMERICA AND THE DISTRICT OF COLUMBIA) (THE "UNITED STATES"), AUSTRALIA, CANADA, THE HONG KONG SPECIAL ADMINISTRATIVE REGION OF THE PEOPLE'S REPUBLIC OF CHINA OR
JAPAN, OR ANY OTHER JURISDICTION IN WHICH THE DISTRIBUTION OR RELEASE WOULD BE UNLAWFUL BY REVIEWING THIS PRESENTATION. THIS PRESENTATION IS NOT AN OFFER OR INVITATION TO BUY OR SELL SECURITIES IN ANY
JURISDICTION.
THIS PRESENTATION AND ITS APPENDICES (THE "PRESENTATION") HAS BEEN PREPARED AND ISSUED BY MPC CONTAINER SHIPS ASA (THE "COMPANY" AND TOGETHER WITH ITS SUBSIDIARIES, THE "GROUP") WITH THE ASSISTANCE OF DNB
MARKETS, A PART OF DNB BANK ASA, AND PARETO SECURITIES AS (THE "MANAGERS") SOLELY FOR INFORMATION PURPOSES IN CONNECTION WITH THE INVITATION TO PARTICIPATE IN A PROPOSED PRIVATE PLACEMENT (THE "PRIVATE
PLACEMENT") OF NEW SHARES (THE "SHARES") IN THE COMPANY.
THIS PRESENTATION DOES NOT CONSTITUTE AN OFFER TO SELL OR A SOLICITATION OF AN OFFER TO BUY, OR A RECOMMENDATION REGARDING, ANY SECURITIES OF THE COMPANY. BY ATTENDING A MEETING WHERE THIS PRESENTATION IS
MADE, OR BY READING THE PRESENTATION SLIDES OR BY OTHERWISE RECEIVING THIS PRESENTATION OR THE INFORMATION CONTAINED HEREIN, YOU AGREE TO BE BOUND BY THE FOLLOWING TERMS, CONDITIONS AND LIMITATIONS. ANY
FAILURE TO COMPLY WITH THE RESTRICTIONS SET OUT HEREIN MAY CONSTITUTE A VIOLATION OF APPLICABLE SECURITIES LAWS OR MAY RESULT IN CIVIL, ADMINISTRATIVE OR CRIMINAL LIABILITIES. FOR THE PURPOSES OF THIS NOTICE,
“PRESENTATION” MEANS AND INCLUDES THIS DOCUMENT AND ITS APPENDICES, ANY ORAL PRESENTATION GIVEN IN CONNECTION WITH THIS PRESENTATION, ANY QUESTION AND ANSWER SESSION DURING OR AFTER SUCH ORAL PRESENTATION
AND ANY WRITTEN OR ORAL MATERIAL DISCUSSED OR DISTRIBUTED DURING ANY ORAL PRESENTATION MEETING.
THIS PRESENTATION HAS ONLY BEEN MADE AND SHALL ONLY BE MADE AVAILABLE TO A LIMITED NUMBER OF PROSPECTIVE INVESTORS (THE "RECIPIENTS").
THE RECIPIENTS ARE REMINDED THAT THE PRESENTATION CONTAINS CONFIDENTIAL AND SENSITIVE INFORMATION. BY ACCEPTING THIS PRESENTATION, EACH RECIPIENT AGREES TO CAUSE THEIR DIRECTORS, OFFICERS, EMPLOYEES,
ADVISORS AND OTHER REPRESENTATIVES TO EQUALLY OBSERVE THE COMMITMENTS DESCRIBED IN THIS NOTICE AND TO USE THE PRESENTATION ONLY TO EVALUATE THE INVESTMENT AND NOT DISCLOSE ANY SUCH INFORMATION TO ANY
OTHER PARTY.
NO REPRESENTATION, WARRANTY OR UNDERTAKING, EXPRESS OR IMPLIED, IS MADE BY THE COMPANY, ITS AFFILIATES OR REPRESENTATIVES OR ANY OF THE MANAGERS ("COVERED PERSONS") AS TO, AND NO RELIANCE SHOULD BE PLACED
ON, THE FAIRNESS, ACCURACY, COMPLETENESS OR CORRECTNESS OF THE INFORMATION OR THE OPINIONS CONTAINED HEREIN, FOR ANY PURPOSE WHATSOEVER. NEITHER THE COMPANY OR ANY OF THEIR RESPECTIVE DIRECTORS,
OFFICERS, EMPLOYEES, AGENTS, AFFILIATES, ADVISORS OR ANY PERSON ACTING ON THEIR BEHALF NOR ANY OF ITS AFFILIATES OR REPRESENTATIVES OR ANY OF THE MANAGERS SHALL HAVE ANY RESPONSIBILITY OR LIABILITY WHATSOEVER
(FOR NEGLIGENCE OR OTHERWISE) FOR ANY LOSS WHATSOEVER AND HOWSOEVER ARISING FROM ANY USE OF THIS PRESENTATION OR ITS CONTENTS OR OTHERWISE ARISING IN CONNECTION WITH THIS PRESENTATION.
THIS PRESENTATION SPEAKS AS OF THE DATE HEREOF, AND THE MATERIAL AND THE VIEWS EXPRESSED HEREIN ARE SUBJECT TO CHANGE UPDATING, REVISION, VERIFICATION, CORRECTION, COMPLETION, AMENDMENT AND MAY CHANGE
MATERIALLY AND WITHOUT NOTICE BASED ON A NUMBER OF FACTORS, INCLUDING, WITHOUT LIMITATION, MACROECONOMIC AND EQUITY MARKET CONDITIONS, INVESTOR ATTITUDE AND DEMAND, THE BUSINESS PROSPECTS OF THE COMPANY
AND OTHER SPECIFIC ISSUES SUCH AS IMPLICATIONS OF THE COVID-19 PANDEMIC. NONE OF THE COMPANY, ITS AFFILIATES OR REPRESENTATIVES OR ANY OF THE MANAGERS UNDERTAKE ANY OBLIGATION TO PROVIDE THE RECIPIENT WITH
ACCESS TO ANY ADDITIONAL INFORMATION OR TO UPDATE THIS PRESENTATION OR ANY INFORMATION OR TO CORRECT ANY INACCURACIES IN ANY SUCH INFORMATION. THE INFORMATION CONTAINED IN THIS PRESENTATION SHOULD BE
CONSIDERED IN THE CONTEXT OF THE CIRCUMSTANCES PREVAILING AT THE TIME AND HAS NOT BEEN, AND WILL NOT BE, UPDATED TO REFLECT DEVELOPMENTS THAT MAY OCCUR AFTER THE DATE OF THIS PRESENTATION. THESE MATERIALS
DO NOT PURPORT TO CONTAIN A COMPLETE DESCRIPTION OF THE GROUP OR THE MARKET(S) IN WHICH THE GROUP OPERATES, NOR DO THEY PROVIDE AN AUDITED VALUATION OF THE GROUP. THE ANALYSES CONTAINED IN THESE MATERIALS
ARE NOT, AND DO NOT PURPORT TO BE, APPRAISALS OF THE ASSETS, STOCK OR BUSINESS OF THE GROUP OR ANY OTHER PERSON. MOREOVER, THESE MATERIALS ARE INCOMPLETE WITHOUT REFERENCE TO, AND SHOULD BE VIEWED AND
CONSIDERED SOLELY IN CONJUNCTION WITH, THE ORAL BRIEFING PROVIDED BY AN AUTHORISED REPRESENTATIVE OF THE COMPANY IN RELATION TO THESE MATERIALS.
THE COMPANY HAS NOT AUTHORISED ANY OTHER PERSON TO PROVIDE ANY PERSONS WITH ANY OTHER INFORMATION RELATED TO THE GROUP AND NEITHER THE COMPANY NOR ANY OF THE MANAGERS WILL ASSUME ANY RESPONSIBILITY FOR
ANY INFORMATION OTHER PERSONS MAY PROVIDE.
AN INVESTMENT IN THE COMPANY WILL INVOLVE SIGNIFICANT RISKS AND SEVERAL FACTORS COULD CAUSE THE ACTUAL RESULTS, PERFORMANCE OR ACHIEVEMENTS OF THE COMPANY TO BE MATERIALLY DIFFERENT FROM ANY FUTURE
RESULTS, PERFORMANCE OR ACHIEVEMENTS THAT MAY BE EXPRESSED OR IMPLIED BY STATEMENTS AND INFORMATION IN THIS PRESENTATION. RECIPIENTS SHOULD REVIEW THE PRESENTATION AND RELATED TRANSACTION DOCUMENTATION
PRIOR TO MAKING AN INVESTMENT DECISION. INVESTORS SHOULD HAVE THE FINANCIAL ABILITY AND WILLINGNESS TO ACCEPT THE RISK CHARACTERISTICS OF THE COMPANY AND THE COMPANY'S INVESTMENTS. RECIPIENTS MUST CONDUCT
THEIR OWN INDEPENDENT ANALYSIS AND APPRAISAL OF THE COMPANY AND OF THE DATA CONTAINED OR REFERRED TO HEREIN AND IN OTHER DISCLOSED INFORMATION, AND RISKS RELATED TO AN INVESTMENT, AND THEY MUST RELY SOLELY
ON THEIR OWN JUDGEMENT AND THAT OF THEIR QUALIFIED ADVISORS IN EVALUATING THE COMPANY AND THE COMPANY'S BUSINESS STRATEGY, AND IN DETERMINING THE DESIRABILITY OF THE INVESTMENT.
THE INFORMATION CONTAINED IN THIS PRESENTATION HAS BEEN OBTAINED FROM THE COMPANY. THE RECIPIENT SHOULD CAREFULLY REVIEW THE NON-EXHAUSTIVE OVERVIEW OF RELEVANT RISK FACTORS SECTION "RISK FACTORS" IN THIS
PRESENTATION, AS WELL AS THE INFORMATION CONTAINED ELSEWHERE IN THE PRESENTATION. IF ANY OF THESE RISKS WERE TO MATERIALISE, OR SHOULD UNDERLYING ASSUMPTIONS PROVE INCORRECT, ACTUAL RESULTS OR
PERFORMANCE MAY VARY MATERIALLY FROM THOSE DESCRIBED IN THIS PRESENTATION AND COULD HAVE A MATERIAL ADVERSE EFFECT ON THE GROUP, ITS FINANCIAL CONDITION, RESULTS OF OPERATIONS, LIQUIDITY AND/OR PROSPECTS,
THE MARKET VALUE OF THE COMPANY'S SHARES COULD DECLINE, AND INVESTORS MAY LOSE ALL OR PART OF THEIR INVESTMENT. AN INVESTMENT IN THE COMPANY IS SUITABLE ONLY FOR INVESTORS WHO UNDERSTAND THE RISK FACTORS
ASSOCIATED WITH THIS TYPE OF INVESTMENT AND WHO CAN AFFORD A LOSS OF ALL OR PART OF THEIR INVESTMENT.
IMPORTANT INFORMATION (CONT.)
3
THE CONTENTS OF THIS PRESENTATION ARE NOT TO BE CONSTRUED AS FINANCIAL, LEGAL, BUSINESS, INVESTMENT, TAX OR OTHER PROFESSIONAL ADVICE. EACH RECIPIENT SHOULD CONSULT WITH ITS OWN FINANCIAL, LEGAL, BUSINESS,
INVESTMENT AND TAX ADVISERS TO RECEIVE FINANCIAL, LEGAL, BUSINESS, INVESTMENT AND TAX ADVICE. IN PARTICULAR, NOTHING HEREIN SHALL BE TAKEN AS CONSTITUTING THE GIVING OF INVESTMENT ADVICE AND THESE MATERIALS ARE
NOT INTENDED TO PROVIDE, AND MUST NOT BE TAKEN AS, THE EXCLUSIVE BASIS OF ANY ANVESTMENT DECISION OR OTHER VALUATION AND SHOULD NOT BE CONSIDERED AS A RECOMMENDATION BY THE COMPANY (OR ANY OF ITS AFFILIATES)
OR THE MANAGERS THAT ANY RECIPIENT ENTERS INTO ANY TRANSACTION. THESE MATERIALS COMPRISE A GENERAL SUMMARY OF CERTAIN MATTERS IN CONNECTION WITH THE GROUP. THESE MATERIALS DO NOT PURPORT TO CONTAIN ALL OF
THE INFORMATION THAT ANY RECIPIENT MAY REQUIRE TO MAKE A DECISION WITH REGARDS TO ANY TRANSACTION. ANY DECISION AS TO WHETHER OR NOT TO ENTER INTO ANY TRANSACTION SHOULD BE TAKEN SOLELY BY THE RELEVANT
RECIPIENT. BEFORE ENTERING INTO SUCH TRANSACTION, EACH RECIPIENT SHOULD TAKE STEPS TO ENSURE THAT IT FULLY UNDERSTANDS SUCH TRANSACTION AND HAS MADE AN INDEPENDENT ASSESSMENTS OF THE APPROPRIATENESS OF
SUCH TRANSACTION IN THE LIGHT OF ITS OWN OBJECTIVES AND CIRCUMSTANCES, INCLUDING THE POSSIBLE RISKS AND BENEFITS OF ENTERING INTO SUCH TRANSACTION.
THIS PRESENTATION CONTAINS FORWARD-LOOKING INFORMATION AND STATEMENTS RELATING TO THE BUSINESS, FINANCIAL PERFORMANCE AND RESULTS OF THE GROUP AND/OR INDUSTRY AND MARKETS IN WHICH IT OPERATES. FORWARD-
LOOKING STATEMENTS ARE STATEMENTS THAT RELATE TO FUTURE CIRCUMSTANCES AND RESULTS AND OTHER STATEMENTS THAT ARE NOT HISTORICAL FACTS AND MAY SOMETIMES BE IDENTIFIED BY WORDS SUCH AS "AIMS", "ANTICIPATES",
"BELIEVES", "ESTIMATES", "EXPECTS", "FORESEES", "INTENDS", "PLANS", "PREDICTS", "PROJECTS", "TARGETS", AND SIMILAR EXPRESSIONS. THE FORWARD-LOOKING STATEMENTS CONTAINED IN THIS PRESENTATION, INCLUDING ASSUMPTIONS,
OPINIONS AND VIEWS OF THE COMPANY OR CITED FROM THIRD PARTY SOURCES, ARE SOLELY OPINIONS AND FORECASTS WHICH ARE SUBJECT TO MATERIAL RISKS, UNCERTAINTIES AND OTHER FACTORS THAT MAY CAUSE ACTUAL EVENTS TO
DIFFER MATERIALLY FROM ANY ANTICIPATED DEVELOPMENT. FORWARD-LOOKING STATEMENTS ARE NOT GUARANTEES OF FUTURE PERFORMANCE AND RISKS, UNCERTAINTIES AND OTHER IMPORTANT FACTORS COULD CAUSE THE ACTUAL
RESULTS OF OPERATIONS, FINANCIAL CONDITION AND LIQUIDITY OF THE GROUP OR THE INDUSTRY TO DIFFER MATERIALLY FROM THIS RESULTS EXPRESSED OR IMPLIED IN THIS PRESENTATION BY SUCH FORWARD-LOOKING STATEMENTS. NO
REPRESENTATION IS MADE THAT ANY OF THESE FORWARD-LOOKING STATEMENTS OR FORECASTS WILL COME TO PASS OR THAT ANY FORECAST RESULT WILL BE ACHIEVED AND YOU ARE CAUTIONED NOT TO PLACE ANY UNDUE INFLUENCE ON
ANY FORWARD-LOOKING STATEMENT. NEITHER THE COMPANY NOR THE MANAGER NOR ANY OF THEIR PARENT OR SUBSIDIARY UNDERTAKINGS, AFFILIATES NOR ADVISORS NOR ANY SUCH PERSON'S OFFICERS OR EMPLOYEES PROVIDE ANY
ASSURANCE THAT THE ASSUMPTIONS UNDERLYING SUCH FORWARD-LOOKING STATEMENTS ARE FREE FROM ERRORS, NOR DO ANY OF THEM ACCEPT ANY RESPONSIBILITY FOR THE FUTURE ACCURACY OF THE OPINIONS EXPRESSED IN THIS
PRESENTATION OR THE ACTUAL OCCURRENCE OF THE FORECASTED DEVELOPMENTS. THE COMPANY ASSUMES NO OBLIGATION, EXCEPT AS REQUIRED BY LAW, TO UPDATE ANY FORWARD-LOOKING STATEMENTS OR TO CONFORM THESE
FORWARD-LOOKING STATEMENTS TO ITS ACTUAL RESULTS.
THIS PRESENTATION HAS NOT BEEN REVIEWED BY OR REGISTERED WITH ANY PUBLIC AUTHORITY OR STOCK EXCHANGE. NEITHER THE COMPANY, NOR THE MANAGER HAVE AUTHORIZED ANY OFFER TO THE PUBLIC OF SECURITIES, OR HAVE
UNDERTAKEN OR PLANS TO UNDERTAKE, ANY ACTION TO MAKE AN OFFER OF SECURITIES TO THE PUBLIC REQUIRING THE PUBLICATION OF AN OFFERING PROSPECTUS, IN ANY MEMBER STATE OF THE EUROPEAN ECONOMIC AREA WHICH HAS
IMPLEMENTED THE EU PROSPECTIVE DIRECTIVE (DIRECTIVE 2003/71/EC), AS AMENDED. NO OFFER OF ANY SECURITIES IS DIRECTED TO PERSONS IN ANY JURISDICTION WHERE SUCH AN OFFER WOULD BE IN VIOLATION OF APPLICABLE LAWS OR
WHOSE ACCEPTANCE OF SUCH AN OFFER WOULD REQUIRE THAT (I) FURTHER DOCUMENTS ARE ISSUED IN ORDER FOR THE OFFER TO COMPLY WITH LOCAL LAW OR (II) REGISTRATION OR OTHER MEASURES ARE TAKEN PURSUANT TO LOCAL
LAW.
THIS PRESENTATION AND THE INFORMATION CONTAINED HEREIN DO NOT CONSTITUTE AN OFFER OF SECURITIES FOR SALE IN THE UNITED STATES AND ARE NOT FOR PUBLICATION OR DISTRIBUTION TO U.S. PERSONS (WITHIN THE MEANING OF
REGULATION S UNDER THE U.S. SECURITIES ACT OF 1933, AS AMENDED (THE “SECURITIES ACT”)). THE SECURITIES PROPOSED TO BE OFFERED IN THE COMPANY HAVE NOT BEEN AND WILL NOT BE REGISTERED UNDER THE SECURITIES ACT AND
MAY NOT BE OFFERED OR SOLD IN THE UNITED STATES OR TO U.S. PERSONS EXCEPT PURSUANT TO AN EXEMPTION FROM THE REGISTRATION REQUIREMENTS OF THE SECURITIES ACT. THE SHARES OF THE COMPANY HAVE NOT AND WILL NOT
BE REGISTERED UNDER THE U.S. SECURITIES ACT OR ANY STATE SECURITIES LAW AND MAY NOT BE OFFERED OR SOLD WITHIN THE UNITED STATES UNLESS AN EXEMPTION FROM THE REGISTRATION REQUIREMENTS OF THE U.S. SECURITIES
ACT IS AVAILABLE.
THIS PRESENTATION IS DIRECTED AT PERSONS IN MEMBER STATES OF THE EUROPEAN ECONOMIC AREA ("EEA") WHO ARE "QUALIFIED INVESTORS" AS DEFINED IN ARTICLE 2(E) OF THE REGULATION (EU) 2017/1129 OF THE EUROPEAN PARLIAMENT
AND OF THE COUNCIL OF 14 JUNE 2017 ("QUALIFIED INVESTORS"). IN ADDITION, IN THE UNITED KINGDOM, THIS PRESENTATION IS ADDRESSED TO AND DIRECTED ONLY AT, "QUALIFIED INVESTORS" AS DEFINED IN SECTION 86(7) OF THE FINANCIAL
SERVICES AND MARKETS ACT 2000 WHO ARE ALSO (I) INVESTMENT PROFESSIONALS FALLING WITHIN ARTICLE 19(5) OF THE FINANCIAL SERVICES AND MARKETS ACT 2000 (FINANCIAL PROMOTION) ORDER 2005, AS AMENDED (THE "ORDER"); OR (II)
HIGH NET WORTH ENTITIES FALLING WITHIN ARTICLE 49(2)(A) TO (D) OF THE ORDER (ALL SUCH PERSONS TOGETHER BEING REFERRED TO AS "RELEVANT PERSONS"). THIS PRESENTATION MUST NOT BE ACTED ON OR RELIED ON (I) IN THE UNITED
KINGDOM, BY PERSONS WHO ARE NOT RELEVANT PERSONS, AND (II) IN ANY MEMBER STATE OF THE EEA OTHER THAN NORWAY, BY PERSONS WHO ARE NOT QUALIFIED INVESTORS. ANY INVESTMENT OR INVESTMENT ACTIVITY TO WHICH THIS
PRESENTATION RELATES IS AVAILABLE IN THE UNITED KINGDOM ONLY TO PERSONS THAT ARE BOTH RELEVANT PERSONS AND QUALIFIED INVESTORS, AND IN MEMBER STATES OF THE EEA OTHER THAN NORWAY AND THE UNITED KINGDOM ONLY
TO PERSONS THAT ARE QUALIFIED INVESTORS, AND WILL BE ENGAGED IN ONLY WITH SUCH PERSONS.
THIS PRESENTATION IS SUBJECT TO NORWEGIAN LAW, AND ANY DISPUTE ARISING IN RESPECT OF THIS PRESENTATION IS SUBJECT TO THE EXCLUSIVE JURISDICTION OF NORWEGIAN COURTS.
THE CONTENTS OF THIS PRESENTATION ARE NOT TO BE CONSTRUED AS FINANCIAL, LEGAL, BUSINESS, INVESTMENT, TAX OR OTHER PROFESSIONAL ADVICE. EACH PROSPECTIVE INVESTOR SHOULD THEREFORE CONSULT WITH ITS OWN
FINANCIAL, LEGAL, BUSINESS, TAX OR OTHER ADVISER AS TO FINANCIAL, LEGAL, BUSINESS AND TAX ADVICE.
BY RECEIVING THIS PRESENTATION, EACH RECIPIENT AGREES TO BE BOUND BY THE TERMS AND CONDITIONS SET FORTH ABOVE AND REPRESENTS THAT IT IS A QUALIFIED INSTITUTIONAL OR OTHER PROFESSIONAL INVESTOR WHO IS
SUFFICIENTLY EXPERIENCED TO UNDERSTAND THE ASPECTS AND RISKS RELATED TO AN INVESTMENT IN THE COMPANY, AND WHO WILL OBTAIN ADDITIONAL EXPERT ADVICE WHERE AND WHEN NEEDED.
SUMMARY OF RISK FACTORS
4
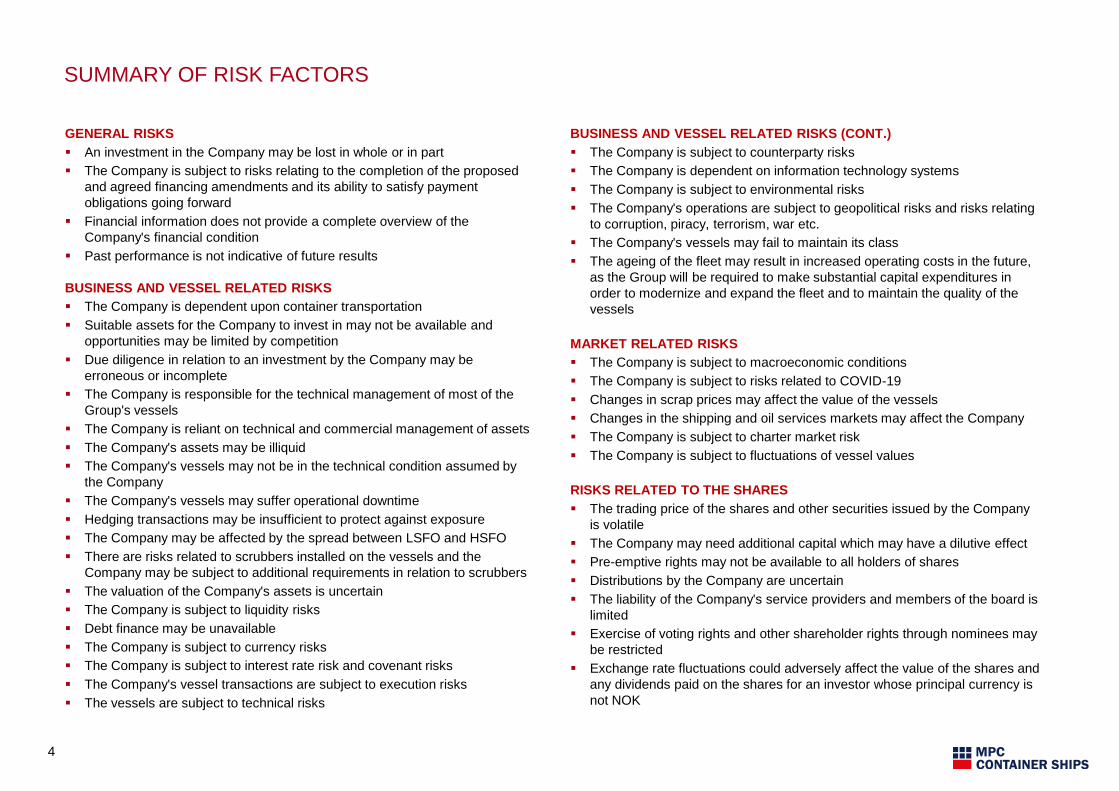
GENERAL RISKS
An investment in the Company may be lost in whole or in part
The Company is subject to risks relating to the completion of the proposed
and agreed financing amendments and its ability to satisfy payment
obligations going forward
Financial information does not provide a complete overview of the
Company's financial condition
Past performance is not indicative of future results
BUSINESS AND VESSEL RELATED RISKS
The Company is dependent upon container transportation
Suitable assets for the Company to invest in may not be available and
opportunities may be limited by competition
Due diligence in relation to an investment by the Company may be
erroneous or incomplete
The Company is responsible for the technical management of most of the
Group's vessels
The Company is reliant on technical and commercial management of assets
The Company's assets may be illiquid
The Company's vessels may not be in the technical condition assumed by
the Company
The Company's vessels may suffer operational downtime
Hedging transactions may be insufficient to protect against exposure
The Company may be affected by the spread between LSFO and HSFO
There are risks related to scrubbers installed on the vessels and the
Company may be subject to additional requirements in relation to scrubbers
The valuation of the Company's assets is uncertain
The Company is subject to liquidity risks
Debt finance may be unavailable
The Company is subject to currency risks
The Company is subject to interest rate risk and covenant risks
The Company's vessel transactions are subject to execution risks
The vessels are subject to technical risks
BUSINESS AND VESSEL RELATED RISKS (CONT.)
The Company is subject to counterparty risks
The Company is dependent on information technology systems
The Company is subject to environmental risks
The Company's operations are subject to geopolitical risks and risks relating
to corruption, piracy, terrorism, war etc.
The Company's vessels may fail to maintain its class
The ageing of the fleet may result in increased operating costs in the future,
as the Group will be required to make substantial capital expenditures in
order to modernize and expand the fleet and to maintain the quality of the
vessels
MARKET RELATED RISKS
The Company is subject to macroeconomic conditions
The Company is subject to risks related to COVID-19
Changes in scrap prices may affect the value of the vessels
Changes in the shipping and oil services markets may affect the Company
The Company is subject to charter market risk
The Company is subject to fluctuations of vessel values
RISKS RELATED TO THE SHARES
The trading price of the shares and other securities issued by the Company
is volatile
The Company may need additional capital which may have a dilutive effect
Pre-emptive rights may not be available to all holders of shares
Distributions by the Company are uncertain
The liability of the Company's service providers and members of the board is
limited
Exercise of voting rights and other shareholder rights through nominees may
be restricted
Exchange rate fluctuations could adversely affect the value of the shares and
any dividends paid on the shares for an investor whose principal currency is
not NOK

Transaction Background
Investment Opportunity
Company Update
Market Update
Risk Factors
Appendix
AGENDA
5
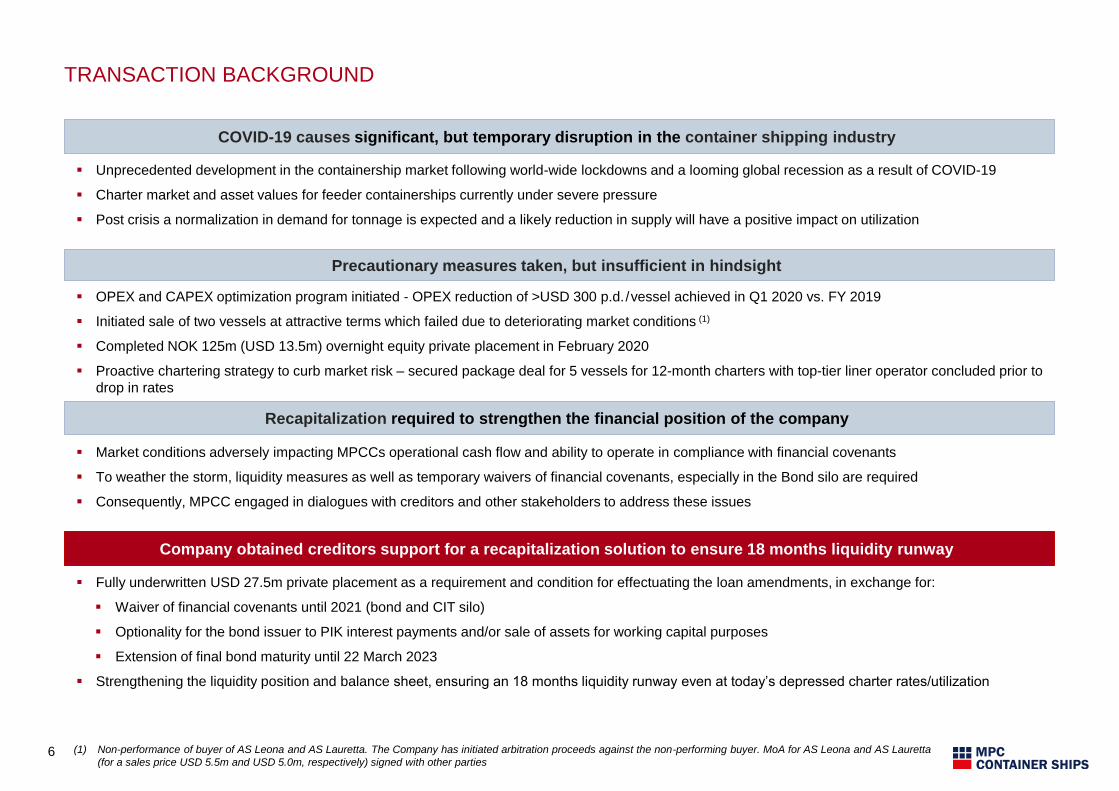
TRANSACTION BACKGROUND
(1) Non-performance of buyer of AS Leona and AS Lauretta. The Company has initiated arbitration proceeds against the non-performing buyer. MoA for AS Leona and AS Lauretta
(for a sales price USD 5.5m and USD 5.0m, respectively) signed with other parties
OPEX and CAPEX optimization program initiated - OPEX reduction of >USD 300 p.d./vessel achieved in Q1 2020 vs. FY 2019
Initiated sale of two vessels at attractive terms which failed due to deteriorating market conditions (1)
Completed NOK 125m (USD 13.5m) overnight equity private placement in February 2020
Proactive chartering strategy to curb market risk – secured package deal for 5 vessels for 12-month charters with top-tier liner operator concluded prior to
drop in rates
Precautionary measures taken, but insufficient in hindsight
6
Market conditions adversely impacting MPCCs operational cash flow and ability to operate in compliance with financial covenants
To weather the storm, liquidity measures as well as temporary waivers of financial covenants, especially in the Bond silo are required
Consequently, MPCC engaged in dialogues with creditors and other stakeholders to address these issues
Recapitalization required to strengthen the financial position of the company
Company obtained creditors support for a recapitalization solution to ensure 18 months liquidity runway
Fully underwritten USD 27.5m private placement as a requirement and condition for effectuating the loan amendments, in exchange for:
Waiver of financial covenants until 2021 (bond and CIT silo)
Optionality for the bond issuer to PIK interest payments and/or sale of assets for working capital purposes
Extension of final bond maturity until 22 March 2023
Strengthening the liquidity position and balance sheet, ensuring an 18 months liquidity runway even at today’s depressed charter rates/utilization
COVID-19 causes significant, but temporary disruption in the container shipping industry
Unprecedented development in the containership market following world-wide lockdowns and a looming global recession as a result of COVID-19
Charter market and asset values for feeder containerships currently under severe pressure
Post crisis a normalization in demand for tonnage is expected and a likely reduction in supply will have a positive impact on utilization
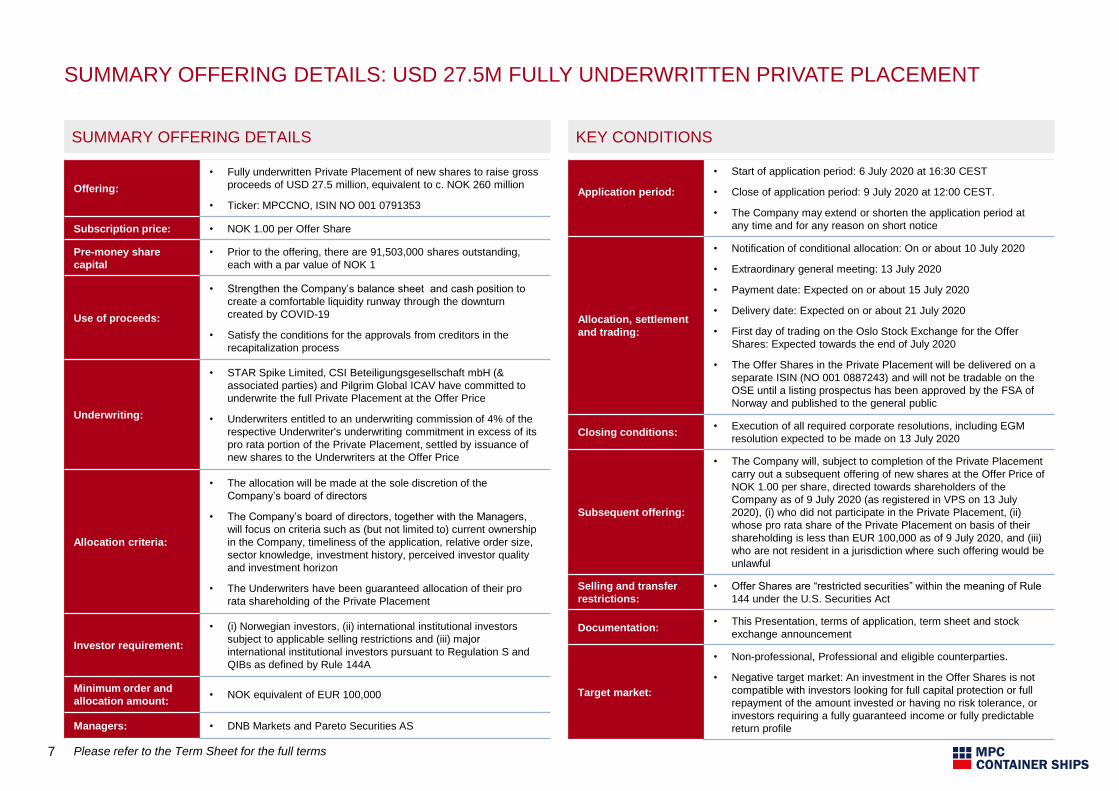
SUMMARY OFFERING DETAILS: USD 27.5M FULLY UNDERWRITTEN PRIVATE PLACEMENT
7
KEY CONDITIONSSUMMARY OFFERING DETAILS
Offering:
• Fully underwritten Private Placement of new shares to raise gross
proceeds of USD 27.5 million, equivalent to c. NOK 260 million
• Ticker: MPCCNO, ISIN NO 001 0791353
Subscription price: • NOK 1.00 per Offer Share
Pre-money share
capital
• Prior to the offering, there are 91,503,000 shares outstanding,
each with a par value of NOK 1
Use of proceeds:
• Strengthen the Company’s balance sheet and cash position to
create a comfortable liquidity runway through the downturn
created by COVID-19
• Satisfy the conditions for the approvals from creditors in the
recapitalization process
Underwriting:
• STAR Spike Limited, CSI Beteiligungsgesellschaft mbH (&
associated parties) and Pilgrim Global ICAV have committed to
underwrite the full Private Placement at the Offer Price
• Underwriters entitled to an underwriting commission of 4% of the
respective Underwriter's underwriting commitment in excess of its
pro rata portion of the Private Placement, settled by issuance of
new shares to the Underwriters at the Offer Price
Allocation criteria:
• The allocation will be made at the sole discretion of the
Company’s board of directors
• The Company’s board of directors, together with the Managers,
will focus on criteria such as (but not limited to) current ownership
in the Company, timeliness of the application, relative order size,
sector knowledge, investment history, perceived investor quality
and investment horizon
• The Underwriters have been guaranteed allocation of their pro
rata shareholding of the Private Placement
Investor requirement:
• (i) Norwegian investors, (ii) international institutional investors
subject to applicable selling restrictions and (iii) major
international institutional investors pursuant to Regulation S and
QIBs as defined by Rule 144A
Minimum order and
allocation amount:• NOK equivalent of EUR 100,000
Managers: • DNB Markets and Pareto Securities AS
Application period:
• Start of application period: 6 July 2020 at 16:30 CEST
• Close of application period: 9 July 2020 at 12:00 CEST.
• The Company may extend or shorten the application period at
any time and for any reason on short notice
Allocation, settlement
and trading:
• Notification of conditional allocation: On or about 10 July 2020
• Extraordinary general meeting: 13 July 2020
• Payment date: Expected on or about 15 July 2020
• Delivery date: Expected on or about 21 July 2020
• First day of trading on the Oslo Stock Exchange for the Offer
Shares: Expected towards the end of July 2020
• The Offer Shares in the Private Placement will be delivered on a
separate ISIN (NO 001 0887243) and will not be tradable on the
OSE until a listing prospectus has been approved by the FSA of
Norway and published to the general public
Closing conditions:• Execution of all required corporate resolutions, including EGM
resolution expected to be made on 13 July 2020
Subsequent offering:
• The Company will, subject to completion of the Private Placement
carry out a subsequent offering of new shares at the Offer Price of
NOK 1.00 per share, directed towards shareholders of the
Company as of 9 July 2020 (as registered in VPS on 13 July
2020), (i) who did not participate in the Private Placement, (ii)
whose pro rata share of the Private Placement on basis of their
shareholding is less than EUR 100,000 as of 9 July 2020, and (iii)
who are not resident in a jurisdiction where such offering would be
unlawful
Selling and transfer
restrictions:
• Offer Shares are “restricted securities” within the meaning of Rule
144 under the U.S. Securities Act
Documentation:• This Presentation, terms of application, term sheet and stock
exchange announcement
Target market:
• Non-professional, Professional and eligible counterparties.
• Negative target market: An investment in the Offer Shares is not
compatible with investors looking for full capital protection or full
repayment of the amount invested or having no risk tolerance, or
investors requiring a fully guaranteed income or fully predictable
return profile
Please refer to the Term Sheet for the full terms
Transaction Background
Investment Opportunity
Company Update
Market Update
Risk Factors
Appendix
AGENDA
8
9
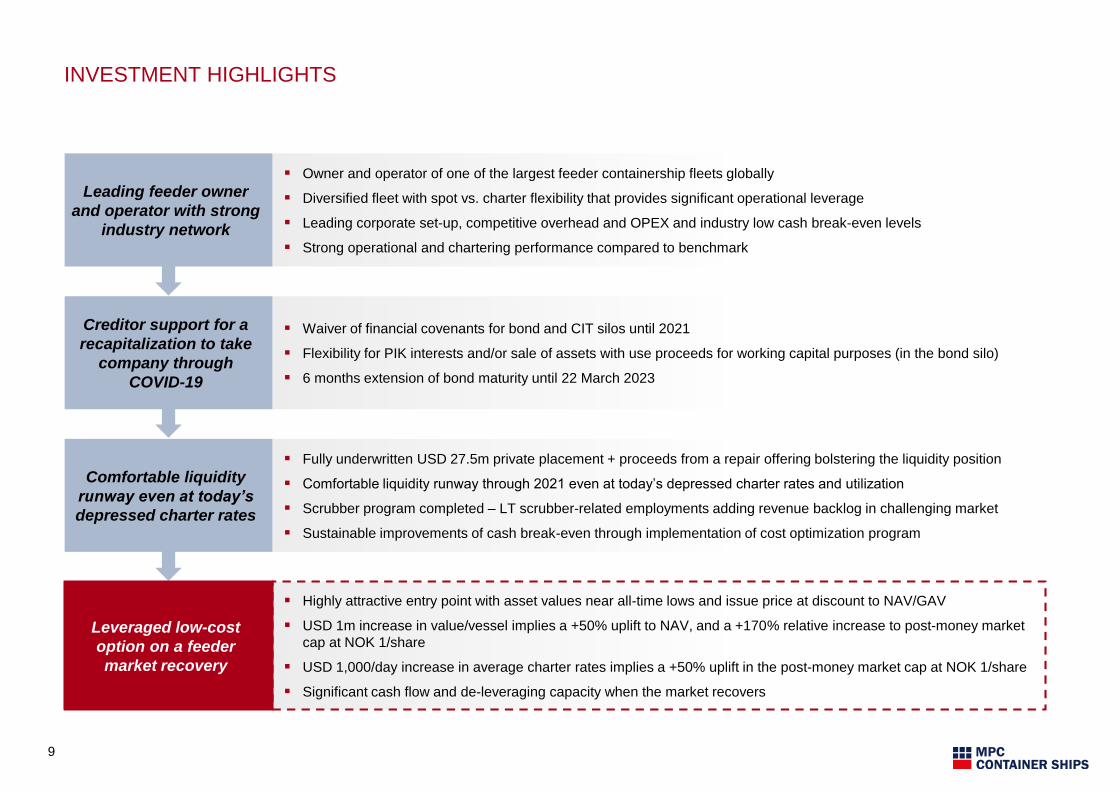
Owner and operator of one of the largest feeder containership fleets globally
Diversified fleet with spot vs. charter flexibility that provides significant operational leverage
Leading corporate set-up, competitive overhead and OPEX and industry low cash break-even levels
Strong operational and chartering performance compared to benchmark
Waiver of financial covenants for bond and CIT silos until 2021
Flexibility for PIK interests and/or sale of assets with use proceeds for working capital purposes (in the bond silo)
6 months extension of bond maturity until 22 March 2023
Fully underwritten USD 27.5m private placement + proceeds from a repair offering bolstering the liquidity position
Comfortable liquidity runway through 2021 even at today’s depressed charter rates and utilization
Scrubber program completed – LT scrubber-related employments adding revenue backlog in challenging market
Sustainable improvements of cash break-even through implementation of cost optimization program
Highly attractive entry point with asset values near all-time lows and issue price at discount to NAV/GAV
USD 1m increase in value/vessel implies a +50% uplift to NAV, and a +170% relative increase to post-money market
cap at NOK 1/share
USD 1,000/day increase in average charter rates implies a +50% uplift in the post-money market cap at NOK 1/share
Significant cash flow and de-leveraging capacity when the market recovers
Leading feeder owner
and operator with strong
industry network
Creditor support for a
recapitalization to take
company through
COVID-19
Comfortable liquidity
runway even at today’s
depressed charter rates
Leveraged low-cost
option on a feeder
market recovery
INVESTMENT HIGHLIGHTS
10
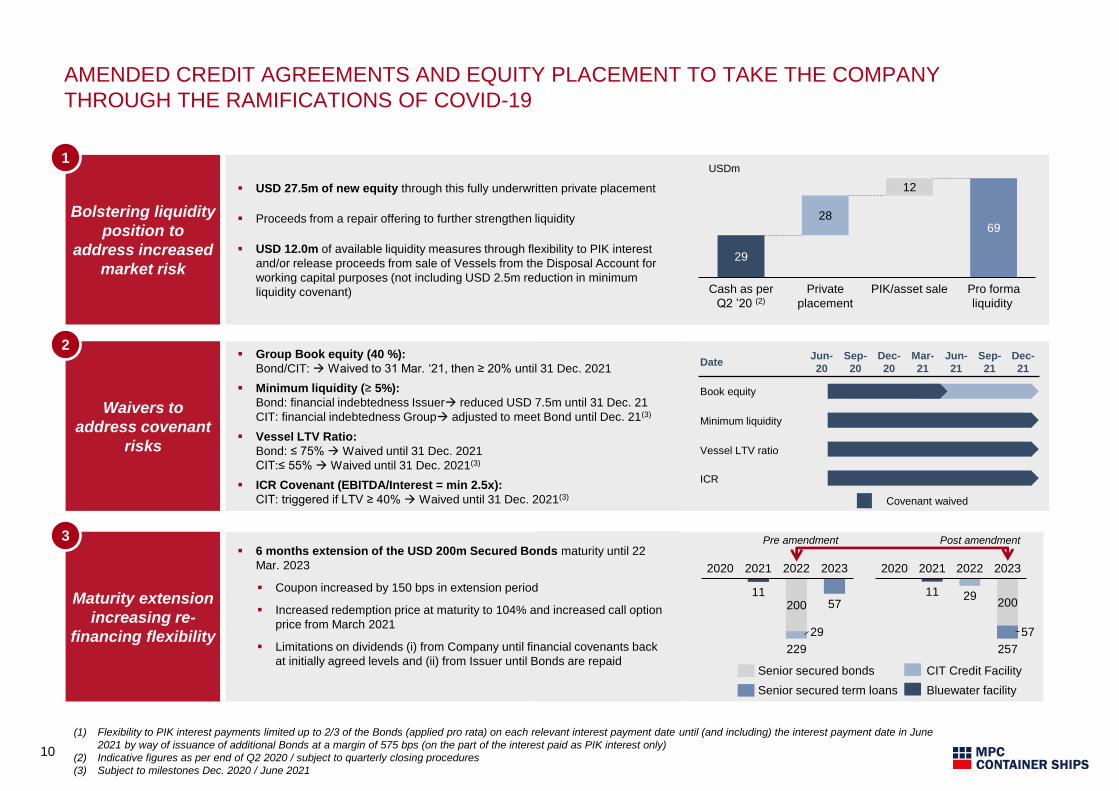
AMENDED CREDIT AGREEMENTS AND EQUITY PLACEMENT TO TAKE THE COMPANY
THROUGH THE RAMIFICATIONS OF COVID-19
Bolstering liquidity
position to
address increased
market risk
1
USD 27.5m of new equity through this fully underwritten private placement
Proceeds from a repair offering to further strengthen liquidity
USD 12.0m of available liquidity measures through flexibility to PIK interest
and/or release proceeds from sale of Vessels from the Disposal Account for
working capital purposes (not including USD 2.5m reduction in minimum
liquidity covenant)
Maturity extension
increasing re-
financing flexibility
6 months extension of the USD 200m Secured Bonds maturity until 22
Mar. 2023
Coupon increased by 150 bps in extension period
Increased redemption price at maturity to 104% and increased call option
price from March 2021
Limitations on dividends (i) from Company until financial covenants back
at initially agreed levels and (ii) from Issuer until Bonds are repaidSenior secured bonds
Bluewater facility
CIT Credit Facility
Senior secured term loans
3
Waivers to
address covenant
risks
2 Group Book equity (40 %):
Bond/CIT: Waived to 31 Mar. ‘21, then ≥ 20% until 31 Dec. 2021
Minimum liquidity (≥ 5%):
Bond: financial indebtedness Issuer reduced USD 7.5m until 31 Dec. 21
CIT: financial indebtedness Group adjusted to meet Bond until Dec. 21(3)
Vessel LTV Ratio:
Bond: ≤ 75% Waived until 31 Dec. 2021
CIT:≤ 55% Waived until 31 Dec. 2021(3)
ICR Covenant (EBITDA/Interest = min 2.5x):
CIT: triggered if LTV ≥ 40% Waived until 31 Dec. 2021(3)
(1) Flexibility to PIK interest payments limited up to 2/3 of the Bonds (applied pro rata) on each relevant interest payment date until (and including) the interest payment date in June
2021 by way of issuance of additional Bonds at a margin of 575 bps (on the part of the interest paid as PIK interest only)
(2) Indicative figures as per end of Q2 2020 / subject to quarterly closing procedures
(3) Subject to milestones Dec. 2020 / June 2021
29
6928
12
Private
placement
Cash as per
Q2 ’20 (2)
PIK/asset sale Pro forma
liquidity
USDm
11200 57
29
2020 20222021 2023
229
11 29200
57
20222020 2021 2023
257
Pre amendment Post amendment
DateJun-
20
Sep-
20
Dec-
20
Mar-
21
Jun-
21
Sep-
21
Dec-
21
Book equity
Minimum liquidity
Vessel LTV ratio
ICR
Covenant waived
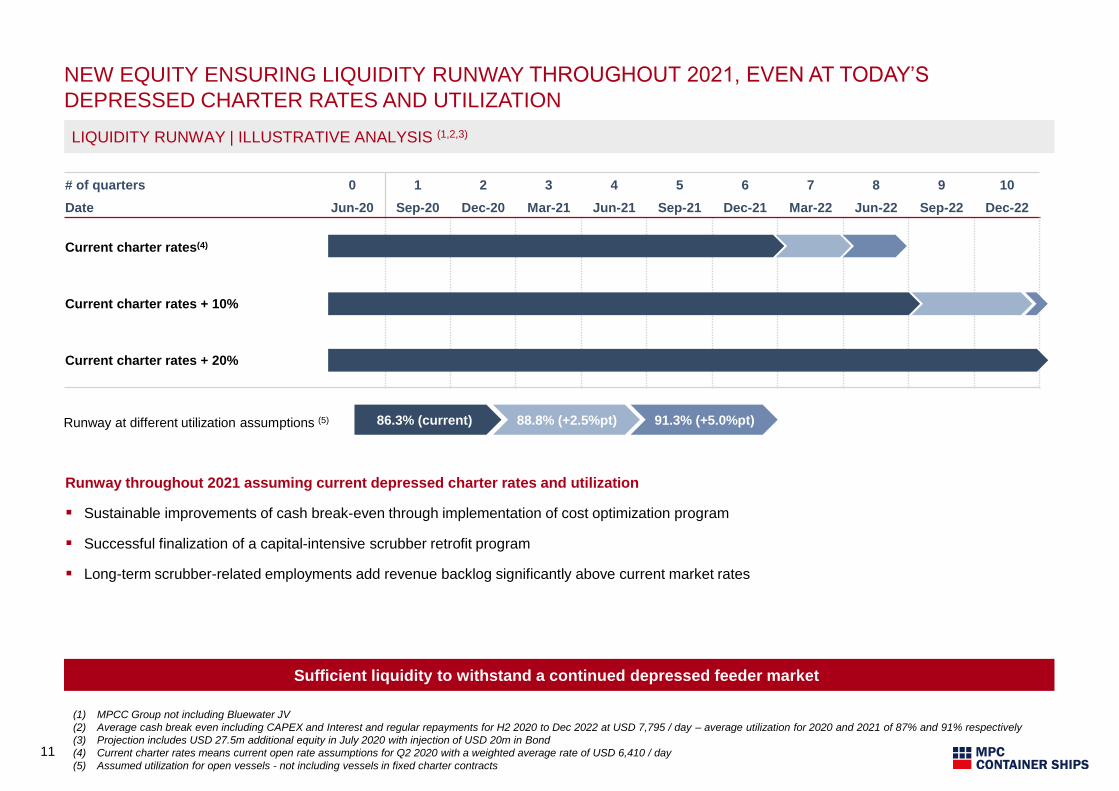
NEW EQUITY ENSURING LIQUIDITY RUNWAY THROUGHOUT 2021, EVEN AT TODAY’S
DEPRESSED CHARTER RATES AND UTILIZATION
11
LIQUIDITY RUNWAY | ILLUSTRATIVE ANALYSIS (1,2,3)
(1) MPCC Group not including Bluewater JV
(2) Average cash break even including CAPEX and Interest and regular repayments for H2 2020 to Dec 2022 at USD 7,795 / day – average utilization for 2020 and 2021 of 87% and 91% respectively
(3) Projection includes USD 27.5m additional equity in July 2020 with injection of USD 20m in Bond
(4) Current charter rates means current open rate assumptions for Q2 2020 with a weighted average rate of USD 6,410 / day
(5) Assumed utilization for open vessels - not including vessels in fixed charter contracts
Sufficient liquidity to withstand a continued depressed feeder market
# of quarters 0 1 2 3 4 5 6 7 8 9 10
Date Jun-20 Sep-20 Dec-20 Mar-21 Jun-21 Sep-21 Dec-21 Mar-22 Jun-22 Sep-22 Dec-22
Current charter rates(4)
Current charter rates + 10%
Current charter rates + 20%
88.8% (+2.5%pt) 91.3% (+5.0%pt)86.3% (current)Runway at different utilization assumptions (5)
Runway throughout 2021 assuming current depressed charter rates and utilization
Sustainable improvements of cash break-even through implementation of cost optimization program
Successful finalization of a capital-intensive scrubber retrofit program
Long-term scrubber-related employments add revenue backlog significantly above current market rates
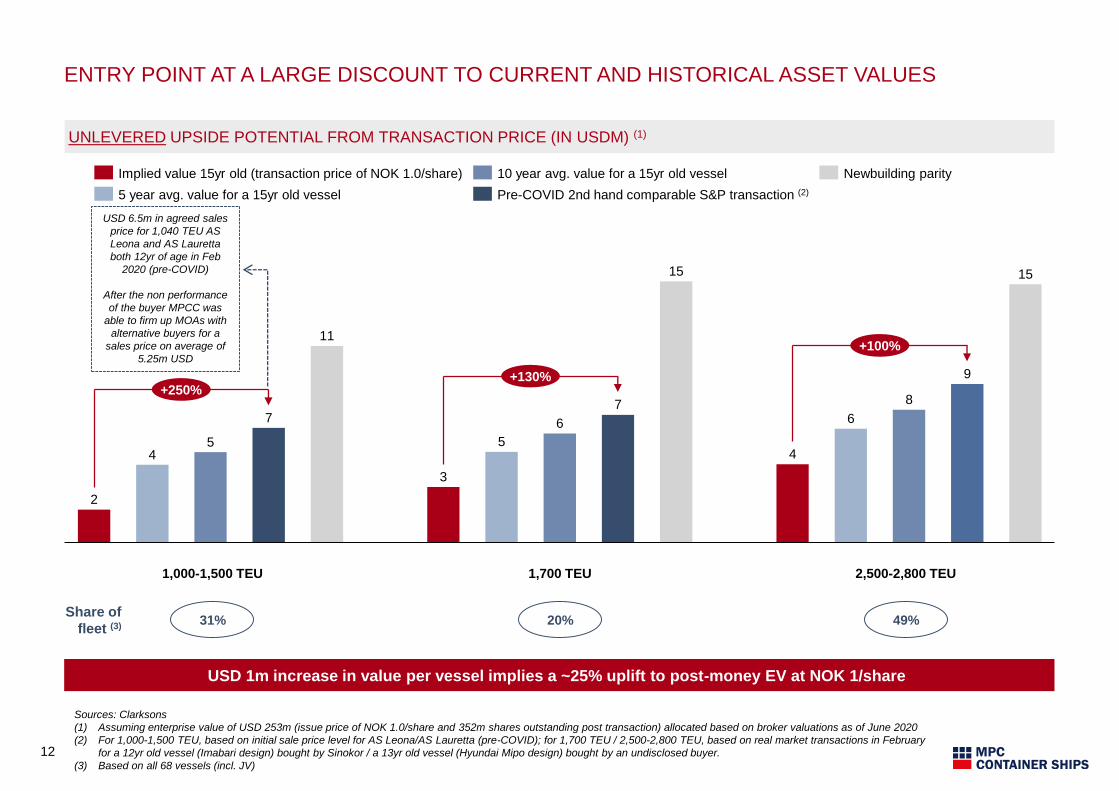
ENTRY POINT AT A LARGE DISCOUNT TO CURRENT AND HISTORICAL ASSET VALUES
12
Sources: Clarksons
(1) Assuming enterprise value of USD 253m (issue price of NOK 1.0/share and 352m shares outstanding post transaction) allocated based on broker valuations as of June 2020
(2) For 1,000-1,500 TEU, based on initial sale price level for AS Leona/AS Lauretta (pre-COVID); for 1,700 TEU / 2,500-2,800 TEU, based on real market transactions in February
for a 12yr old vessel (Imabari design) bought by Sinokor / a 13yr old vessel (Hyundai Mipo design) bought by an undisclosed buyer.
(3) Based on all 68 vessels (incl. JV)
UNLEVERED UPSIDE POTENTIAL FROM TRANSACTION PRICE (IN USDM) (1)
2
45
7
11
3
5
6
7
15
4
6
8
9
15
2,500-
2,800
TEU
(avg.
2,655
TEU)
1,000 –
1,500
TEU
(avg.
1,270
TEU)
1,700
TEU
+250%+130%
+100%
31% 20% 49%
Pre-COVID 2nd hand comparable S&P transaction (2)
Implied value 15yr old (transaction price of NOK 1.0/share)
5 year avg. value for a 15yr old vessel
Newbuilding parity10 year avg. value for a 15yr old vessel
1,700 TEU1,000-1,500 TEU 2,500-2,800 TEU
Share of
fleet (3)
USD 6.5m in agreed sales
price for 1,040 TEU AS
Leona and AS Lauretta
both 12yr of age in Feb
2020 (pre-COVID)
After the non performance
of the buyer MPCC was
able to firm up MOAs with
alternative buyers for a
sales price on average of
5.25m USD
USD 1m increase in value per vessel implies a ~25% uplift to post-money EV at NOK 1/share
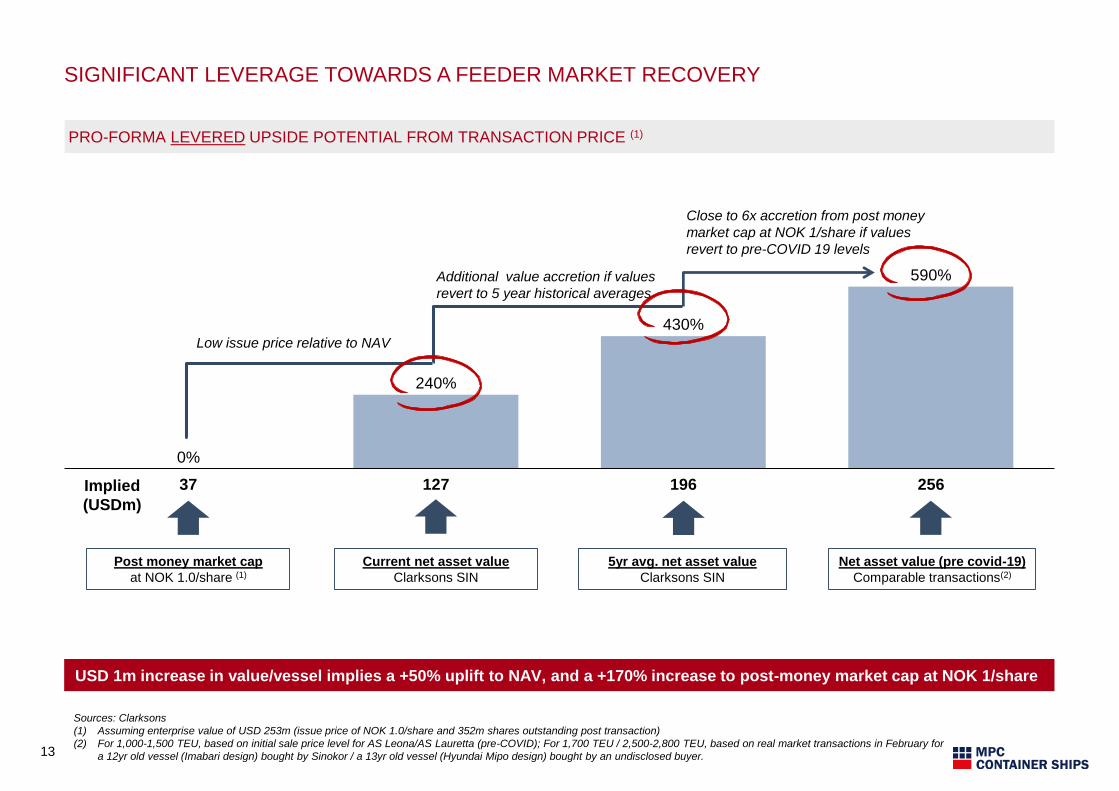
SIGNIFICANT LEVERAGE TOWARDS A FEEDER MARKET RECOVERY
13
Sources: Clarksons
(1) Assuming enterprise value of USD 253m (issue price of NOK 1.0/share and 352m shares outstanding post transaction)
(2) For 1,000-1,500 TEU, based on initial sale price level for AS Leona/AS Lauretta (pre-COVID); For 1,700 TEU / 2,500-2,800 TEU, based on real market transactions in February for
a 12yr old vessel (Imabari design) bought by Sinokor / a 13yr old vessel (Hyundai Mipo design) bought by an undisclosed buyer.
USD 1m increase in value/vessel implies a +50% uplift to NAV, and a +170% increase to post-money market cap at NOK 1/share
196
430%
240%
37 127
0%
590%
256
Post money market cap
at NOK 1.0/share (1)
Current net asset value
Clarksons SIN
5yr avg. net asset value
Clarksons SIN
Net asset value (pre covid-19)
Comparable transactions(2)
Low issue price relative to NAV
Additional value accretion if values
revert to 5 year historical averages
Close to 6x accretion from post money
market cap at NOK 1/share if values
revert to pre-COVID 19 levels
Implied
(USDm)
PRO-FORMA LEVERED UPSIDE POTENTIAL FROM TRANSACTION PRICE (1)
14
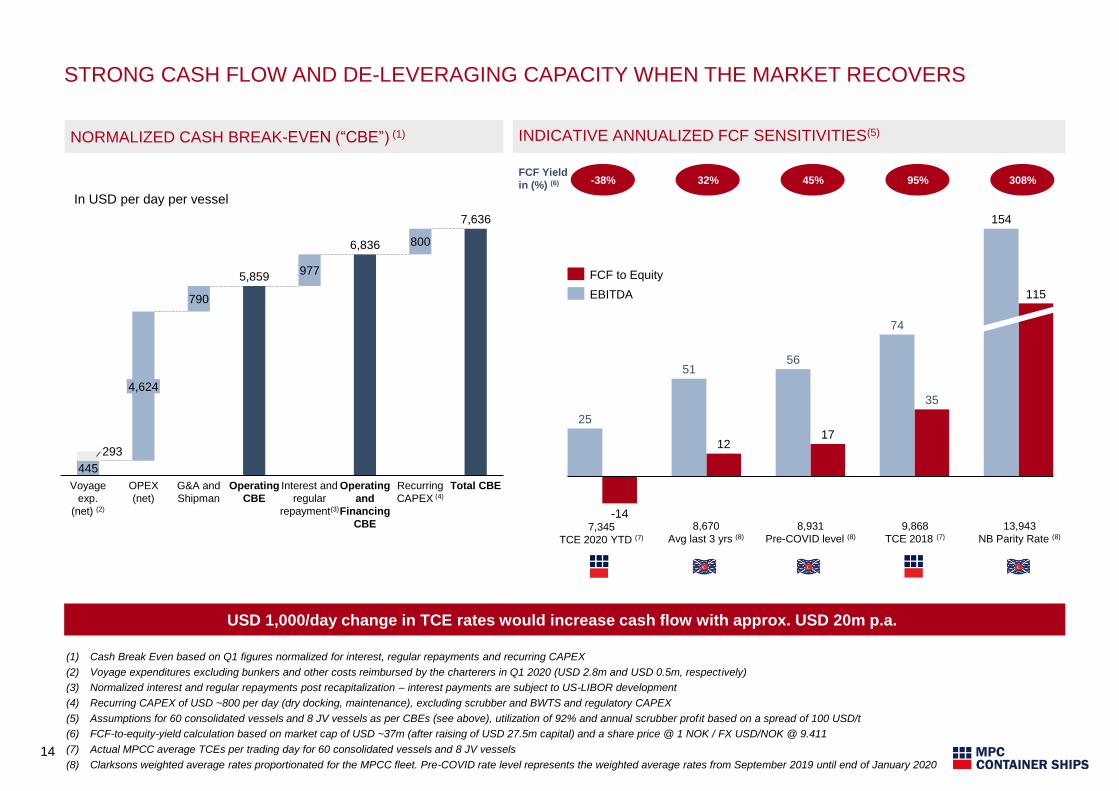
STRONG CASH FLOW AND DE-LEVERAGING CAPACITY WHEN THE MARKET RECOVERS
NORMALIZED CASH BREAK-EVEN (“CBE”) (1)
25
-14
51
12
56
17
74
35
115
154
FCF to Equity
EBITDA
INDICATIVE ANNUALIZED FCF SENSITIVITIES(5)
7,345
TCE 2020 YTD (7)
-38% 32% 45% 95%FCF Yield
in (%) (6)
445
5,859
6,836
7,636
293
790
977
800
G&A and
Shipman
Recurring
CAPEX (4)
Operating
and
Financing
CBE
Interest and
regular
repayment(3)
OPEX
(net)
Voyage
exp.
(net) (2)
4,624
Operating
CBE
Total CBE
In USD per day per vessel
8,670
Avg last 3 yrs (8)
8,931
Pre-COVID level (8)
9,868
TCE 2018 (7)
13,943
NB Parity Rate (8)
308%
(1) Cash Break Even based on Q1 figures normalized for interest, regular repayments and recurring CAPEX
(2) Voyage expenditures excluding bunkers and other costs reimbursed by the charterers in Q1 2020 (USD 2.8m and USD 0.5m, respectively)
(3) Normalized interest and regular repayments post recapitalization – interest payments are subject to US-LIBOR development
(4) Recurring CAPEX of USD ~800 per day (dry docking, maintenance), excluding scrubber and BWTS and regulatory CAPEX
(5) Assumptions for 60 consolidated vessels and 8 JV vessels as per CBEs (see above), utilization of 92% and annual scrubber profit based on a spread of 100 USD/t
(6) FCF-to-equity-yield calculation based on market cap of USD ~37m (after raising of USD 27.5m capital) and a share price @ 1 NOK / FX USD/NOK @ 9.411
(7) Actual MPCC average TCEs per trading day for 60 consolidated vessels and 8 JV vessels
(8) Clarksons weighted average rates proportionated for the MPCC fleet. Pre-COVID rate level represents the weighted average rates from September 2019 until end of January 2020
USD 1,000/day change in TCE rates would increase cash flow with approx. USD 20m p.a.
SUMMARY
15
Robust liquidity position and covenant waivers to sustain a continued challenging market following COVID-19
Strong de-leveraging capacity in the next up-cycle through low cash breakeven on a 68 strong feeder fleet with
significant earnings capacity
Extension of maturity increasing re-financing flexibility and added cash-build potential from the anticipated up-
cycle
Highly attractive entry point with asset values close to historical lows and issue price at discount to gross and net
asset values
Significant leverage towards a feeder market recovery: USD 1m uplift in value per vessel, implies a +50% uplift to
NAV, and a +170% relative increase to post-money market cap at NOK 1/share
Transaction Background
Investment Opportunity
Company Update
Market Update
Risk Factors
Appendix
AGENDA
16
KEY FIGURES Q1 2020
17
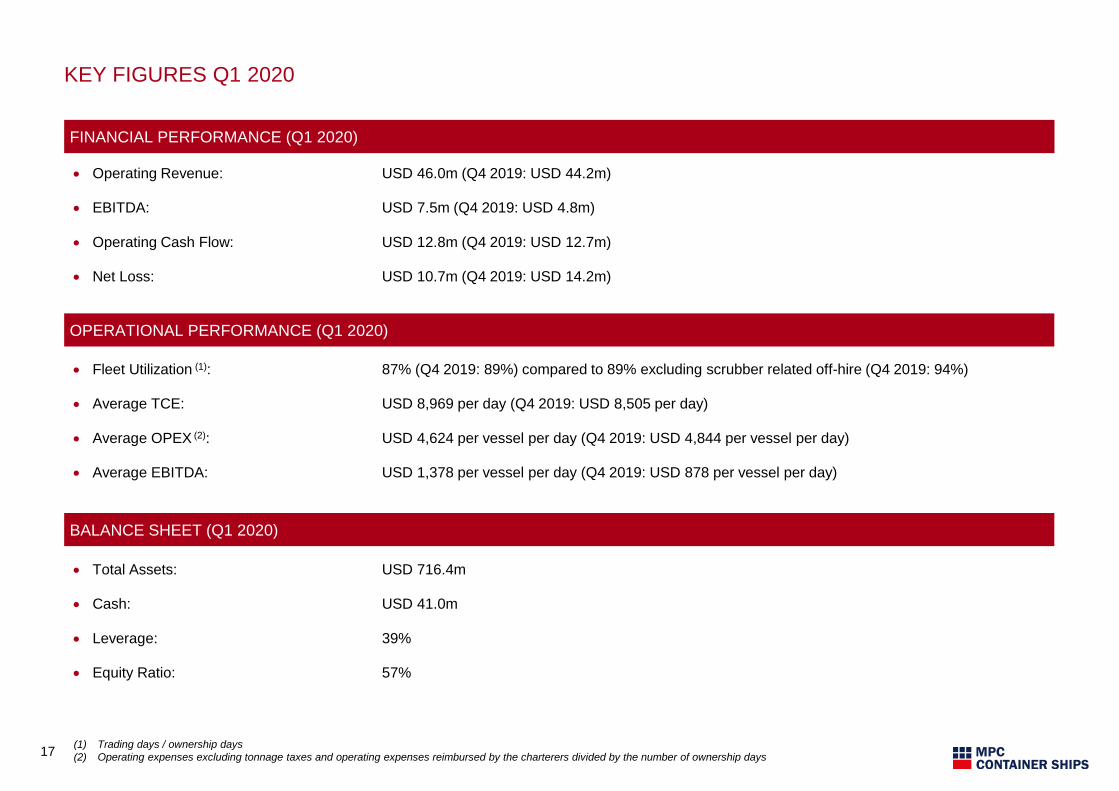
FINANCIAL PERFORMANCE (Q1 2020)
Operating Revenue: USD 46.0m (Q4 2019: USD 44.2m)
EBITDA: USD 7.5m (Q4 2019: USD 4.8m)
Operating Cash Flow: USD 12.8m (Q4 2019: USD 12.7m)
Net Loss: USD 10.7m (Q4 2019: USD 14.2m)
OPERATIONAL PERFORMANCE (Q1 2020)
Fleet Utilization (1): 87% (Q4 2019: 89%) compared to 89% excluding scrubber related off-hire (Q4 2019: 94%)
Average TCE: USD 8,969 per day (Q4 2019: USD 8,505 per day)
Average OPEX (2): USD 4,624 per vessel per day (Q4 2019: USD 4,844 per vessel per day)
Average EBITDA: USD 1,378 per vessel per day (Q4 2019: USD 878 per vessel per day)
BALANCE SHEET (Q1 2020)
Total Assets: USD 716.4m
Cash: USD 41.0m
Leverage: 39%
Equity Ratio: 57%
(1) Trading days / ownership days
(2) Operating expenses excluding tonnage taxes and operating expenses reimbursed by the charterers divided by the number of ownership days
KEY DEVELOPMENTS YTD 2020
18
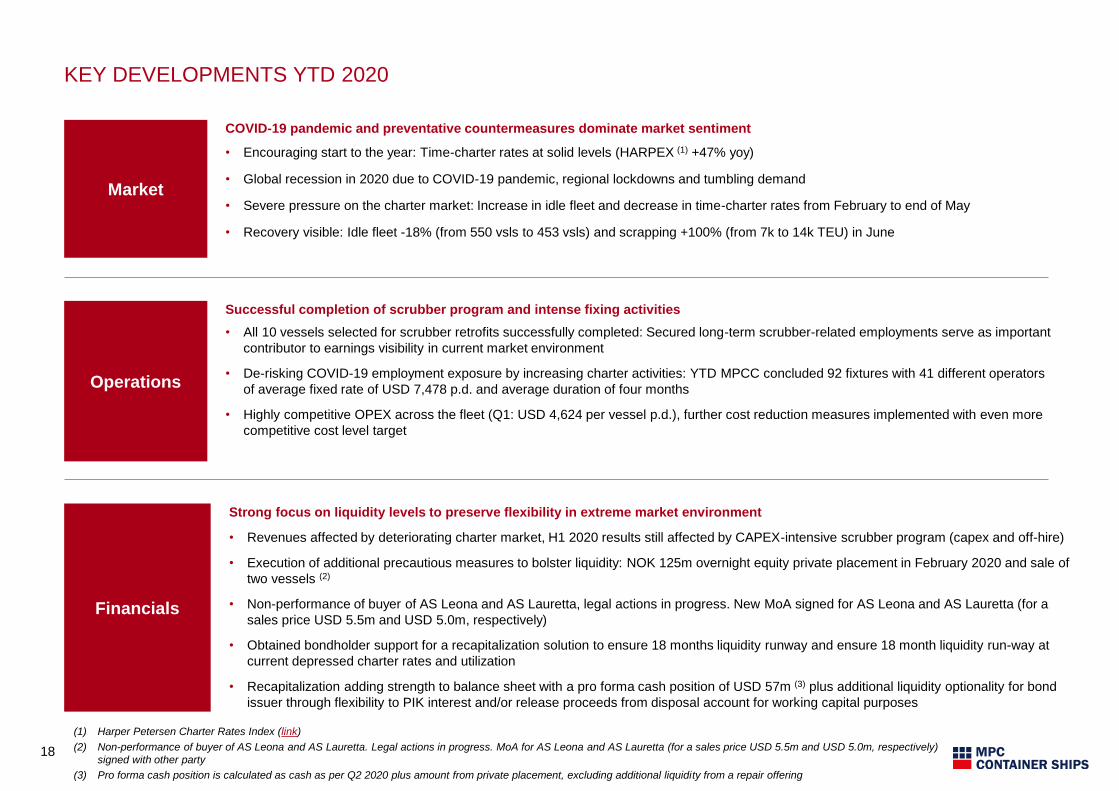
Strong focus on liquidity levels to preserve flexibility in extreme market environment
• Revenues affected by deteriorating charter market, H1 2020 results still affected by CAPEX-intensive scrubber program (capex and off-hire)
• Execution of additional precautious measures to bolster liquidity: NOK 125m overnight equity private placement in February 2020 and sale of
two vessels (2)
• Non-performance of buyer of AS Leona and AS Lauretta, legal actions in progress. New MoA signed for AS Leona and AS Lauretta (for a
sales price USD 5.5m and USD 5.0m, respectively)
• Obtained bondholder support for a recapitalization solution to ensure 18 months liquidity runway and ensure 18 month liquidity run-way at
current depressed charter rates and utilization
• Recapitalization adding strength to balance sheet with a pro forma cash position of USD 57m (3) plus additional liquidity optionality for bond
issuer through flexibility to PIK interest and/or release proceeds from disposal account for working capital purposes
Financials
Market
COVID-19 pandemic and preventative countermeasures dominate market sentiment
• Encouraging start to the year: Time-charter rates at solid levels (HARPEX (1) +47% yoy)
• Global recession in 2020 due to COVID-19 pandemic, regional lockdowns and tumbling demand
• Severe pressure on the charter market: Increase in idle fleet and decrease in time-charter rates from February to end of May
• Recovery visible: Idle fleet -18% (from 550 vsls to 453 vsls) and scrapping +100% (from 7k to 14k TEU) in June
Successful completion of scrubber program and intense fixing activities
• All 10 vessels selected for scrubber retrofits successfully completed: Secured long-term scrubber-related employments serve as important
contributor to earnings visibility in current market environment
• De-risking COVID-19 employment exposure by increasing charter activities: YTD MPCC concluded 92 fixtures with 41 different operators
of average fixed rate of USD 7,478 p.d. and average duration of four months
• Highly competitive OPEX across the fleet (Q1: USD 4,624 per vessel p.d.), further cost reduction measures implemented with even more
competitive cost level target
Operations
(1) Harper Petersen Charter Rates Index (link)
(2) Non-performance of buyer of AS Leona and AS Lauretta. Legal actions in progress. MoA for AS Leona and AS Lauretta (for a sales price USD 5.5m and USD 5.0m, respectively)
signed with other party
(3) Pro forma cash position is calculated as cash as per Q2 2020 plus amount from private placement, excluding additional liquidity from a repair offering
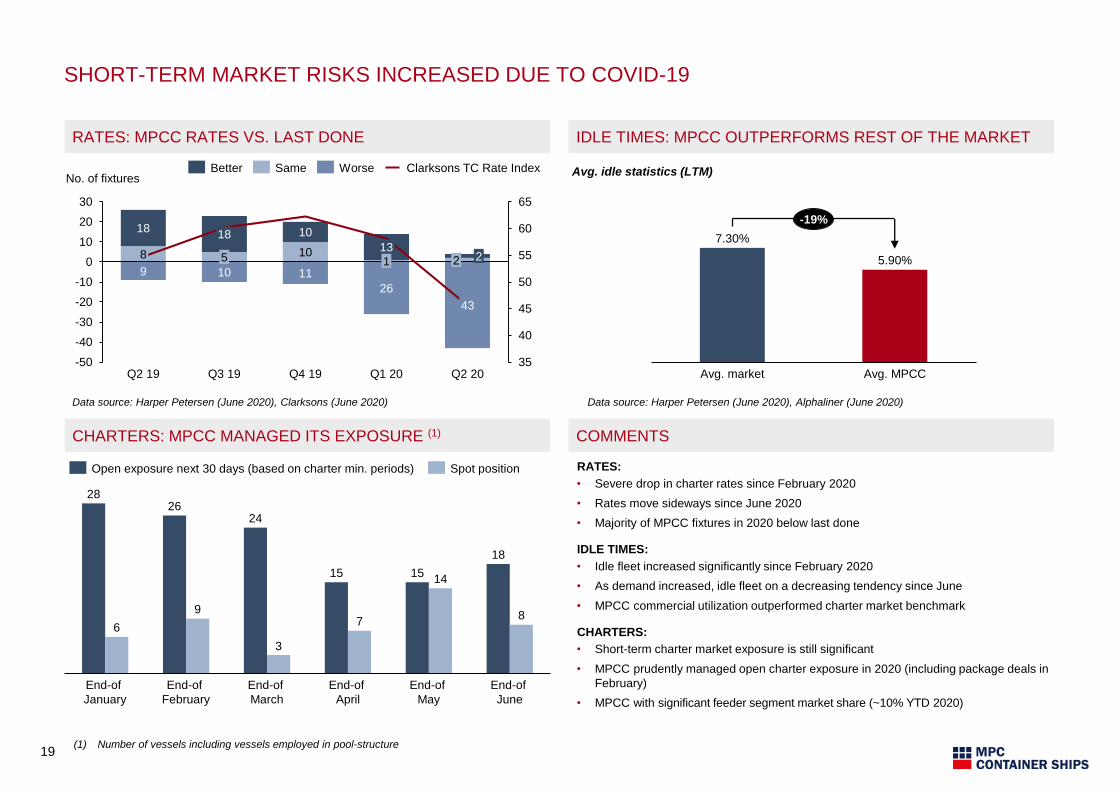
SHORT-TERM MARKET RISKS INCREASED DUE TO COVID-19
19(1) Number of vessels including vessels employed in pool-structure
IDLE TIMES: MPCC OUTPERFORMS REST OF THE MARKETRATES: MPCC RATES VS. LAST DONE
COMMENTSCHARTERS: MPCC MANAGED ITS EXPOSURE (1)
Data source: Harper Petersen (June 2020), Alphaliner (June 2020)Data source: Harper Petersen (June 2020), Clarksons (June 2020)
2826
24
15 15
18
6
9
3
7
14
8
End-of
May
End-of
January
End-of
February
End-of
June
End-of
March
End-of
April
Open exposure next 30 days (based on charter min. periods) Spot position
10
18 10
35
40
45
50
55
60
65
-50
-40
-30
-20
-10
0
10
20
30
No. of fixtures
8
95
10
Q2 19 Q3 19
18
11
Q2 20
26
Q4 19
13
1
Q1 20
22
43
SameBetter Worse Clarksons TC Rate Index
RATES:
• Severe drop in charter rates since February 2020
• Rates move sideways since June 2020
• Majority of MPCC fixtures in 2020 below last done
IDLE TIMES:
• Idle fleet increased significantly since February 2020
• As demand increased, idle fleet on a decreasing tendency since June
• MPCC commercial utilization outperformed charter market benchmark
CHARTERS:
• Short-term charter market exposure is still significant
• MPCC prudently managed open charter exposure in 2020 (including package deals in
February)
• MPCC with significant feeder segment market share (~10% YTD 2020)
7.30%
5.90%
Avg. MPCCAvg. market
-19%
Avg. idle statistics (LTM)
MPCC CONTINUES TO PROACTIVELY MANAGE RISKS & OPPORTUNITIES FOR STAKEHOLDERS
20
Strong and highly competitive operational KPIs
Sustainable improvements of cash-break even through
implementation of cost optimization program
Active relationship and close ties with larger liner companies
and regional operators
One of the most active feeder tonnage providers with 92
charter fixtures concluded YTD 2020 with 41 different counter-
parties (~10% market share in the feeder segment)
Proactive charter approach to curb charter market risk: package
deal for 12-month charters with top-tier liner operator concluded in
Q1 2020
Dedicated to safe operations (e.g. industry-leading Lost Time
Injury Ratio of 0.2 and Total Recordable Cases Ratio of 0.60
YTD 2020)
Governance and Corporate Social Responsibility reporting
in accordance with the Norwegian Corporate Governance Board
and the Norwegian Accounting Act
Promote fair trade to the benefit of society and a maritime
industry free of corruption via the Maritime Anti-Corruption
Network
Exchange know-how through sustainable shipping
partnerships such as the Clean Shipping Alliance 2020 and
the Trident Alliance
Sustainable and socially responsible ship recycling in
accordance with applicable laws and regulations
COMMITTED TO SOUND GOVERNANCE AND ESGLEADING OPERATIONAL PERFORMANCE
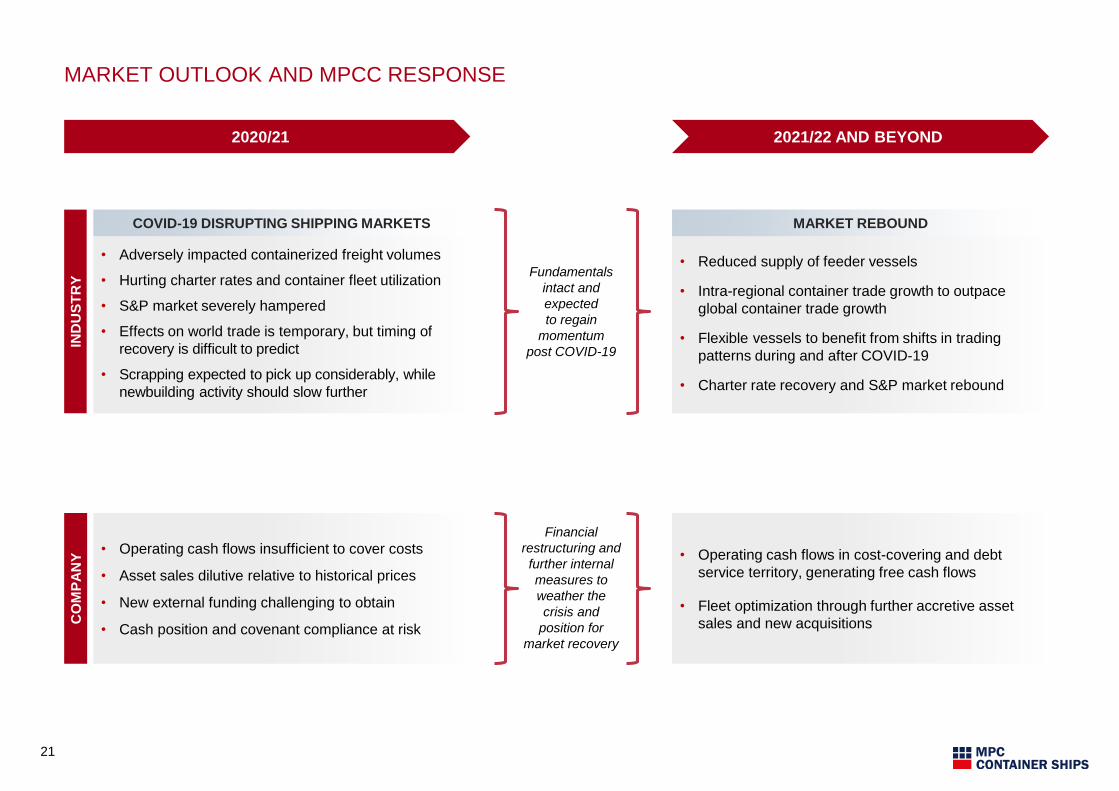
MARKET OUTLOOK AND MPCC RESPONSE
21
2020/21 2021/22 AND BEYOND
• Adversely impacted containerized freight volumes
• Hurting charter rates and container fleet utilization
• S&P market severely hampered
• Effects on world trade is temporary, but timing of
recovery is difficult to predict
• Scrapping expected to pick up considerably, while
newbuilding activity should slow further
COVID-19 DISRUPTING SHIPPING MARKETS
• Reduced supply of feeder vessels
• Intra-regional container trade growth to outpace
global container trade growth
• Flexible vessels to benefit from shifts in trading
patterns during and after COVID-19
• Charter rate recovery and S&P market rebound
MARKET REBOUND
IND
US
TR
YC
OM
PA
NY
• Operating cash flows insufficient to cover costs
• Asset sales dilutive relative to historical prices
• New external funding challenging to obtain
• Cash position and covenant compliance at risk
• Operating cash flows in cost-covering and debt
service territory, generating free cash flows
• Fleet optimization through further accretive asset
sales and new acquisitions
Fundamentals
intact and
expected
to regain
momentum
post COVID-19
Financial
restructuring and
further internal
measures to
weather the
crisis and
position for
market recovery
Transaction Background
Investment Opportunity
Company Update
Market Update
Risk Factors
Appendix
AGENDA
22
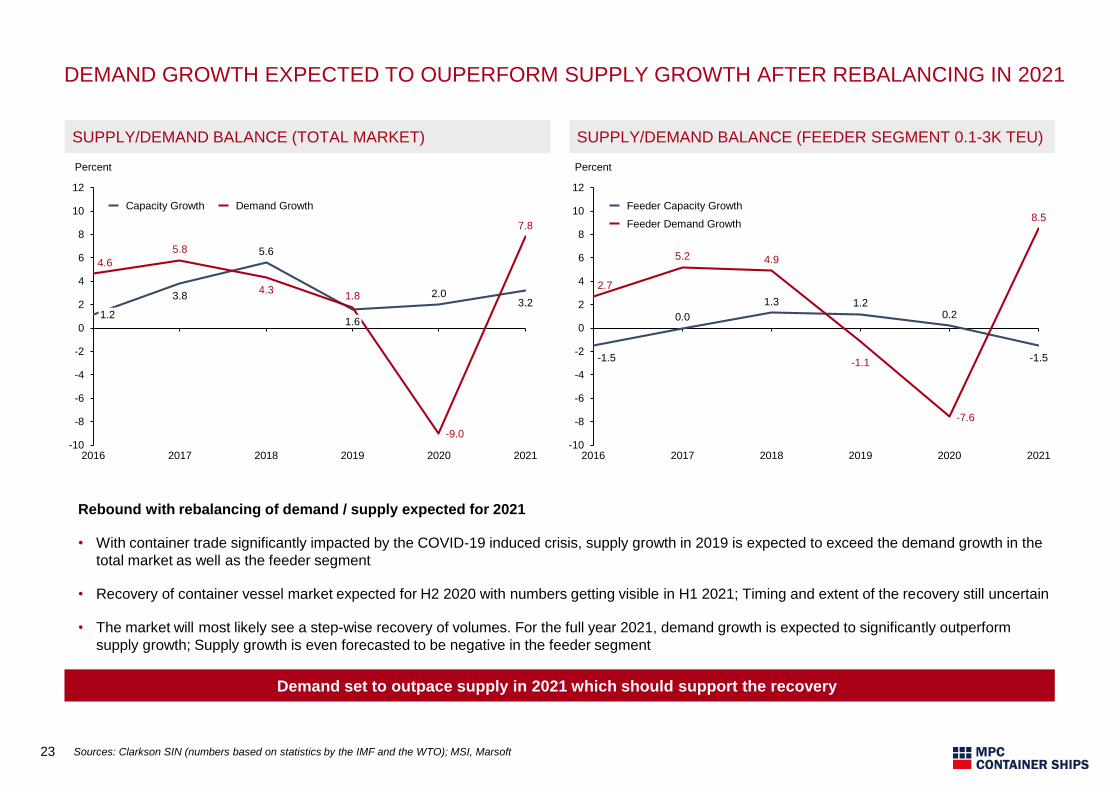
DEMAND GROWTH EXPECTED TO OUPERFORM SUPPLY GROWTH AFTER REBALANCING IN 2021
23 Sources: Clarkson SIN (numbers based on statistics by the IMF and the WTO); MSI, Marsoft
3.8
5.6
2.03.2
4.6
5.8
4.31.8
-9.0
7.8
-10
-8
-6
-4
-2
0
2
4
6
8
10
12
20192016 2017 2018 2020 2021
1.61.2
Percent
Capacity Growth Demand Growth
-1.5
0.0
1.3 1.20.2
-1.5
2.7
5.2 4.9
-1.1
-7.6
8.5
-10
-8
-6
-4
-2
0
2
4
6
8
10
12
2016 201920182017 2020 2021
Percent
Feeder Capacity Growth
Feeder Demand Growth
Rebound with rebalancing of demand / supply expected for 2021
• With container trade significantly impacted by the COVID-19 induced crisis, supply growth in 2019 is expected to exceed the demand growth in the
total market as well as the feeder segment
• Recovery of container vessel market expected for H2 2020 with numbers getting visible in H1 2021; Timing and extent of the recovery still uncertain
• The market will most likely see a step-wise recovery of volumes. For the full year 2021, demand growth is expected to significantly outperform
supply growth; Supply growth is even forecasted to be negative in the feeder segment
Demand set to outpace supply in 2021 which should support the recovery
SUPPLY/DEMAND BALANCE (FEEDER SEGMENT 0.1-3K TEU)SUPPLY/DEMAND BALANCE (TOTAL MARKET)
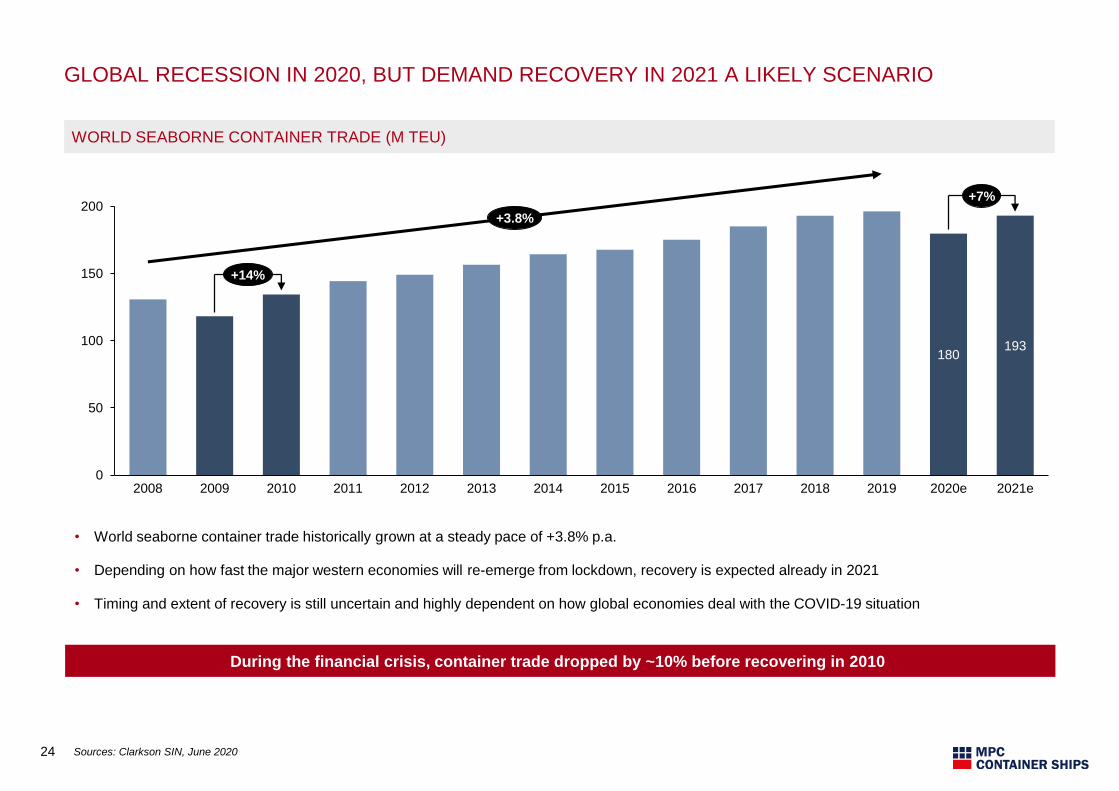
GLOBAL RECESSION IN 2020, BUT DEMAND RECOVERY IN 2021 A LIKELY SCENARIO
24 Sources: Clarkson SIN, June 2020
WORLD SEABORNE CONTAINER TRADE (M TEU)
180193
0
50
100
150
200
2008 201220112009 2010 20142013 2015 2016 2017 2018 2019 2020e 2021e
+14%
+3.8%
+7%
• World seaborne container trade historically grown at a steady pace of +3.8% p.a.
• Depending on how fast the major western economies will re-emerge from lockdown, recovery is expected already in 2021
• Timing and extent of recovery is still uncertain and highly dependent on how global economies deal with the COVID-19 situation
During the financial crisis, container trade dropped by ~10% before recovering in 2010
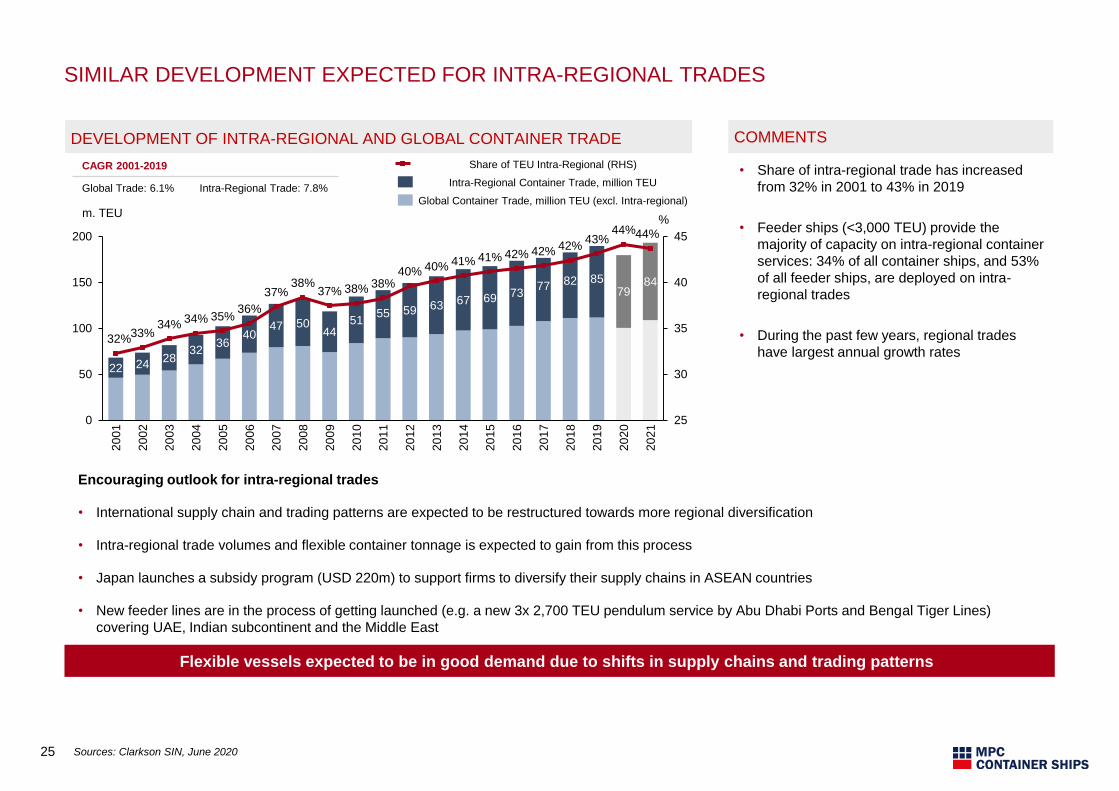
SIMILAR DEVELOPMENT EXPECTED FOR INTRA-REGIONAL TRADES
25 Sources: Clarkson SIN, June 2020
DEVELOPMENT OF INTRA-REGIONAL AND GLOBAL CONTAINER TRADE COMMENTS
Encouraging outlook for intra-regional trades
• International supply chain and trading patterns are expected to be restructured towards more regional diversification
• Intra-regional trade volumes and flexible container tonnage is expected to gain from this process
• Japan launches a subsidy program (USD 220m) to support firms to diversify their supply chains in ASEAN countries
• New feeder lines are in the process of getting launched (e.g. a new 3x 2,700 TEU pendulum service by Abu Dhabi Ports and Bengal Tiger Lines)
covering UAE, Indian subcontinent and the Middle East
• Share of intra-regional trade has increased
from 32% in 2001 to 43% in 2019
• Feeder ships (<3,000 TEU) provide the
majority of capacity on intra-regional container
services: 34% of all container ships, and 53%
of all feeder ships, are deployed on intra-
regional trades
• During the past few years, regional trades
have largest annual growth rates22 24
2832
3640
47 5044
5155 59 63 67 69 73
77 82 8579
84
32%33%
34%34% 35%
36%
37%38%
37% 38%
40% 40% 41% 41%
44%44%
25
30
35
40
45
0
50
100
150
200
38%
20
04
m. TEU
20
07
20
06
%
20
01
20
05
20
02
20
03
20
08
20
09
20
10
20
11
20
19
20
12
20
13
20
14
20
15
42%
20
16
42%
20
17
42%
20
18
43%
20
20
20
21
Share of TEU Intra-Regional (RHS)
Intra-Regional Container Trade, million TEU
Global Container Trade, million TEU (excl. Intra-regional)
CAGR 2001-2019
Global Trade: 6.1% Intra-Regional Trade: 7.8%
Flexible vessels expected to be in good demand due to shifts in supply chains and trading patterns
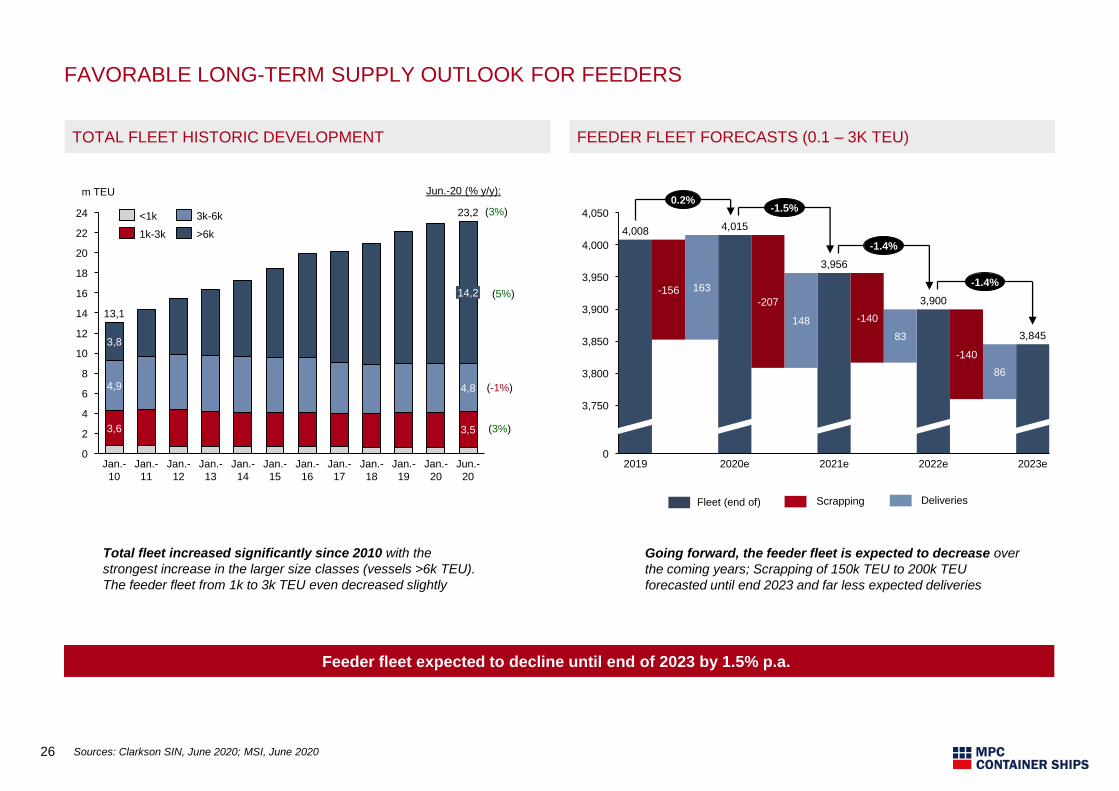
FAVORABLE LONG-TERM SUPPLY OUTLOOK FOR FEEDERS
26 Sources: Clarkson SIN, June 2020; MSI, June 2020
TOTAL FLEET HISTORIC DEVELOPMENT
Total fleet increased significantly since 2010 with the
strongest increase in the larger size classes (vessels >6k TEU).
The feeder fleet from 1k to 3k TEU even decreased slightly
163
148
83
86
4,050
3,850
0
3,900
3,950
4,000
3,750
3,800
2020e2019
-207
-140
-156
2021e 2022e
-140
3,956
2023e
3,845
4,008 4,015
3,900
0.2%-1.5%
-1.4%
-1.4%
FEEDER FLEET FORECASTS (0.1 – 3K TEU)
Going forward, the feeder fleet is expected to decrease over
the coming years; Scrapping of 150k TEU to 200k TEU
forecasted until end 2023 and far less expected deliveries
Scrapping Deliveries
Feeder fleet expected to decline until end of 2023 by 1.5% p.a.
Fleet (end of)
16
18
24
0
12
22
20
2
4
14
6
10
8
Jan.-
20
3,6
Jan.-
15
Jan.-
12
Jan.-
14
Jan.-
19
m TEU
3,8
4,9
23,2
Jun.-
20
Jan.-
10
Jan.-
11
Jan.-
13
Jan.-
16
Jan.-
17
Jan.-
18
14,2
4,8
3,5
13,1
<1k
>6k
3k-6k
1k-3k
Jun.-20 (% y/y):
(3%)
(5%)
(3%)
(-1%)
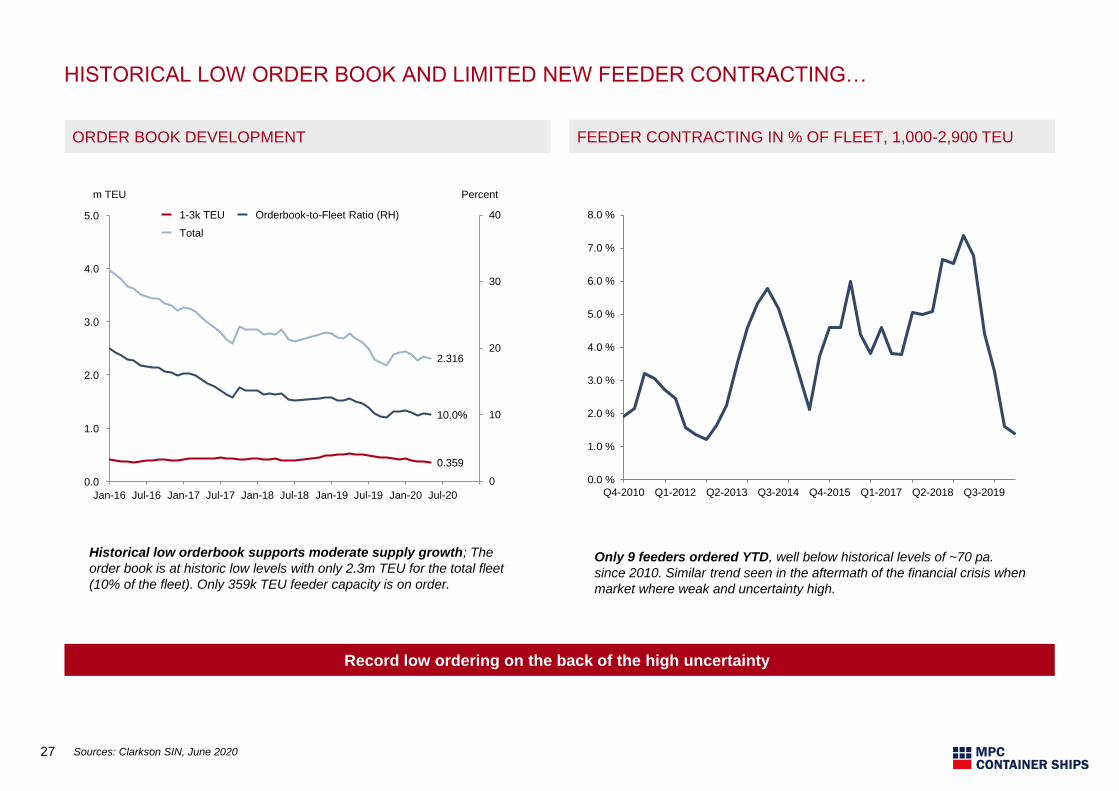
HISTORICAL LOW ORDER BOOK AND LIMITED NEW FEEDER CONTRACTING…
27 Sources: Clarkson SIN, June 2020
ORDER BOOK DEVELOPMENT
Only 9 feeders ordered YTD, well below historical levels of ~70 pa.
since 2010. Similar trend seen in the aftermath of the financial crisis when
market where weak and uncertainty high.
0.0 %
1.0 %
2.0 %
3.0 %
4.0 %
5.0 %
6.0 %
7.0 %
8.0 %
Q4-2010 Q1-2012 Q2-2013 Q3-2014 Q4-2015 Q1-2017 Q2-2018 Q3-2019
FEEDER CONTRACTING IN % OF FLEET, 1,000-2,900 TEU
Historical low orderbook supports moderate supply growth; The
order book is at historic low levels with only 2.3m TEU for the total fleet
(10% of the fleet). Only 359k TEU feeder capacity is on order.
Record low ordering on the back of the high uncertainty
10.0%
0
10
20
30
40
2.0
Jan-16 Jul-16 Jan-18Jul-17Jan-17 Jul-20Jul-18 Jan-19 Jul-19 Jan-20
3.0
0.0
1.0
4.0
5.0
2.316
m TEU Percent
0.359
1-3k TEU
Total
Orderbook-to-Fleet Ratio (RH)
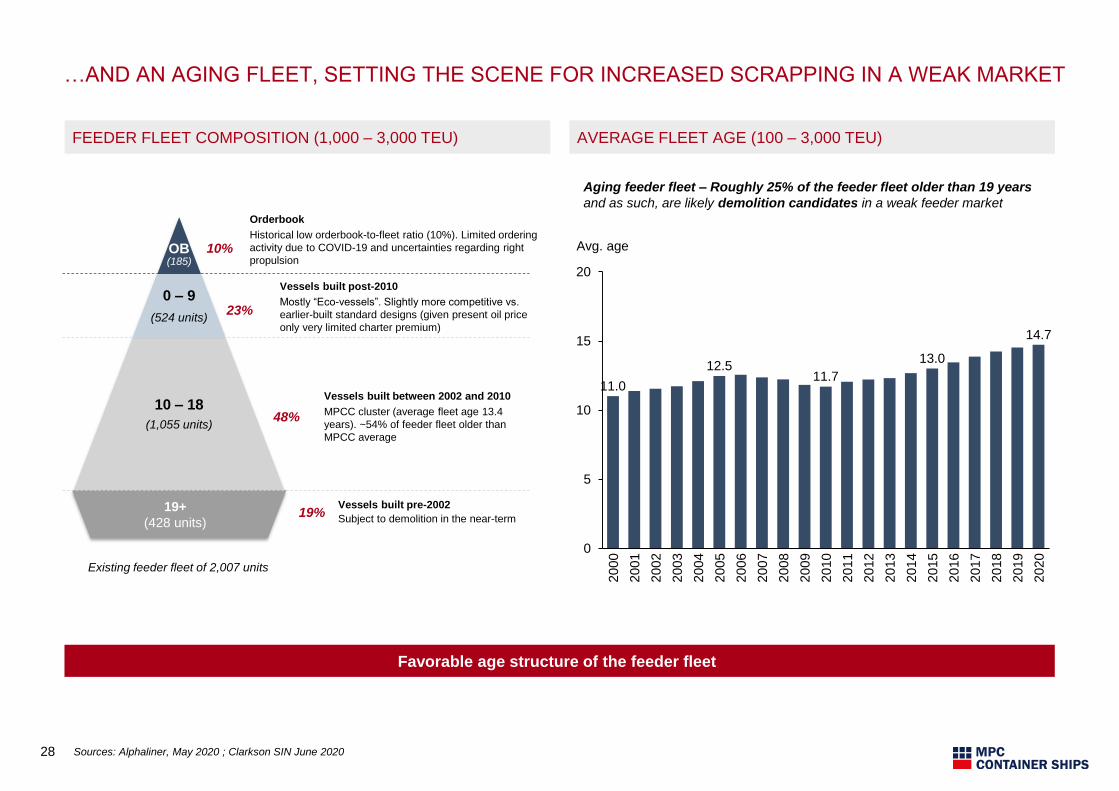
…AND AN AGING FLEET, SETTING THE SCENE FOR INCREASED SCRAPPING IN A WEAK MARKET
28 Sources: Alphaliner, May 2020 ; Clarkson SIN June 2020
AVERAGE FLEET AGE (100 – 3,000 TEU)FEEDER FLEET COMPOSITION (1,000 – 3,000 TEU)
Aging feeder fleet – Roughly 25% of the feeder fleet older than 19 years
and as such, are likely demolition candidates in a weak feeder market
11.0
12.511.7
13.0
14.7
0
5
10
15
20
2004
2000
Avg. age
2003
2001
2002
2018
2005
2006
2007
2008
2009
2019
2015
2010
2011
2012
2016
2013
2014
2017
2020
Favorable age structure of the feeder fleet
OB (185)
0 – 9
(524 units)
10 – 18
(1,055 units)
+19
(483 units)
10%
23%
48%
19%
Orderbook
Historical low orderbook-to-fleet ratio (10%). Limited ordering
activity due to COVID-19 and uncertainties regarding right
propulsion
Vessels built post-2010
Mostly “Eco-vessels”. Slightly more competitive vs.
earlier-built standard designs (given present oil price
only very limited charter premium)
Vessels built between 2002 and 2010
MPCC cluster (average fleet age 13.4
years). ~54% of feeder fleet older than
MPCC average
Vessels built pre-2002
Subject to demolition in the near-term
Existing feeder fleet of 2,007 units
19+
(428 units)
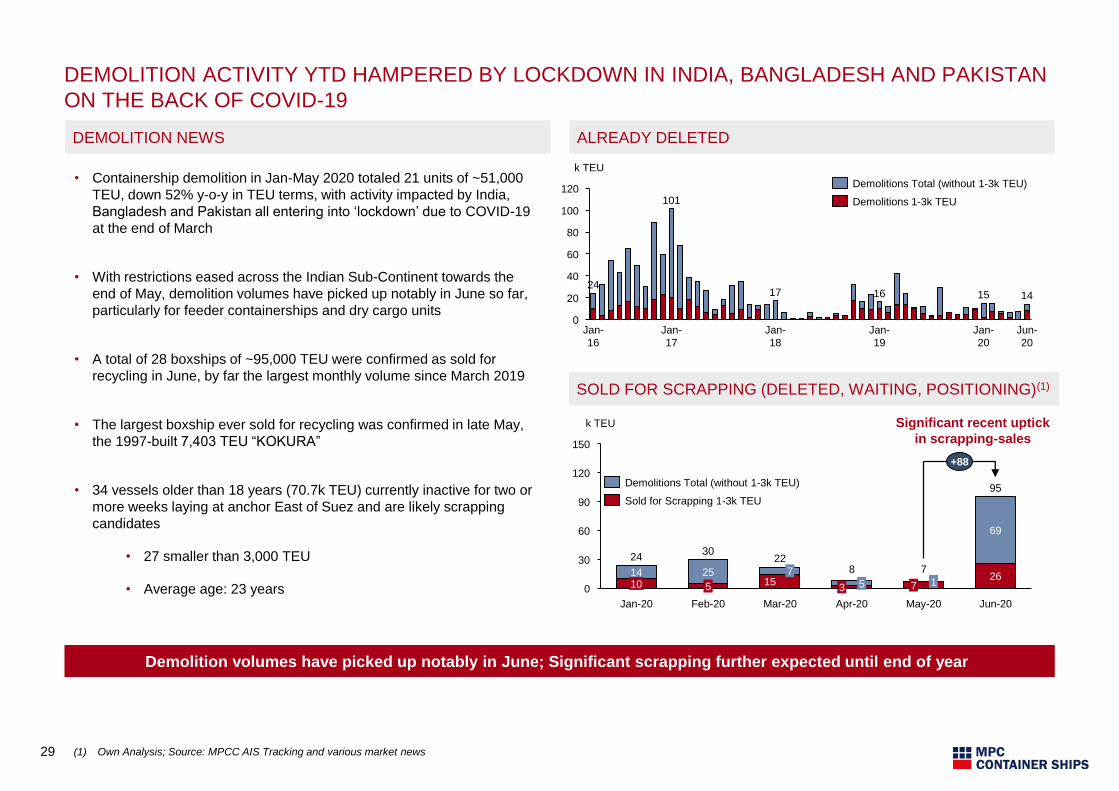
DEMOLITION ACTIVITY YTD HAMPERED BY LOCKDOWN IN INDIA, BANGLADESH AND PAKISTAN
ON THE BACK OF COVID-19
29 (1) Own Analysis; Source: MPCC AIS Tracking and various market news
ALREADY DELETEDDEMOLITION NEWS
• Containership demolition in Jan-May 2020 totaled 21 units of ~51,000
TEU, down 52% y-o-y in TEU terms, with activity impacted by India,
Bangladesh and Pakistan all entering into ‘lockdown’ due to COVID-19
at the end of March
• With restrictions eased across the Indian Sub-Continent towards the
end of May, demolition volumes have picked up notably in June so far,
particularly for feeder containerships and dry cargo units
• A total of 28 boxships of ~95,000 TEU were confirmed as sold for
recycling in June, by far the largest monthly volume since March 2019
• The largest boxship ever sold for recycling was confirmed in late May,
the 1997-built 7,403 TEU “KOKURA”
• 34 vessels older than 18 years (70.7k TEU) currently inactive for two or
more weeks laying at anchor East of Suez and are likely scrapping
candidates
• 27 smaller than 3,000 TEU
• Average age: 23 years
120
80
0
20
40
60
100101
k TEU
Jan-
19
Jan-
16
Jan-
17
15
Jan-
18
Jan-
20
Jun-
20
2417 16 14
90
0
120
30
60
150
26
Feb-20
k TEU
Jan-20
1025
5
22
1415
Mar-20
53
Apr-20
24
17
May-20
7
69
Jun-20
8
30
95
7
+88
SOLD FOR SCRAPPING (DELETED, WAITING, POSITIONING)(1)
Demolitions Total (without 1-3k TEU)
Sold for Scrapping 1-3k TEU
Demolitions Total (without 1-3k TEU)
Demolitions 1-3k TEU
Significant recent uptick
in scrapping-sales
Demolition volumes have picked up notably in June; Significant scrapping further expected until end of year
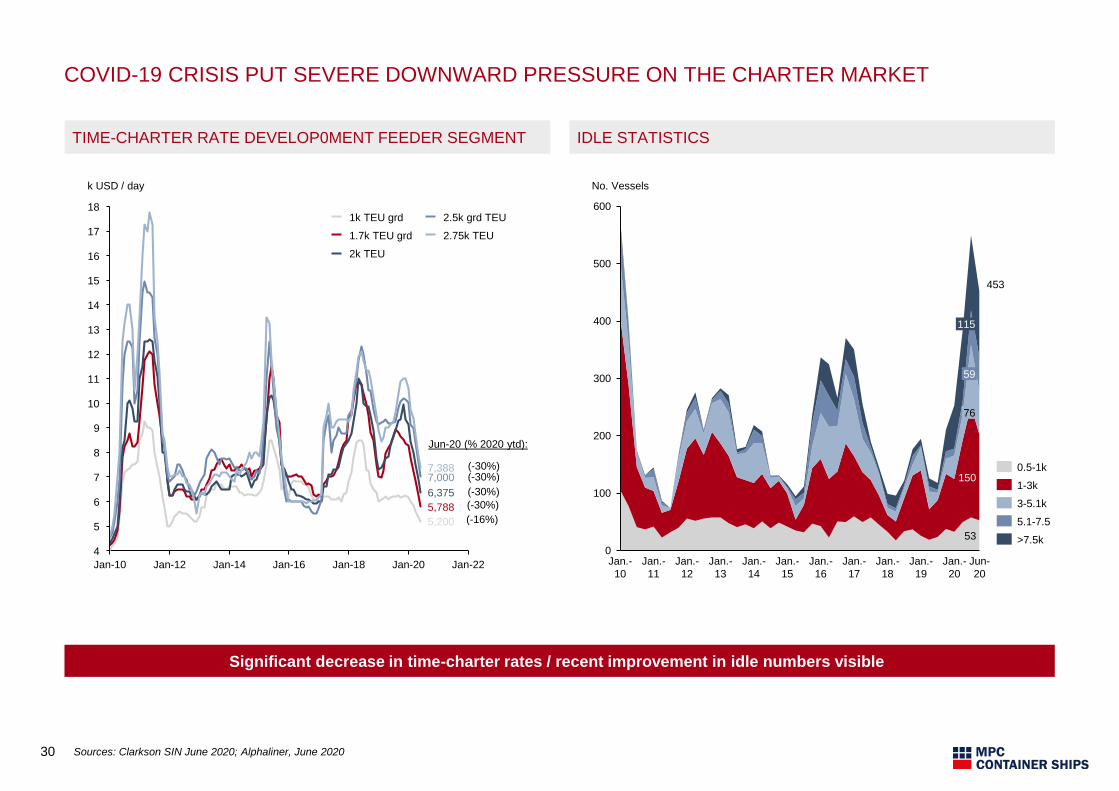
COVID-19 CRISIS PUT SEVERE DOWNWARD PRESSURE ON THE CHARTER MARKET
30 Sources: Clarkson SIN June 2020; Alphaliner, June 2020
IDLE STATISTICSTIME-CHARTER RATE DEVELOP0MENT FEEDER SEGMENT
Significant decrease in time-charter rates / recent improvement in idle numbers visible
Jan-16Jan-10 Jan-12 Jan-14
6
Jan-18 Jan-20
8
Jan-22
5
7
9
10
18
13
11
16
12
14
15
17
4
k USD / day
7,388
5,788
7,000
5,200
6,375
1k TEU grd 2.5k grd TEU
1.7k TEU grd
2k TEU
2.75k TEU
Jun-20 (% 2020 ytd):
(-16%)
(-30%)
(-30%)
(-30%)(-30%)
53
150
0
100
200
300
400
500
600
115
No. Vessels
Jun-
20
Jan.-
19
Jan.-
14
Jan.-
10
Jan.-
12
Jan.-
11
Jan.-
15
Jan.-
13
Jan.-
17
Jan.-
16
Jan.-
18
Jan.-
20
59
76
453
0.5-1k
1-3k
>7.5k
3-5.1k
5.1-7.5
Transaction Background
Investment Opportunity
Company Update
Market Update
Risk Factors
Appendix
AGENDA
31
32
RISK FACTORS
GENERAL
An investment in the Company may be lost in whole or in part
The Company will invest in and operate assets in the container shipping sector which are subject to significant risks. The risks and uncertainties described in this Presentation are risks of which the Company
is aware and considers to be material to its business, and investors in the equity and/or the bonds and other recipients of this Presentation will be deemed to have acknowledged that any investment in the
container sector and the Company will carry a high risk and that, accordingly, an investor may suffer a loss on such investment. Such a loss will be limited to the investor's investment. The investor's return will
be related to the Company's return and will primarily depend on whether the Company will be able to implement its investment strategy and achieve its investment objectives, as well as the general
development in the container shipping sector and the financial markets.
The primary risk factors in connection with an investment in the Company are described below. The description of the risk factors below is not exhaustive, and there may be other risks relevant to the
Company, the Group and its business which are not stated herein. The sequence of the risk factors below is not set out according to importance. If any of the following risks were to materialize, either
individually, cumulatively or together with other circumstances, it could have a material adverse effect on the Group and/or its business, results of operations, cash flows, financial conditions and/or prospects,
which may cause a decline in the value and trading price of the Shares, resulting in a loss of all part of an investment in the Offer Shares. Investors, including without limitation the holders of the bonds, should
carefully consider the factors set out below and elsewhere in this presentation, including but not limited to the cost structure for both the Company and the investors, as well as the investors' current and future
tax position. An investment in the Company entails significant risks and is suitable only for investors who understand the risk factors associated with this type of investment and who can afford a loss of all or
part of the investment. Against this background, investors in the equity and/or the bonds and other recipients of this Presentation should make a careful assessment of the Company and its prospects, and
should consult his or her own expert advisors, before deciding whether or not to support the proposed amendments to the Group's financing arrangements as set out in this Presentation.
The Company is subject to risks relating to the completion of the proposed and agreed financing amendments and its ability to satisfy payment obligations going forward
The Group's earnings and available cash is dependent on the Group's ability to charge profitable hire or freight rates for its vessels. Following the outbreak of COVID-19, the Group is experiencing significantly
reduced charter rates and utilization of its fleet due to lower containerised freight volumes globally, and the order activity in the vessel charter market has been geared towards larger vessels. The Company
has experienced 450 blanked sailings on routes connection Asia, US and Europe, and difficulties selling vessels. These developments are expected to adversely impact the Group's liquidity and ability to be in
compliance with covenants under some of its loan agreements in the short to mid-term. Consequently, the Group has proposed certain amendments to its financing arrangements as set out herein.
The amendments proposed and agreed with respect to the Group's financing arrangements are subject to e.g. documentation and are not completed and such completion is subject to uncertainty. There is a
risk that the relevant amendments to the Group's financing will not be completed as contemplated, or has to be completed on less favourable terms or will not be completed at all. The failure of the Group to
achieve the amendments could have a material adverse impact on the Company’s ability to satisfy its payment obligations and ultimately a risk of a potential bankruptcy (full liquidation) as the ultimate
consequence thereof. There is further a risk that the Company may continue to be unable to satisfy its payments obligations even if it completes the proposed amendments to the Group's financing.
Financial information does not provide a complete overview of the Company's financial condition
The financial information included in this presentation does not provide a complete overview of the Company financial condition. The financial information contains estimates and has not been audited by the
Company's auditor. Any estimates included in this presentation can only be seen as indications for the Company's expected future performance. All financial information contained in this presentation may be
subject to substantial changes.
Past performance is not indicative of future results
In considering the historic performance of the Company, investors should bear in mind that past performance is not necessarily indicative of future results, and there can be no assurance the Company will
achieve comparable results.
33
RISK FACTORS
BUSINESS AND VESSEL RELATED RISKS
The Company is dependent upon container transportation
The Company is dependent on revenues generated from the business of transporting containers. Due to the lack of diversification in the Company's lines of business, an adverse development in the
Company's container business, or in the container shipping industry, generally would have a significant impact on the Company's business, financial condition and results of operations.
Suitable assets for the Company to invest in may not be available and opportunities may be limited by competition
Suitable assets may not always be available at a particular time. The Company's investment rate may be delayed or progress slower than the anticipated rate for a variety of reasons and, as a result, there is
also no guarantee that the Company will be able to fully invest the required amount of the total capital.
The Company may be competing for appropriate investment opportunities with other participants in the markets. It is possible that the level of such competition may increase, which may reduce the number of
opportunities available to the Company and/or adversely affect the terms upon which such investments can be made by the Company. In addition, such competition may have an adverse effect on the length
of time required to fully invest the funds available to the Company.
Due diligence in relation to an investment by the Company may be erroneous or incomplete
The Company will complete reasonable and appropriate technical, commercial and legal due diligence prior to making an investment. Such due diligence will primarily be based on information which may only
be available through certain third parties. Such information may be erroneous, incomplete and/or misleading, and there can be no assurance that all material issues will be uncovered.
The Company is responsible for the technical management of most of the Group’s vessels
The Company has entered into technical ship management agreements with its vessel-owning subsidiaries. The performance of technical ship management services is subcontracted to the specialized ship
managers. Under these agreements, the Company is responsible for the technical management for the Group’s vessels. The Company bears all operational risks associated with the ship management of the
vessels as well as counterparty risks in connection with the sub-contracting of services. The loss of such ship managers' services or their failure to perform their obligations to the Group could materially and
adversely affect the results of the Group's operations.
The Company is reliant on technical and commercial management of assets
Although the Company's management will monitor the performance of each investment, the Company will rely upon the technical and day-to-day management of the assets. There can be no assurance that
such management will operate successfully.
The Company's assets may be illiquid
The Company will own, operate and make investments in assets that are illiquid and not traded on any regulated market. The realisation of such investments may consequently take time and will be exposed
to a variety of general and specific market conditions, see section 1.4 below. There can be no assurance that the Company will be able to sell vessels when required or needed.
The Company's vessels may not be in the technical condition assumed by the Company
The service life of the Company's vessels will depend on many factors, including charterers' preferences with regard to age, as well as the vessels' technical condition, efficiency and the cost of keeping them
in operation compared to their ability to produce earnings. The cost associated with the repair and maintenance of vessels normally increases with age. The Company's vessels may not be in the technical
conditions assumed by the Company. There are to the best of the Company's knowledge no indications from operating the vessels or from other regulatory authorities that the vessels are in unsatisfied
condition.
34
RISK FACTORS
BUSINESS AND VESSEL RELATED RISKS (CONT.)
The Company's vessels may suffer operational downtime
Any operational downtime of the Company's vessels or any failure to secure employment for any vessel, or failure to secure employment for vessels at satisfactory rates will affect the Company's results.
Furthermore, off-hire due to technical or other problems to any vessel could be materially disruptive to the Company's financial results. Operational downtime could come as a result of several factors outside
the Company's control such as a result of repair work. The timing and costs of repairs on the Company's vessels are difficult to predict with certainty and may be substantial. The loss of earnings while these
vessels are being repaired, as well as the actual cost of these repairs, would decrease the Company's results of operations.
Hedging transactions may be insufficient to protect against exposure
The Company or its subsidiaries engage and may engage in the future in certain hedging transactions which are intended to reduce the currency or interest rate exposure; however, there would normally be no
obligation to enter into any such transactions. Such hedging transactions, if entered into, may be insufficient to protect against currency or interest rate exposure, and may also lead to losses for the Company.
The Company may be affected by the spread between LSFO and HSFO
The international maritime organization ("IMO") has passed regulations that from 2020 lower the limit of sulphur content in fuel oil. Most shipping companies are likely to switch from high sulphur fuel oil
("HSFO") to low sulphur fuels oils ("LSFO") or to install exhaust gas cleaning systems ("SCRUBBERS") that allow for continued consumption of HSFO. The Company has installed scrubbers on 10 of its
vessels. For some/all of these scrubber-retrofitted vessels, the Company have entered into, and may in the future enter into, charter parties with savings sharing mechanisms linked to the spread between the
prices of HSFO and LSFO. As a result, the Company will be affected by the spread between the prices of LSFO and HSFO. A reduced LSFO/HSFO spread may have a material negative impact on the
Company.
There are risks related to scrubbers installed on the vessels and the Company may be subject to additional requirements in relation to scrubbers
There are risks related to the use of scrubbers that have been installed on 10 of the Company's vessels, including risks related to the maintenance of scrubbers and any corrosion issues that may arise. There
is also a risk that the IMO will resolve to implement new regulations that may impose additional requirements for scrubbers or restrict the use of scrubbers. This could have a material negative effect on the
Company.
The valuation of the Company's assets is uncertain
The Company will own, operate and invest in assets that are not traded on a regulated market and where the correct valuation at any given point in time will be subject to uncertainty. The Company will
regularly publish valuation reports that are made available to their investors, but these should only be viewed as indicative and there can be no guarantee that the valuations in such reports represent the
values at which the Company can buy or sell.
The Company is subject to liquidity risks
The Company operates in a capital-intensive industry, and it may require additional capital in the future due to unforeseen liabilities, net cash flow shortfalls or in order to take advantage of business
opportunities or to refinance all or part of existing and future debt obligations. There can be no assurance that the Company will be able to obtain necessary capital in a timely manner on acceptable terms. If
the Company is unable to obtain future debt and/or equity financing, it may have a material adverse effect on the Company's operations and financial condition.
Following the outbreak of COVID-19, the Group is experiencing significantly reduced charter rates and utilization of its fleet due to lower containerised freight volumes globally. These developments are, absent
of effective mitigating measures, expected to adversely impact the Group's liquidity and ability to be in compliance with covenants under some of its loan agreements in the short to mid-term.
The Group’s financial position has also been affected as the initial contractual buyer of as Leona and as Lauretta has not fulfilled its legal commitments in the contract and accordingly the sale of the vessels
has not been executed. The Group has initiated arbitration proceedings against the contractual buyer for any loss occurred due to the cancellation of the contracts.

35
RISK FACTORS
BUSINESS AND VESSEL RELATED RISKS (CONT.)
Debt finance may be unavailable
The Company may require additional capital in the future due to unforeseen liabilities, net cash flow shortfalls or in order to take advantage of business opportunities. There can be no assurance that the
Company will be able to obtain necessary financing in a timely manner on acceptable terms. Difficulties in the financial markets may result in dysfunctional credit markets and restrict the availability of debt
finance to the Company's underlying investments. The resulting lack of available credit and/or higher financing costs and more onerous terms may materially impact the performance of certain investments with
a potential adverse impact on both working capital and term debt availability and on exit options. Furthermore, if the Company is unable to comply with the restrictions and covenants in its debt financing
agreements or in future debt financing agreements, there could be a default under the terms of those agreements. The Company's ability to comply with these restrictions and covenants is dependent on its
future performance and may be affected by events beyond its control. If a default occurs, lenders could terminate their commitments to lend or accelerate the outstanding loans and declare all amounts
borrowed due and payable. If any such event occurs, the Company cannot guarantee that its assets will be sufficient to repay in full all of its outstanding indebtedness, and the Company may be unable to find
alternative financing.
The Company is subject to currency risks
US dollars (“USD") is the functional and reporting currency of the Company. Charter hire is normally payable in USD and the value of the vessels is normally denominated in USD. Thus, currency fluctuations
may affect both the Company's and consequently the investors' return, book value and value adjusted equity of subsidiaries in other currencies than USD.
The Company is subject to interest rate risk and covenant risks
Any changes in the interest rate would directly affect prospective returns of the Company. Indebtedness under bond or credit facilities may be subject to floating rates of interest. Interest rate levels can also
indirectly affect the value of the assets at the point of sale. This will impact the value of the Company's portfolio.
The Company's vessel transactions are subject to execution risks
There is always a possibility that intended transactions might not conclude due to various execution risks related to, but not limited to, documentation, inspection of the vessel(s) and/or class records and due
diligence. Thus there might be certain external and third party costs carried by the Company that are not recoverable.
The vessels are subject to technical risks
The technical operation of a vessel has a significant impact on the vessels' economic life, and technical risks will always be present. There can be no guarantee that the parties tasked with operating a vessel
or overseeing such operation perform their duties according to agreement or satisfaction. Failure to adequately maintain the technical operation of a vessel may adversely impact the operating expenses and
other costs and accordingly the potential realisation values that can be obtained.
The Company is subject to counterparty risks
The performance of the Company depends heavily on its counterparties' ability to perform their obligations under, for instance, agreed charter parties. The Company is consequently exposed to the risk of
contractual defaults by its counterparties. Any default by a counterparty of its obligations under its agreements with a special-purpose vehicle ("SPV") may have material adverse consequences on the
Company's financial condition.

36
RISK FACTORS
BUSINESS AND VESSEL RELATED RISKS (CONT.)
The Company is dependent on information technology systems
The Company uses information technology (“IT") systems to communicate with and monitor its vessels, and the vessels rely on it systems for their operations. The Company has firewalls, anti-virus programs
and other safety measures in place. However, there can be no assurances that any measures that the Group implements to prevent and prepare for cyber-attacks will not be circumvented in the future, or that
the Company will be able to successfully identify and prevent such cyber security issues in the future. Disruptions may also be caused by natural disasters, catastrophic events and other events outside the
Company's control, which are difficult or impossible to prevent or prepare for. Any disruption, failure or security breaches of these systems could disrupt the Company's operations and result in decreased
performance, significant remediation costs, down-time, data loss and the loss of suppliers or customers.
The Company is subject to environmental risks
The Company's vessels carry pollutants. Accordingly, there will always be certain environmental risks and potential liabilities involved in the ownership of commercial shipping vessels.
The Company's operations are subject to geopolitical risks and risks relating to corruption, piracy, terrorism, war etc.
It is expected that the Company's vessels will operate in a variety of geographic regions. Consequently, the Company may be exposed to political risk, risk of piracy, corruption, terrorism, outbreak of war,
amongst others. The business, financial condition and results of operations of the Company, indirectly, and its underlying investments directly, may accordingly be negatively affected if such events do occur.
The Company's vessels may fail to maintain its class
The hull and machinery of every commercial vessel must be certified as being "in class" by a classification society authorised by its country of registry. The classification society certifies that a vessel is safe
and seaworthy in accordance with the applicable rules and regulations of the country of registry of the vessel and the safety of life at sea convention (the “SOLAS”). A vessel must undergo annual surveys,
intermediate surveys and special surveys. In lieu of a special survey, a vessel's machinery may be placed on a continuous survey cycle, under which the machinery would be surveyed periodically over a five-
year period. If any vessel does not maintain its class or fails any annual, intermediate or special survey, the vessel will be unable to trade between ports and will be unemployable, which could have a material
adverse effect on the Company's business, financial condition, results of operation and liquidity.
The ageing of the fleet may result in increased operating costs in the future, as the Group will be required to make substantial capital expenditures in order to modernize and expand the fleet and
to maintain the quality of the vessels
The Group's vessels require substantial capital expenditures to maintain and modernise quality and operating capacity over the long-term. The Group's fleet of 68 owned vessels had an average age of
approximately 13.5 years as of the date of the Prospectus. In addition 51.1% of the Group's vessels have an average age above 14 years. In general, the cost of maintaining a vessel in good operating
condition increases with the age of the vessel. As the Group's fleet ages, the Group will incur increased costs. Older vessels are typically less fuel efficient and more costly to maintain than more recently
constructed vessels due to gradual improvements in engine technology and other design features. Cargo insurance rates increase with the age of a vessel, making older vessels less desirable to charterers.
The Group's cash flows and income are dependent on the revenues earned through the chartering of its vessels. The Group must make substantial capital expenditures over the long-term to maintain the
operating capacity of its fleet and preserve its capital base. If the Group is unable to maintain sufficient cash reserves to finance the replacement of the vessels in its fleet at the end of their useful lives and
alternative sources of financing are unavailable, the business would be adversely affected.
Delays during drydocking in connection with such maintenance may also have an severe impact on the Group's financial position. During such delays, the Group's vessels are drydocked and therefore not at
the Group's disposal. Such delays may, if the ship is chartered-out or scheduled to be chartered-out, cause the Group to breach their contractual obligations under the relevant charter agreements.
37
RISK FACTORS
MARKET RELATED RISKS
The Company is subject to macroeconomic conditions
Changes in national and international economic conditions, including, for example, interest rate levels, inflation and employment levels, may influence the valuation of real and financial assets. In turn, this may
impact the demand for goods, services and assets globally and thereby the macro economy. The current macroeconomic situation is uncertain and there is a risk of negative developments. Such changes and
developments – none of which will be within the control of the Company – may negatively impact the Company's investment activities, realisation opportunities and overall investor returns.
The Company is subject to risks related to COVID-19
The current outbreak of the COVID-19, which was recognised as a pandemic by the World Health Organization in march 2020, has severely impacted companies, economic activity and markets globally. The
Group has been adversely impacted by the outbreak of COVID-19 and is experiencing significantly reduced charter rates and utilization of its fleet due to lower containerised freight volumes globally. These
developments are expected to adversely impact the Group's liquidity and ability to be in compliance with covenants under some of its loan agreements in the short to mid-term. The effects from the weakening
charter rates and low fuel spreads are expected to impact the second quarter of 2020 in greater magnitude than in the first quarter of 2020.
It is currently not possible to predict all the consequences for the Group, its business partners and the markets in which the Group operates, other than the expectations of material adverse negative effects
that may be long-term. Potential investors should note that the COVID-19 situation is continuously changing and that and new laws and regulations that affect the Group's operations may enter into force.
Continued reduction in global trade may reduce the demand for container capacity, negatively affect charter rates and the Company's ability to obtain charters for its vessels.
Changes in scrap prices may affect the value of the vessels
The scrap value of a vessel is highly dependent on the price of steel. The actual residual value of the vessels may be lower than the Company estimates.
Changes in the shipping and oil services markets may affect the Company
The demand for, and the pricing of the underlying assets are outside of the Company's control and depend, among other things, on the global economy, global trade growth, as well as oil and gas prices. On
the supply side there are uncertainties tied to ordering of new vessels and scope of future scrapping. The actual residual value of the vessels in the underlying investments, and/or their earnings after
expiration of the fixed contract terms, may be lower than the Company estimates.
The Company is subject to charter market risk
The container shipping industry is highly cyclical with attendant volatility in charter rates result from changes in the supply and demand for vessel capacity and changes in the supply and demand for the cargo
to be carried. Any decrease in charter rates may have a material adverse effect on the Company's operations and financial condition, and there can be no assurance that the Company will be able to adjust to
future changes in the charter rates. Furthermore, no assurances can be made that the Company will be able to successfully charter its vessels in the future or renew existing charters at rates sufficient to allow
it to meet its obligations.
The Company is subject to fluctuations of vessel values
Containership values can fluctuate substantially over time due to a number of different factors, including, among others, prevailing economic conditions in the markets in which containerships operate,
prevailing charter rates, a substantial or extended decline in world trade, increases in the supply or decline in demand of containership capacity, and the cost of retrofitting or modifying existing ships to
respond to technological advances in vessel design or equipment, changes in applicable environmental or other regulations or standards, or otherwise.
The trading price of the shares and other securities issued by the Company is volatile
The trading volume and the price of the shares and other securities issued by the Company may fluctuate significantly. Some of the factors that could negatively affect the trading price or result in fluctuations
in the price or trading volume of the securities include changes in the Company's actual or projected results of operations, changes in earnings projections or failure to meet investors' and analysts' earnings
expectations. The price of the securities may also fluctuate based upon factors that have little or nothing to do with the Company, and these fluctuations may materially affect the price of the shares and other
securities issued by the Company.
38
RISK FACTORS
RISKS RELATED TO THE SHARES
The Company may need additional capital which may have a dilutive effect
The Company may in the future decide to offer additional shares or other securities in order to finance its operations, or in connection with unanticipated liabilities or expenses or for any other purposes. Any
such additional offering may be made without pre-emptive rights, and could reduce the proportionate ownership and voting interests of holders of shares, as well as the earnings per share and the net asset
value per share of the Company, and any offering by the Company could have a material adverse effect on the market price of the shares and other securities issued by the Company.
Pre-emptive rights may not be available to all holders of shares
Under Norwegian law, unless otherwise resolved at the Company’s general meeting of shareholders, existing shareholders have pre-emptive rights to participate in the issuance of new shares for cash
consideration. Shareholders in the United States as well as in certain other countries may be unable participate in an offer of new shares unless the Company decides to comply with local requirements in such
jurisdictions, and in the case of the United States, unless a registration statement under the U.S. Securities act is effective with respect to such rights and shares or an exemption from the registration
requirements is available. In such cases, shareholders resident in such non-Norwegian jurisdictions may experience a dilution of their holding of the shares, possibly without such dilution being offset by any
compensation received in exchange for subscription rights. In addition, the general meeting may resolve to waive the pre-emptive right of all existing shareholders. Furthermore, the shareholders may resolve
to grant the board of directors an authorisation to increase the share capital of the Company and set aside any pre-emptive rights for the shareholders, without the prior approval of the shareholders. Such
authorisation may also result in dilution of the shareholders' holding of shares and equity-linked securities.
Distributions by the Company are uncertain
Distributions from the Company will normally be made in cash. The distributions will not be predictable and will depend on the realisation of or distributions from underlying investments. Investors should not
expect any or any level of distributions from the Company.
The liability of the Company's service providers and members of the board is limited
Subject to certain exclusions, the Company's service providers (MPC Capital AG, and their respective affiliates) and the members of the board will have no liability for any loss to the Company or the investors
arising in connection with the operation of the Company. Further, the Company will indemnify the foregoing persons against claims, liabilities, costs and expenses incurred by them by reason of their activities
on behalf of the Company or the investors. Such limited liability and indemnification, if invoked, may affect the performance of the Company and the investor's returns.
Exercise of voting rights and other shareholder rights through nominees may be restricted
Beneficial owners of the shares that are registered in a nominee account (such as through brokers, dealers or other third parties in addition) may not be able to instruct their nominees to vote for such shares
unless their beneficial ownership is re-registered in their names with the VPS prior to the general meetings and may not be able to benefit from other shareholder rights, such as any preferential rights in
connection with any future offerings. The Company can provide no assurances that beneficial owners of the shares will receive the notice of a general meeting in time to instruct their nominees to either effect
a reregistration of the beneficial interests registered in the VPS or to vote their shares in the manner desired by such beneficial owners. Hence, there is a risk that beneficial owners of shares may not be able
to exercise their voting rights or other shareholder rights.
Exchange rate fluctuations could adversely affect the value of the Shares and any dividends paid on the Shares for an investor whose principal currency is not NOK
The Shares are priced and traded in NOK on the Oslo Stock Exchange, and any potential future payments of dividends on the Shares will be denominated in NOK. Investors registered in the VPS who have
not supplied the VPS with details of their bank account, will not receive payment of dividends unless they register their bank account details with the VPS registrar. The exchange rate(s) that is applied when
denominating any future payments of dividends to the relevant investor's currency will be Nordea's exchange rate on the payment date. Exchange rate movements of NOK will therefore affect the value of
these dividends and distributions for investors whose principal currency is not NOK. Further, the market value of the Shares as expressed in foreign currencies will fluctuate in part as a result of foreign
exchange fluctuations. This could affect the value of the Shares and of any dividends paid on the Shares for an investor whose principal currency is not NOK.
Transaction Background
Investment Opportunity
Company Update
Market Update
Risk Factors
Appendix
AGENDA
39
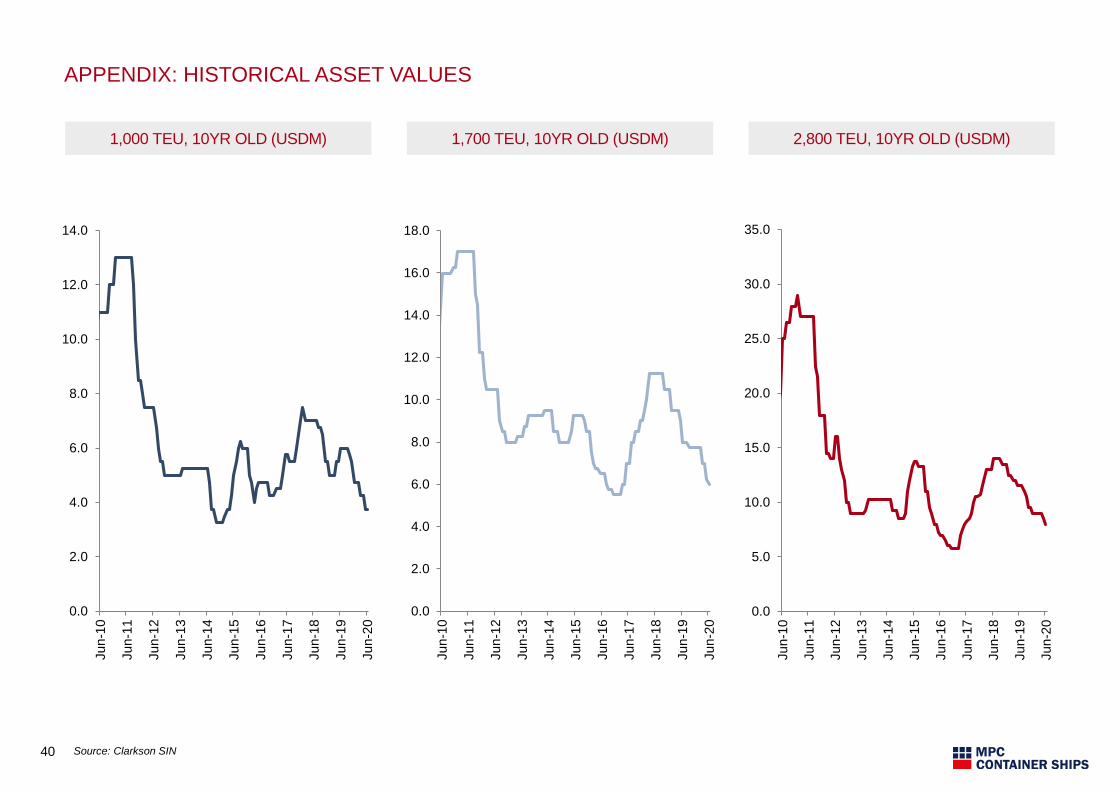
40
0.0
2.0
4.0
6.0
8.0
10.0
12.0
14.0
Jun-1
0
Jun-1
1
Jun-1
2
Jun-1
3
Jun-1
4
Jun-1
5
Jun-1
6
Jun-1
7
Jun-1
8
Jun-1
9
Jun-2
0
1,000 TEU, 10YR OLD (USDM) 1,700 TEU, 10YR OLD (USDM) 2,800 TEU, 10YR OLD (USDM)
0.0
2.0
4.0
6.0
8.0
10.0
12.0
14.0
16.0
18.0
Jun-1
0
Jun-1
1
Jun-1
2
Jun-1
3
Jun-1
4
Jun-1
5
Jun-1
6
Jun-1
7
Jun-1
8
Jun-1
9
Jun-2
0
0.0
5.0
10.0
15.0
20.0
25.0
30.0
35.0
Jun-1
0
Jun-1
1
Jun-1
2
Jun-1
3
Jun-1
4
Jun-1
5
Jun-1
6
Jun-1
7
Jun-1
8
Jun-1
9
Jun-2
0
APPENDIX: HISTORICAL ASSET VALUES
Source: Clarkson SIN

41
1,000 TEU, TCE (USD/DAY) 1,700 TEU, TCE (USD/DAY) 2,750 TEU, TCE (USD/DAY)
APPENDIX: HISTORICAL CHARTER RATES
0
1,000
2,000
3,000
4,000
5,000
6,000
7,000
8,000
9,000
10,000
Jun-1
0
Jun-1
1
Jun-1
2
Jun-1
3
Jun-1
4
Jun-1
5
Jun-1
6
Jun-1
7
Jun-1
8
Jun-1
9
Jun-2
0
0
2,000
4,000
6,000
8,000
10,000
12,000
14,000
Jun-1
0
Jun-1
1
Jun-1
2
Jun-1
3
Jun-1
4
Jun-1
5
Jun-1
6
Jun-1
7
Jun-1
8
Jun-1
9
Jun-2
0
0
2,000
4,000
6,000
8,000
10,000
12,000
14,000
16,000
18,000
20,000
Jun-1
0
Jun-1
1
Jun-1
2
Jun-1
3
Jun-1
4
Jun-1
5
Jun-1
6
Jun-1
7
Jun-1
8
Jun-1
9
Jun-2
0
Source: Clarkson SIN
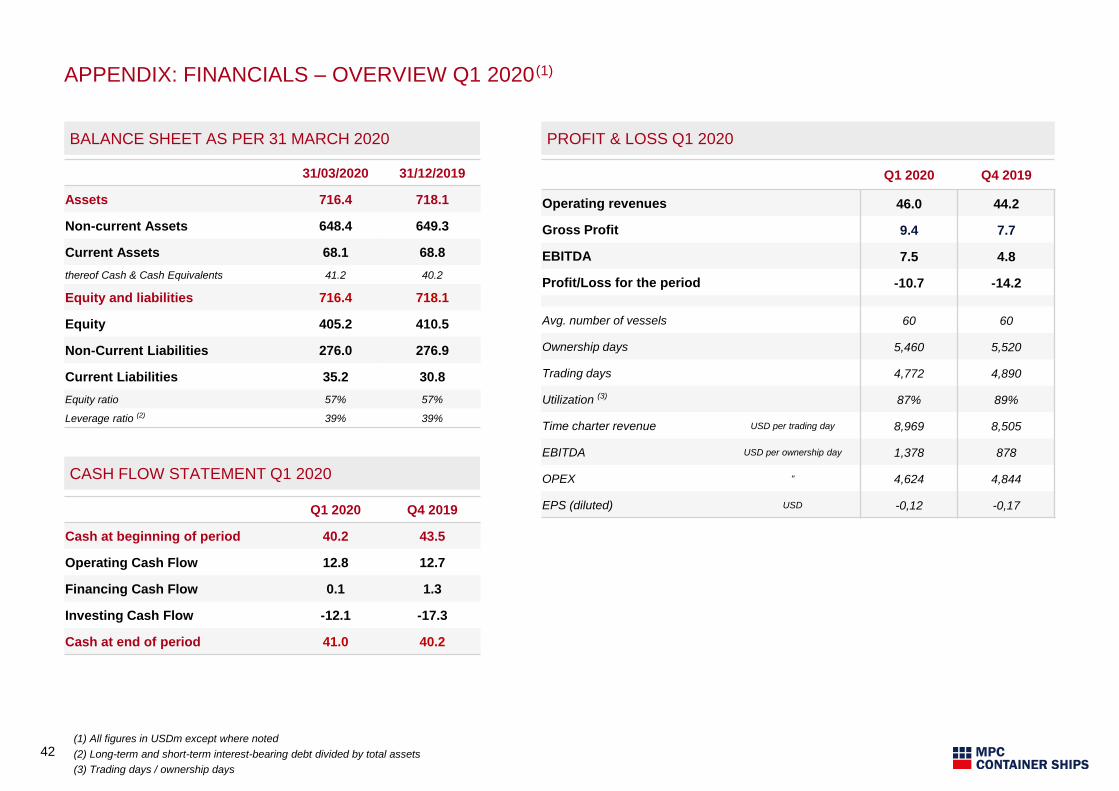
APPENDIX: FINANCIALS – OVERVIEW Q1 2020(1)
42(1) All figures in USDm except where noted
(2) Long-term and short-term interest-bearing debt divided by total assets
(3) Trading days / ownership days
BALANCE SHEET AS PER 31 MARCH 2020
31/03/2020 31/12/2019
Assets 716.4 718.1
Non-current Assets 648.4 649.3
Current Assets 68.1 68.8
thereof Cash & Cash Equivalents 41.2 40.2
Equity and liabilities 716.4 718.1
Equity 405.2 410.5
Non-Current Liabilities 276.0 276.9
Current Liabilities 35.2 30.8
Equity ratio 57% 57%
Leverage ratio (2) 39% 39%
PROFIT & LOSS Q1 2020
Q1 2020 Q4 2019
Operating revenues 46.0 44.2
Gross Profit 9.4 7.7
EBITDA 7.5 4.8
Profit/Loss for the period -10.7 -14.2
Avg. number of vessels 60 60
Ownership days 5,460 5,520
Trading days 4,772 4,890
Utilization (3) 87% 89%
Time charter revenue USD per trading day 8,969 8,505
EBITDA USD per ownership day 1,378 878
OPEX " 4,624 4,844
EPS (diluted) USD -0,12 -0,17Q1 2020 Q4 2019
Cash at beginning of period 40.2 43.5
Operating Cash Flow 12.8 12.7
Financing Cash Flow 0.1 1.3
Investing Cash Flow -12.1 -17.3
Cash at end of period 41.0 40.2
CASH FLOW STATEMENT Q1 2020
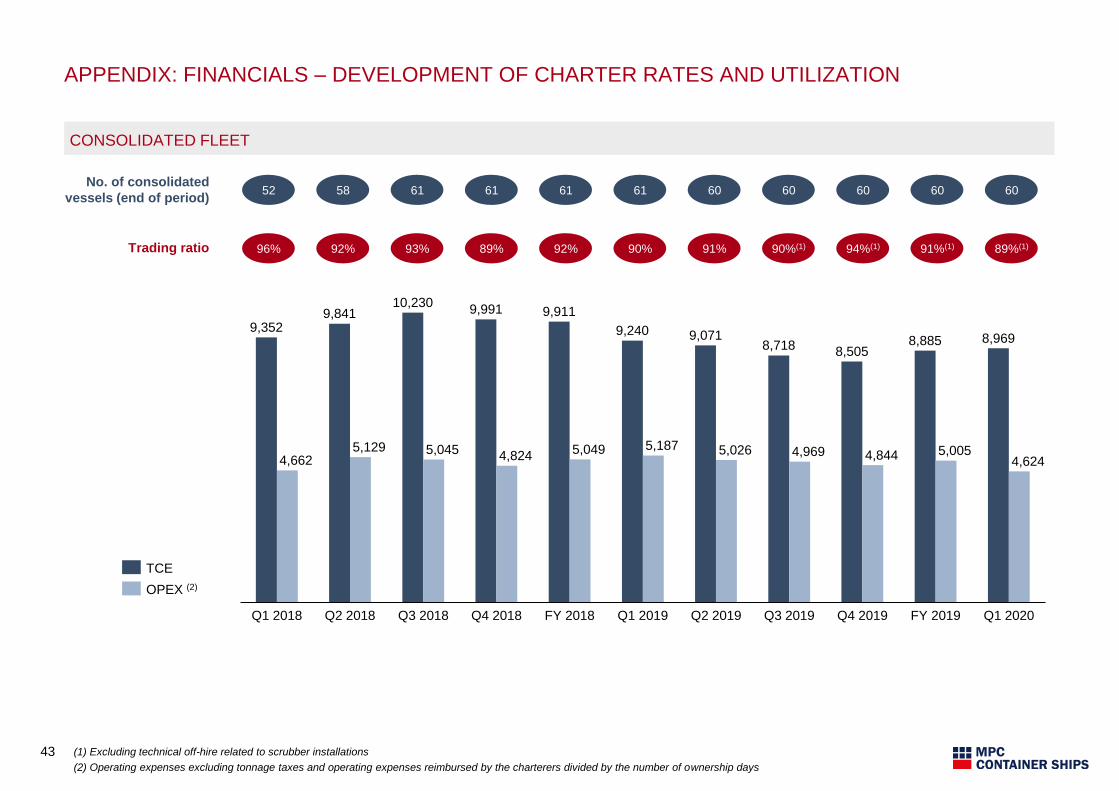
APPENDIX: FINANCIALS – DEVELOPMENT OF CHARTER RATES AND UTILIZATION
43 (1) Excluding technical off-hire related to scrubber installations
(2) Operating expenses excluding tonnage taxes and operating expenses reimbursed by the charterers divided by the number of ownership days
CONSOLIDATED FLEET
96%
52
93%
61No. of consolidated
vessels (end of period)
Trading ratio 92%
58
89%
61
92%
61
90%
61
Q2 2019Q2 2018 Q3 2018 Q4 2018 Q3 2019FY 2018
9,841
Q1 2019 Q4 2019 FY 2019
4,844
Q1 2020
9,352
4,969
9,991
4,662
Q1 2018
10,230
5,045
8,8859,071
4,824
9,911
5,049
8,505
9,240
5,187 5,0055,026
8,7188,969
4,6245,129
TCE
OPEX (2)
91%
60
90%(1)
60
94%(1)
60
91%(1)
60
89%(1)
60
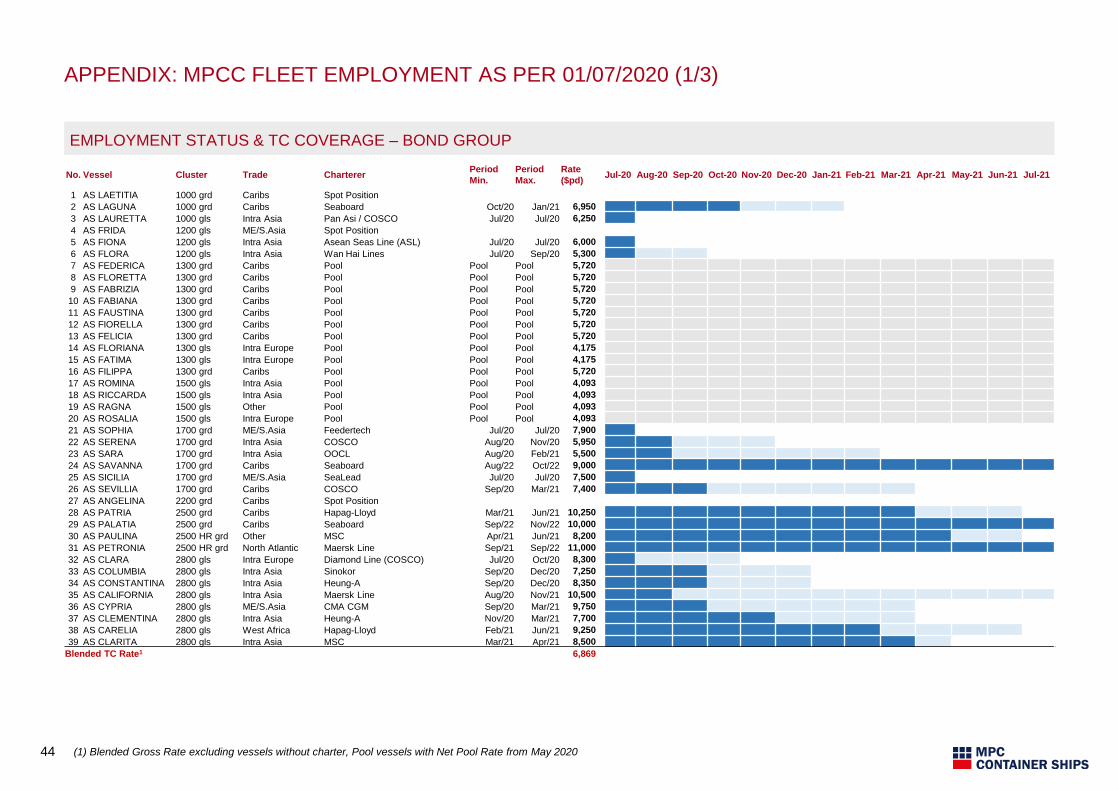
APPENDIX: MPCC FLEET EMPLOYMENT AS PER 01/07/2020 (1/3)
44 (1) Blended Gross Rate excluding vessels without charter, Pool vessels with Net Pool Rate from May 2020
EMPLOYMENT STATUS & TC COVERAGE – BOND GROUP
No. Vessel Cluster Trade ChartererPeriod
Min.
Period
Max.
Rate
($pd)Jul-20 Aug-20 Sep-20 Oct-20 Nov-20 Dec-20 Jan-21 Feb-21 Mar-21 Apr-21 May-21 Jun-21 Jul-21
1 AS LAETITIA 1000 grd Caribs Spot Position
2 AS LAGUNA 1000 grd Caribs Seaboard Oct/20 Jan/21 6,950
3 AS LAURETTA 1000 gls Intra Asia Pan Asi / COSCO Jul/20 Jul/20 6,250
4 AS FRIDA 1200 gls ME/S.Asia Spot Position
5 AS FIONA 1200 gls Intra Asia Asean Seas Line (ASL) Jul/20 Jul/20 6,000
6 AS FLORA 1200 gls Intra Asia Wan Hai Lines Jul/20 Sep/20 5,300
7 AS FEDERICA 1300 grd Caribs Pool Pool Pool 5,720
8 AS FLORETTA 1300 grd Caribs Pool Pool Pool 5,720
9 AS FABRIZIA 1300 grd Caribs Pool Pool Pool 5,720
10 AS FABIANA 1300 grd Caribs Pool Pool Pool 5,720
11 AS FAUSTINA 1300 grd Caribs Pool Pool Pool 5,720
12 AS FIORELLA 1300 grd Caribs Pool Pool Pool 5,720
13 AS FELICIA 1300 grd Caribs Pool Pool Pool 5,720
14 AS FLORIANA 1300 gls Intra Europe Pool Pool Pool 4,175
15 AS FATIMA 1300 gls Intra Europe Pool Pool Pool 4,175
16 AS FILIPPA 1300 grd Caribs Pool Pool Pool 5,720
17 AS ROMINA 1500 gls Intra Asia Pool Pool Pool 4,093
18 AS RICCARDA 1500 gls Intra Asia Pool Pool Pool 4,093
19 AS RAGNA 1500 gls Other Pool Pool Pool 4,093
20 AS ROSALIA 1500 gls Intra Europe Pool Pool Pool 4,093
21 AS SOPHIA 1700 grd ME/S.Asia Feedertech Jul/20 Jul/20 7,900
22 AS SERENA 1700 grd Intra Asia COSCO Aug/20 Nov/20 5,950
23 AS SARA 1700 grd Intra Asia OOCL Aug/20 Feb/21 5,500
24 AS SAVANNA 1700 grd Caribs Seaboard Aug/22 Oct/22 9,000
25 AS SICILIA 1700 grd ME/S.Asia SeaLead Jul/20 Jul/20 7,500
26 AS SEVILLIA 1700 grd Caribs COSCO Sep/20 Mar/21 7,400
27 AS ANGELINA 2200 grd Caribs Spot Position
28 AS PATRIA 2500 grd Caribs Hapag-Lloyd Mar/21 Jun/21 10,250
29 AS PALATIA 2500 grd Caribs Seaboard Sep/22 Nov/22 10,000
30 AS PAULINA 2500 HR grd Other MSC Apr/21 Jun/21 8,200
31 AS PETRONIA 2500 HR grd North Atlantic Maersk Line Sep/21 Sep/22 11,000
32 AS CLARA 2800 gls Intra Europe Diamond Line (COSCO) Jul/20 Oct/20 8,300
33 AS COLUMBIA 2800 gls Intra Asia Sinokor Sep/20 Dec/20 7,250
34 AS CONSTANTINA 2800 gls Intra Asia Heung-A Sep/20 Dec/20 8,350
35 AS CALIFORNIA 2800 gls Intra Asia Maersk Line Aug/20 Nov/21 10,500
36 AS CYPRIA 2800 gls ME/S.Asia CMA CGM Sep/20 Mar/21 9,750
37 AS CLEMENTINA 2800 gls Intra Asia Heung-A Nov/20 Mar/21 7,700
38 AS CARELIA 2800 gls West Africa Hapag-Lloyd Feb/21 Jun/21 9,250
39 AS CLARITA 2800 gls Intra Asia MSC Mar/21 Apr/21 8,500
Blended TC Rate1 6,869
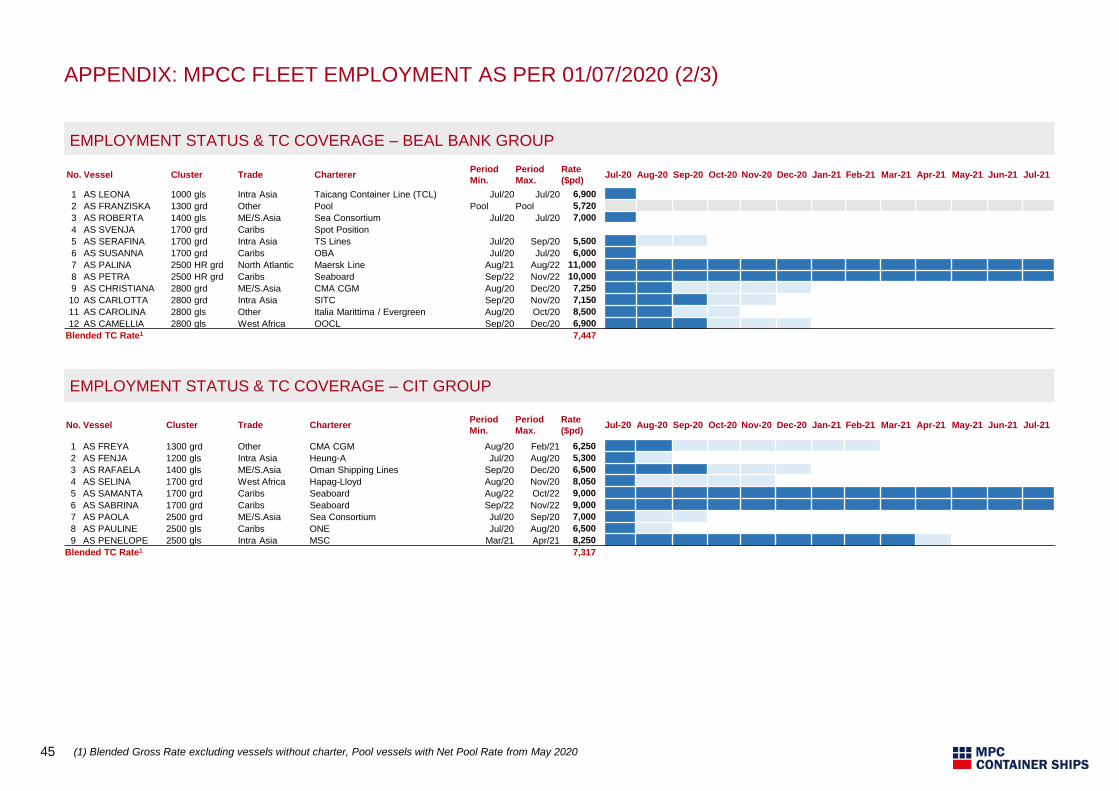
APPENDIX: MPCC FLEET EMPLOYMENT AS PER 01/07/2020 (2/3)
45
EMPLOYMENT STATUS & TC COVERAGE – BEAL BANK GROUP
EMPLOYMENT STATUS & TC COVERAGE – CIT GROUP
(1) Blended Gross Rate excluding vessels without charter, Pool vessels with Net Pool Rate from May 2020
No. Vessel Cluster Trade ChartererPeriod
Min.
Period
Max.
Rate
($pd)Jul-20 Aug-20 Sep-20 Oct-20 Nov-20 Dec-20 Jan-21 Feb-21 Mar-21 Apr-21 May-21 Jun-21 Jul-21
1 AS LEONA 1000 gls Intra Asia Taicang Container Line (TCL) Jul/20 Jul/20 6,900
2 AS FRANZISKA 1300 grd Other Pool Pool Pool 5,720
3 AS ROBERTA 1400 gls ME/S.Asia Sea Consortium Jul/20 Jul/20 7,000
4 AS SVENJA 1700 grd Caribs Spot Position
5 AS SERAFINA 1700 grd Intra Asia TS Lines Jul/20 Sep/20 5,500
6 AS SUSANNA 1700 grd Caribs OBA Jul/20 Jul/20 6,000
7 AS PALINA 2500 HR grd North Atlantic Maersk Line Aug/21 Aug/22 11,000
8 AS PETRA 2500 HR grd Caribs Seaboard Sep/22 Nov/22 10,000
9 AS CHRISTIANA 2800 grd ME/S.Asia CMA CGM Aug/20 Dec/20 7,250
10 AS CARLOTTA 2800 grd Intra Asia SITC Sep/20 Nov/20 7,150
11 AS CAROLINA 2800 gls Other Italia Marittima / Evergreen Aug/20 Oct/20 8,500
12 AS CAMELLIA 2800 gls West Africa OOCL Sep/20 Dec/20 6,900
Blended TC Rate1 7,447
No. Vessel Cluster Trade ChartererPeriod
Min.
Period
Max.
Rate
($pd)Jul-20 Aug-20 Sep-20 Oct-20 Nov-20 Dec-20 Jan-21 Feb-21 Mar-21 Apr-21 May-21 Jun-21 Jul-21
1 AS FREYA 1300 grd Other CMA CGM Aug/20 Feb/21 6,250
2 AS FENJA 1200 gls Intra Asia Heung-A Jul/20 Aug/20 5,300
3 AS RAFAELA 1400 gls ME/S.Asia Oman Shipping Lines Sep/20 Dec/20 6,500
4 AS SELINA 1700 grd West Africa Hapag-Lloyd Aug/20 Nov/20 8,050
5 AS SAMANTA 1700 grd Caribs Seaboard Aug/22 Oct/22 9,000
6 AS SABRINA 1700 grd Caribs Seaboard Sep/22 Nov/22 9,000
7 AS PAOLA 2500 grd ME/S.Asia Sea Consortium Jul/20 Sep/20 7,000
8 AS PAULINE 2500 gls Caribs ONE Jul/20 Aug/20 6,500
9 AS PENELOPE 2500 gls Intra Asia MSC Mar/21 Apr/21 8,250
Blended TC Rate1 7,317
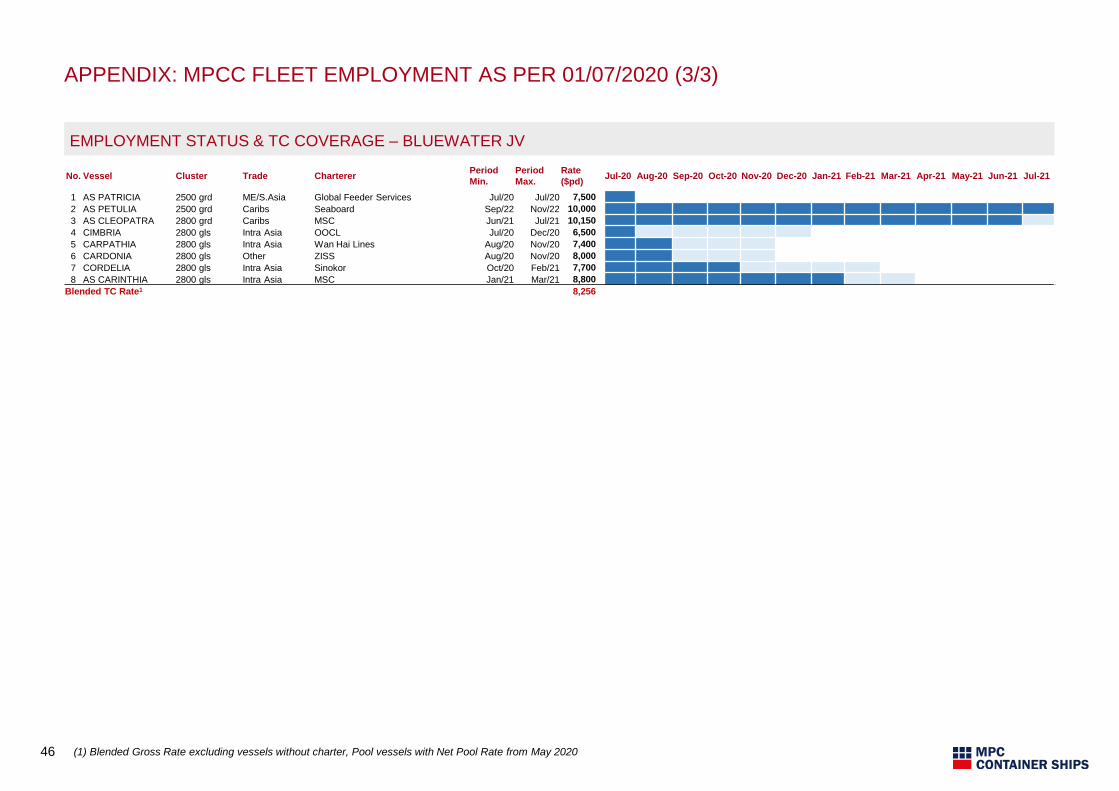
APPENDIX: MPCC FLEET EMPLOYMENT AS PER 01/07/2020 (3/3)
46
EMPLOYMENT STATUS & TC COVERAGE – BLUEWATER JV
(1) Blended Gross Rate excluding vessels without charter, Pool vessels with Net Pool Rate from May 2020
No. Vessel Cluster Trade ChartererPeriod
Min.
Period
Max.
Rate
($pd)Jul-20 Aug-20 Sep-20 Oct-20 Nov-20 Dec-20 Jan-21 Feb-21 Mar-21 Apr-21 May-21 Jun-21 Jul-21
1 AS PATRICIA 2500 grd ME/S.Asia Global Feeder Services Jul/20 Jul/20 7,500
2 AS PETULIA 2500 grd Caribs Seaboard Sep/22 Nov/22 10,000
3 AS CLEOPATRA 2800 grd Caribs MSC Jun/21 Jul/21 10,150
4 CIMBRIA 2800 gls Intra Asia OOCL Jul/20 Dec/20 6,500
5 CARPATHIA 2800 gls Intra Asia Wan Hai Lines Aug/20 Nov/20 7,400
6 CARDONIA 2800 gls Other ZISS Aug/20 Nov/20 8,000
7 CORDELIA 2800 gls Intra Asia Sinokor Oct/20 Feb/21 7,700
8 AS CARINTHIA 2800 gls Intra Asia MSC Jan/21 Mar/21 8,800
Blended TC Rate1 8,256
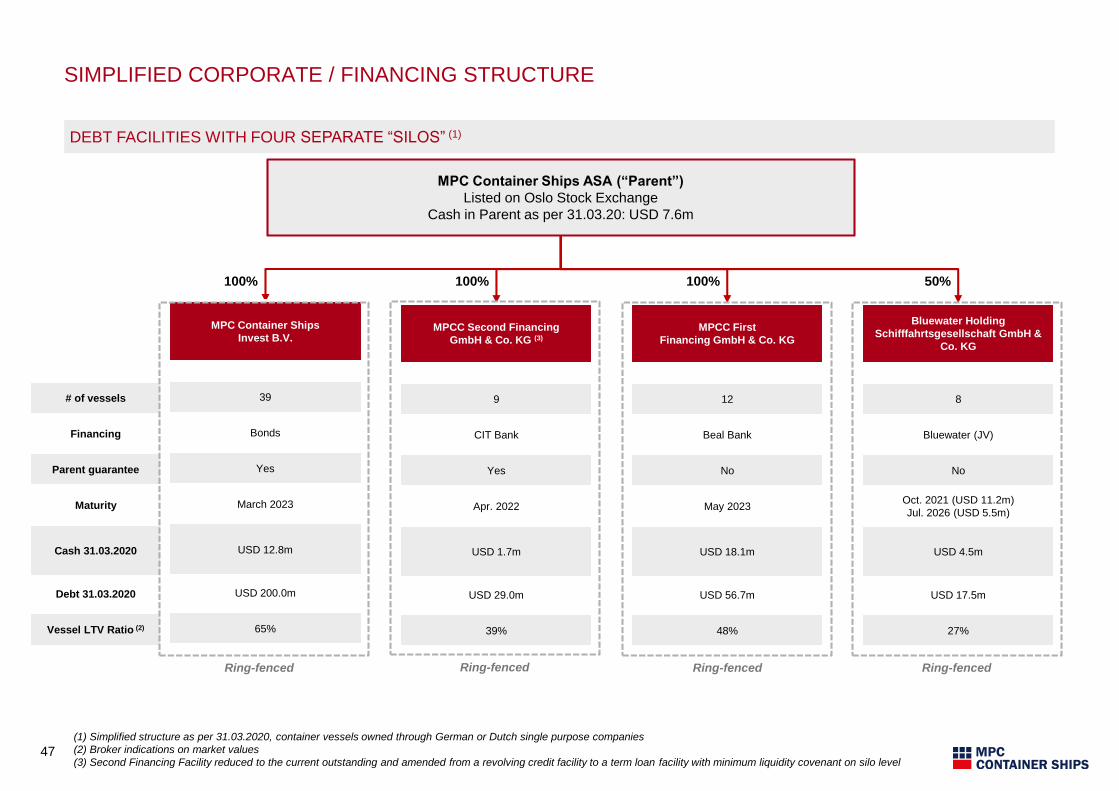
47
(1) Simplified structure as per 31.03.2020, container vessels owned through German or Dutch single purpose companies
(2) Broker indications on market values
(3) Second Financing Facility reduced to the current outstanding and amended from a revolving credit facility to a term loan facility with minimum liquidity covenant on silo level
SIMPLIFIED CORPORATE / FINANCING STRUCTURE
DEBT FACILITIES WITH FOUR SEPARATE “SILOS” (1)
# of vessels
Financing
Parent guarantee
Cash 31.03.2020
Debt 31.03.2020
Vessel LTV Ratio (2)
Maturity
MPC Container Ships ASA (“Parent”)
Listed on Oslo Stock Exchange
Cash in Parent as per 31.03.20: USD 7.6m
100%100% 50%100%
Bluewater Holding
Schifffahrtsgesellschaft GmbH &
Co. KG
8
Bluewater (JV)
No
USD 4.5m
USD 17.5m
27%
Oct. 2021 (USD 11.2m)
Jul. 2026 (USD 5.5m)
Ring-fenced
MPCC Second Financing
GmbH & Co. KG (3)
9
CIT Bank
Yes
USD 1.7m
USD 29.0m
39%
Apr. 2022
MPCC First
Financing GmbH & Co. KG
12
Beal Bank
No
USD 18.1m
USD 56.7m
48%
May 2023
MPC Container Ships
Invest B.V.
39
Bonds
Yes
USD 12.8m
USD 200.0m
65%
March 2023
Ring-fencedRing-fencedRing-fenced
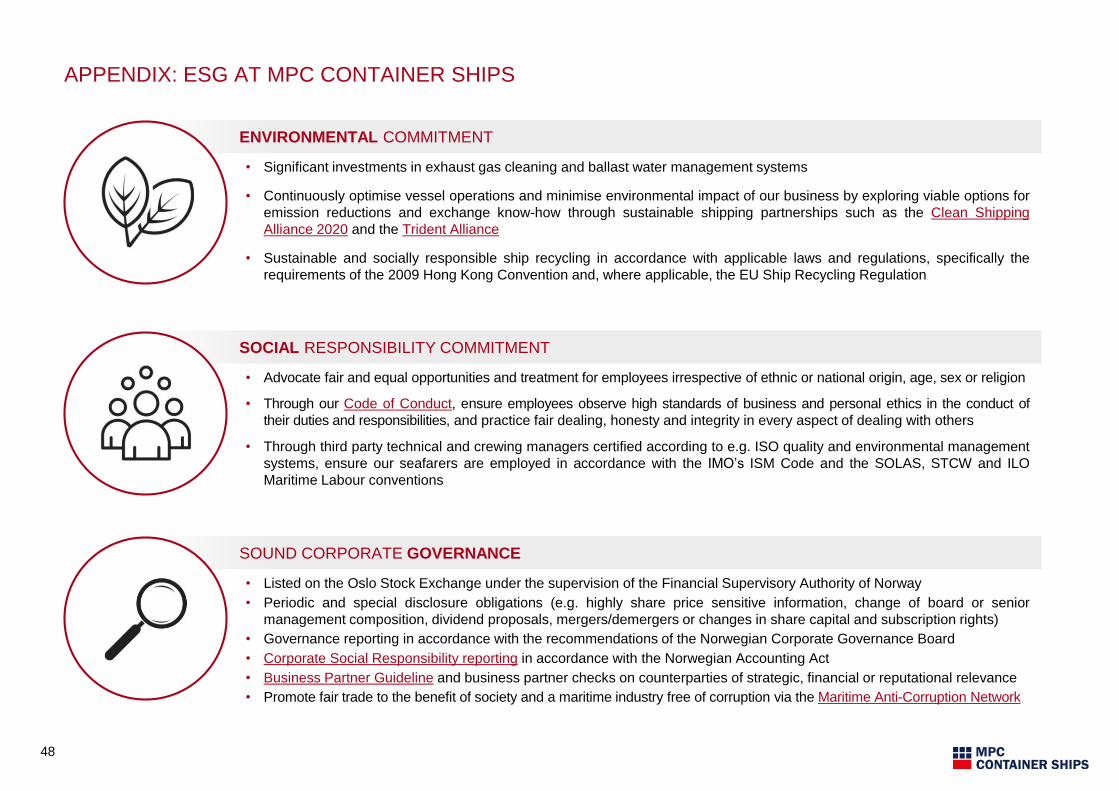
APPENDIX: ESG AT MPC CONTAINER SHIPS
48
ENVIRONMENTAL COMMITMENT
• Significant investments in exhaust gas cleaning and ballast water management systems
• Continuously optimise vessel operations and minimise environmental impact of our business by exploring viable options for
emission reductions and exchange know-how through sustainable shipping partnerships such as the Clean Shipping
Alliance 2020 and the Trident Alliance
• Sustainable and socially responsible ship recycling in accordance with applicable laws and regulations, specifically the
requirements of the 2009 Hong Kong Convention and, where applicable, the EU Ship Recycling Regulation
SOCIAL RESPONSIBILITY COMMITMENT
• Advocate fair and equal opportunities and treatment for employees irrespective of ethnic or national origin, age, sex or religion
• Through our Code of Conduct, ensure employees observe high standards of business and personal ethics in the conduct of
their duties and responsibilities, and practice fair dealing, honesty and integrity in every aspect of dealing with others
• Through third party technical and crewing managers certified according to e.g. ISO quality and environmental management
systems, ensure our seafarers are employed in accordance with the IMO’s ISM Code and the SOLAS, STCW and ILO
Maritime Labour conventions
SOUND CORPORATE GOVERNANCE
• Listed on the Oslo Stock Exchange under the supervision of the Financial Supervisory Authority of Norway
• Periodic and special disclosure obligations (e.g. highly share price sensitive information, change of board or senior
management composition, dividend proposals, mergers/demergers or changes in share capital and subscription rights)
• Governance reporting in accordance with the recommendations of the Norwegian Corporate Governance Board
• Corporate Social Responsibility reporting in accordance with the Norwegian Accounting Act
• Business Partner Guideline and business partner checks on counterparties of strategic, financial or reputational relevance
• Promote fair trade to the benefit of society and a maritime industry free of corruption via the Maritime Anti-Corruption Network