
MORTALITY ASSUMPTIONS AND LONGEVITY RISK Implications for pension funds and annuity providers Pablo...
27
MORTALITY ASSUMPTIONS AND LONGEVITY RISK Implications for pension funds and annuity providers Pablo ANTOLIN OECD, Financial Affairs Division ASSAL, San Jose, Costa Rica, 13-16 Abril, 2015
-
Upload
sabina-wood -
Category
Documents
-
view
220 -
download
0
Transcript of MORTALITY ASSUMPTIONS AND LONGEVITY RISK Implications for pension funds and annuity providers Pablo...

MORTALITY ASSUMPTIONS AND
LONGEVITY RISKImplications for pension funds
and annuity providers
Pablo ANTOLINOECD, Financial Affairs DivisionASSAL, San Jose, Costa Rica, 13-16 Abril, 2015

2
New OECD Publication

3
Respond to the challenges posed by longevity risk
Longevity risk is the risk that individuals live longer than assumed, and therefore pension/annuity payments will have to be made for a longer period than planned and provision for.
Main Objective

4
1. It looks at the Mortality Assumptions used by pension funds and annuity providers to determine how long pension/annuity payments are expected to be made. Assessing:• The level of mortality today• The improvement in mortality tomorrow (i.e.
the expected increase in life expectancy)
2. It assesses whether pension funds and annuity providers are exposed to longevity risk
3. Discusses different policy options to manage longevity risk
Approach

5
New OECD Publication
Contents
1. Mortality assumptions used by pension funds and annuity providers
2. Overview of countries’ mortality tables
3. Trends in life expectancy and mortality improvements: Implications for pension funds and annuity providers
4. Measuring and modelling mortality and life expectancy: Methods and limitations
5. Assessment of the potential longevity risk in the standard mortality tables
6. Policy options for managing longevity risk

6
The regulatory framework does not always require accounting for mortality improvements.
Standard mortality tables used by pension funds and annuity providers are not always sufficient given recent trends in life expectancy
To manage longevity risk• Regulators/policy makers should ensure that pension funds
and annuity providers use regularly updated mortality tables, which incorporate future improvements.
• Capital markets can offer additional capacity to mitigate LR by addressing the need for transparency, standardization and liquidity: use indexed-based financial instruments
• Regulatory framework should recognized the reduction in risk exposure these instruments offer
• Governments could facilitate transparency, standardization and liquidity by issuing longevity indices to serve as a benchmark
Main messages

7
What is current regulation and practice with respect to the use of mortality tables for the valuation of pension and annuity liabilities?
Are the standard mortality tables used by pension funds and annuity providers sufficient given recent trends in life expectancy?
What are the policy implications to encourage and facilitate the recognition and management of longevity risk?
Questions addressed

8
Is there a minimum requirement for the level of mortality assumed?
Is there a regulatory requirement to account for future improvements in mortality?
Minimum requirements are more common for pension plans
Half of the countries have no requirement to account for mortality improvements for both pension funds and annuity providers
Mortality assumptions: regulatory requirements
Minimum Requirement
Improvement Requirement
Country Annuity provider
s
Pension plans
Annuity provider
s
Pension plans
Brazil No Yes No NoCanada No Yes Yes YesChile Yes Yes Yes YesChina Yes Yes No NoFrance Yes Yes Yes YesGermany Yes Yes/No Yes YesIsrael Yes Yes Yes YesJapan No Yes No NoKorea No No No NoMexico Yes No Yes NoNetherlands
No No Yes Yes
Peru Yes Yes No NoSpain No No Yes YesSwitzerland No No No NoUnited Kingdom
No No Yes Yes
United States
Yes Yes No Yes

9
Are mortality improvements typically accounted for given market practice?
Most of countries account for future mortality improvements in practice
Annuity providers tend to assume improvement in mortality more often than pension funds
Mortality assumptions: market practice in accounting for improvements
Country Annuity providers
Pension plans
Brazil No NoCanada Yes YesChile Yes YesChina No NoFrance Yes YesGermany Yes YesIsrael Yes YesJapan Yes NoKorea No NoMexico Yes NoNetherlands Yes YesPeru Some SomeSpain Yes YesSwitzerland Yes SomeUnited Kingdom Yes Yes
United States Yes Yes

10
What is current regulation and practice with respect to the use of mortality tables for the valuation of pension and annuity liabilities?
Are the standard mortality tables used by pension funds and annuity providers sufficient given recent trends in life expectancy?
What are the policy implications to encourage and facilitate the recognition and management of longevity risk?
Questions addressed

11
What is the value of the additional reserves needed to meet future pension and annuity payments given the difference btw assumed future mortality and expected future mortality?
Metric: compare life expectancies and annuity values• Life expectancy – expected differences in the length of
payments
• Annuity value – expected differences in the cost of meeting payments
– Driven by expected length of payments (mortality) and time value of money (discount rate)
Forming expectations: quantitative outputs and qualitative judgement• Projection models
– Lee Carter, Cairns-Blake-Dowd, P-spline and CMI models
• Interpretation of results– Pros/cons of each type of model
– Consideration of the historical context
Approach to quantify potential shortfall of standard mortality tables (1/2)

12
Model Output: population mortality• Population life expectancy vs. pensioner/annuitant life expectancy
– Mortality differences relating to socio-economic factors
– Level of differences depend on structure and coverage of pension system
Arriving at comparability: need to adjust for differences
Approach to quantify potential shortfall of standard mortality tables (2/2)
• Starting at the same place
– Assume mortality experience used to create the standard table was an accurate representation of the pensioner/annuitant mortality
• Evolving in the same way
– Assume the same proportional decrease in the mortality of both populations

13
Steady increase in life expectancy from ~1975
Annuitant population has a higher life expectancy than the general population
Model results in slightly higher life expectancies than the standard table for the annuitant population
Example: Spanish males (1/2)
Life Expectancy 2010
Annuity factors
Standard Table: 55 65 75 55 65 75PERM P 31.4 21.9 13.9 8.5 13.7 10.2
Population
LC 28.6 19.5 11.7 7.9 12.8 9.1CBD 28.6 19.3 11.7 7.8 12.6 9.0P-Spline 30.2 20.5 12.0 8.3 13.1 9.2CMI 29.8 20.4 12.1 8.1 13.1 9.2
PERM P 2000 + projected imps
LC 31.4 22.0 13.8 8.6 13.8 10.2CBD 31.7 22.1 14.0 8.6 13.7 10.2P-Spline 33.2 23.2 14.3 9.0 14.1 10.4CMI 32.9 23.1 14.4 8.9 14.1 10.4
1960
1963
1966
1969
1972
1975
1978
1981
1984
1987
1990
1993
1996
1999
2002
2005
2008
12
13
14
15
16
17
18
19
Life expectancy age 65
Years

14
Acceleration of mortality improvements towards older ages
Lee-Carter and Cairns-Blake Dowd project improvements representative of overall average, lower than recent experience
P-spline continues high improvements of the last decade
CMI reflects recent experience while converging to a lower long-term rate
Example: Spanish males (2/2)
Males 1990-2000 2000-2009 2010-2020 2020-2030 2010-2020 2020-2030 2010-2020 2020-2030 2010-2020 2020-2030 2010-2020 2020-203055-59 1.6% 1.7% 1.5% 1.5% 1.3% 1.3% 1.6% 1.6% 1.6% 1.6% 1.7% 1.7%60-64 1.6% 2.0% 1.5% 1.5% 1.5% 1.5% 1.5% 1.5% 2.0% 2.0% 1.8% 1.7%65-69 1.7% 2.4% 1.5% 1.5% 1.6% 1.6% 1.5% 1.5% 2.6% 2.5% 1.9% 1.7%70-74 1.9% 2.7% 1.5% 1.5% 1.6% 1.6% 1.4% 1.4% 2.8% 2.8% 2.1% 1.7%75-79 1.3% 2.5% 1.5% 1.5% 1.5% 1.5% 1.3% 1.3% 2.6% 2.6% 2.2% 1.8%80-84 1.5% 1.7% 1.5% 1.5% 1.3% 1.3% 1.2% 1.3% 2.2% 2.3% 2.0% 1.9%85-89 1.2% 1.3% 1.5% 1.5% 1.0% 1.0% 1.1% 1.2% 1.7% 1.8% 1.8% 1.9%90-94 0.9% 1.6% 1.3% 1.3% 0.6% 0.6% 1.0% 1.1% 1.5% 1.4% 1.6% 1.7%95-99 0.6% 1.1% 0.6% 0.6% 0.4% 0.4% 0.9% 0.9% 0.9% 0.9% 1.3% 1.3%100-104 0.4% 0.9% 0.0% 0.0% 0.2% 0.2% 0.7% 0.8% 0.4% 0.4% 1.0% 1.0%105-110 0.2% 0.4% 0.6% 0.0% 0.1% 0.1% 0.5% 0.6% 0.0% 0.0% 0.7% 0.7%
PS CMIHMD PERMP LC CBD
55 65 75
-2.0%
0.0%
2.0%
4.0%
6.0%
8.0%
Potential shortfall of provisions
LC CBD P-Spline CMI

15
Classification
Potential Shortfall
Pension Plans Annuity Providers
Serious 10-20%Brazil (US 1983IAM), China (CL2000-2003), Switzerland (EVK2005)
Brazil (US Annuity 2000), China (CL2000-2003)
Significant 5-10%Canada (UP94-ScaleAA), Japan (EPI2005), US (RP2000-ScaleAA)
Moderate 2-5% Chile (RV2009), Spain (PERM/F C 2000)
Brazil (BR-EMS 2010), Canada (GAM94-CIA), Chile (RV2009), Spain (PERM/F C 2000) US (GAM94-ScaleAA)
Monitor
<2%; specific issues to address
Canada (CPM), France (TGH/F 2005), Israel, Mexico (EMSSA 1997), Spain (PERM/F P 2000) Switzerland (BVG 2010, VZ 2010), US (RP2000-ScaleBB)
France (TGH/F 2005), Israel, Mexico (EMSSA 2009), Japan (SMT 2007), Spain (PERM/F P 2000)
OKlittle to no expected shortfall
Netherlands (AG-Prognosetael 2010), UK (SAPS1-CMI), UK (SAPS2-CMI), US (RP2014-MP2014)
Germany (DAV 2004 R), Netherlands (AG-Prognosetael 2010), Switzerland (ERM/F 2000), UK (PCMA/PCFA 2000-CMI)
Potential shortfall of pension/annuity provisions based on standard mortality tables

16
What is current regulation and practice with respect to the use of mortality tables for the valuation of pension and annuity liabilities?
Are the standard mortality tables used by pension funds and annuity providers sufficient given recent trends in life expectancy?
What are the policy implications to encourage and facilitate the recognition and management of longevity risk?
Questions addressed

17
Expected vs. unexpected risk• First need to make sure mortality assumptions are in line with
expectations to address expected improvements in life expectancy
• Secondly need to assess the financial impact of additional unexpected increases in life expectancy, and decide how much risk to retain or mitigate
Longevity risk
Must first have a reasonable estimation of expected pension/annuity liabilities to be able to assess the impact of unexpected increases in longevity
• The financial impact of a 25% decrease in mortality will not be the same if assumptions include no improvements (Scenario 2)
Future pension payments using different mortality assumptions

18
1. The regulatory framework should ensure that pension funds and annuity providers use appropriate mortality tables to account and provision for expected future improvements by establishing clear guidelines for the development of mortality tables used for reserving for annuity and pension liabilities.
2. Governments should facilitate the measurement of mortality for the purposes of assumption setting and the evaluation of basis risk of index-based hedging instruments.
3. The regulatory framework should provide incentives for the management and mitigation of longevity risk.
4. Governments should encourage the development of a market for instruments to hedge longevity, particularly index-based instruments, by facilitating transparency and standardization of longevity hedges in order to ensure the capacity for pension plans and annuity providers to continue to provide longevity protection to individuals.
Summary of Policy Implications
19
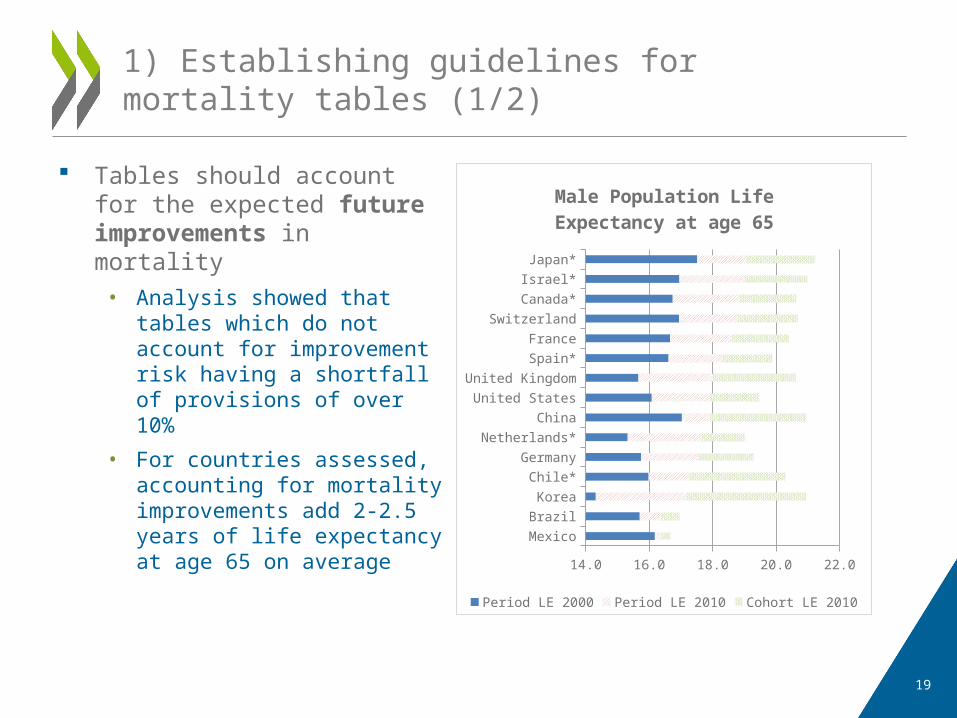
Tables should account for the expected future improvements in mortality
• Analysis showed that tables which do not account for improvement risk having a shortfall of provisions of over 10%
• For countries assessed, accounting for mortality improvements add 2-2.5 years of life expectancy at age 65 on average
1) Establishing guidelines for mortality tables (1/2)
Mexico
Brazil
Korea
Chile*
Germany
Netherlands*
China
United States
United Kingdom
Spain*
France
Switzerland
Canada*
Israel*
Japan*
14.0 16.0 18.0 20.0 22.0
Male Population Life Expectancy at age 65
Period LE 2000 Period LE 2010 Cohort LE 2010
20
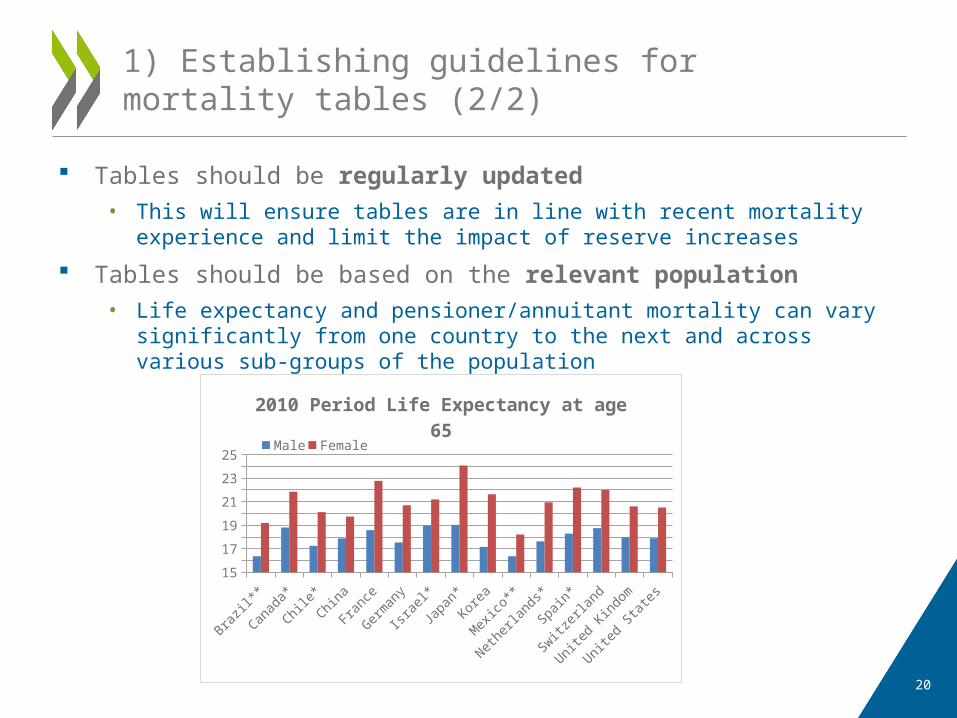
Tables should be regularly updated• This will ensure tables are in line with recent mortality experience and
limit the impact of reserve increases
Tables should be based on the relevant population• Life expectancy and pensioner/annuitant mortality can vary
significantly from one country to the next and across various sub-groups of the population
1) Establishing guidelines for mortality tables (2/2)
Brazil**
Canad
a*
Chile
*
China
Franc
e
Germ
any
Isra
el*
Japa
n*
Korea
Mex
ico**
Nethe
rland
s*
Spain
*
Switzer
land
Unite
d Kin
dom
Unite
d Sta
tes
15
17
19
21
23
25
2010 Period Life Expectancy at age 65
Male Female

21
Accurate and timely mortality data should be available, preferably by age, gender and socio-economic groups
• Could be used to inform mortality assumptions and keep them up-to-date
• Level of education and income is significantly correlated with life expectancy
– Catégories Socio-Professionnelles (CSP) in France
– National Statistics Socio-Economic Classification (NS-SEC) in the UK
2) Facilitating the measurement of mortality
AgricultureArtisans
Skilled Execuitves
Middle Management
Employee
Manual Worker
Unemployed12
14
16
18
20
22
24
2004 Period Life Expectancy at age 65 by French Socio-Professional Category
(CSP) Males Females
Source: Insee, Échantillon Démographique Permanent et état civil

22
Capital and funding requirements should reflect the risk profile of the liabilities
• Reduction of longevity risk should reduce capital requirements and increase funding ratios
• E.g. risk based requirements which could be based on distributions provided by stochastic models
Accounting standards should ensure the appropriate valuation of hedging instruments
• Longevity hedging instruments should be allowed to offset the value of the liabilities
3) Encouraging the management and mitigation of longevity risk
Financial impact of unexpected improvements in life expectancy at age 65 at the 95% level of confidence
Male Female LC CBD LC CBDCanada 1.4% 2.2% 1.6% 2.0%Chile 4.7% 5.2% 4.1% 4.7%France 3.3% 4.3% 3.1% 3.7%Germany 2.6% 3.6% 2.4% 3.0%Israel 3.1% 3.9% 2.5% 3.4%Japan 3.6% 4.6% 2.7% 3.3%Netherlands 2.4% 4.4% 2.9% 3.2%Spain 4.8% 5.7% 2.8% 4.0%Switzerland 2.3% 3.6% 2.4% 3.4%UK 3.0% 4.7% 3.3% 3.9%US 1.7% 2.4% 2.1% 2.4%

23
Common options for hedging longevity risk
• Bulk Annuities– Full Transfer of all risks including
investment risk
• Longevity Swaps– Fixed payments made by the pension
fund/annuity provider in exchange for floating payments based on the evolution of underlying mortality
– Bespoke or index-based
Need for financial instruments to enable pension funds and annuity providers to mitigate longevity risk
• Capacity constraints– Limits of diversification
– Risk-based capital requirements
– Increased focus on risk-management
4) Facilitating the transparency and standardisation of longevity hedges (1/3)
Source: Hymans Robertson
Volume of longevity transactions in the UK
24
Misalignment of incentives between pension fund/annuity provider and investor• Several barriers for capital markets investors taking bespoke
transactions– Asymmetrical information
– Time consuming to perform the risk analysis
– Very long duration
• Pension funds and annuity providers would prefer a bespoke hedge
– Risk is fully hedged; no basis risk
– Limited data available on which to measure and assess basis risk
Index-based instruments could resolve this misalignment and are by nature more transparent and standardised than bespoke transactions
4) Facilitating the transparency and standardisation of longevity hedges (2/3)

25
Potential measures• Regularly publish a longevity index to provide an anchor
for pricing of longevity instruments– Metrics for both current mortality as well as projections
reflecting the most up-to-date expectations
– Governments have access to the underlying data needed and could produce reliable and regular figures
• Consider the issuance of a longevity bond to provide a benchmark for pricing
– Must be considered with care given the significant existing exposure of many governments to longevity risk
• Bring over-the-counter transactions into exchanges– Increase the transparency of such transactions and promote
liquidity on the secondary market
4) Facilitating the transparency and standardisation of longevity hedges (3/3)

26
Expected longevity risk is unavoidable and must be accounted for in mortality assumptions used to value pension and annuity liabilities• Current Level: Mortality tables should be regulatory updated
based on relevant data
• Trend: Mortality improvements should be accounted for
The regulatory framework should be reflective of and reactive to changes in exposure to unexpected longevity risk to encourage the measurement and management of the risk• Accounting standards and solvency requirements
The transparency and standardisation of longevity hedges should be facilitated to ensure available capacity for longevity risk• Data availability
• Reliable benchmarks
• Standardisation through exchanges
Key Takeaways

THANK YOU VERY MUCH! QUESTIONS OR COMMENTS
WELCOME
www.oecd.org/insurance/private-pensions