Morphological characterization and diversity analysis … · Morphological characterization and...
13
J. Bio. Env. Sci. 2016 196 | Bashar et al. RESEARCH PAPER OPEN ACCESS Morphological characterization and diversity analysis of some selected aromatic rice genotypes in Bangladesh K.K. Bashar 1* , N.A. Ivy 2 , M.A.K. Mian 2 , K.M. Iftekharuddaula 3 , M.A. Hoque 4 1 Bangladesh Jute Research Institute, Dhaka, Bangladesh 2 Department of Genetics and Plant Breeding, Bangabandhu Sheikh Mujibur Rahman Agricultural University, Gazipur, Bangladesh 3 Plant Breeding Division, Bangladesh Rice Research Institute, Gazipur, Bangladesh 4 Department of Horticulture, Bangabandhu Sheikh Mujibur Rahman Agricultural University, Gazipur, Bangladesh Article published on April28, 2016 Key words: Aromatic rice, Morphological characterization, Cluster distance, Hybridization. Abstract The improvement of aromatic rice genotypes requires proper characterization of its existing germplasm. For this purpose, twenty four (nineteen aromatic and five non-aromatic fine) rice genotypes were evaluated for twenty qualitative and sixteen quantitative traits at morphological level to identify the suitable genotypes for future hybridization program at Bangabandhu Sheikh Mujibur Rahman Agricultural University. All the genotypes produced same scores in the data for eight qualitative characters viz. blade colour, leaf sheath: anthocyanin colour, ligule colour, ligule shape, auricle colour, collar colour, anthocyanin coloration of nodes and stigma colour. Differences were found in the genotypes studied for rest of the qualitative characteristics. The analysis of variance indicated the existence of highly significant variability for all the characters studied. All the genotypes made seven clusters. The highest intra-cluster distance was computed for cluster I (0.75), composed of five genotypes followed by the cluster V (0.72) composed of five genotypes. Only one genotype viz. Jhingasail belonged to the cluster IV which had intra-cluster distance 0.00, indicated that this genotype was genetically diversed from other genotypes. The inter-cluster distance was the highest (19.26) between cluster III and V followed by the 17.30 between cluster II and cluster VI and the lowest distance (2.63) was obtained between cluster I and cluster III. Considering the magnitude of genetic distances the cross combination Chinigura and Jhingasail, Basmati 107 and (Jhingasail, Rong-er-gura, Kalijira, Rasmala and Chinisagor), Basmati naret and (Rasmala, Rong-er-gura and Kalijira) and Kataribhog and Chinisagor might be selected for future hybridization program. * CorrespondingAuthor:K.K. Bashar[email protected] Journal of Biodiversity and Environmental Sciences (JBES) ISSN: 2220-6663 (Print) 2222-3045 (Online) Vol. 8, No. 4, p. 196-208, 2016 http://www.innspub.net
Transcript of Morphological characterization and diversity analysis … · Morphological characterization and...

J. Bio. Env. Sci. 2016
196 | Bashar et al.
RESEARCH PAPER OPEN ACCESS
Morphological characterization and diversity analysis of some
selected aromatic rice genotypes in Bangladesh
K.K. Bashar1*, N.A. Ivy2, M.A.K. Mian2, K.M. Iftekharuddaula3, M.A. Hoque4
1Bangladesh Jute Research Institute, Dhaka, Bangladesh
2Department of Genetics and Plant Breeding, Bangabandhu Sheikh Mujibur Rahman Agricultural
University, Gazipur, Bangladesh
3Plant Breeding Division, Bangladesh Rice Research Institute, Gazipur, Bangladesh
4Department of Horticulture, Bangabandhu Sheikh Mujibur Rahman Agricultural University,
Gazipur, Bangladesh
Article published on April28, 2016
Key words: Aromatic rice, Morphological characterization, Cluster distance, Hybridization.
Abstract
The improvement of aromatic rice genotypes requires proper characterization of its existing germplasm. For this
purpose, twenty four (nineteen aromatic and five non-aromatic fine) rice genotypes were evaluated for twenty
qualitative and sixteen quantitative traits at morphological level to identify the suitable genotypes for future
hybridization program at Bangabandhu Sheikh Mujibur Rahman Agricultural University. All the genotypes
produced same scores in the data for eight qualitative characters viz. blade colour, leaf sheath: anthocyanin
colour, ligule colour, ligule shape, auricle colour, collar colour, anthocyanin coloration of nodes and stigma
colour. Differences were found in the genotypes studied for rest of the qualitative characteristics. The analysis of
variance indicated the existence of highly significant variability for all the characters studied. All the genotypes
made seven clusters. The highest intra-cluster distance was computed for cluster I (0.75), composed of five
genotypes followed by the cluster V (0.72) composed of five genotypes. Only one genotype viz. Jhingasail
belonged to the cluster IV which had intra-cluster distance 0.00, indicated that this genotype was genetically
diversed from other genotypes. The inter-cluster distance was the highest (19.26) between cluster III and V
followed by the 17.30 between cluster II and cluster VI and the lowest distance (2.63) was obtained between
cluster I and cluster III. Considering the magnitude of genetic distances the cross combination Chinigura and
Jhingasail, Basmati 107 and (Jhingasail, Rong-er-gura, Kalijira, Rasmala and Chinisagor), Basmati naret and
(Rasmala, Rong-er-gura and Kalijira) and Kataribhog and Chinisagor might be selected for future hybridization
program.
*CorrespondingAuthor:K.K. [email protected]
Journal of Biodiversity and Environmental Sciences (JBES) ISSN: 2220-6663 (Print) 2222-3045 (Online)
Vol. 8, No. 4, p. 196-208, 2016
http://www.innspub.net

J. Bio. Env. Sci. 2016
197 | Bashar et al.
Introduction
Rice (Oryza sativa L.) belongings to the family
Graminae or Poaceae and subfamily Bambusoideae or
Ehrhartoideae (Hooker, 1979) is a self-pollinated,
monocotyledonous cereal crop. Grain quality in rice
plays an important role in consumer acceptability.
Juliano and Duff (1991) concluded that grain quality
is second after yield as the major breeding objective
for crop improvement. Aroma quality of scented rice
is a major character which increases the value of rice
in international market (Nayaket al., 2002). Most of
the scented rice varieties in Bangladesh are of
traditional type, photoperiod sensitive and cultivated
during the Aman season. Majority of these indigenous
aromatic rice cultivars are small and medium grained
(Singh et al. 2000a,b; Kovach et al., 2009; Li et al.,
2010 and Ray et al., 2013) low yielding but its higher
price and low cost of cultivation generate higher
profit margins compared to other varieties.
Like other parts of the world, Bangladesh has already
lost a large number of aromatic rice genotypes and
many at the verge of extinction (Singh et al., 2000).
Rapid adoption of modern varieties is a serious threat
for the existence of fine quality rice genotypes for
their low yield. The improvement of aromatic rice
genotypes requires its collection and evaluation of
existing cultivars of Bangladesh. The Himalayan
foothill including parts of Bangladesh is considered to
be the secondary center of diversity of the genus
Oryza (Morishima, 1984) but information about the
characterization or genetic diversity of aromatic rice
is very limited. Systematic study and characterization
of such germplasm is not only important for utilizing
the appropriate attribute based donors, but also
essential in the present era for protecting the unique
rice. Thus, there is a need to collect, exploit and
evaluate the untapped germplasm (Parikh et al.,
2012).
Diversity analysis especially the multivariate analysis
is a useful tool in quantifying the degree of divergence
between biological population at genotypic level and
to assess relative contribution of different
components to the total divergence both at intra- and
inter-cluster levels (Zahanet al., 2008). Therefore, the
study was undertaken to assess genetic diversity in
Bangladeshi local aromatic rice genotypes and to
select suitable diverse parents for future breeding
program.
Materials and methods
Experimental materials
Twenty four rice genotypes were used in this study.
The list of the twenty four rice genotypes including
their ecotype, BRRI accession number and place of
collection is given in Table 1.
Experimental site
The field experiments for morphological characters of
aromatic plants were carried out at the research field
of the Department of Genetics and Plant Breeding,
Bangabandhu Sheikh Mujibur Rahman Agricultural
University, Gazipur, Bangladesh during June to
August 2014.
Experimental design and layout
The field experiment was laid out in a randomized
complete block design with three replications. Each
replication was divided into twenty four unit plots
where twenty four genotypes were allocated at
random. Thus total number of unit plots was 72. Size
of each units plot was 2.4m2 (3m x 0.8m). The spaces
between blocks and between plots were 1m and 0.5m,
respectively. Plant to plant and line to line distance
were 20cm and 25cm respectively. Each plot consists
of 24 plants.
Morphological characterization
Data on the agronomical and morphological
characters were collected from ten randomly selected
hills excluding border rows from each replicated
plots. Twenty qualitative and sixteen quantitative
traits were recorded using “Germplasm Descriptors &
Evaluation Form” by Bangladesh Rice Research
Institute (BRRI).
Statistical analysis for quantitative traits

J. Bio. Env. Sci. 2016
198 | Bashar et al.
Mean data of quantitative traits for the morphological
characters were subjected to both univariate and
multivariate analysis. Univariate analysis of the
individual character (analysis of variance) was done
by computer using STATISTIX 10 software. The test
of significance was done by F-test. Mean, range and
coefficient of variation (CV%) were also estimated
using STATISTIX 10. Multivariate analysis was done
by computer using GENSTAT 5.5 and Microsoft Excel
software through four techniques viz. Prinicipal
Component Analysis (PCA), Principal Coordinate
Analysis (PCoA) Cluster Analysis (CA) and Canonical
Vector Analysis (CVA) as suggested by Anderson
(1957).
Results and discussion
Morphological characterization through qualitative
traits
All the genotypes produced same scores in the data
for eight qualitative characters viz. blade colour, leaf
sheath: anthocyanin colour, ligule colour, ligule
shape, auricle colour, collar colour, anthocyanin
coloration of nodes and stigma colour. These result
revealed that there was no variation for these traits
among all the test genotypes. All the test genotypes
were characterized (Table 2) on the basis of the rest
twelve qualitative characters.
Table 1. List of 24 test rice genotypes with their different characters.
SL. No. BRRI Access No. Variety Name Ecotype Aroma Place of collection
1 4867 Chinigura T. Aman Aromatic Naogaon
2 7413 Basmati India T. Aman Aromatic GRSD*, BRRI, Gazipur
3 7082 Kataribhog T. Aman Aromatic Dinajpur
4 5347 Sakkorkhora T. Aman Aromatic Barguna
5 4497 Basmati Porder T. Aman Aromatic GRSD*, BRRI, Gazipur
6 4904 Basmati 370 T. Aman Aromatic Pakistan
7 4496 Basmati Naret T. Aman Aromatic GRSD*, BRRI, Gazipur
8 4495 Basmati IRGC 27782 T. Aman Aromatic GRSD*, BRRI, Gazipur
9 4500 Basmati 1 T. Aman Aromatic GRSD*, BRRI, Gazipur
10 4501 Basmati 107 T. Aman Aromatic GRSD*, BRRI, Gazipur
11 4502 Basmati 134 T. Aman Aromatic GRSD, BRRI, Gazipur
12 4503 Basmati 372 T. Aman Aromatic GRSD*, BRRI, Gazipur
13 - Kamarang T. Aman Aromatic GRSD*, BRRI, Gazipur
14 5950 JamaiAduri T. Aman Aromatic GRSD*, BRRI, Gazipur
15 416 Jhingasail T. Aman Non-aromatic Rajshahi
16 4109 Khutichikon (3) T. Aman Aromatic Comilla
17 4108 Khutichikon (2) T. Aman Non-aromatic Comilla
18 247 Kalijira T. Aman Aromatic Khulna
19 315 Binnaphul T. Aman Aromatic Gaibandha
20 - Rong-er-gura T. Aman Non-aromatic Bhola
21 245 Chinisagor T. Aman Aromatic Mymensingh
22 - Rasmala T. Aman Non-aromatic Sherpur
23 7063 SugandhiDhan (2) T. Aman Non-aromatic Nawabganj
24 4490 Basmati T3 T. Aman Aromatic GRSD*, BRRI, Gazipur
GRSD*= Germplasm Resources and Seed Division, BRRI*= Bangladesh Rice Research Institute.
Morphological characterization through
quantitative traits
Morphogenetic variation in rice genotypes based on
univariate analysis
Analysis of variance (Table 3) of sixteen quantitative
characters based on individual sample means showed
highly significant differences among the genotypes for
all the characters studied indicated wide variation

J. Bio. Env. Sci. 2016
199 | Bashar et al.
among the genotypes. The coefficient of variation
ranged from 2.5 - 34.38% which indicated
considerable variation in the characters studied.
Among the sixteen characters unfilled grain per
panicle, harvest index, yield per hill and filled grain
per panicle were found to have relatively higher
coefficient of variation (34.28, 15.22, 11.63 and 11.06
percent, respectively) than the other characters.
Table 2. Classification of rice genotypes based on qualitative characteristics.
Sl. No. Characters Classification of genotypes
1 Blade pubescence (i) intermediate (2): 1, 5 – 12
(ii) pubescent (3): 2 - 4, 13 – 24
2 Leaf angle (i) Erect (1): 5 - 12 and 22 – 23
(ii) Horizontal (5): 1 - 4, 13 - 20 and 24
(iii) Drooping (9): 21
3 Flag leaf angle (i) Erect (<30o) (1): 22 and 23
(ii) Intermediate or semi erect (<30 - 45o) (3): 1 - 21 and 24
4 Culm angle (i) Erect (1): 2,15, 17 and 21 – 23
(ii) Intermediate (3): 1, 3 - 12, 14, 16, 18 - 20 and 24
(iii) Spreading (7): 13
5 Internode colour (i) Green (1): 1 – 12
(ii) Light gold (2): 13 – 24
6 Culm strength (i) Intermediate (most plants moderately lodging) (5): 3, 20 and 22 - 24
(ii) Weak (most plants nearly flat) (7): 1 - 2, 4 - 19 and 21
7 Panicle type (i) Compact (1): 22 and 23
(ii) Intermediate (5): 1 - 21 and 24
8 Panicle secondary
branching
(i) Light (1): 1 and 4 – 24
(ii) Heavy (2): 2 and 3
9 Panicle exertion (i) Well Exerted (1): 1 – 4
(ii) Moderately well exerted (3): 5 – 24
10 Awns in the spikelet (i) Absent (1): 1 - 2, 4 - 14 and 16 – 23
(ii) Present (9): 3, 15 and 24
11 Apiculuscolour (i) White (1): 14 and 16
(ii) Straw (2): 1 - 12, 15, 17 and 19 - 24
(iii) Purple (6): 13 and 18
12 Stigma exertion (i) Low (5 - 20%) (3): 3, 13, 15 and 20 – 21
(ii) Medium (21 - 40%) (5): 1 - 2, 4 - 12, 14, 16 - 19 and 22 – 24
Legend:
1 = Chinigura, 2 = Basmati India, 3 = Kataribhog, 4 = Sakkorkhora, 5 = Basmati Porder, 6 = Basmati 370, 7 =
Basmati Naret, 8 = Basmati IRGC 27782, 9 = Basmati 1, 10 = Basmati 107, 11 = Basmati 134, 12 = Basmati 372, 13
= Kamarang, 14 = JamaiAduri, 15 = Jhingasail, 16 = Khutichikon (3), 17 = Khutichikon (2), 18 = Kalijira, 19 =
Binnaphul, 20 = Rong-er-gura, 21 = Chinisagor, 22 = Rasmala, 23 = SugandhiDhan (2) and 24 = Basmati T3.
Morphogenetic variation in rice genotypes based on
multivariate analysis
Multivariate analysis were done using D2 statistics,
canonical roots and vectors following the principle of
Mahalanobis generalized distance as per the
procedure obtained by Rao (1952). Moreover,
methods of multivariate analysis i.e. Principal
Component Analysis (PCA) and Principal Coordinate
Analysis (PCoA) were also performed to find out the
nature and magnitude of rice diversity.
Principal component analysis (PCA)
Eigen values (latent roots) of 16 principal component
axis and percentage of total variation accounted for
them obtained from principal component analysis are
presented in Table 4. The result revealed that the first
axis largely accounted for the variation among the
genotypes (36.43%) followed by the second axis
(19.39%). The first six axes accounted for about 90%
of the total variations among the 16 characters
describing test rice genotypes where only 56%

J. Bio. Env. Sci. 2016
200
variation was accounted for the first two axes.
Hossain (2008) and Islam (2011), found similar
findings in determining the variation among 78 and
47 rice genotypes, respectively.
Principal coordinates analysis (PCoA)
Inter-genotypic distance D2 was obtained from
principal coordinate analysis for all possible
combinations between pairs of genotypes. Ten highest
and 10 lowest inter-genotypic distances between 24
rice genotypes are shown in Table 5.
Table 3. Analysis of variance of sixteen quantitative characters of rice genotypes.
Sources of
variation
Df
Mean sum of square
LL (mm) FLA
(cm2)
CD
(mm)
TT ET PL
(cm)
PH
(cm)
DF
(days)
DM
(days)
Replication 2 0.011 0.154 0.266 0.017 3.305 5.443 113.345 1.931 2.667
Genotypes 23 0.596** 59.702** 1.052** 4.616** 2.730** 12.402** 518.442** 507.932** 453.197**
Error 46 0.007 4.708 0.090 0.759 0.935 2.647 27.918 5.684 9.043
CV (%) 4.63 5.65 6.34 7.18 8.81 5.89 3.75 2.65 2.50
Table 3. ( contd ….)
Sources of
variation
Df
Mean sum of square
FG/P UFG/P GL
(mm)
GB
(mm)
1000 grain wt.
(g)
Y/hill HI
Replication 2 80.35 315.551 0.120 0.010 39.926 44.104 0.008
Genotypes 23 5544.25** 97.800** 6.485** 0.092** 49.353** 41.157** 0.018**
Error 46 236.96 167.226 0.150 0.016 3.930 6.440 0.002
CV (%) 11.06 34.28 4.78 5.48 10.10 11.63 15.22
**significant at 1% level
Legend: LL = Ligule Length, FLA = Flag Leaf Area, CD = Culm Diameter, TT = Total Tiller, ET = Effective Tiller,
PL = Panicle Length, PH = Plant Height, DF = Days to 50% Flowering, DM = Days to Maturity, FG/P = Filled
Grain per Panicle, UFG/P = Unfilled Grain per Panicle, GL = Grain Length, GB = Grain Breadth, Y/hill = Yield
per hill, HI = Harvest Index.
The highest inter-genotypic distance was 1.94, which
was observed between the genotypes Chinigura and
Jhingasail followed by the distance 1.91 (Basmati 107
and Jhingasail). The lowest distance (0.33) was
observed between the genotypes Basmati 370 and
Basmati 372 followed by the distance 3.38 (Kalijira
and Chinisagor). Most of the inter-genotypic
distances were obtained between Basmati and non-
Basmati group of rice germplasm which may be due
to the cause of different genetic background. The
difference between the highest and the lowest inter-
genotype distance indicated the prevalence of
variability among the test genotypes.
Table 4.Latent roots (Eigen Value) and their variation in 16 morphological quantitative traits in 24 test rice
genotypes.
Principal component axis Eigen values % of total variation accounted for Cumulative percent
I 5.830 36.43 36.43
II 3.102 19.39 55.82
III 1.600 10.00 65.82
IV 1.306 8.16 73.98
V 1.087 6.80 80.78
VI 1.012 6.32 87.10
VII 0.819 5.12 92.22
VIII 0.441 2.76 94.98
IX 0.254 1.59 96.57

J. Bio. Env. Sci. 2016
201
X 0.203 1.27 97.84
XI 0.176 1.10 98.94
XII 0.073 0.46 99.40
XIII 0.036 0.23 99.63
XIV 0.036 0.22 99.85
XV 0.014 0.09 99.94
XVI 0.010 0.06 100
Table 5. Ten highest and 10 lowest inter-genotypic distances between 24 rice genotypes.
Sl. no. Genotypic contribution Distance
A. Ten highest inter genotypic distances
01 Between Chinigura and Jhingasail 1.9488
02 Between Basmati 107 and Jhingasail 1.9106
03 Between Basmati Naret and Rasmala 1.8364
04 Between Basmati Naret and Rong-er-gura 1.8326
05 Between Basmati 107 and Rong-er-gura 1.8181
06 Between Basmati 107 and Kalijira 1.8120
07 Between Basmati Naret and Kalijira 1.7979
08 Between Basmati 107 and Rasmala 1.7698
09 Between Kataribhog and Chinisagor 1.7592
10 Between Basmati 107 and Chinisagor 1.7433
B. Ten lowest inter genotypic distances
01 Between Basmati 370 and Basmati 372 0.3330
02 Between Kalijira and Chinisagor 0.3889
03 Between Kamarang and Khutichikon (2) 0.3983
04 Between Jamaiaduri and Khutichikon (2) 0.4165
05 Between Kalijira and Rong-er-gura 0.4221
06 Between Basmati Porder and Basmati Naret 0.4223
07 Between Kalijira and Rasmala 0.4471
08 Between Basmati Porder and Basmati 370 0.4591
09 Between Basmati 370 and Basmati IRGC 27782 0.4661
10 Between Basmati Porder and Basmati 1 0.4666
Canonical variate analysis
Cluster analysis of rice genotypes based on agro-
morphological characteristics was reported by many
researchers (Ghalain, 2006; Naik et al., 2006; Hien et
al., 2007; Mathure et al., 2010, 2011; Sarawgi et al.,
2012). In this study the cluster VI composed of largest
number of genotypes (6), but its intra-cluster
distances were not necessarily the highest. The
statistical distances represent the index of genetic
diversity among the genotypes of a cluster. There
were marked variations in intra-cluster distances,
which ranged from 0.48 to 0.75 (Table 6). The highest
intra-cluster distance was computed for cluster I
(0.75), composed of five genotypes followed by the
cluster V (0.72) composed of five genotypes. The
intra-cluster distances of cluster II, III, IV and VI was
0.48, 0.71, 0.00 and 0.61 consisting of 4, 3, 1 and 6
genotypes, respectively. Only one genotype
viz.Jhingasail belonged to the cluster IV which
represented its intra-cluster distance as 0.00 and
indicated that this genotype was genetically diverse
from other genotypes. The intra-cluster distances in
the entire six clusters were lower than the inter-
cluster distances. The lower values of intra-cluster
distances in all six clusters indicated genotypes within
the same cluster were closely related and wider
genetic diversity among the genotypes of different
clusters. However, the highest value (0.75) of intra-
cluster distance in cluster I indicated that the five
genotypes constituted in this cluster might have
diverged characters i.e., heterogeneous, which
contributed to the formation of this cluster. On the
other hand, the lowest value (0.48) of intra-cluster
distance in cluster II indicated that the four genotypes
constituted in this cluster might have most similarity
(homogenous) than the genotypes of the other
J. Bio. Env. Sci. 2016
202
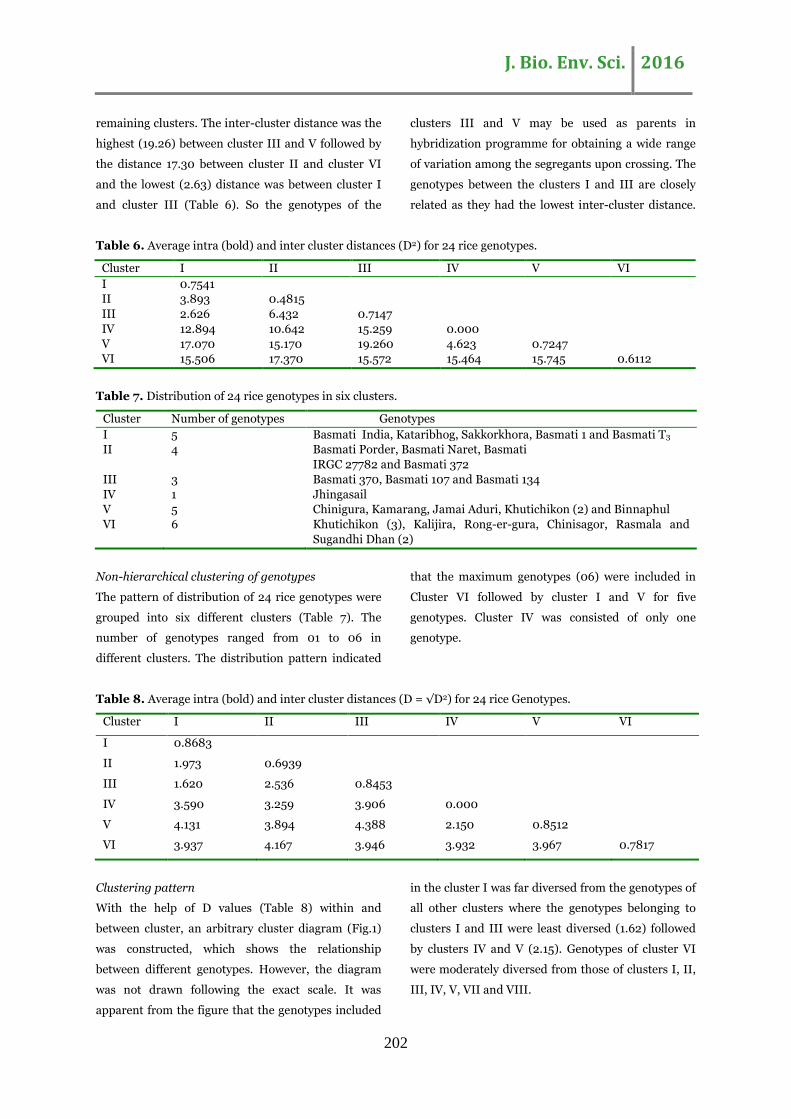
remaining clusters. The inter-cluster distance was the
highest (19.26) between cluster III and V followed by
the distance 17.30 between cluster II and cluster VI
and the lowest (2.63) distance was between cluster I
and cluster III (Table 6). So the genotypes of the
clusters III and V may be used as parents in
hybridization programme for obtaining a wide range
of variation among the segregants upon crossing. The
genotypes between the clusters I and III are closely
related as they had the lowest inter-cluster distance.
Table 6. Average intra (bold) and inter cluster distances (D2) for 24 rice genotypes.
Cluster I II III IV V VI
I 0.7541
II 3.893 0.4815
III 2.626 6.432 0.7147
IV 12.894 10.642 15.259 0.000
V 17.070 15.170 19.260 4.623 0.7247
VI 15.506 17.370 15.572 15.464 15.745 0.6112
Table 7. Distribution of 24 rice genotypes in six clusters.
Cluster Number of genotypes Genotypes
I 5 Basmati India, Kataribhog, Sakkorkhora, Basmati 1 and Basmati T3
II 4 Basmati Porder, Basmati Naret, Basmati
IRGC 27782 and Basmati 372
III 3 Basmati 370, Basmati 107 and Basmati 134
IV 1 Jhingasail
V 5 Chinigura, Kamarang, Jamai Aduri, Khutichikon (2) and Binnaphul
VI 6 Khutichikon (3), Kalijira, Rong-er-gura, Chinisagor, Rasmala and
Sugandhi Dhan (2)
Non-hierarchical clustering of genotypes
The pattern of distribution of 24 rice genotypes were
grouped into six different clusters (Table 7). The
number of genotypes ranged from 01 to 06 in
different clusters. The distribution pattern indicated
that the maximum genotypes (06) were included in
Cluster VI followed by cluster I and V for five
genotypes. Cluster IV was consisted of only one
genotype.
Table 8. Average intra (bold) and inter cluster distances (D = √D2) for 24 rice Genotypes.
Cluster I II III IV V VI
I 0.8683
II 1.973 0.6939
III 1.620 2.536 0.8453
IV 3.590 3.259 3.906 0.000
V 4.131 3.894 4.388 2.150 0.8512
VI 3.937 4.167 3.946 3.932 3.967 0.7817
Clustering pattern
With the help of D values (Table 8) within and
between cluster, an arbitrary cluster diagram (Fig.1)
was constructed, which shows the relationship
between different genotypes. However, the diagram
was not drawn following the exact scale. It was
apparent from the figure that the genotypes included
in the cluster I was far diversed from the genotypes of
all other clusters where the genotypes belonging to
clusters I and III were least diversed (1.62) followed
by clusters IV and V (2.15). Genotypes of cluster VI
were moderately diversed from those of clusters I, II,
III, IV, V, VII and VIII.

J. Bio. Env. Sci. 2016
203
Intra-cluster mean
The mean values for all the 16 characters along with
the marking of the highest (H) and lowest (L) for each
of the cluster are presented in Table 9.
The data revealed that different clusters exhibited
different mean values for almost all the characters.
The genotype of cluster IV produced the highest mean
for days to 50% flowering, days to maturity, grain
length and 1000 grain weight. On the other hand, the
lowest means of this cluster for the characters were
ligule length, total tiller, effective tiller, filled grain
per panicle and harvest index. Golamet al., (2011)
reported that the number of effective tillers and filled
grains per panicle has the positive contribution to
grain yield.
Table 9. Cluster mean for 16 quantitative characters of 24 rice genotypes.
Characters I II III IV V VI
Ligule length (cm) 2.12 2.27 2.28H 1.41L 1.44 1.52
Flag leaf area (cm2) 38.07 42.22H 40.83 38.93 37.01 35.81L
Culm diameter (cm) 5.30H 5.21 5.18 4.46 4.23L 4.55
Total tiller 13.14H 12.18 11.60 11.13L 12.58 11.37
Effective tiller 12.27H 11.13 11.13 9.70L 11.03 10.08
Panicle length (cm) 27.11 26.66L 30.39H 29.20 27.14 28.82
Plant height (cm) 130.90L 145.48 157.53H 145.17 138.84 137.52
Days to 50% flowering 81.00 78.75 71.33L 105.00H 103.20 102.33
Days to maturity 111.40 106.50L 108.00 140.00H 133.40 133.17
Filled grain per panicle 125.81 89.22 120.27 59.20L 139.45 214.65H
Unfilled grain per panicle 28.77 30.35 26.53L 73.53 28.73 66.05H
Grain length (mm) 9.16 9.64 9.50 9.72H 7.07 6.43L
Grain breadth (mm) 2.55H 2.39 2.26 2.29 2.49 2.22L
1000 grain weight (g) 22.77 20.62 17.73 24.80H 17.76 12.46L
Yield per hill (g) 24.46 22.78 19.37 27.09H 19.67 16.10L
Harvest index 0.34 0.33 0.40H 0.30L 0.37 0.33
The genotypes of cluster III produced the highest
mean for ligule length, panicle length, plant height
and harvest index, but 50% flowering and unfilled
grain per panicle showed the lowest mean values for
the genotype in this cluster.
The genotypes of cluster I gave the highest mean for
culm diameter, total tiller, effective tiller and grain
breadth but lowest mean for only one character plant
height.
The genotypes of cluster VI gave the highest mean for
filled grain per panicle and unfilled grain per panicle,
but flag leaf area, grain length, grain breadth, 1000
grain weight and yield per hill was found with the
lowest mean values.
The genotypes of cluster II gave the highest mean for
only one character flag leaf area but lowest mean for
panicle length and days to maturity.
The genotypes of cluster V produced no highest mean
value for any character lowest mean for only one
character culm diameter.
In general, the cluster producing the highest mean
values for a particular trait not necessarily possessed
the genotypes with the highest value for that specific
trait in the same cluster. For example, the highest
cluster mean for grain length possessed by cluster IV,

J. Bio. Env. Sci. 2016
204
but the genotypes with the longest grain fall under
cluster I (Table 9 and Table 10). Similar result was
observed for ligule length, flag leaf area, panicle
length, days to 50% flowering, days to maturity,
unfilled grain per panicle, 1000 grain weight, yield
per hill and harvest index. These results indicated the
less contribution of those traits in the formation of
the cluster.
Table 10. Mean of 24 test genotypes for 16 quantitative characters.
SL No. Genotypes LL
(mm)
FLA
(cm2)
CD
(mm)
TT ET PL
(cm)
PH
(cm)
DF DM FG/P UFG/P GL
(mm)
GB
(mm)
1000.0
Gwt.(g)
Y/hill(g) HI
1 Chinigura 2.1 41.3 4.6 12.3 11.0 24.8 127.8 95.0 122.0 167.0 16.7 6.1 2.7 15.8 19.3 0.5
2 Basmati India 1.7 51.1 5.4 12.0 11.3 29.9 113.0 72.0 97.0 140.3 29.7 11.4 2.7 20.1 24.6 0.3
3 Kataribhog 2.2 35.1 4.8 15.0 13.5 25.2 119.3 86.0 119.0 110.0 32.5 8.5 2.5 30.9 32.3 0.3
4 Sakkorkhora 2.5 30.4 5.2 14.0 13.0 20.8 131.4 91.0 118.0 125.0 30.0 6.5 2.7 19.3 24.8 0.1
5 Basmati porder 2.2 42.2 5.4 14.0 13.4 26.6 144.8 88.0 107.0 92.2 27.4 9.6 2.1 20.6 23.2 0.4
6 Basmati 370 2.3 42.0 4.8 11.8 10.6 30.5 178.9 72.0 111.0 99.4 28.2 9.6 2.2 20.3 20.3 0.3
7 Basmati Naret 2.4 44.2 5.3 12.8 10.4 25.3 135.5 74.0 104.0 89.6 22.0 9.5 2.5 20.5 24.5 0.3
8 Basmati IRGC 27782 2.3 42.1 4.9 11.3 10.1 25.7 139.7 83.0 108.0 92.1 38.4 9.5 2.5 20.6 21.1 0.3
9 Basmati 1 2.2 37.3 5.6 13.4 12.8 31.3 143.6 72.0 111.0 125.0 24.8 9.8 2.4 20.3 25.1 0.6
10 Basmati 107 2.2 39.4 5.2 10.0 9.8 31.0 165.5 72.0 107.0 136.8 15.2 9.1 2.3 16.7 18.1 0.4
11 Basmati 134 2.4 41.1 5.6 13.0 13.0 29.7 167.4 70.0 106.0 124.6 36.2 9.9 2.2 16.2 19.7 0.4
12 Basmati 372 2.2 40.4 5.2 10.6 10.6 29.0 161.9 70.0 107.0 83.0 33.6 10.0 2.5 20.7 22.3 0.4
13 Kamarang 1.4 33.7 4.3 10.7 9.6 26.8 147.1 108.0 142.0 112.7 43.7 7.1 2.4 19.0 23.1 0.4
14 Jamaiaduri 1.1 35.9 4.0 12.7 10.9 26.4 140.3 104.0 136.0 154.1 29.6 8.0 2.2 18.3 20.8 0.4
15 Jhingasail 1.4 38.9 4.5 11.1 9.7 29.2 145.2 105.0 140.0 59.2 73.5 9.7 2.3 24.8 27.1 0.3
16 Khutichikon (3) 1.5 38.3 4.0 10.4 9.1 26.9 128.9 105.0 137.0 193.3 62.3 7.2 2.3 15.6 19.2 0.4
17 Khutichikon (2) 1.5 33.4 3.8 12.4 10.8 28.4 139.5 105.0 140.0 121.3 33.5 6.6 2.7 18.8 19.8 0.4
18 Kalijira 1.7 41.4 4.5 10.9 9.6 28.7 135.9 102.0 131.0 226.1 77.8 6.5 2.2 10.6 18.4 0.3
19 Binnaphul 1.1 40.7 3.9 14.7 12.8 29.4 139.4 104.0 127.0 142.1 20.1 7.5 2.4 17.0 15.3 0.2
20 Rong-er-gura 1.2 32.7 5.4 12.5 11.0 29.1 135.2 100.0 131.0 221.0 71.1 5.8 2.0 9.6 18.4 0.3
21 Chinisagor 2.0 36.8 5.0 10.7 9.8 29.2 148.5 104.0 121.0 194.0 74.1 6.2 2.1 10.1 14.0 0.3
22 Rasmala 1.4 31.5 4.3 11.9 10.6 29.7 142.7 100.0 130.0 262.3 69.5 6.1 2.3 12.9 15.4 0.4
23 Sugandhidhan (2) 1.4 34.1 4.1 11.8 10.4 29.3 133.9 103.0 131.0 191.2 41.4 6.8 2.5 16.0 11.3 0.3
24 Basmati T3 2.1 36.5 5.6 11.3 10.7 28.4 147.3 84.0 112.0 128.7 26.9 9.6 2.4 23.3 15.5 0.4
The genotypes produced either highest or lowest
mean values at least for six morpho-quantitative
characters by the particular clusters and either of the
clusters also possessed their respective genotypes
having the highest or lowest values of the characters.
It may be mentioned that the genotypes with the
highest mean values and the individual mean values
for the most of the characters viz. culm diameter,
total tiller, effective tiller, plant height, filled grain per
panicle and grain breadth were the same (Table 7, 9
and 10) which indicated that these traits may have
some positive contribution to the formation of the
clusters.
Contribution of characters towards divergence
Contribution of characters towards divergence
obtained from canonical variate analysis is presented
in Table 11 and Table 12. In this method vectors or
canonical roots were calculated to represent the
variates in the graphical form (Rao, 1952). This is
helpful in cluster analysis as it facilitates the study of
group constellations and also serves as a pictorial
representation of the configuration of various groups.
The absolute magnitude of the coefficients in the first

J. Bio. Env. Sci. 2016
205
two canonical vectors also reflects to a great extent,
the importance of characters for primary and
secondary differentiation. The character, which gives
high absolute magnitude for vector 1, is considered to
be responsible for primary differentiation. If the same
character gives equal magnitude for both the vectors
then that character is considered responsible for
primary as well as secondary differentiation.
Table 11. Values of canonical roots and the percentage of variation absorbed by them.
Canonical roots Values of canonical roots % of variation absorbed by the canonical roots
1 66.94 53.46
2 44.49 35.53
3 8.55 6.83
4 3.15 2.51
5 2.09 1.67
Total 125.22 100
Table 12. Relative contribution of 16 moroho-quantitative traits of 24 test genotypes of total divergence in rice.
Characters Vector I Vector II
Ligule length (cm) 0.3186 -0.0872
Flag leaf area (cm2) 0.2202 -0.1820
Culm diameter (cm) 0.2773 -0.1917
Total tiller 0.1385 0.3728
Effective tiller 0.2147 0.2487
Panicle length (cm) -0.0464 -0.4157
Plant height (cm) 0.0626 -0.3864
Days to 50% flowering -0.3599 0.2107
Days to maturity -0.3492 0.1745
Filled grain per panicle -0.3077 -0.0806
Unfilled grain per panicle -0.2909 -0.0991
Grain length (mm) 0.3372 -0.1551
Grain breadth (mm) 0.1474 0.2942
1000 grain weight (g) 0.2761 0.2335
Yield per hill (g) 0.2403 0.2499
Harvest index 0.0406 -0.2844
In the present study, it appeared from the canonical
analysis that 53.46% of the total variation was
accounted for canonical root 1 and 35.53% by
canonical root 2 (Table 11). Since the two canonical
roots absorbed about 89% of the variability, a two
dimensional representation of relative positions of the
genotypes in the Z1 and Z2 graph was considered to be
adequate. The coefficients pertaining to the different
characters in the first two canonical roots are
presented in Table 11.
The data (Table 12) in general indicated that the
characters for the primary differentiation in the
descending order were ligule length, flag leaf area,
culm diameter, plant height, grain length and harvest
index. From the positive absolute values of the vector
1, it would appear that grain length was the most
responsible for primary differentiation followed by
ligule length, culm diameter, flag leaf area, plant
height and harvest index. On the other hand, the
negative values for the two vectors of panicle length,
filled grain per panicle and unfilled grain per panicle
indicated least responsibility of both the primary and
secondary differentiations. However, from the
positive absolute values of these two vectors, it would
appear that total tiller, effective tiller, grain breadth,

J. Bio. Env. Sci. 2016
206
1000 grain weight and yield per hill value were
responsible for both primary and secondary
differentiation and highest contribution of these traits
towards the divergence between twenty four rice
genotypes. On the contrary, the negative absolute
values for vector I and positive values for vector II for
the characters days to 50% flowering and days to
maturity indicated the responsibility of secondary
differentiation and had lower contribution towards
the divergence. From the positive magnitude of
results of vector I it was appeared that the
contribution of grain length was the highest followed
by ligule length, culm diameter, flag leaf area, harvest
index and plant height to the total divergence in rice.
Hossain (2008) reported that head rice recovery
percentage was the highest followed by milling
outturn, stem length, elongation ratio, days to
flowering and days to maturity to the total divergence
in rice. Islam (2011) reported that contribution of
kernel breadth was the most responsible for primary
differentiation followed by L/B ratio, time of 50%
heading, amylose content, number of filled
grains/panicle, thousand grain weight, number of
tillers per plant, seed yield per plant and panicle
length to the total divergence in rice.
Fig. 1. Cluster diagram showing the inter cluster distance (D = √D2) for 24 rice genotypes.
Conclusion
High heterosis can be obtained from the cross
between genetically distant parents (Ghaderi et al.,
1984). Counting the magnitude of genetic distance,
contribution of different characters toward the total
divergence, magnitude of cluster means for different
characters, the following genotypes can be selected to
perform better if used in hybridization programme.
Among the inter-cluster distance, the highest distance
was observed between the cluster III and cluster V.
Cluster I and cluster III showed lowest inter-cluster
distance. Some inter-cluster distance showed

J. Bio. Env. Sci. 2016
207
intermediate distance. Intermediate diversed parents
have the more chance to contribute heterosis in the
subsequent generation.
To select clusters to obtain more heterotic genotypes
eleven pairs of clusters can be considered for this
purpose. These pair of combinations may be as
follows I and IV, I and V, I and VI, II and IV, II and V,
II and VI, III and IV, III and V, III and VI, IV and VI
and V and VI. Cluster III showed the highest mean for
ligule length, panicle length, plant height and harvest
index. Panicle length and plant height were important
for yield contributing character. In this cluster there
were two lowest mean values for unfilled grain per
panicle and days to 50% flowering those are more
desirable characters. Cluster I had the highest mean
value for culm diameter, total tiller, effective tiller and
grain breadth. In this cluster culm diameter, total
tiller and effective tiller were most important yield
contributing characters. In this cluster it also showed
lowest mean value for only one but most desirable
character viz. plant height. Cluster III had been
comprised of rice genotype viz. Basmati 370, Basmati
107 and Basmati 134. Cluster I had been comprised of
Basmati India, Kataribhog, Sakkorkhora, Basmati 1
and Basmati T3. Hybridization between the genotypes
of cluster I and cluster III by considering Basmati and
non-Basmati type will provide maximum heterosis
and will create a wide genetic variability.
Acknowledgement
The authors express their cordial thanks for financial
support by the SPGR sub-project of National
Agricultural Technology Project (NATP), phase-1,
Bangladesh Agricultural Research Council (BARC),
Farmgate, Dhaka entitled “Genetic enhancement of
local rice germplasm towards aromatic hybrid rice
variety development in Bangladesh.”The author
extends special thanks to Md. Zahidul Islam and Md.
Abu Syed, Scientific Officer, Bangladesh Rice
Research Institute (BRRI) for their sincere
cooperation, valuable suggestions and comments for
the improvement of the manuscript.
References
Anderson E. 1957. A Semigraphical method for the
analysis of complex problems. Proceedings of
National Academy of Science. Washington, United
States of America, 48, 923- 927.
Ghaderi A, Shisegar M, Rejai A, Ehdaie B. 1979.
Multivariate analysis of genetic diversity for yield and
its components in mungbean. Journal of the
American Society for Horticultural Science104, 728-
731.
Ghalain SS. 2006. Genetic divergence in rice (Oryza
sativa L.) genotypes grown in Kamaun Himalaya.
Indian Journal of Genetics and Plant Breeding 66,
37- 38.
Golam F, Hui Yin Y, Masitah A, Afnierna N,
Majid NA, Khalid N, Osman M. 2011. Analysis of
aroma and yield components of aromatic rice in
Malaysian trpoical environment. Australian Journal
of Crop Science 5, 1318- 1325.
Hien NL, Sarhadi WA, Hirata Y, Oikawa Y,
Hirata Y. 2007. Genetic diversity of morphological
responses and the relationships among Asia aromatic
rice (Oryza sativa L.) cultivars. Tropics 16, 343- 355.
Hooker JD. 1979. The flora of British India. vol. 2L.
Reeve Co. Kent, England, 25.
Hossain Z. 2008. Genetic diversity for morpho-
physiochemical characters and microsatellite DNA
markers in fine grain and aromatic landraces of rice
(Oryza sativa L.). PhD thesis, Bangabandhu Sheikh
Mujibur Rahman Agricultural University, Gazipur,
Bangladesh.
Islam MS. 2011. Characterization of aromatic rice
(Oryza sativa L.) germplasm through morphological,
biochemical and molecular techniques. PhD thesis,
Bangabandhu Sheikh Mujibur Rahman Agricultural
University, Gazipur, Bangladesh.

J. Bio. Env. Sci. 2016
208
Juliano BO, Duff D. 1991. Rice grain quality as an
emerging priority in National rice breeding
programmes. In: rice grain marketing and quality
issues. Los Banos, Laguna, IRRI, 55- 64.
Kovach MJ, Calingacion MN, Fitzgerald MA,
McCouch SR. 2009. The origin and evolution of
fragrance in rice (Oryza sativa L.). Proceedings of
National Academy of Sciences. United States of
America106, 14444- 14449.
Li X, Yan W, Agrama H, Hu B, Jia L, Jia M,
Jacks on A, Moldenhauer K, McClung A, Wu
D. 2010. Genotypic and phenotypic characterization
of genetic differentiation and diversity in the USDA
rice mini-core collection. Genetica 138, 1221- 1230.
http://dx.doi.org/10.1007/s10709-010-95215
Mathure S, Jawali N, Nadaf A. 2010. Diversity
analysis in selected non-basmati scented rice
collection (Oryza sativa L.). Rice Science 17, 35- 42.
http://dx.doi.org/10.1016/S1672-6308(08)60102-X.
Mathure S, Shaikh A, Renuka N, Wakte K,
Jawali N, Thengane R, Nadaf A. 2011.
Characterisation of aromatic rice (Oryza sativa L.)
germplasm and correlation between their agronomic
and quality traits. Euphytica 179, 237–246.
http://dx.doi.org/10.1007/s10681-010-0294-9.
Morishima H. 1984. Wild plant and demonstration
in biology of rice. Japan Scientific Society Press,
Tokyo, 3-30.
Naik D, Sao A, Sarawgi AK, Singh P. 2006.
Genetic divergence studies in some indigenous
scented rice (Oryza sativa L.) accessions of Central
India. Asian Journal of Plant Sciences 5, 197- 200.
Nayak AR, Reddy JN, Pattnaik AK. 2002.
Quality evaluation of some Thailand and Vietnam
scented rice. Indian Journal of Genetics and Plant
Breeding 15, 125- 127.
Parikh M, Motiramani NK, Pastogi NK,
Sharma B. 2012. Agro-Morphological
characterization and assessment of variability in
aromatic rice germplasm. Bangladesh Journal of
Agricultural Research 37, 1- 8.
Rao CR. 1952. Advance Statistical Methods in
Biometrical Research. A Division of Macmillan
Publishing Co., Inc. Hafner press. New York, United
States of America.
Ray A, Deb D, Ray R, Chattopadhayay B. 2013.
Phenotypic characters of rice landraces reveal
independent lineages of short-grain aromatic indica
rice. AoB Plants, 5, plt032.
http://dx.doi.org/10.1093/aobpla/plt03.2
Sarawgi AK, Parikh M, Sharma B. 2012.
Morphological and quality characterization of dubraj
group from aromatic rice germplasm of Chhattisgarh
and Madhya Pradesh. Vegetos- An International
Journal of Plant Research25, 387- 394.
Singh RK, Gautam PL, Saxena S, Singh S.
2000a. Scented rice germplasm: conservation,
valuation and utilization. In: Singh RK, Singh US,
Khush CS (eds) Aromatic rices. Kalyani publisher,
New Delhi, India, 107- 133.
Singh RK, Singh US, Khush GS, Rohilla R,
Singh JP, Singh G, Shekhar KS. 2000b. Small
and medium grained aromatic rices of India. In: RK
Singh, US Singh, CS Khush (eds) Aromatic rices.
Kalyani Publishers, New Delhi, India, 155- 177.