Morphological and chemical evidence for cyclic bone growth ...
21
Morphological and chemical evidence for cyclic bone growth in a fossil hyaena Journal: Journal of Analytical Atomic Spectrometry Manuscript ID JA-ART-09-2018-000314 Article Type: Paper Date Submitted by the Author: 26-Sep-2018 Complete List of Authors: Anné, Jennifer; University of Manchester, School of Earth and Environmental Sciences; The Children's Museum of Indianapolis, Collections Wogelius, Roy; University of Manchester, School of Earth and Environmental Sciences Edwards, Nicholas; SLAC National Accelerator Laboratory; University of Manchester, School of Earth and Environmental Sciences van Veelen, Arjen; University of Southampton Faculty of Engineering and the Environment Buckley, Michael; University of Manchester, School of Earth and Environmental Sciences Sellers, William; University of Manchester, School of Earth and Environmental Sciences Bergmann, Uwe; SLAC National Accelerator Laboratory Sokaras, Dimosthenis; SLAC National Accelorator Laboratory, Stanford Synchrotron Radiation Lightsource Mori, Roberto; Stanford Synchrotron Radiation Lightsource, SLAC National Accelorator Laboratory, Harvey, Virginia; University of Manchester School of Earth and Environmental Sciences Egerton, Victoria; University of Manchester, School of Earth and Environmental Sciences; The Children's Museum of Indianapolis Manning, Phillip; University of Manchester, School of Earth and Environmental Sciences Journal of Analytical Atomic Spectrometry
Transcript of Morphological and chemical evidence for cyclic bone growth ...
Morphological and chemical evidence for cyclic bone growth in a fossil hyaena
Journal: Journal of Analytical Atomic Spectrometry
Manuscript ID JA-ART-09-2018-000314
Article Type: Paper
Date Submitted by the Author: 26-Sep-2018
Complete List of Authors: Anné, Jennifer; University of Manchester, School of Earth and Environmental Sciences; The Children's Museum of Indianapolis, CollectionsWogelius, Roy; University of Manchester, School of Earth and Environmental SciencesEdwards, Nicholas; SLAC National Accelerator Laboratory; University of Manchester, School of Earth and Environmental Sciencesvan Veelen, Arjen; University of Southampton Faculty of Engineering and the EnvironmentBuckley, Michael; University of Manchester, School of Earth and Environmental SciencesSellers, William; University of Manchester, School of Earth and Environmental SciencesBergmann, Uwe; SLAC National Accelerator LaboratorySokaras, Dimosthenis; SLAC National Accelorator Laboratory, Stanford Synchrotron Radiation LightsourceMori, Roberto; Stanford Synchrotron Radiation Lightsource, SLAC National Accelorator Laboratory, Harvey, Virginia; University of Manchester School of Earth and Environmental SciencesEgerton, Victoria; University of Manchester, School of Earth and Environmental Sciences; The Children's Museum of IndianapolisManning, Phillip; University of Manchester, School of Earth and Environmental Sciences
Journal of Analytical Atomic Spectrometry
1
1 Morphological and chemical evidence for cyclic bone growth in a fossil hyaena
2
3 Jennifer Anné*1,2, Roy A. Wogelius1,3, Nicholas P. Edwards1,4, Arjen van Veelen2,5, Michael
4 Buckley1,William I. Sellers1, Uwe Bergmann4, Dimosthenis Sokaras4, Roberto Alonso-Mori4, Virginia L.
5 Harvey1, Victoria M. Egerton1,2, Phillip L. Manning1
6
7 1University of Manchester, School of Earth and Environmental Sciences, Interdisciplinary Centre for
8 Ancient Life, Manchester M13 9PL, UK
9 2The Children’s Museum of Indianapolis, Indianapolis, IN, 46206, USA
10 3University of Manchester, School of Earth and Environmental Sciences, Williamson Research Centre for
11 Molecular Environmental Science, Manchester M13 9PL, UK
12 4SLAC National Accelerator Laboratory, Menlo Park, CA, 94025, USA
13 5University of Southampton, Faculty of Engineering and the Environment, Southampton, SO17 1BJ, UK
14
15 * [email protected]
16
17 ABSTRACT
18 Trace element inventories are known to correlate with specific histological structures in bone, reflecting
19 organismal physiology and life histories. By studying trace elements in fossilised bone, particularly in
20 individuals with cyclic bone growth (alternating fast/slow bone deposition), we can improve our
21 understanding of the physiology of extinct organisms. In this study we present the first direct comparison
22 between optical histology (bone tissue identification) and synchrotron-based chemical mapping,
23 quantification, and characterisation of trace elements (biochemistry) within cyclic growth tissues, in this
24 case within bones of a cave hyaena (Crocuta crocuta spelaea). Results show distributions of zinc, an
25 element strongly associated with active ossification and bone growth, correlating with 1) fast-growing
26 tissue of zonal bone (cyclic growth) in an extinct hyaena and 2) secondary osteons (remodelling) in both
27 extant and extinct hyaena. Concentrations and coordination chemistry of zinc within the fossil sample are
28 comparable to those seen in extant bone suggesting that zinc is endogenous to the sample and that the
29 chemistry of bone growth has been preserved for 40 ka. These results demonstrate that the study of trace
30 elements as part of the histochemistry have wide utility for reconstructing growth, diet and other lifestyle
31 factors in archaeological and fossil bone.
32
33
Page 1 of 20 Journal of Analytical Atomic Spectrometry
123456789101112131415161718192021222324252627282930313233343536373839404142434445464748495051525354555657585960
2
34 INTRODUCTION
35 The physiology and life history of vertebrates are reflected in the microstructure of their skeletons
36 (histology). As most vertebrate remains are preserved solely as bones, these tissues can provide key
37 information on the physiology of extinct organisms such as metabolism and biological cycles. It is
38 through such studies that we are able to identify key changes in vertebrate physiology though time,
39 highlighting the adaptability of vertebrates to new and/or changing environments.
40
41 One of the physiological processes recorded in bone is the growth rate throughout an individual’s life,
42 which can be characterised by cyclic growth. These are fluctuations in bone depositional rates recognised
43 in histological sections as alternating bands, known as zonal tissues, which are indicative of slow and fast
44 growth1-7. It has previously been presumed that zonal bone is a characteristic of poikilothermic (slow
45 metabolism) physiology due to the association of homeotherms (fast metabolism) with uninterrupted high
46 rates of growth until maturity2-4. This paradigm has recently been challenged with the identification of
47 zonal bone in a wide range of fossil and extant mammalian and avian groups1-3,5-7. However, it is still
48 unclear how widespread zonal bone is within vertebrates, and thus what controls are placed on the
49 plasticity of bone growth. Zonal bone formation has been attributed to changes in food/water sources,
50 changes in temperature/thermoregulation, migration, sexual maturity and reproduction2,4,6. As stress
51 affects the biochemical signalling that controls the rate of bone deposition, it is likely that mediating
52 factors behind such signalling, such as compositional differences, may also be preserved within zonal
53 tissues.
54
55 In addition to changes in bone microstructure, changes in bone physiology can also be characterised
56 through trace element inventories. Previous studies have shown that the key trace elements for bone
57 physiology (most notably Cu, Zn and Sr) can be mapped within discrete histological features, which
58 correlate to specific physiological processes such as active ossification and remodelling8-15. The distinct
59 association with trace metals is a function of low concentrations (ppm) of organometallic compounds
60 necessary for bone development, health and function, and the catalysis of enzymatic processes. Thus trace
61 element inventories in bone can indicate the activity of physiological processes such as changes in bone
62 growth. As zonal bone represents alternating fast (zones) and slow (annuli) depositional tissues, the trace
63 element inventories associated with bone growth should reflect these changes in depositional rates.
64 Therefore, by comparing differences in chemical inventories between the two tissue types, we can gain a
65 better understanding of the physiological processes that control the switch between the two depositional
66 rates.
67
Page 2 of 20Journal of Analytical Atomic Spectrometry
123456789101112131415161718192021222324252627282930313233343536373839404142434445464748495051525354555657585960

3
68 Until recently, investigations into such chemical/histological correlations have not been attempted as
69 commonly available techniques are unable to resolve the discrete variations (ppm levels) in chemistry at
70 the necessary resolution (micron) and scale (decimetre). However, recent work using synchrotron-based
71 X-Ray Fluorescence (XRF) has demonstrated the ability to resolve the chemical variations associated
72 within fine scale histological features in extant and fossil bone8-13. Here we present the first histological
73 and trace element analyses of bones from extinct cave hyaena (Crocuta crocuta spelaea) and extant
74 spotted hyaena (Crocuta crocuta) to determine 1) whether cyclic growth can be correlated with
75 differential distributions of trace elements crucial for bone growth and 2) if these elements can be
76 preserved in fossilised tissues. Hyaenas were chosen based on the identification of zonal bone in other
77 Pleistocene mammals and in extant arctic carnivores, both of which experience extremely high seasonal
78 stress1-2,5. Cave hyaena are also very closely related to extant hyaena species (subspecies of spotted
79 hyaena), thus limiting the amount of change in physiology due to taxonomic separation distance.
80
81 METHODS
82 Specimens
83 Specimens consisted of four extant spotted hyaena (C. crocuta; ribs; fig. S1) consisting of both male
84 (AMNH 87769, 83593) and female (AMNH 114226, 114227) specimens, and three extinct cave hyaena
85 (C. c. spelaea; radius LL.20879, metacarpal LL.2200 and limb bone fragment P.3062; fig. S2). All extant
86 specimens are from the American Museum of Natural History, New York, NY. The fossil specimen
87 (P.3062) is from the Manchester Museum, Manchester, UK. Unfortunately, the same set of skeletal
88 elements could not be sampled for both extant and fossil specimens due to the fragmentary nature of the
89 fossil samples and the restrictions on destructive sampling of limb bones from extant material. Samples of
90 bone from extant hyaena represent individuals that had been wild caught as captive animals are less likely
91 to develop zonal tissue due to conditions provided in captivity (ex. zoo). Fossil material was obtained
92 from the Pin Hole (radius LL.20879 and metacarpal LL.2200; 37.8 ka) and Church Hole Caves (indent.
93 fragment P.3062; 26.84 to 24 ka), Creswell Crags, UK (fig.S3)16. Due to the fragmented nature of the
94 limb bone, faunal identification was confirmed using collagen fingerprinting (fig. S4)17.
95
96 Optical Histology
97 Thin sections were cut to a final thickness of ~25-50 µm. Sections were viewed using a Nikon ECLIPSE
98 E600 POL microscope and ACT-1 software and a Leica DM2700P microscope and Leica Application
99 Suite software under plain polarized and cross polarized light at 2x, 4x, and 10x magnifications. The billet
100 or ‘thick section’ left from the thin section was used for chemical analyses, with no further sample
101 preparation performed.
Page 3 of 20 Journal of Analytical Atomic Spectrometry
123456789101112131415161718192021222324252627282930313233343536373839404142434445464748495051525354555657585960
4
102
103 Synchrotron Analyses
104 Synchrotron Rapid Scanning X-Ray Fluorescence (SRS-XRF) was conducted at beamline 6-2 at the
105 Stanford Synchrotron Radiation Lightsource (SSRL; CA, USA). Detailed descriptions of SRS-XRF
106 mapping applied to fossils are provided in recent publications9,18-23 and are summarised here. Maps were
107 collected with an incident beam energy of either 13.5 keV (high-Z; Ca and higher) or 3.15 keV (low-Z; Ca
108 and lower). Specimens were mounted on an x-y-z stage and rastered relative to the fixed incident beam,
109 with a 50 µm (fossil specimen) or 25 µm (extant specimens) beam diameter (‘large-scale’). Areas of
110 interest in the fossil hyaena identified by SRS-XRF mapping were then mapped at higher spatial
111 resolution at the Diamond Light Source (DLS; Oxfordshire, UK), beamline I-18, using the experimental
112 setup of 8-9,19. Maps were made using 5.5 µm beam diameter produced via Kirkpatrick-Baez focusing
113 mirrors, with incident beam energy of 17 keV (chosen to allow excitation of the Sr Kɑ emission). X-ray
114 flux was 1010 - 1011 photons s-1 (‘microfocus’).
115
116 Single location energy dispersive spectra (EDS) were taken at both synchrotrons to quantify elements in
117 discrete features (identified on elemental maps) by collecting a full EDS for 50 sec (SSRL) or 30 sec
118 (DLS). Multiple spectra were taken per area of interest to account for heterogeneity within the sample.
119 Spectra were fitted using PyMCA software (ex. fig. S5)24. A Durango apatite mineral standard of known
120 element concentrations was used for calibration.
121
122 Zinc Extended X-ray Absorption Fine Structure spectroscopy (EXAFS) was performed at DLS beamline
123 I-18 to k space =12. The Zn K-edge was calibrated using a Zn-foil. Background subtraction, data
124 normalization and fitting were performed using (d) Athena and (d) Artemis25. Spectra were compared to
125 extant mammal bone and Zn-Hydroxyapatite (HAP) references26.
126
127 RESULTS
128 Optical Histology
129 Optical histology of the extant C. crocuta ribs shows a combination of densely packed secondary osteons
130 (‘2º’; fig. 1) and areas of woven tissue running through the specimen into the cancellous struts (‘W’; fig.
131 1). No apparent differences between male (AMNH 187769 and 83593) and female (AMNH 114226 and
132 114227) specimens were observed.
133
134 Optical histology of the extinct C. c. spelaea radius and metacarpal (LL.20879 and LL.2200) revealed
135 similar histological patterns as the extant material, with a mixture of woven bone (‘W’; fig. 2A, F) and
Page 4 of 20Journal of Analytical Atomic Spectrometry
123456789101112131415161718192021222324252627282930313233343536373839404142434445464748495051525354555657585960
5
136 secondary osteons (‘2º’; fig. 2A-B). Additional histological features include primary (‘1º’; fig. 2D) and
137 drifting (‘D’; fig. 2E) osteons (osteon running both longitudinally and transversely through cortex). The
138 radius also shows fabric that is oriented obliquely to the more remodelled internal bone tissue situated
139 around the outer cortex (fig.2 C). The fossil limb bone fragment (P.3062) shows zonal bone growth, seen
140 as alternating bands of fast-growth (zones) and slow-growth (annuli) fibrolamellar tissues (brackets; fig.
141 2G-H). Zones are identified by elongated osteons with large canal openings aligned in a ‘ring’ following
142 the circumference of the bone section (‘Z’; fig. 2H). Annuli are identified by tightly packed lamellar bone
143 forming another ‘ring’ (‘A’; fig. 2H). Thus, zones are identified as areas of bone tissue that are
144 significantly more vascularised than annuli. A series of secondary osteons is seen in two isolated
145 locations, with the osteons overprinting the original cortex through the entire cortical thickness (‘2º’; fig.
146 2I).
147
148 SR-XRF
149 XRF large-scale mapping (decimetre scale) shows Zn to be concentrated within secondary osteons (arrow
150 and inset; fig. 3). Differences in the elemental inventories between male and female are seen in Ca, Mn
151 and As, with higher concentrations seen in female specimens (fig. 3; Table 1; Table S1). No other
152 elements could be correlated with specific histological features or tissue types.
153
154 Large-scale (centimetre) and microfocus elemental maps of the extinct C. c. spelaea limb bone fragment
155 (P.3062) are presented in figure 4. Elemental maps of Zn revealed a pattern of relative high and low Zn
156 banding (arrow; fig. 4C). These bands were shown to correlate with the cyclic bands of zones and annuli,
157 with higher concentrations in zones (‘Z’; fig. 4D). As in extant hyaena, Zn was also found to be
158 associated with secondary osteons (circle; fig. 4D). Arsenic is elevated within the medullary cavity and a
159 section of the cortical bone not associated with the zones (fig. 4E), and is present within the primary bone
160 tissue, but not within secondary osteons (fig. 4F; circle). Fe is elevated within the medullary cavity (fig.
161 4G) and areas of mineral infill (fig. 4H; arrows). Sr is slightly elevated within the cement rings of the
162 osteon (fig. 4I; circle).
163
164 Trace element concentrations from the fossil limb bone fragment (P.3062) are within the range known for
165 extant material8-10, 27, with slight depletion in Ca and enrichment in Fe and Sr (Table 1). Elevated areas of
166 Zn are approximately double the concentration of “low” Zn areas. Concentrations from non-elevated
167 areas are comparable to cortical bone concentrations from extant material scanned in this study (Table 1).
168
Page 5 of 20 Journal of Analytical Atomic Spectrometry
123456789101112131415161718192021222324252627282930313233343536373839404142434445464748495051525354555657585960
6
169 Spectroscopy
170 X-ray absorption spectroscopy was performed to determine the coordination chemistry Zn within the
171 bones in order to investigate whether the Zn could be derived from the original biochemistry of the
172 organisms or if it had been replaced through taphonomic processes. Zn EXAFS of P.3062 revealed a
173 tetrahedral coordination with four-O atoms at a distance of 1.95 Å (Table 2). This coordination and
174 spacing is comparable to modern tissues (fig. 5; Table 2), and Zn-HAP with concentrations of Zn
175 comparable to modern bone (200-400 ppm), suggesting Zn was precipitated into the tissue during growth
176 and is not surface contamination.
177
178 DISCUSSION
179 The combination of optical and chemical histological analyses revealed Zn to be correlated within the fast
180 growth tissues (zones) of zonal bone within an extinct cave hyaena (C. c. spelaea) limb fragment (P.3062;
181 fig. 4C-D) and within areas of active remodelling in extant hyaena (C. crocuta; fig. 2) and cave hyaena
182 (fig. 4C-D). This observation fits with previous studies showing that enhanced Zn concentrations can be
183 found within areas of active ossification and bone growth 8-11, 13-15, and that Zn is stable within the apatite
184 structure of bone for extended periods of geologic time8-9, 12, 27.
185
186 This study reports the first case of zonal tissue within the Hyaenidae, both extant and fossil. The series of
187 alternating high and low vascularity is interpreted as zonal tissue based on the regular deposition over a
188 large area of the external cortex, which suggests deposition over time. It is not possible to state that each
189 pair of zones/annuli correlates to one year of growth as there are numerous potential physiological and
190 environmental factors that could also result in this alternating deposition (as discussed in the
191 introduction). Intraskeletal variation could be one of the reasons for the lack of zonal tissue seen in the
192 other two fossil hyaena (radius and metatarsal). It is interesting to note that the fossil hyaena displaying
193 cyclic growth is from a stadial (colder phase; ~25 ka) of the last ice age, whereas the specimens without
194 annualar zones are from an interstadial (warmer phase; ~38 ka)28. Future work is needed to test the
195 hypothesis of whether extreme seasonal differences may have caused the differences observed between
196 individuals.
197
198 Concentrations of Zn follow the pattern of zones and annuli, with higher concentrations correlating to
199 zones (high rates of bone deposition). The correlation between high Zn and increased bone deposition fits
200 within previous observations that Zn is important in areas of active growth such as around growth plates
201 and within osteons8,10,13-15. Zn levels within the zones of the fossil limb fragment (P.3062) are higher than
202 the average concentrations measured in extant hyaena in this study, but are within the range seen in other
Page 6 of 20Journal of Analytical Atomic Spectrometry
123456789101112131415161718192021222324252627282930313233343536373839404142434445464748495051525354555657585960
7
203 terrestrial carnivores and humans10, 27. The elevated regions within the zones are thin, and therefore the
204 average Zn concentration in the fossil bone will be closer to reported bulk Zn concentrations in unzoned
205 bone. EXAFS spectroscopy shows that the Zn is positively associated with fossil bone tissue, most
206 notably the fast-growth zonal tissues, strengthening the hypothesis that Zn is endogenous to the specimen
207 (fig. 5C-D).
208
209 Elemental mapping also revealed interesting distributions of As, Fe and Sr within the fossil limb bone
210 fragment (P.3062). Arsenic is associated with zonal tissue, though it is completely absent within osteons
211 (fig. 4E-F). In extant specimens, it is difficult to discern the origins of As given concentrations of As in
212 the extant bone samples are variable probably due to its occasional use as a preserving agent in museum
213 collections. Therefore we should not attempt to compare concentrations of As between the extant and
214 fossil specimens. Concentrations of Fe suggest some diagenetic input as Fe levels are slightly elevated
215 compared to extant bone (Fe 10-50 ppm; Goodwin et al., 2007; Table 1), but not as heavily elevated as
216 those seen in archaeological/fossil specimens (Fe 500-60,000 ppm)29-30. Sr distributions show lower
217 concentrations of Sr within secondary osteons compared to the surrounding tissue, with the exception of
218 the cement lines that form as the osteon is filled in by separate layers of lamellar bone (fig. 4I).
219 Concentrations of Sr are between expected levels for extant terrestrial carnivores27 and recent
220 archaeological samples (less than 1,000 years old)11,29 suggesting little to no diagenetic input.
221
222 CONCLUSION
223 Correlation between histological features and chemical inventories strengthen the link between
224 morphology and physiological processes, generating a de novo approach to the study of extinct
225 organismal physiology. In this study, cyclic growth was correlated with differential distribution of Zn
226 between fast (zones) and slow (annuli) growing bone tissue in the limb fragment of an extinct cave
227 hyaena, C. c. spelaea (P.3062). The ability to resolve the subtle difference in biological chemistry
228 between bone tissue types was only possible using the multi-scale mapping capabilities of synchrotron
229 analyses. These results highlight the implications of using trace-element markers as a means for
230 improving the analysis of archaeological and fossil bone.
231
232 ACKNOWLEDGEMENTS
233 We thank the Stanford Synchrotron Radiation Lightsource (3959) and Diamond Light Source (SP9488),
234 the Manchester Museum (U.K), Academy of Natural Sciences of Drexel University (USA), American
235 Museum of Natural History (USA), all support staff at SSRL and Professor Andrew Chamberlain for his
236 invaluable advice
Page 7 of 20 Journal of Analytical Atomic Spectrometry
123456789101112131415161718192021222324252627282930313233343536373839404142434445464748495051525354555657585960
8
237
238 FUNDING
239 All authors acknowledge financial support from NERC (NE/J023426/1), the Royal Society (UF120473),
240 the Jurassic Foundation (awarded JA), and the University of Manchester Dean’s Award Fund (awarded
241 JA). PLM thanks the Science and Technology Facilities Council for their support (ST/M001814/1).
242
243 AUTHOR CONTRIBUTIONS
244 All authors contributed in the synchrotron analysis and commented on the manuscript. JA, RAW and
245 PLM designed the experiment. JA performed the optical histological analysis, processed the synchrotron
246 data, wrote the manuscript and composed the figures. AvV processed and fit the EXAFS data, and
247 composed figure 5 and table 2. MB conducted the proteomics analyses (Supp. Material).
Page 8 of 20Journal of Analytical Atomic Spectrometry
123456789101112131415161718192021222324252627282930313233343536373839404142434445464748495051525354555657585960
9
248 REFERENCES
249 1. Köhler, M., Marin-Moratalla, N., Jordana, X. and Aanes, R. Seasonal bone growth and
250 physiology in endotherms shed light on dinosaur physiology. Nature. 2012; 487: 358-361.
251 doi:10.1038/nature11264.
252 2. Chinsamy-Turan, A. Forerunners of Mammals: Radiation Histology Biology (Life of the Past).
253 Bloomington: Indiana University Press. 2011.
254 3. Köhler, M. and Moyà-Solà, S. Physiological and life history strategies of a fossil large mammal
255 in a resource-limited environment. P Natl. Acad. Sci. USA. 2009; 106(48): 20354–58.
256 4. Castanet, J. Time recording in bone microstructures of endothermic animals; functional
257 relationships. C. R. Palevol. 2006; 5: 629-636.
258 5. Chinsamy-Turan, A. The Microstructure of Dinosaur Bone: Deciphering Biology with Fine-scale
259 Techniques. Baltimore: The Johns Hopkins University Press. 2005.
260 6. Chinsamy, A. and Dodson, P. Inside a dinosaur bone. Am. Sci. 1995; 83: 174-180.
261 7. Kolb, C., Scheyer, T.M., Veitschegger, K., Forasiepi, A.M., Amson, E., Van der Geer, A.A.E., et
262 al. Mammalian bone palaeohistology: a survey and new data with emphasis on island forms.
263 PeerJ. 2015; 3: e1358.
264 8. Anné, J, Wogelius, R.A., Edwards, N.P., van Veelen, A., Ignatyev, K. and Manning, P.L.
265 Chemistry of bone remodelling preserved in extant and fossil Sirenia. Metallomics. 2016; 8(5):
266 508-513. doi: 10.1039/C5MT00311C.
267 9. Anné, J., Edwards, N.P., Wogelius, R.A., Tumarkin-Deratzian, A.R., Seller, W.I., van Veelen, A.,
268 et al. Synchrotron imaging reveals bone healing and remodelling strategies in extinct and extant
269 vertebrates. J. R. Soc. Interface. 2014; 11(96): 20140277–20140277.
270 10. Pemmer, B., Roschger, A., Wastl, A., Hofstaetter, J.G., Wobrauschek, P., Simon, R., et al. Spatial
271 distribution of the trace elements zinc, strontium, and lead in human bone tissue. Bone; 2013; 57:
272 184-193.
273 11. Swanston, T., Varney, T., Coulthard, I., Feng, R., Bewer, B., Murphy, R., et al. Element
274 localization in archaeological bone using synchrotron radiation x-ray fluorescence: Identification
275 of biogenic uptake. J. Archaeol. Sci. 2012; 39(7): 2409–13. doi:10.1016/j.jas.2012.01.041
276 12. Kuczumow, A., Cukrowska, E., Stachniuk, A. , Gawęda, R., Mroczka, R. Paszkowicz, W., et al.
277 Investigation of chemical changes in bone material from South African fossil hominid deposits. J.
278 Archaeol. Sci. 2010; 37: 107–115
279 13. Molokwu, C.O. and Li, Y.V. Zinc homeostasis and bone mineral density. Ohio Res. Clin. Rev.
280 2006; 15: 7–15.
Page 9 of 20 Journal of Analytical Atomic Spectrometry
123456789101112131415161718192021222324252627282930313233343536373839404142434445464748495051525354555657585960
10
281 14. Hammond, G.L., Avvakumov, G.V. and Muller, Y.A. Structure/function analyses of human sex
282 hormone-binding globulin: Effects of zinc on steroid-binding specificity. J.Steroid Biochem.
283 2003; 85(2-5): 195–200. doi:10.1016/S0960-0760(03)00195-X.
284 15. Gomez, S., Rizzo, R., Pozzi-Mucelli, M., Bonucci, E. and Vittur, F. Zinc mapping in bone tissues
285 by histochemistry and synchrotron radiation-induced x-ray emission: Correlation with the
286 distribution of alkaline phosphates. Bone. 1999; 25(1): 33-38.
287 16. Hedges, R.E.M, Pettitt, P.B., Ramsey, C.B. and van Klinken, G.J. Radiocarbon dates from the
288 Oxford AMS system: Archaeometry datelist 22. Archaeometry. 1996; 38(2): 391-415.
289 17. van der Sluis, L.G., Hollund, H.I., Buckley, M., De Louwd, P.G.B., Rijsdijke, K.F., Kars, H.
290 Combining histology, stable isotope analysis and ZooMS collagen fingerprinting to investigate
291 the taphonomic history and dietary behaviour of extinct giant tortoises from the Mare aux Songes
292 deposit on Mauritius. Palaeogeogr. Palaeoclimatol. Palaeoecol. 2014; 416: 80-91.
293 18. Egerton V., Wogelius, R.A., Norell, M.A., Edwards, N.P., Sellers, W.I., Bergmann, U., et al. The
294 mapping and differentiation of biological and environmental elemental signatures in the fossil
295 remains of a 50 million year old bird. J. Anal. At. Spectrom. 2015; 30: 627-634.
296 doi: 10.1039/C4JA00395K
297 19. Edwards, N.P., Manning, P.L., Bergmann, U., Larson, P.L., van Dongen, B.E, Sellers, W.I, et al.
298 Leaf metallome preserved over 50 million years. Metallomics. 2014; 6(4): 774-782.
299 20. Manning, P.L., Edwards, N.P., Wogelius, R.A., Bergmann, U., Barden, H.E., Larson, P., et al.
300 Synchrotron-based chemical imaging reveals plumage patterns in a 150 million year old early
301 bird. J. Anal. At. Spectrom. 2013; 28(7): 1024-1030. doi:10.1039/c3ja50077b.
302 21. Edwards, N.P., Wogelius, R.A., Bergmann, U., Larson, P., Sellers, W.I. and Manning, P.L.
303 Mapping prehistoric ghosts in the synchrotron. Appl. Phys. A Mater. Sci. Process. 2013; 111(1):
304 147–155. doi:10.1007/s00339-012-7484-3.
305 22. Wogelius, R.A., Manning, P.L., Barden, H.E., Edwards, N.P., Webb, S.M., Sellers, W.I., et al.
306 Trace metals as biomarkers for eumelanin pigment in the fossil record. Science. 2011; 333(6049):
307 1622–1626. doi:10.1126/science.1205748.
308 23. Bergmann, U., Morton, R.W., Manning, P.L., Sellers, W.I., Farrar, S., Huntley, K.G., et al.
309 Archaeopteryx feathers and bone chemistry fully revealed via synchrotron imaging. Proc Natl
310 Acad Sci. 2010; 107(20): 9060-9065.
311 24. Solé, V.A., Papillon, E., Cotte, M., Walter, Ph. and Susini, J. A multiplatform code for the
312 analysis of energy-dispersive X-ray fluorescence spectra. Spectrochim. Acta B. 2007; 62(1): 63–
313 68. doi:10.1016/j.sab.2006.12.002.
Page 10 of 20Journal of Analytical Atomic Spectrometry
123456789101112131415161718192021222324252627282930313233343536373839404142434445464748495051525354555657585960
11
314 25. Ravel, B. and Newville, M. Athena, Artemis, Hephaestus: Data Analysis for X-ray Absorption
315 Spectroscopy using IFEFFIT. J. Synchrotron Radiat. 2005; 12: 537-541. doi:
316 10.1107/S0909049505012719.
317 26. Tang, Y., Chappell, H.F., Dove, M.T., Reeder, R.J. and Lee, Y.J. Zinc incorporation into
318 hydroxylapatite. Biomaterials. 2009; 30(15): 2864–2872.
319 27. Sealy, J.C. and Sillen, A. Sr and Sr/Ca in marine and terrestrial foodwebs in the southwestern
320 cape, South Africa. J. Archaeol. Sci. 1988; 15: 425-438.
321 28. Rasmussen, S.O., Bigler, M., Blockley, S.P., Blunier, T., Buchardt, S.L., Clausenet, H.B. et al. A
322 stratigraphic framework for abrupt climatic changes during the Last Glacial period based on three
323 synchronized Greenland ice-core records: refining and extending the INTIMATE even
324 stratigraphy. Quat. Sci. Rev. 2014; 106: 14-28.
325 29. Carvalho M.L., Marques, A.F., Lima M.T. and Reus, U. Trace elements distribution and post-
326 mortem intake in human bones from middle age by total reflection X-Ray fluorescence.
327 Spectrochim. Acta B. 2004; 59(8): 1251-1257.
328 30. Goodwin, M.B., Grant, P.G., Bench, G. and Holroyd, P.A. Elemental composition and diagenetic
329 alteration of dinosaur bone: Distinguishing micron-scale spatial and composition heterogeneity
330 using PIXE. Palaeogeogr. Palaeoclimatol. Palaceoecol. 2007; 253: 358-476.
Page 11 of 20 Journal of Analytical Atomic Spectrometry
123456789101112131415161718192021222324252627282930313233343536373839404142434445464748495051525354555657585960
12
331 TABLE and TABLE CAPTIONS
C. crocuta (avg) C. c. spelaea FragmentMineral
Standard Male Female Annuli Zone
Ca 38.38%
(2.27%)
32.19%
(2.06%)
36.42%
(2.26%)
23.47%
(0.81%)
25.13%
(0.78%)
Mn - 2 (0.4) 133 (26) 56 (8) 145 (16)
Fe 902 (30) 37 (4) 51 (8) 136 (17) 175 (20)
Cu - 5 (1) 3 (1) 1 (0.2) 3 (0.5)
Zn 77 (3) 130 (9) 134 (10) 165 (16) 384 (31)
As 2185 (68) 11 (1) 389 (21) 9 (1) 3 (0.4)
Sr 1885 (47) - - 421 (23) 405 (20)
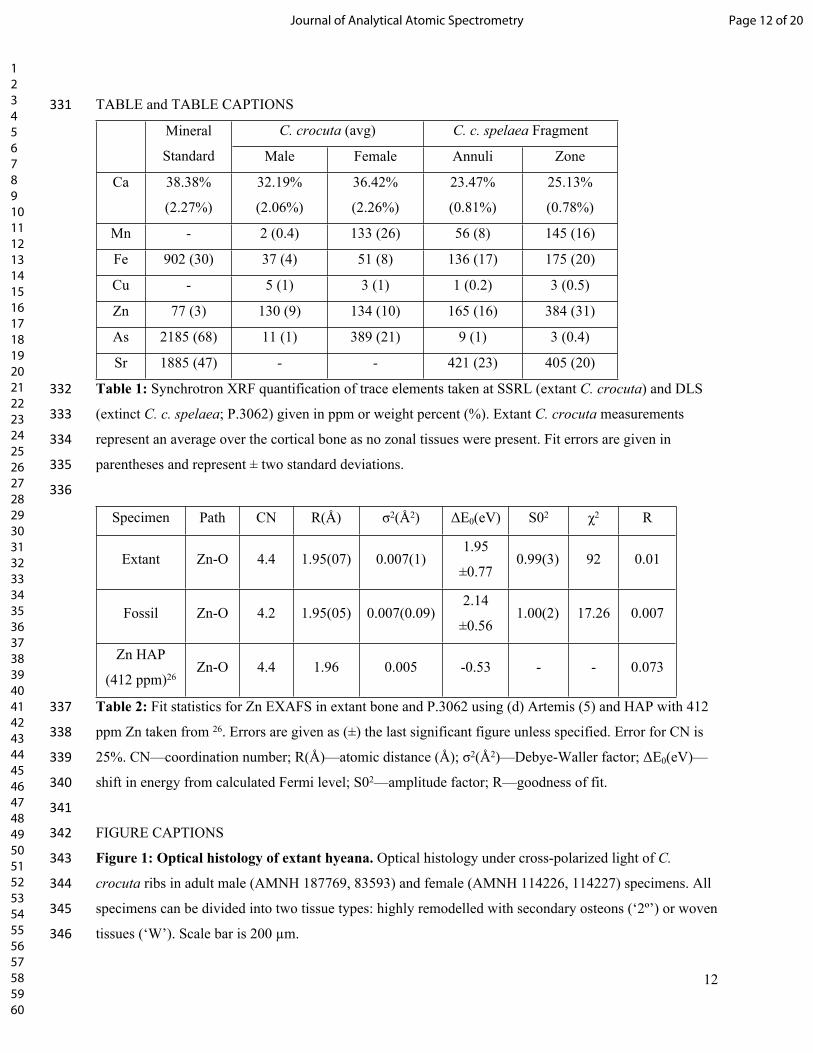
332 Table 1: Synchrotron XRF quantification of trace elements taken at SSRL (extant C. crocuta) and DLS
333 (extinct C. c. spelaea; P.3062) given in ppm or weight percent (%). Extant C. crocuta measurements
334 represent an average over the cortical bone as no zonal tissues were present. Fit errors are given in
335 parentheses and represent ± two standard deviations.
336
Specimen Path CN R(Å) σ2(Å2) ΔE0(eV) S02 χ2 R
Extant Zn-O 4.4 1.95(07) 0.007(1)1.95
±0.770.99(3) 92 0.01
Fossil Zn-O 4.2 1.95(05) 0.007(0.09)2.14
±0.561.00(2) 17.26 0.007
Zn HAP
(412 ppm)26Zn-O 4.4 1.96 0.005 -0.53 - - 0.073
337 Table 2: Fit statistics for Zn EXAFS in extant bone and P.3062 using (d) Artemis (5) and HAP with 412
338 ppm Zn taken from 26. Errors are given as (±) the last significant figure unless specified. Error for CN is
339 25%. CN—coordination number; R(Å)—atomic distance (Å); σ2(Å2)—Debye-Waller factor; ΔE0(eV)—
340 shift in energy from calculated Fermi level; S02—amplitude factor; R—goodness of fit.
341
342 FIGURE CAPTIONS
343 Figure 1: Optical histology of extant hyeana. Optical histology under cross-polarized light of C.
344 crocuta ribs in adult male (AMNH 187769, 83593) and female (AMNH 114226, 114227) specimens. All
345 specimens can be divided into two tissue types: highly remodelled with secondary osteons (‘2º’) or woven
346 tissues (‘W’). Scale bar is 200 µm.
Page 12 of 20Journal of Analytical Atomic Spectrometry
123456789101112131415161718192021222324252627282930313233343536373839404142434445464748495051525354555657585960
13
347
348 Figure 2: Optical histology for cave hyeana. Optical histology of the extinct cave hyaena, C. c. spelaea,
349 radius (LL.20879; A-C), metacarpal (LL.2200; D-F) and limb fragment (P.3062; G-I) under cross
350 polarized light. The radius consists of areas of secondary osteons (‘2º’; A-B) and woven bone (‘W’; A).
351 In some regions, the periosteal surface has a fabric that is oriented obliquely to the more remodelled
352 internal bone tissue (C). The metatarsus consists of dense primary osteons (‘1º’; D) and drifting osteons
353 (‘D’: E) interspersed with woven bone (‘W’; F). Zonal bone is recognized in the limb fragment (G-H)
354 with zones characterised by high porosity, with elongated osteons (‘Z’; H) and annuali characterised by
355 densely compact lamellar bone between annuali (‘A’; H). A mass of secondary osteons is present,
356 crossing perpendicular to the zones (‘2º’; I).
357
358 Figure 3: Elemental maps of extant hyaena. Optical large-scale (centimetre) elemental maps of Zn and
359 As in C. crocuta ribs (extant: male AMNH 87769, 83593; female AMNH 114226, 114227; fossil:
360 P.3062). Bright areas represent relatively higher concentrations (photon counts). The counts in each
361 elemental map are converted to 8 bit tiff images (scaled from 0 to 255) and thus is independently scaled
362 and does not represent relative intensities compared to another elemental map. In Zn, higher
363 concentrations (white) are associated with remodelling in secondary osteons (arrow and inset).
364 Concentrations of As are elevated in the two female samples (AMNH 114226, 114227), but is uniformly
365 distributed throughout the bone cross section. Scale bar is 1 cm.
366
367 Figure 4: Elemental maps of cave hyena specimen P.3062. Optical large-scale (centimetre) and
368 histological images (A,B) of C. c. spelaea limb fragment (P.3062) compared to large and fine scale
369 elemental maps of Zn (C,D), As (E,F), Fe (G,H) and Sr (I). Boxes on the large-scale images represent
370 areas of interest highlighted in microfocus. Large-scale elemental maps of Sr are unavailable due to not
371 being able to achieve the excitation energy for Sr on beamline 6-2 at SSRL. Bright areas represent
372 relatively higher concentrations (photon counts). The counts in each elemental map are converted to 8 bit
373 tiff images (scaled from 0 to 255) and thus is independently scaled and does not represent relative
374 intensities compared to another elemental map. Large-scale elemental mapping shows regular banding of
375 high/low Zn (arrow; C). Microfocus mapping shows these bands are correlated to the differences in zonal
376 tissue, with higher Zn concentration correlated to zones (‘Z’; D). Higher concentrations of Zn are also
377 seen in association with secondary osteons (circle; D). In the large image, As is seen to be concentrated
378 within the medullary cavity and a section of the cortical bone not associated with the Zn banding (E).
379 However, in microfocus imaging bands of As do correlate to the differences in zonal tissue, with higher
380 concentration correlated to zones (‘Z’; F). Arsenic is also anti-correlated with secondary osteons (circle;
Page 13 of 20 Journal of Analytical Atomic Spectrometry
123456789101112131415161718192021222324252627282930313233343536373839404142434445464748495051525354555657585960
14
381 F). Fe is mainly concentrated within the medullary cavity (G) and the mineral infill within osteon canals
382 (arrow; H). Sr is slightly depleted within secondary osteons, with the exception of elevated ‘rings’ seen in
383 the osteon highlighted (circle; I). Scale bar is 1cm for large-scale images and 1 mm for microfocus.
384
385 Figure 5: Zinc EXAFS. Comparison of the Zn EXAFS spectra from the fossil and extant bone in k (A)
386 and R-space (B) show Zn coordination is identical in the fossil and extant bone tissues.
Page 14 of 20Journal of Analytical Atomic Spectrometry
123456789101112131415161718192021222324252627282930313233343536373839404142434445464748495051525354555657585960
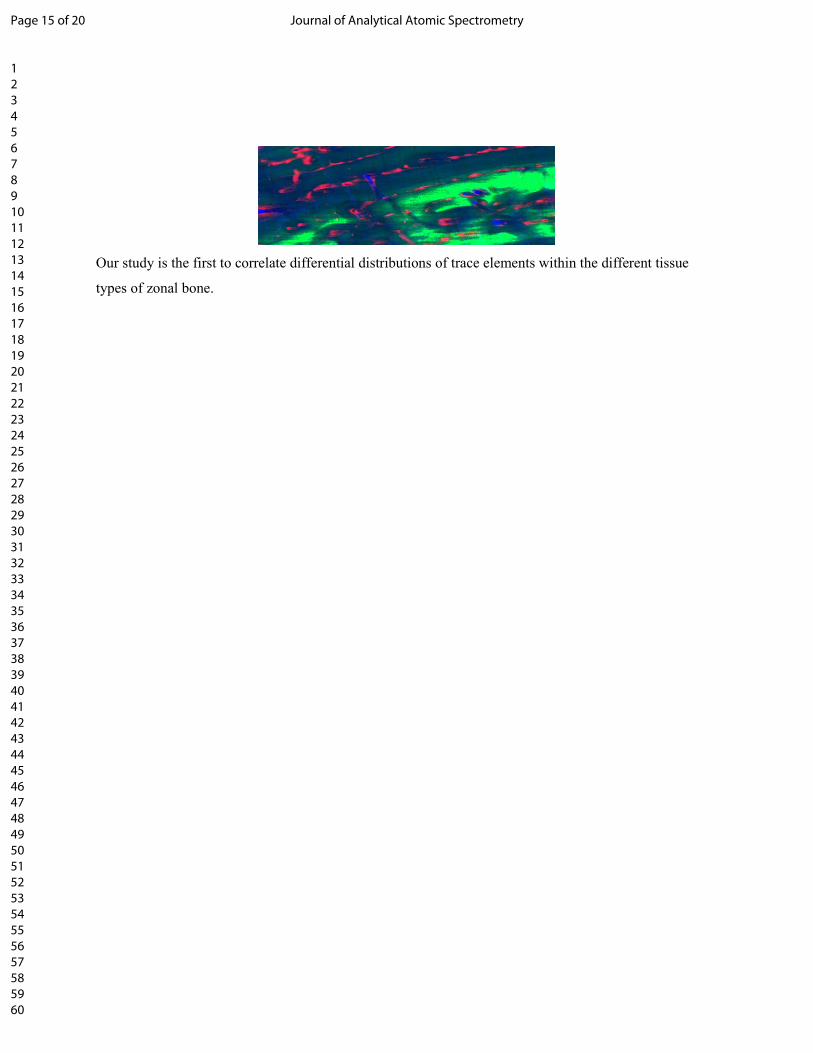
Our study is the first to correlate differential distributions of trace elements within the different tissue
types of zonal bone.
Page 15 of 20 Journal of Analytical Atomic Spectrometry
123456789101112131415161718192021222324252627282930313233343536373839404142434445464748495051525354555657585960
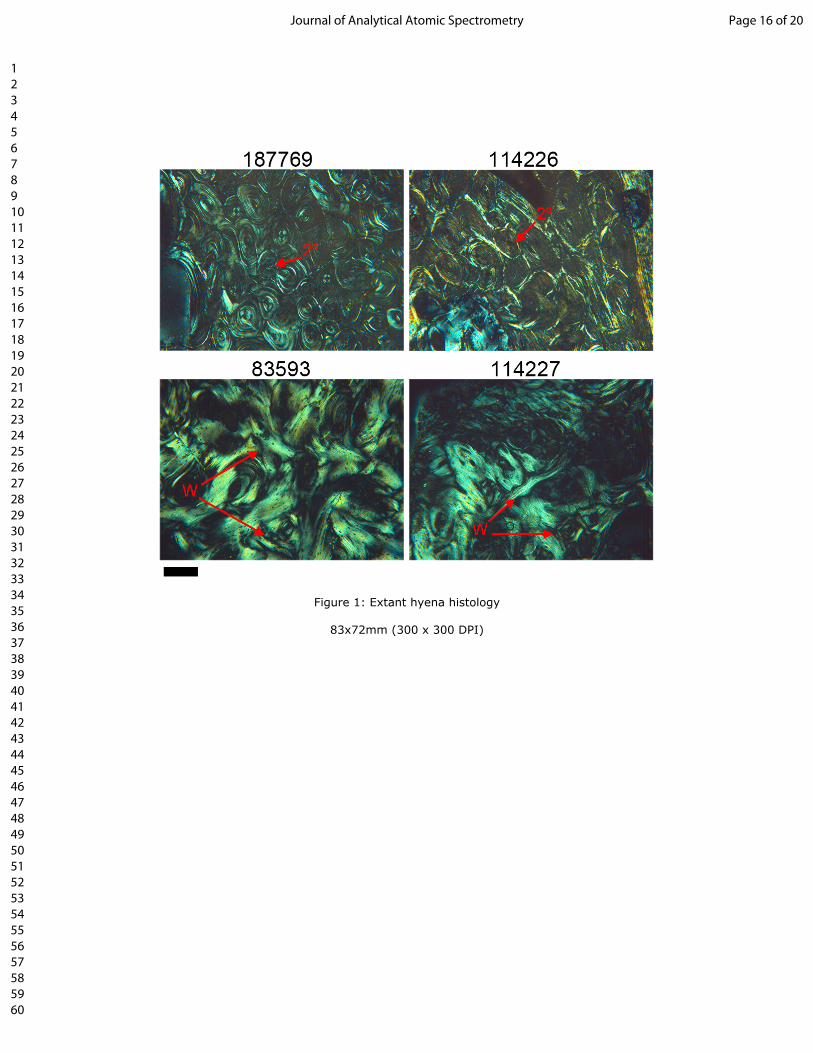
Figure 1: Extant hyena histology
83x72mm (300 x 300 DPI)
Page 16 of 20Journal of Analytical Atomic Spectrometry
123456789101112131415161718192021222324252627282930313233343536373839404142434445464748495051525354555657585960
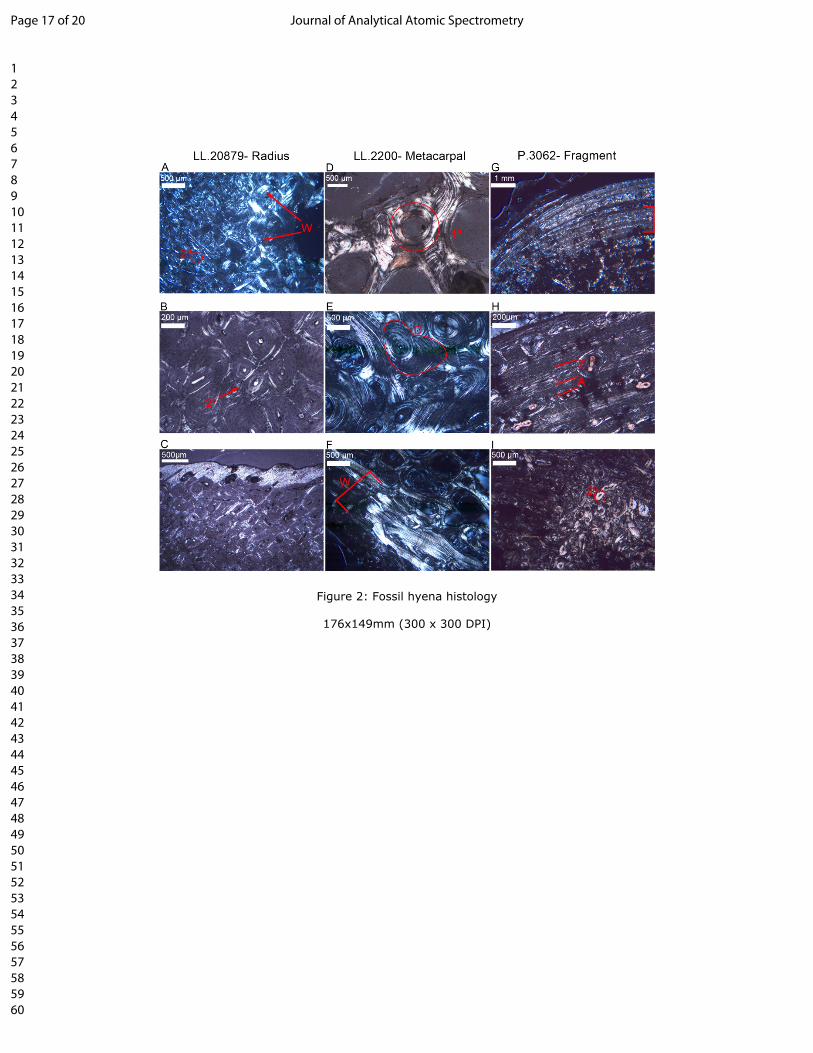
Figure 2: Fossil hyena histology
176x149mm (300 x 300 DPI)
Page 17 of 20 Journal of Analytical Atomic Spectrometry
123456789101112131415161718192021222324252627282930313233343536373839404142434445464748495051525354555657585960
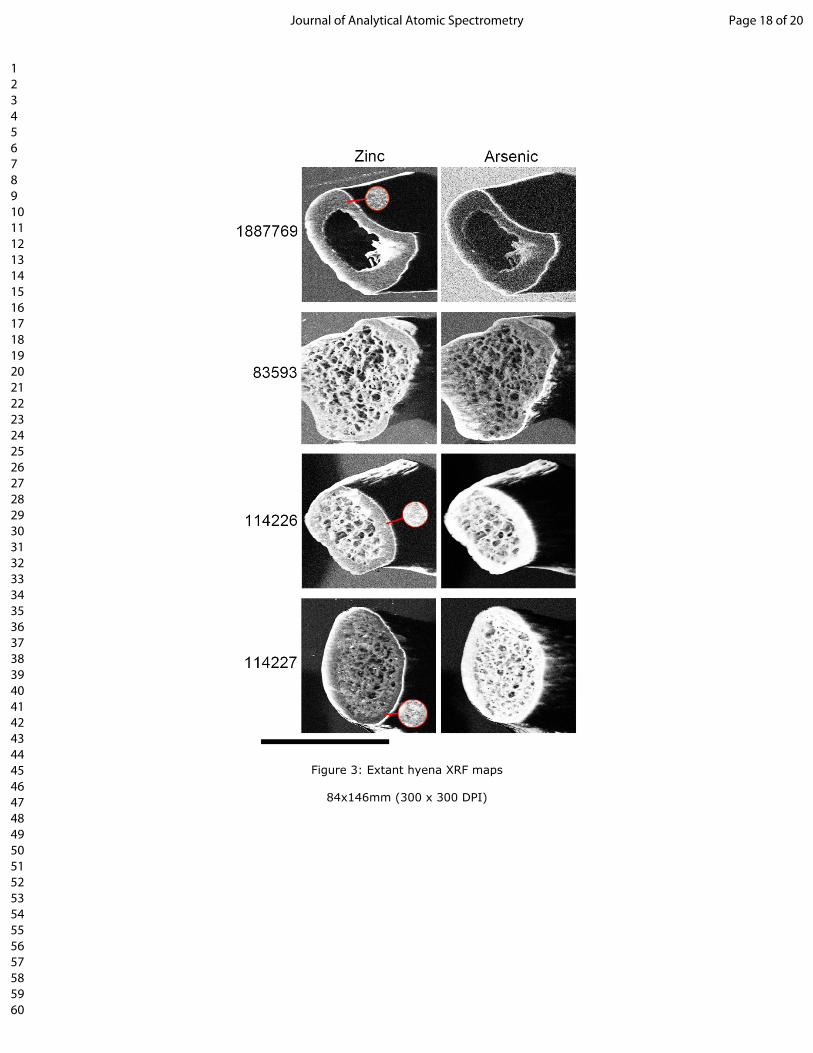
Figure 3: Extant hyena XRF maps
84x146mm (300 x 300 DPI)
Page 18 of 20Journal of Analytical Atomic Spectrometry
123456789101112131415161718192021222324252627282930313233343536373839404142434445464748495051525354555657585960
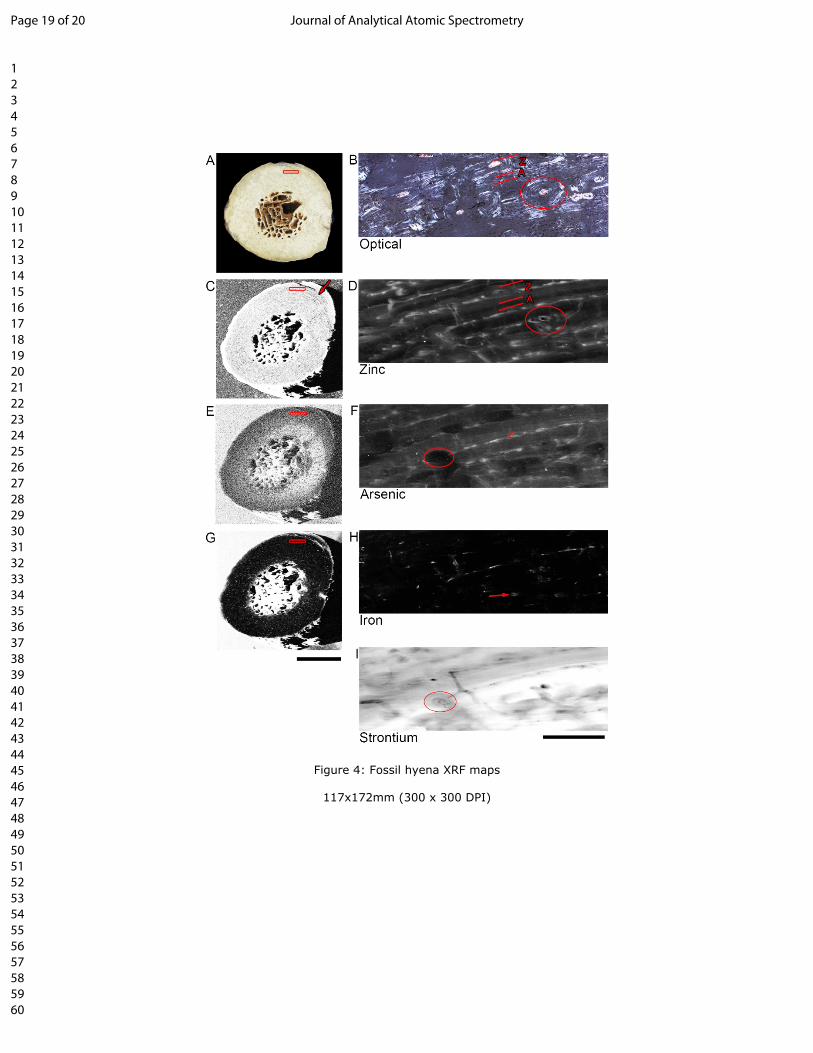
Figure 4: Fossil hyena XRF maps
117x172mm (300 x 300 DPI)
Page 19 of 20 Journal of Analytical Atomic Spectrometry
123456789101112131415161718192021222324252627282930313233343536373839404142434445464748495051525354555657585960
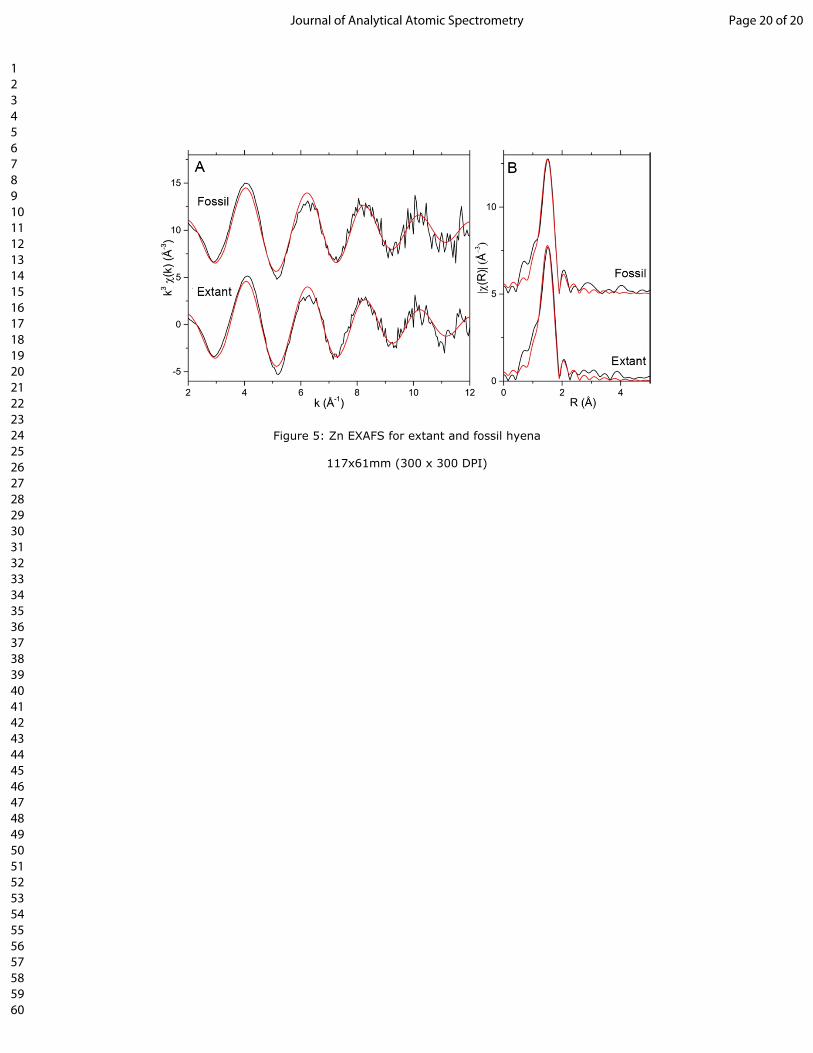
Figure 5: Zn EXAFS for extant and fossil hyena
117x61mm (300 x 300 DPI)
Page 20 of 20Journal of Analytical Atomic Spectrometry
123456789101112131415161718192021222324252627282930313233343536373839404142434445464748495051525354555657585960