Morbidity & Mortality - USRDS a functioning graft is the second leading cause of ... other causes...
18
It was a flight, a kind of fleeing, a kind of falling, falling higher and higher, spinning off the edge of the earth and beyond the sun and through the vast, silent vacuum where there were no burdens and where everything weighed exactly nothing. Tim O’Brien “The Things They Carried”
Transcript of Morbidity & Mortality - USRDS a functioning graft is the second leading cause of ... other causes...
It was a flight, a kind of fleeing, a kind of falling, falling higher and higher, spinning off the edge of the earth and beyond the sun and through the vast, silent vacuum where there were no burdens and where everything weighed exactly nothing.Tim O’Brien
“The Things They Carried”

Rover practices in the first year of hemodialysis that may affect early mortality. Throughout the ADR, and particularly in the Emerging Issues chapter, we examine some of these issues, in-cluding anemia correction, overshooting of tar-get hemoglobin levels, use of dialysis catheters, and use of IV iron and vitamin D.
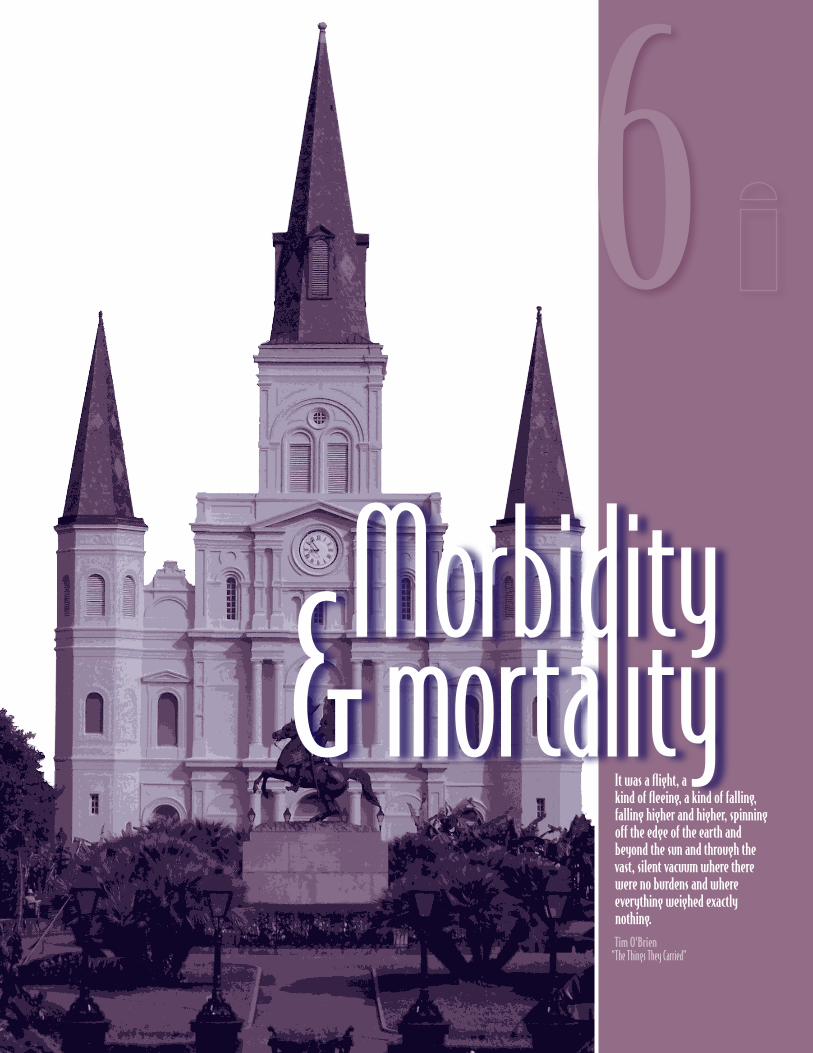
In this chapter we review incident- and preva-lent-based death rates as well as cause-specific rates, assessing trends and geographic patterns. As seen on the next page, interval mortality rates (adjusted for age, gender, race, and primary diag-nosis) are consistently down across all modalities and lengths of therapy, with the exception of first-year mortality in the hemodialysis population. Rates by month in the first year, presented in our Emerging Issues chapter, show similar findings. Even with more detailed adjustments for severity of disease, the first-year death rate for hemodial-ysis patients shows little change over the last nine years; rates for peritoneal dialysis patients have declined over the same period. Although the USRDS has begun the process of assessing this issue, considerable work is yet needed to under-stand the impact of such factors as high catheter use rates and early referral on first-year mortality.
In the peritoneal dialysis population, mortality rates have fallen consistently across patient vin-tages. Among transplant patients, first-year mor-tality rates have fallen dramatically over the last 24 years, but progress has been slower in the last five. Long-term survival of transplant patients is vulnerable to cardiovascular disease, and death
with a functioning graft is the second leading cause of graft failure behind graft rejection. Long-term care of the transplant population, particu-larly as related to cancer, cardiovascular disease, and diabetes care, is illustrated in Chapter Seven.
Overall hospital admission rates have altered little since 1993. Cause-specific rates, however, have changed dramatically. Since 1993, hospital-ization rates for infection have risen 19 percent for pneumonia, 29 percent for sepsis/bacteremia and 24 percent for cellulitis. Hospitalizations for bacteremia/septicemia show a cyclical trend over time, a finding which has received little attention. Rates for coronary revascularization procedures have doubled, with bypass procedures peaking in the late 1990s. Hospitalizations for vascular access procedures, in contrast, are down 34 per-cent, consistent with the growing use of outpa-tient interventions.
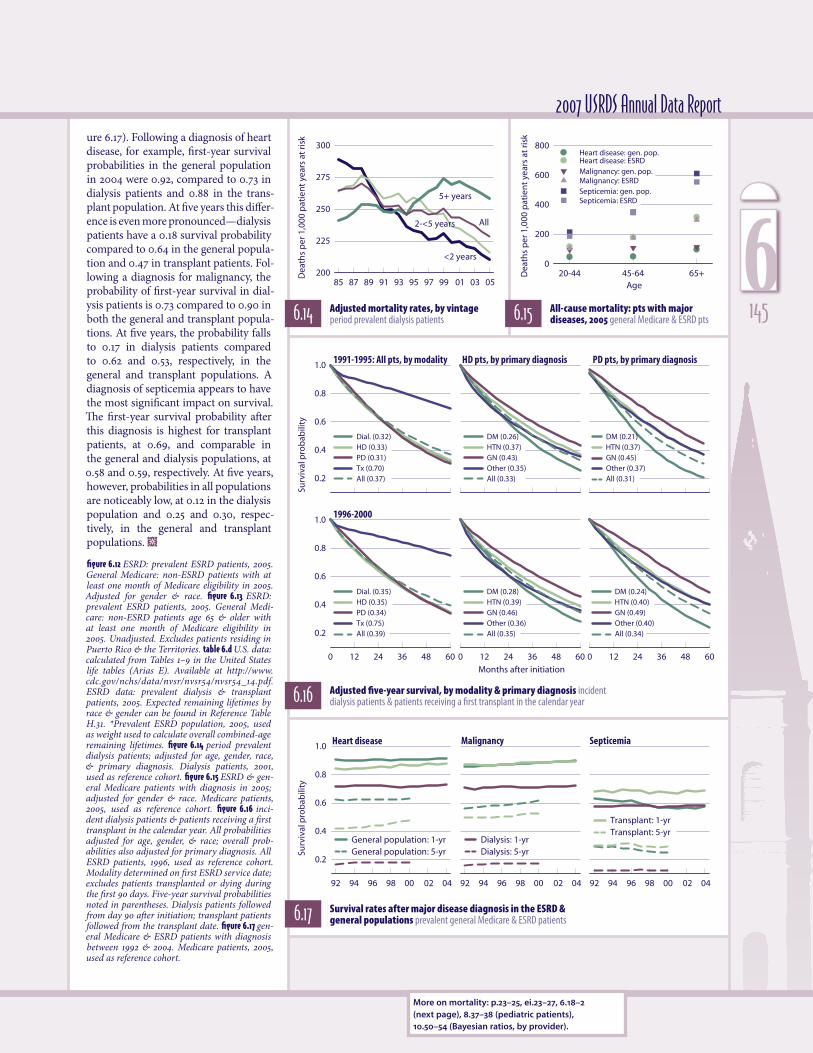
All-cause mortality differs quite dramatically in the ESRD, dialysis, transplant, and general Medicare populations. Rates for prevalent dialysis patients age 65 and older, for example, are nearly four times higher than those in the general pop-ulation. These rates—essentially flat during the mid-1990s—have been falling for the past four years across all patient vintages. And five-year survival rates improved approximately 10 percent between the 1991–1995 and 1996–2000 periods.
Figures on cause-specific mortality provide further detail on how mortality rates in the incident population have improved less than those among prevalent patients. Of note is the
Recent years have brought concern over the lack of progress in lowering death rates in the first year of hemodialysis. At the same time, interval mortality rates after the first year of ESRD therapy have been declining across all modalities. This disparity has raised questions
1386
growth in car-diovascular mortality dur-
ing the first three months of di-alysis—growth which peaked during the
mid-1990s. Rates of reported mortality at one year, in contrast, have remained unchanged since
1991. These data raise questions about recent reports of lower mortality among incident patients treated with IV vitamin D. As we discuss in the Emerging Issues chapter, a large increase in vitamin D use has been-concurrent with stable mortality in the first year.
This year we devote four pages to the disabled popu-lation, assessing the occurrence of blindness, amputa-tion, limb paresis/paralysis, and dementia. The latter accounts for a significant portion of reported disability, raising concerns as to its impact on patient care, liv-ing conditions, and cogni-tive function in this vul-nerable population. Data also illustrate the consider-able costs associated with disability, particularly with amputations and dementia.
We conclude with data on the impact of Hurricane Katrina among ESRD and general Medicare patients in affected areas. With flooding, loss of power, and transportation issues forcing many to leave their homes, outcomes in these patients have previously been unclear. Not unexpectedly, overall outpatient di-alysis treatments fell during the month of the storm, rebounding after patients settled into new treatment settings. Interestingly, monthly billings for ESAs were
m a i n t a i n e d , while those for IV iron and Vitamin D fell; this may reflect data access biases in that iron data is usually collected every three months, while hemoglo-bin levels are assessed weekly. Hospitalization, as ex-pected, spiked in the dialysis population, with patients needing hospital access for complications such as fluid overload and high potassium levels. This cohort of Katrina survivors will be followed by the USRDS, the ESRD networks, and CMS to determine how patient management can be improved when disasters affect the dialysis population.
Overall, then, hospitalization rates in dialysis pa-tients have stabilized, while mortality continues to
decline. Improvements in preventive care are most likely associated with fall-ing event rates, such as those for vascular access hospitalizations, and with progressively lower mor-tality in both the incident and prevalent popula-tions. These findings sug-gest that increased atten-tion to clinical practice guidelines may be having an impact on the morbid-ity and mortality of ESRD patients. Flat death rates in first-year hemodialysis patients, however, demand careful attention, as they
show a marked contrast to the improvements noted for other patient vintages. ½
figure 6.1 incident ESRD patients; adjusted for age, gender, race, & primary diagnosis. Incident ESRD patients, 1996, used as reference cohort.
80 84 88 92 96 00 04
175
225
275
325
1st year 2nd year 3rd year 4th year 5th year
All patients Hemodialysis
80 84 88 92 96 00 040
100
200
300
400
500Peritoneal dialysis
Dea
ths
per
1,0
00 p
t ye
ars
at ri
sk
Transplant
highlightscontentsoverall hospitalization 140 admissions & days rates, by vintage cause-spe-cific hospitalization 142 admissions, by age admissions, by modality & state overall mortality 144 mortality survival expected remaining lifetimes cause-specific mortality 146 mortality due to CVD, infection, & other causes disability in CKD & ESRD patients 148 blindness, amputation, limb paresis/paralysis, & dementia costs & mortality in patients with dis-abilities 150 yearly costs probability of death effects of Hurricane Katrina on outcomes 152 hospitalization & mortality hemoglobin levels
figure 6.1 Interval mortality rates (adjusted for age, gender, race, and primary diagnosis) are consistently down across all modalities and lengths of therapy, with the exception of first-year mortality in the hemodialysis population.� figure 6.14 From the early 1980s through the mid 1990s, dialysis patients of younger vintage had higher mortality rates than did those on dialysis five years or longer.� This trend began to change in 1994, and, as of 2005, rates for patients who have had ESRD for less than two years are 18 percent lower, at 210.�7 versus 258.�2 per 1,000 patient years.�
6.1 Mortality rates, by modality incident ESRD patients
1396
93 97 01 050
4
8
12
16
20
93 97 01 050.0
0.5
1.0
1.5
2.0
2.5Admits/pt year Hosp. days/pt yr
Transplant
PD
HDAll dialysis
94 96 98 00 02 04
Perc
ent
chan
ge
fro
m 1
993
-40
-20
0
20
40
60
Vascular access (HD only; -34.2%)
Pneumonia (2005: 19.3%)Bacteremia/septicemia (28.8%)Cellulitis (23.8%)
93 95 97 99 01 03 05
Ad
mis
sio
ns
per
1,0
00 p
atie
nt y
ears
0
25
50
75
100 aimecitpes/aimeretcaBainomuenP
93 95 97 99 01 03 050
25
50
75
100
125
93 95 97 99 01 03 050
10
20
30
40
93 95 97 99 01 03 050
50
100
150
200 )detaler sisylaid( noitcefnIsitilulleCPeritoneal dialysis: peritonitis
Hemodialysis:vascular access infection
Hemodialysis
Peritoneal dialysis
Transplant
Hemodialysis
Peritoneal dialysis
Transplant
Transplant
Hemodialysis
Peritoneal dialysis
White Af Am N Am Asian0-19 20-44 45-64 65-74 75+
All-cause
Cardiovascular
Infection
Vascular access (HD only)
Male Female DM HTN GN CK
sisongaid yramirPredneGllA Race
All
Perc
ent
chan
ge
in a
dm
issi
on
sp
er 1
00 p
atie
nt
year
s, 1
995
to 2
005
-45
-30
-15
0
15
30
45
60
75Age
2.23 + (2.47)1.99 to <2.231.78 to <1.99
1.56 to <1.78below 1.56 (1.40)
2.25 + (2.49)1.98 to <2.251.76 to <1.98
1.55 to <1.76below 1.55 (1.39)
2.15 + (2.24)1.99 to <2.151.81 to <1.99
1.58 to <1.81below 1.58 (1.34)
0.98 + (1.11)0.91 to <0.980.83 to <0.91
0.72 to <0.83below 0.72 (0.58)
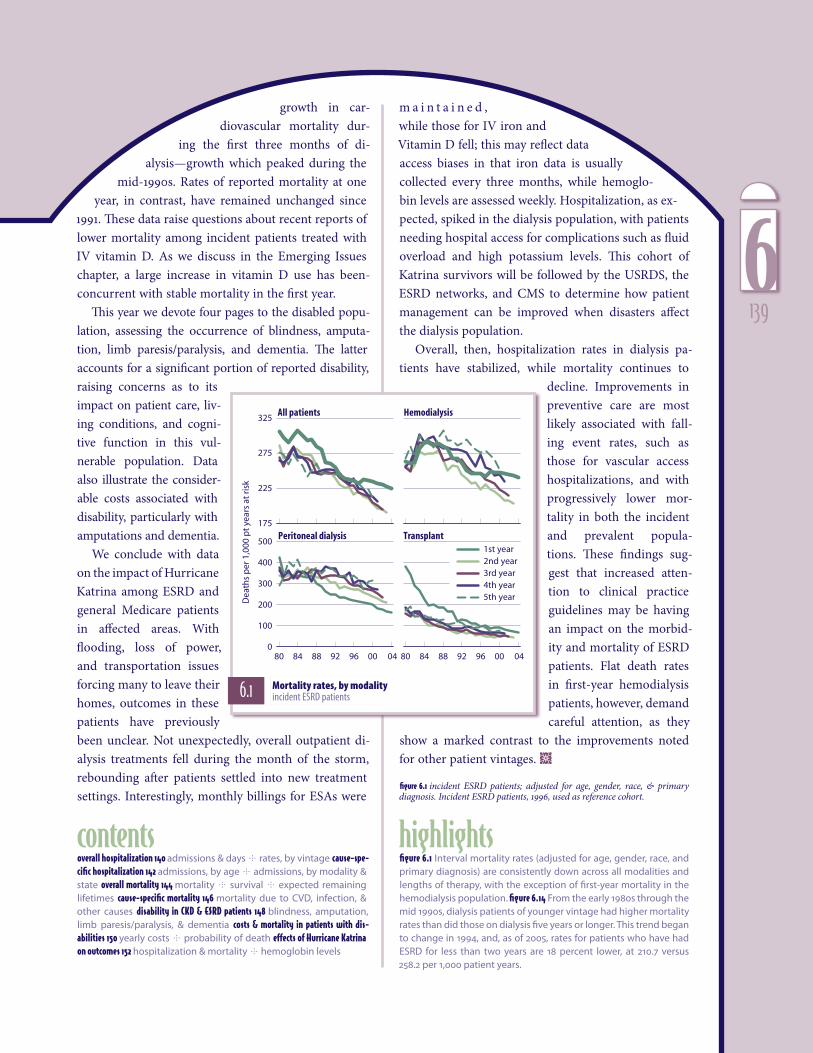
morbidity & mortalityoverall hospitalization
6.2 Adjusted admissions & days, by modality period prevalent ESRD patients
6.4 Geographic variations in hospital admissions per patient year, by modality & HSA/state period prevalent ESRD patients6.3 Change in hospital admissions since
1993 period prevalent dialysis patients
6.5 Adjusted admissions for principal diagnoses, by modality period prevalent ESRD patients
6.6 Percent change in hospitalization rates for prevalent dialysis patients, 1995–2005, by demographic characteristics & primary diagnosis period prevalent dialysis patients
All dialysis Hemodialysis
Peritoneal dialysis Transplant
6140
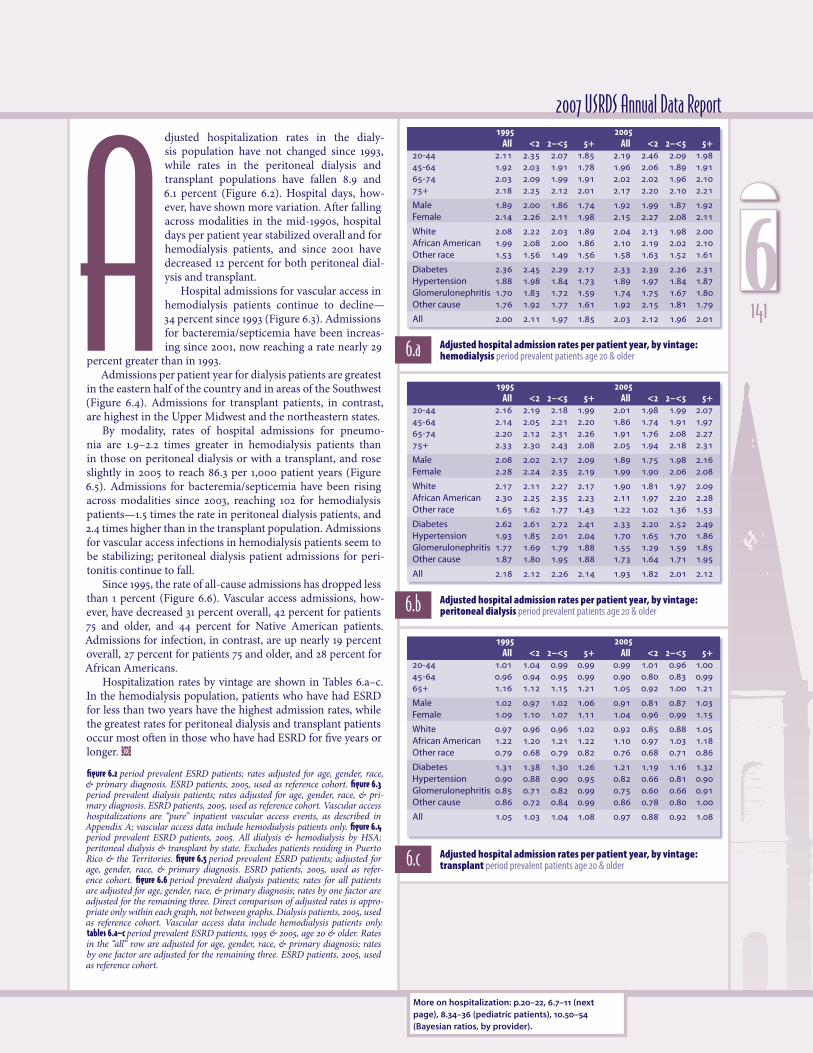
2007 USRDS Annual Data Reportdjusted hospitalization rates in the dialy-sis population have not changed since 1993, while rates in the peritoneal dialysis and transplant populations have fallen 8.9 and 6.1 percent (Figure 6.2). Hospital days, how-ever, have shown more variation. After falling across modalities in the mid-1990s, hospital days per patient year stabilized overall and for hemodialysis patients, and since 2001 have decreased 12 percent for both peritoneal dial-ysis and transplant.
Hospital admissions for vascular access in hemodialysis patients continue to decline—34 percent since 1993 (Figure 6.3). Admissions for bacteremia/septicemia have been increas-ing since 2001, now reaching a rate nearly 29
percent greater than in 1993.Admissions per patient year for dialysis patients are greatest
in the eastern half of the country and in areas of the Southwest (Figure 6.4). Admissions for transplant patients, in contrast, are highest in the Upper Midwest and the northeastern states.
By modality, rates of hospital admissions for pneumo-nia are 1.9–2.2 times greater in hemodialysis patients than in those on peritoneal dialysis or with a transplant, and rose slightly in 2005 to reach 86.3 per 1,000 patient years (Figure 6.5). Admissions for bacteremia/septicemia have been rising across modalities since 2003, reaching 102 for hemodialysis patients—1.5 times the rate in peritoneal dialysis patients, and 2.4 times higher than in the transplant population. Admissions for vascular access infections in hemodialysis patients seem to be stabilizing; peritoneal dialysis patient admissions for peri-tonitis continue to fall.
Since 1995, the rate of all-cause admissions has dropped less than 1 percent (Figure 6.6). Vascular access admissions, how-ever, have decreased 31 percent overall, 42 percent for patients 75 and older, and 44 percent for Native American patients. Admissions for infection, in contrast, are up nearly 19 percent overall, 27 percent for patients 75 and older, and 28 percent for African Americans.
Hospitalization rates by vintage are shown in Tables 6.a–c. In the hemodialysis population, patients who have had ESRD for less than two years have the highest admission rates, while the greatest rates for peritoneal dialysis and transplant patients occur most often in those who have had ESRD for five years or longer. ½
figure 6.2 period prevalent ESRD patients; rates adjusted for age, gender, race, & primary diagnosis. ESRD patients, 2005, used as reference cohort. figure 6.3 period prevalent dialysis patients; rates adjusted for age, gender, race, & pri-mary diagnosis. ESRD patients, 2005, used as reference cohort. Vascular access hospitalizations are “pure” inpatient vascular access events, as described in Appendix A; vascular access data include hemodialysis patients only. figure 6.4 period prevalent ESRD patients, 2005. All dialysis & hemodialysis by HSA; peritoneal dialysis & transplant by state. Excludes patients residing in Puerto Rico & the Territories. figure 6.5 period prevalent ESRD patients; adjusted for age, gender, race, & primary diagnosis. ESRD patients, 2005, used as refer-ence cohort. figure 6.6 period prevalent dialysis patients; rates for all patients are adjusted for age, gender, race, & primary diagnosis; rates by one factor are adjusted for the remaining three. Direct comparison of adjusted rates is appro-priate only within each graph, not between graphs. Dialysis patients, 2005, used as reference cohort. Vascular access data include hemodialysis patients only. tables 6.a–c period prevalent ESRD patients, 1995 & 2005, age 20 & older. Rates in the “all” row are adjusted for age, gender, race, & primary diagnosis; rates by one factor are adjusted for the remaining three. ESRD patients, 2005, used as reference cohort.
6.a Adjusted hospital admission rates per patient year, by vintage: hemodialysis period prevalent patients age 20 & older
6.b Adjusted hospital admission rates per patient year, by vintage: peritoneal dialysis period prevalent patients age 20 & older
6.c Adjusted hospital admission rates per patient year, by vintage: transplant period prevalent patients age 20 & older
1995 2005 All <2 2–<5 5+ All <2 2–<5 5+20-44 2.�11 2.�35 2.�07 1.�85 2.�19 2.�46 2.�09 1.�9845-64 1.�92 2.�03 1.�91 1.�78 1.�96 2.�06 1.�89 1.�9165-74 2.�03 2.�09 1.�99 1.�91 2.�02 2.�02 1.�96 2.�1075+ 2.�18 2.�25 2.�12 2.�01 2.�17 2.�20 2.�10 2.�21
Male 1.�89 2.�00 1.�86 1.�74 1.�92 1.�99 1.�87 1.�92Female 2.�14 2.�26 2.�11 1.�98 2.�15 2.�27 2.�08 2.�11
White 2.�08 2.�22 2.�03 1.�89 2.�04 2.�13 1.�98 2.�00African American 1.�99 2.�08 2.�00 1.�86 2.�10 2.�19 2.�02 2.�10Other race 1.�53 1.�56 1.�49 1.�56 1.�58 1.�63 1.�52 1.�61
Diabetes 2.�36 2.�45 2.�29 2.�17 2.�33 2.�39 2.�26 2.�31Hypertension 1.�88 1.�98 1.�84 1.�73 1.�89 1.�97 1.�84 1.�87Glomerulonephritis 1.�70 1.�83 1.�72 1.�59 1.�74 1.�75 1.�67 1.�80Other cause 1.�76 1.�92 1.�77 1.�61 1.�92 2.�15 1.�81 1.�79
All 2.�00 2.�11 1.�97 1.�85 2.�03 2.�12 1.�96 2.�01
More on hospitalization: p.20–22, 6.7–11 (next page), 8.34–36 (pediatric patients), 10.50–54 (Bayesian ratios, by provider).
1995 2005 All <2 2–<5 5+ All <2 2–<5 5+20-44 2.�16 2.�19 2.�18 1.�99 2.�01 1.�98 1.�99 2.�0745-64 2.�14 2.�05 2.�21 2.�20 1.�86 1.�74 1.�91 1.�9765-74 2.�20 2.�12 2.�31 2.�26 1.�91 1.�76 2.�08 2.�2775+ 2.�33 2.�30 2.�43 2.�08 2.�05 1.�94 2.�18 2.�31
Male 2.�08 2.�02 2.�17 2.�09 1.�89 1.�75 1.�98 2.�16Female 2.�28 2.�24 2.�35 2.�19 1.�99 1.�90 2.�06 2.�08
White 2.�17 2.�11 2.�27 2.�17 1.�90 1.�81 1.�97 2.�09African American 2.�30 2.�25 2.�35 2.�23 2.�11 1.�97 2.�20 2.�28Other race 1.�65 1.�62 1.�77 1.�43 1.�22 1.�02 1.�36 1.�53
Diabetes 2.�62 2.�61 2.�72 2.�41 2.�33 2.�20 2.�52 2.�49Hypertension 1.�93 1.�85 2.�01 2.�04 1.�70 1.�65 1.�70 1.�86Glomerulonephritis 1.�77 1.�69 1.�79 1.�88 1.�55 1.�29 1.�59 1.�85Other cause 1.�87 1.�80 1.�95 1.�88 1.�73 1.�64 1.�71 1.�95
All 2.�18 2.�12 2.�26 2.�14 1.�93 1.�82 2.�01 2.�12
1995 2005 All <2 2–<5 5+ All <2 2–<5 5+20-44 1.�01 1.�04 0.�99 0.�99 0.�99 1.�01 0.�96 1.�0045-64 0.�96 0.�94 0.�95 0.�99 0.�90 0.�80 0.�83 0.�9965+ 1.�16 1.�12 1.�15 1.�21 1.�05 0.�92 1.�00 1.�21
Male 1.�02 0.�97 1.�02 1.�06 0.�91 0.�81 0.�87 1.�03Female 1.�09 1.�10 1.�07 1.�11 1.�04 0.�96 0.�99 1.�15
White 0.�97 0.�96 0.�96 1.�02 0.�92 0.�85 0.�88 1.�05African American 1.�22 1.�20 1.�21 1.�22 1.�10 0.�97 1.�03 1.�18Other race 0.�79 0.�68 0.�79 0.�82 0.�76 0.�68 0.�71 0.�86
Diabetes 1.�31 1.�38 1.�30 1.�26 1.�21 1.�19 1.�16 1.�32Hypertension 0.�90 0.�88 0.�90 0.�95 0.�82 0.�66 0.�81 0.�90Glomerulonephritis 0.�85 0.�71 0.�82 0.�99 0.�75 0.�60 0.�66 0.�91Other cause 0.�86 0.�72 0.�84 0.�99 0.�86 0.�78 0.�80 1.�00
All 1.�05 1.�03 1.�04 1.�08 0.�97 0.�88 0.�92 1.�08
A 1416
93 95 97 99 01 01 05
Ad
mis
sio
ns
per
pat
ien
t yea
r at r
isk
1.8
2.0
2.2
2.4All hospitalizations
93 95 97 99 01 01 050.2
0.4
0.6
0.8
93 95 97 99 01 01 050.2
0.3
0.4
0.5
99 00 01 02 03 04 050.0
0.1
0.2
0.3Cardiovascular disease Infection (other than int. device) Infection due to internal device
20-4445-64
65-7475+
20-4445-64
65-7475+
20-4445-64
65-7475+
93 95 97 99 01 03 05Pro
ced
ure
s p
er 1
,000
pt y
ears
at
risk
0
15
30
45
60 All coronary revascularizations
93 95 97 99 01 03 050
15
30
45
60
93 95 97 99 01 03 050
5
10
15
20
97 99 01 03 050
10
20
30
40Angioplasty Bypass Coronary stents
93 95 97 99 01 03 05Plac
emen
ts p
er 1
,000
pat
ien
t ye
ars
at r
isk
0
300
600
900All vascular access placements
93 95 97 99 01 03 050
200
400
600
93 95 97 99 01 03 050
20
40
60
93 95 97 99 01 03 050
100
200
300Catheters GraftsFistulas
morbidity & mortalitycause-specific hospitalization
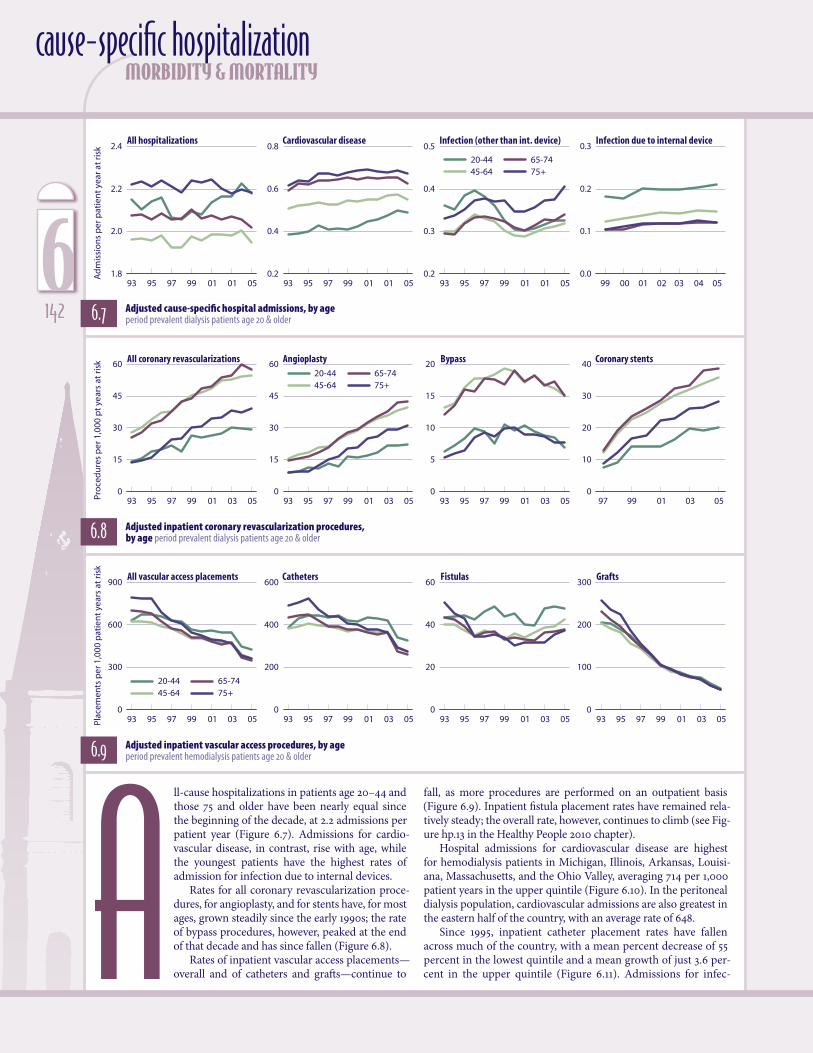
6.7 Adjusted cause-specific hospital admissions, by age period prevalent dialysis patients age 20 & older
ll-cause hospitalizations in patients age 20–44 and those 75 and older have been nearly equal since the beginning of the decade, at 2.2 admissions per patient year (Figure 6.7). Admissions for cardio-vascular disease, in contrast, rise with age, while the youngest patients have the highest rates of admission for infection due to internal devices.
Rates for all coronary revascularization proce-dures, for angioplasty, and for stents have, for most ages, grown steadily since the early 1990s; the rate of bypass procedures, however, peaked at the end of that decade and has since fallen (Figure 6.8).
Rates of inpatient vascular access placements—overall and of catheters and grafts—continue to
6.8 Adjusted inpatient coronary revascularization procedures, by age period prevalent dialysis patients age 20 & older
6.9 Adjusted inpatient vascular access procedures, by age period prevalent hemodialysis patients age 20 & older
fall, as more procedures are performed on an outpatient basis (Figure 6.9). Inpatient fistula placement rates have remained rela-tively steady; the overall rate, however, continues to climb (see Fig-ure hp.13 in the Healthy People 2010 chapter).
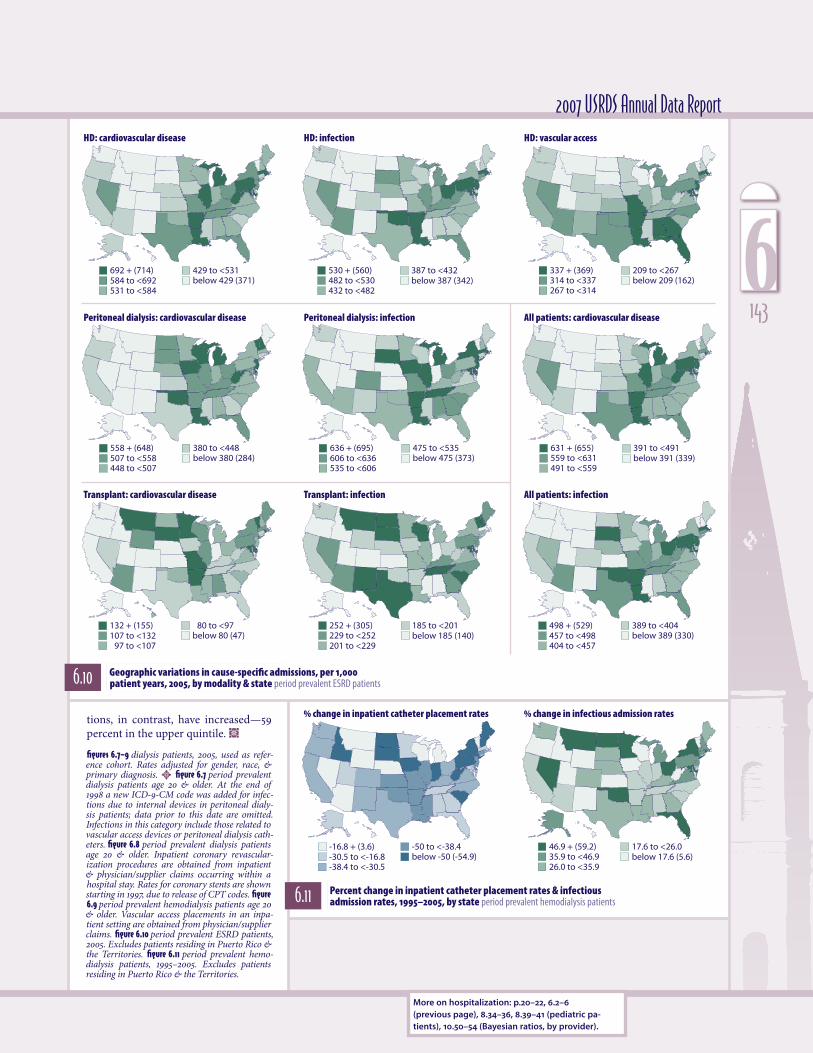
Hospital admissions for cardiovascular disease are highest for hemodialysis patients in Michigan, Illinois, Arkansas, Louisi-ana, Massachusetts, and the Ohio Valley, averaging 714 per 1,000 patient years in the upper quintile (Figure 6.10). In the peritoneal dialysis population, cardiovascular admissions are also greatest in the eastern half of the country, with an average rate of 648.
Since 1995, inpatient catheter placement rates have fallen across much of the country, with a mean percent decrease of 55 percent in the lowest quintile and a mean growth of just 3.6 per-cent in the upper quintile (Figure 6.11). Admissions for infec-A
6142
692 + (714)584 to <692531 to <584
429 to <531below 429 (371)
530 + (560)482 to <530432 to <482
387 to <432below 387 (342)
337 + (369)314 to <337267 to <314
209 to <267below 209 (162)
558 + (648)507 to <558448 to <507
380 to <448below 380 (284)
636 + (695)606 to <636535 to <606
475 to <535below 475 (373)
132 + (155)107 to <132
97 to <107
80 to <97below 80 (47)
252 + (305)229 to <252201 to <229
185 to <201below 185 (140)
631 + (655)559 to <631491 to <559
391 to <491below 391 (339)
498 + (529)457 to <498404 to <457
389 to <404below 389 (330)
46.9 + (59.2)35.9 to <46.926.0 to <35.9
17.6 to <26.0below 17.6 (5.6)
-16.8 + (3.6)-30.5 to <-16.8-38.4 to <-30.5
-50 to <-38.4below -50 (-54.9)
2007 USRDS Annual Data Report
6.10 Geographic variations in cause-specific admissions, per 1,000 patient years, 2005, by modality & state period prevalent ESRD patients
6.11 Percent change in inpatient catheter placement rates & infectious admission rates, 1995–2005, by state period prevalent hemodialysis patients
tions, in contrast, have increased—59 percent in the upper quintile. ½
figures 6.7–9 dialysis patients, 2005, used as refer-ence cohort. Rates adjusted for gender, race, & primary diagnosis. ½ figure 6.7 period prevalent dialysis patients age 20 & older. At the end of 1998 a new ICD-9-CM code was added for infec-tions due to internal devices in peritoneal dialy-sis patients; data prior to this date are omitted. Infections in this category include those related to vascular access devices or peritoneal dialysis cath-eters. figure 6.8 period prevalent dialysis patients age 20 & older. Inpatient coronary revascular-ization procedures are obtained from inpatient & physician/supplier claims occurring within a hospital stay. Rates for coronary stents are shown starting in 1997, due to release of CPT codes. figure 6.9 period prevalent hemodialysis patients age 20 & older. Vascular access placements in an inpa-tient setting are obtained from physician/supplier claims. figure 6.10 period prevalent ESRD patients, 2005. Excludes patients residing in Puerto Rico & the Territories. figure 6.11 period prevalent hemo-dialysis patients, 1995–2005. Excludes patients residing in Puerto Rico & the Territories.
More on hospitalization: p.20–22, 6.2–6 (previous page), 8.34–36, 8.39–41 (pediatric pa-tients), 10.50–54 (Bayesian ratios, by provider).
HD: cardiovascular disease HD: infection HD: vascular access
Peritoneal dialysis: cardiovascular disease Peritoneal dialysis: infection All patients: cardiovascular disease
Transplant: cardiovascular disease Transplant: infection All patients: infection
% change in inpatient catheter placement rates % change in infectious admission rates
1436
<20 20-44 45-64 65+Dea
ths
per
1,0
00 p
atie
nt
year
s at
ris
k
0
100
200
300
400ESRD Dialysis TransplantGeneral Medicare
190 + (202)176 to <190166 to <176
150 to <166below 150 (142)
261 + (279)245 to <261230 to <245
213 to <230below 213 (198)
35.9 + (38.1)33.8 to <35.932.4 to <33.8
31.2 to <32.4below 31.2 (30.2)
55.4 + (57.2)53.9 to <55.452.4 to <53.9
50.5 to <52.4below 50.5 (48.6)
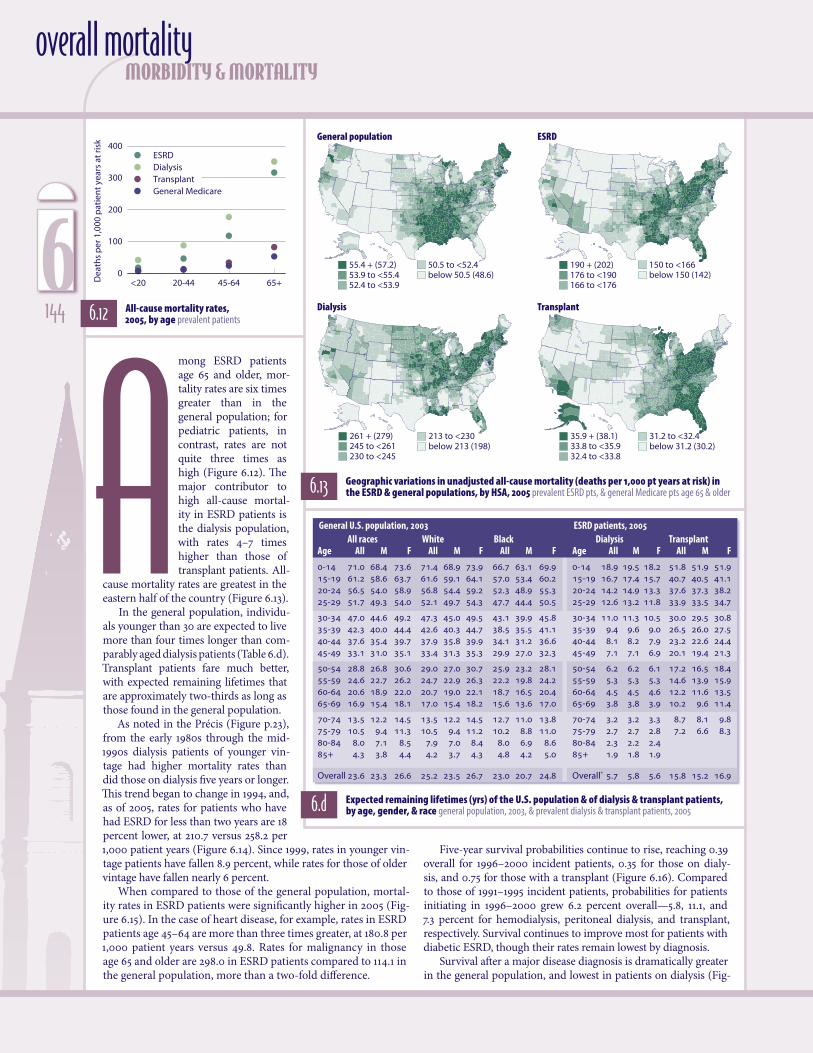
mong ESRD patients age 65 and older, mor-tality rates are six times greater than in the general population; for pediatric patients, in contrast, rates are not quite three times as high (Figure 6.12). The major contributor to high all-cause mortal-ity in ESRD patients is the dialysis population, with rates 4–7 times higher than those of transplant patients. All-
cause mortality rates are greatest in the eastern half of the country (Figure 6.13).
In the general population, individu-als younger than 30 are expected to live more than four times longer than com-parably aged dialysis patients (Table 6.d). Transplant patients fare much better, with expected remaining lifetimes that are approximately two-thirds as long as those found in the general population.
As noted in the Précis (Figure p.23), from the early 1980s through the mid-1990s dialysis patients of younger vin-tage had higher mortality rates than did those on dialysis five years or longer. This trend began to change in 1994, and, as of 2005, rates for patients who have had ESRD for less than two years are 18 percent lower, at 210.7 versus 258.2 per 1,000 patient years (Figure 6.14). Since 1999, rates in younger vin-tage patients have fallen 8.9 percent, while rates for those of older vintage have fallen nearly 6 percent.
When compared to those of the general population, mortal-ity rates in ESRD patients were significantly higher in 2005 (Fig-ure 6.15). In the case of heart disease, for example, rates in ESRD patients age 45–64 are more than three times greater, at 180.8 per 1,000 patient years versus 49.8. Rates for malignancy in those age 65 and older are 298.0 in ESRD patients compared to 114.1 in the general population, more than a two-fold difference.
morbidity & mortalityoverall mortality
6.12 All-cause mortality rates, 2005, by age prevalent patients
6.13 Geographic variations in unadjusted all-cause mortality (deaths per 1,000 pt years at risk) in the ESRD & general populations, by HSA, 2005 prevalent ESRD pts, & general Medicare pts age 65 & older
6.d Expected remaining lifetimes (yrs) of the U.S. population & of dialysis & transplant patients, by age, gender, & race general population, 2003, & prevalent dialysis & transplant patients, 2005
GeneralU.S.population,2003 Allraces White BlackAge All M F All M F All M F
0-14 71.�0 68.�4 73.�6 71.�4 68.�9 73.�9 66.�7 63.�1 69.�915-19 61.�2 58.�6 63.�7 61.�6 59.�1 64.�1 57.�0 53.�4 60.�220-24 56.�5 54.�0 58.�9 56.�8 54.�4 59.�2 52.�3 48.�9 55.�325-29 51.�7 49.�3 54.�0 52.�1 49.�7 54.�3 47.�7 44.�4 50.�5
30-34 47.�0 44.�6 49.�2 47.�3 45.�0 49.�5 43.�1 39.�9 45.�835-39 42.�3 40.�0 44.�4 42.�6 40.�3 44.�7 38.�5 35.�5 41.�140-44 37.�6 35.�4 39.�7 37.�9 35.�8 39.�9 34.�1 31.�2 36.�645-49 33.�1 31.�0 35.�1 33.�4 31.�3 35.�3 29.�9 27.�0 32.�3
50-54 28.�8 26.�8 30.�6 29.�0 27.�0 30.�7 25.�9 23.�2 28.�155-59 24.�6 22.�7 26.�2 24.�7 22.�9 26.�3 22.�2 19.�8 24.�260-64 20.�6 18.�9 22.�0 20.�7 19.�0 22.�1 18.�7 16.�5 20.�465-69 16.�9 15.�4 18.�1 17.�0 15.�4 18.�2 15.�6 13.�6 17.�0
70-74 13.�5 12.�2 14.�5 13.�5 12.�2 14.�5 12.�7 11.�0 13.�875-79 10.�5 9.�4 11.�3 10.�5 9.�4 11.�2 10.�2 8.�8 11.�080-84 8.�0 7.�1 8.�5 7.�9 7.�0 8.�4 8.�0 6.�9 8.�685+ 4.�3 3.�8 4.�4 4.�2 3.�7 4.�3 4.�8 4.�2 5.�0
Overall 23.�6 23.�3 26.�6 25.�2 23.�5 26.�7 23.�0 20.�7 24.�8
ESRDpatients,2005 Dialysis TransplantAge All M F All M F
0-14 18.�9 19.�5 18.�2 51.�8 51.�9 51.�915-19 16.�7 17.�4 15.�7 40.�7 40.�5 41.�120-24 14.�2 14.�9 13.�3 37.�6 37.�3 38.�225-29 12.�6 13.�2 11.�8 33.�9 33.�5 34.�7
30-34 11.�0 11.�3 10.�5 30.�0 29.�5 30.�835-39 9.�4 9.�6 9.�0 26.�5 26.�0 27.�540-44 8.�1 8.�2 7.�9 23.�2 22.�6 24.�445-49 7.�1 7.�1 6.�9 20.�1 19.�4 21.�3
50-54 6.�2 6.�2 6.�1 17.�2 16.�5 18.�455-59 5.�3 5.�3 5.�3 14.�6 13.�9 15.�960-64 4.�5 4.�5 4.�6 12.�2 11.�6 13.�565-69 3.�8 3.�8 3.�9 10.�2 9.�6 11.�4
70-74 3.�2 3.�2 3.�3 8.�7 8.�1 9.�875-79 2.�7 2.�7 2.�8 7.�2 6.�6 8.�380-84 2.�3 2.�2 2.�4 85+ 1.�9 1.�8 1.�9
Overall* 5.�7 5.�8 5.�6 15.�8 15.�2 16.�9
Five-year survival probabilities continue to rise, reaching 0.39 overall for 1996–2000 incident patients, 0.35 for those on dialy-sis, and 0.75 for those with a transplant (Figure 6.16). Compared to those of 1991–1995 incident patients, probabilities for patients initiating in 1996–2000 grew 6.2 percent overall—5.8, 11.1, and 7.3 percent for hemodialysis, peritoneal dialysis, and transplant, respectively. Survival continues to improve most for patients with diabetic ESRD, though their rates remain lowest by diagnosis.
Survival after a major disease diagnosis is dramatically greater in the general population, and lowest in patients on dialysis (Fig-
A
General population ESRD
Dialysis Transplant
6144
85 87 89 91 93 95 97 99 01 03 05
Dea
ths
per
1,0
00 p
atie
nt
year
s at
ris
k
200
225
250
275
300
<2 years
2-<5 years
5+ years
All
Surv
ival
pro
bab
ility
0.2
0.4
0.6
0.8
1.0
Dial. (0.32)HD (0.33)PD (0.31)Tx (0.70)All (0.37)
1991-1995: All pts, by modality HD pts, by primary diagnosis PD pts, by primary diagnosis
DM (0.26)HTN (0.37)GN (0.43)Other (0.35) All (0.33)
DM (0.21)HTN (0.37)GN (0.45)Other (0.37) All (0.31)
Months after initiation
0 12 24 36 48 60
0.2
0.4
0.6
0.8
1.0
Dial. (0.35)HD (0.35)PD (0.34)Tx (0.75)All (0.39)
1996-2000
0 12 24 36 48 600 12 24 36 48 60
DM (0.28)HTN (0.39)GN (0.46)Other (0.36) All (0.35)
DM (0.24)HTN (0.40)GN (0.49)Other (0.40) All (0.34)
92 94 96 98 00 02 0492 94 96 98 00 02 0492 94 96 98 00 02 04
Surv
ival
pro
bab
ility
0.2
0.4
0.6
0.8
1.0 Heart disease Malignancy Septicemia
General population: 1-yrGeneral population: 5-yr
Dialysis: 1-yrDialysis: 5-yr
Transplant: 1-yrTransplant: 5-yr
Age20-44 45-64 65+D
eath
s p
er 1
,000
pat
ien
t ye
ars
at r
isk
0
200
400
600
800Heart disease: gen. pop.Heart disease: ESRD Malignancy: gen. pop.Malignancy: ESRDSepticemia: gen. pop.Septicemia: ESRD
2007 USRDS Annual Data Report
6.14 Adjusted mortality rates, by vintage period prevalent dialysis patients 6.15 All-cause mortality: pts with major
diseases, 2005 general Medicare & ESRD pts
6.16 Adjusted five-year survival, by modality & primary diagnosis incident dialysis patients & patients receiving a first transplant in the calendar year
6.17 Survival rates after major disease diagnosis in the ESRD & general populations prevalent general Medicare & ESRD patients
More on mortality: p.23–25, ei.23–27, 6.18–2 (next page), 8.37–38 (pediatric patients), 10.50–54 (Bayesian ratios, by provider).
ure 6.17). Following a diagnosis of heart disease, for example, first-year survival probabilities in the general population in 2004 were 0.92, compared to 0.73 in dialysis patients and 0.88 in the trans-plant population. At five years this differ-ence is even more pronounced—dialysis patients have a 0.18 survival probability compared to 0.64 in the general popula-tion and 0.47 in transplant patients. Fol-lowing a diagnosis for malignancy, the probability of first-year survival in dial-ysis patients is 0.73 compared to 0.90 in both the general and transplant popula-tions. At five years, the probability falls to 0.17 in dialysis patients compared to 0.62 and 0.53, respectively, in the general and transplant populations. A diagnosis of septicemia appears to have the most significant impact on survival. The first-year survival probability after this diagnosis is highest for transplant patients, at 0.69, and comparable in the general and dialysis populations, at 0.58 and 0.59, respectively. At five years, however, probabilities in all populations are noticeably low, at 0.12 in the dialysis population and 0.25 and 0.30, respec-tively, in the general and transplant populations. ½
figure 6.12 ESRD: prevalent ESRD patients, 2005. General Medicare: non-ESRD patients with at least one month of Medicare eligibility in 2005. Adjusted for gender & race. figure 6.13 ESRD: prevalent ESRD patients, 2005. General Medi-care: non-ESRD patients age 65 & older with at least one month of Medicare eligibility in 2005. Unadjusted. Excludes patients residing in Puerto Rico & the Territories. table 6.d U.S. data: calculated from Tables 1–9 in the United States life tables (Arias E). Available at http://www.cdc.gov/nchs/data/nvsr/nvsr54/nvsr54_14.pdf. ESRD data: prevalent dialysis & transplant patients, 2005. Expected remaining lifetimes by race & gender can be found in Reference Table H.31. *Prevalent ESRD population, 2005, used as weight used to calculate overall combined-age remaining lifetimes. figure 6.14 period prevalent dialysis patients; adjusted for age, gender, race, & primary diagnosis. Dialysis patients, 2001, used as reference cohort. figure 6.15 ESRD & gen-eral Medicare patients with diagnosis in 2005; adjusted for gender & race. Medicare patients, 2005, used as reference cohort. figure 6.16 inci-dent dialysis patients & patients receiving a first transplant in the calendar year. All probabilities adjusted for age, gender, & race; overall prob-abilities also adjusted for primary diagnosis. All ESRD patients, 1996, used as reference cohort. Modality determined on first ESRD service date; excludes patients transplanted or dying during the first 90 days. Five-year survival probabilities noted in parentheses. Dialysis patients followed from day 90 after initiation; transplant patients followed from the transplant date. figure 6.17 gen-eral Medicare & ESRD patients with diagnosis between 1992 & 2004. Medicare patients, 2005, used as reference cohort.
1456
91 93 95 97 99 01 03 91 93 95 97 99 01 0391 93 95 97 99 01 03Dea
ths
per
1,0
00 p
atie
nt
year
s at
ris
k
0
75
150
225
300
375All Cardiovascular disease Infection Other cause
Month 1
91 93 95 97 99 01 03
21 htnoM6 htnoM3 htnoM
165 + (197)138 to <165130 to <138
112 to <130below 112 (86)
135 + (156)119 to <135107 to <119
93 to <107below 93 (80)
41.4 + (49.6)37.1 to <41.431.3 to <37.1
28.8 to <31.3below 28.8 (24.7)
57.8 + (64.9)47.1 to <57.841.1 to <47.1
32.0 to <41.1below 32.0 (25.2)
morbidity & mortalitycause-specific mortality
6.e Predictors of cause-specific mortality, by time after initiation incident dialysis patients, 2004
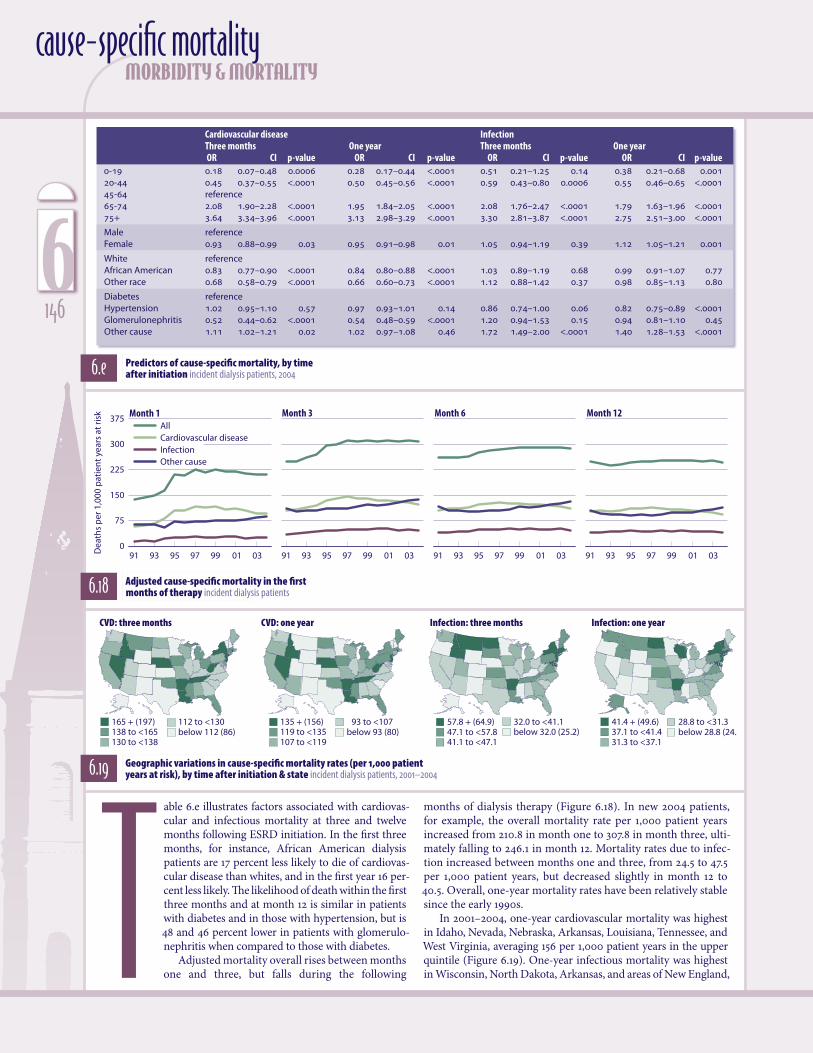
Cardiovasculardisease Infection Threemonths Oneyear Threemonths Oneyear OR CI p-value OR CI p-value OR CI p-value OR CI p-value0-19 0.�18 0.�07–0.�48 0.�0006 0.�28 0.�17–0.�44 <.�0001 0.�51 0.�21–1.�25 0.�14 0.�38 0.�21–0.�68 0.�00120-44 0.�45 0.�37–0.�55 <.�0001 0.�50 0.�45–0.�56 <.�0001 0.�59 0.�43–0.�80 0.�0006 0.�55 0.�46–0.�65 <.�000145-64 reference 65-74 2.�08 1.�90–2.�28 <.�0001 1.�95 1.�84–2.�05 <.�0001 2.�08 1.�76–2.�47 <.�0001 1.�79 1.�63–1.�96 <.�000175+ 3.�64 3.�34–3.�96 <.�0001 3.�13 2.�98–3.�29 <.�0001 3.�30 2.�81–3.�87 <.�0001 2.�75 2.�51–3.�00 <.�0001
Male reference Female 0.�93 0.�88–0.�99 0.�03 0.�95 0.�91–0.�98 0.�01 1.�05 0.�94–1.�19 0.�39 1.�12 1.�05–1.�21 0.�001
White reference African American 0.�83 0.�77–0.�90 <.�0001 0.�84 0.�80–0.�88 <.�0001 1.�03 0.�89–1.�19 0.�68 0.�99 0.�91–1.�07 0.�77Other race 0.�68 0.�58–0.�79 <.�0001 0.�66 0.�60–0.�73 <.�0001 1.�12 0.�88–1.�42 0.�37 0.�98 0.�85–1.�13 0.�80
Diabetes reference Hypertension 1.�02 0.�95–1.�10 0.�57 0.�97 0.�93–1.�01 0.�14 0.�86 0.�74–1.�00 0.�06 0.�82 0.�75–0.�89 <.�0001Glomerulonephritis 0.�52 0.�44–0.�62 <.�0001 0.�54 0.�48–0.�59 <.�0001 1.�20 0.�94–1.�53 0.�15 0.�94 0.�81–1.�10 0.�45Other cause 1.�11 1.�02–1.�21 0.�02 1.�02 0.�97–1.�08 0.�46 1.�72 1.�49–2.�00 <.�0001 1.�40 1.�28–1.�53 <.�0001
6.18 Adjusted cause-specific mortality in the first months of therapy incident dialysis patients
able 6.e illustrates factors associated with cardiovas-cular and infectious mortality at three and twelve months following ESRD initiation. In the first three months, for instance, African American dialysis patients are 17 percent less likely to die of cardiovas-cular disease than whites, and in the first year 16 per-cent less likely. The likelihood of death within the first three months and at month 12 is similar in patients with diabetes and in those with hypertension, but is 48 and 46 percent lower in patients with glomerulo-nephritis when compared to those with diabetes.
Adjusted mortality overall rises between months one and three, but falls during the following T
6.19 Geographic variations in cause-specific mortality rates (per 1,000 patient years at risk), by time after initiation & state incident dialysis patients, 2001–2004
months of dialysis therapy (Figure 6.18). In new 2004 patients, for example, the overall mortality rate per 1,000 patient years increased from 210.8 in month one to 307.8 in month three, ulti-mately falling to 246.1 in month 12. Mortality rates due to infec-tion increased between months one and three, from 24.5 to 47.5 per 1,000 patient years, but decreased slightly in month 12 to 40.5. Overall, one-year mortality rates have been relatively stable since the early 1990s.
In 2001–2004, one-year cardiovascular mortality was highest in Idaho, Nevada, Nebraska, Arkansas, Louisiana, Tennessee, and West Virginia, averaging 156 per 1,000 patient years in the upper quintile (Figure 6.19). One-year infectious mortality was highest in Wisconsin, North Dakota, Arkansas, and areas of New England,
CVD: three months CVD: one year Infection: three months Infection: one year
6146
91 93 95 97 99 01 030
50
100
150
200
250
300
350
91 93 95 97 99 01 03
White African AmericanOther
White African AmericanOther
White African AmericanOther
By age: at three months
91 93 95 97 99 01 03 91 93 95 97 99 01 03
raey eno ta :ecar yBshtnom eerht ta :ecar yBraey eno tA
45-6465-7475+
20-44
45-6465-7475+
20-44
45-6465-7475+
20-44
Dea
ths
per
1,0
00 p
atie
nt
year
s at
ris
k
91 93 95 97 99 01 0391 93 95 97 99 01 030
20
40
60
80
100
91 93 95 97 99 01 03
By age: at three months
91 93 95 97 99 01 03
raey eno ta :ecar yBshtnom eerht ta :ecar yBraey eno tA
Dea
ths
per
1,0
00 p
atie
nt
year
s at
ris
k
91 93 95 97 99 01 0391 93 95 97 99 01 030
50
100
150
200
250
300
91 93 95 97 99 01 03
By age: at three months
91 93 95 97 99 01 03
raey eno ta :ecar yBshtnom eerht ta :ecar yBraey eno tA
Dea
ths
per
1,0
00 p
atie
nt
year
s at
ris
k
2007 USRDS Annual Data Report
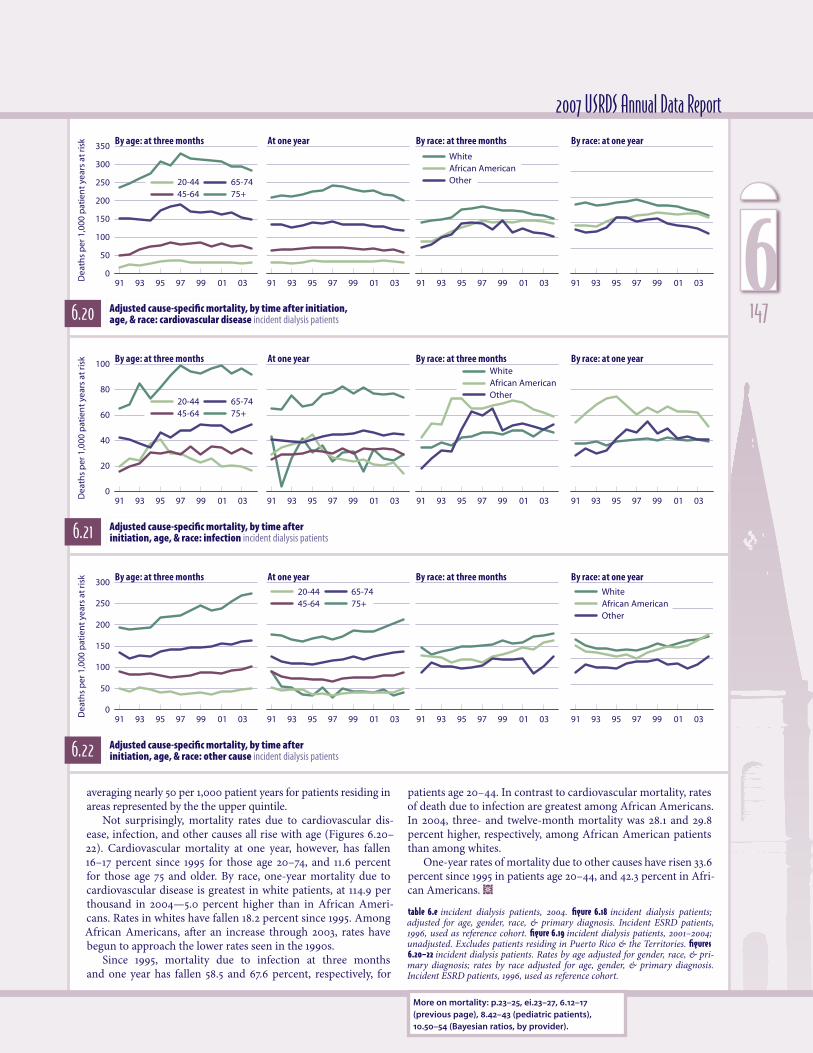
6.22 Adjusted cause-specific mortality, by time after initiation, age, & race: other cause incident dialysis patients
6.21 Adjusted cause-specific mortality, by time after initiation, age, & race: infection incident dialysis patients
6.20 Adjusted cause-specific mortality, by time after initiation, age, & race: cardiovascular disease incident dialysis patients
More on mortality: p.23–25, ei.23–27, 6.12–17 (previous page), 8.42–43 (pediatric patients), 10.50–54 (Bayesian ratios, by provider).
averaging nearly 50 per 1,000 patient years for patients residing in areas represented by the the upper quintile.
Not surprisingly, mortality rates due to cardiovascular dis-ease, infection, and other causes all rise with age (Figures 6.20–22). Cardiovascular mortality at one year, however, has fallen 16–17 percent since 1995 for those age 20–74, and 11.6 percent for those age 75 and older. By race, one-year mortality due to cardiovascular disease is greatest in white patients, at 114.9 per thousand in 2004—5.0 percent higher than in African Ameri-cans. Rates in whites have fallen 18.2 percent since 1995. Among African Americans, after an increase through 2003, rates have begun to approach the lower rates seen in the 1990s.
Since 1995, mortality due to infection at three months and one year has fallen 58.5 and 67.6 percent, respectively, for
patients age 20–44. In contrast to cardiovascular mortality, rates of death due to infection are greatest among African Americans. In 2004, three- and twelve-month mortality was 28.1 and 29.8 percent higher, respectively, among African American patients than among whites.
One-year rates of mortality due to other causes have risen 33.6 percent since 1995 in patients age 20–44, and 42.3 percent in Afri-can Americans. ½
table 6.e incident dialysis patients, 2004. figure 6.18 incident dialysis patients; adjusted for age, gender, race, & primary diagnosis. Incident ESRD patients, 1996, used as reference cohort. figure 6.19 incident dialysis patients, 2001–2004; unadjusted. Excludes patients residing in Puerto Rico & the Territories. figures 6.20–22 incident dialysis patients. Rates by age adjusted for gender, race, & pri-mary diagnosis; rates by race adjusted for age, gender, & primary diagnosis. Incident ESRD patients, 1996, used as reference cohort.
1476
All 67-74 75-84 85+
Perc
ent
of p
atie
nts
0
5
10
15
20
25Blindness
Amputation
Limb paresis/paralysis
Dementia
Blindness
Amputation
Limb paresis/paralysis
Dementia
Blindness
Amputation
Limb paresis/paralysis
Dementia
CKD
All 67-74 75-84 85+
ESRD
CKD HD PD Tx
Perc
ent
of p
atie
nts
0
5
10
15
All 67-74 75-84 85+0
4
8
12
16
0
5
10
15
20
25 CKD: diabetes
All 67-74 75-84 85+
CKD: no diabetes
Dialysis
Perc
ent
of p
atie
nts
All 67-74 75-84 85+0
20
40
60
80
100
100
0
20
40
60
80
CKD
All 67-74 75-84 85+
Hemodialysis
Peritoneal dialysis Transplant
Perc
ent o
f pat
ien
ts
0 disabilities123 (values <0.3%)
morbidity & mortality
ne recent initiative of the USRDS Rehabilitation Special Study Center is the Comprehensive Dialysis study, a survey designed to measure quality of life in dialysis patients. The ability to function independently contributes strongly to quality of life. Here we use the presence of a disability as a measure of the loss of inde-pendence, providing another picture of qual-ity of life in the CKD and ESRD populations.
Physical function and disability in popu-lation-based studies can be measured by the ability to perform activities of daily living (ADLs): walking, eating, dressing, transfer-ring, toileting, and bathing, along with instru-
mental activities (IADLs) such as cooking, shopping, and managing finances and medica-
tions. Although Medicare claims do not address these specific measures of physical function, they contain information on dis-abilities that affect the ability to function independently.
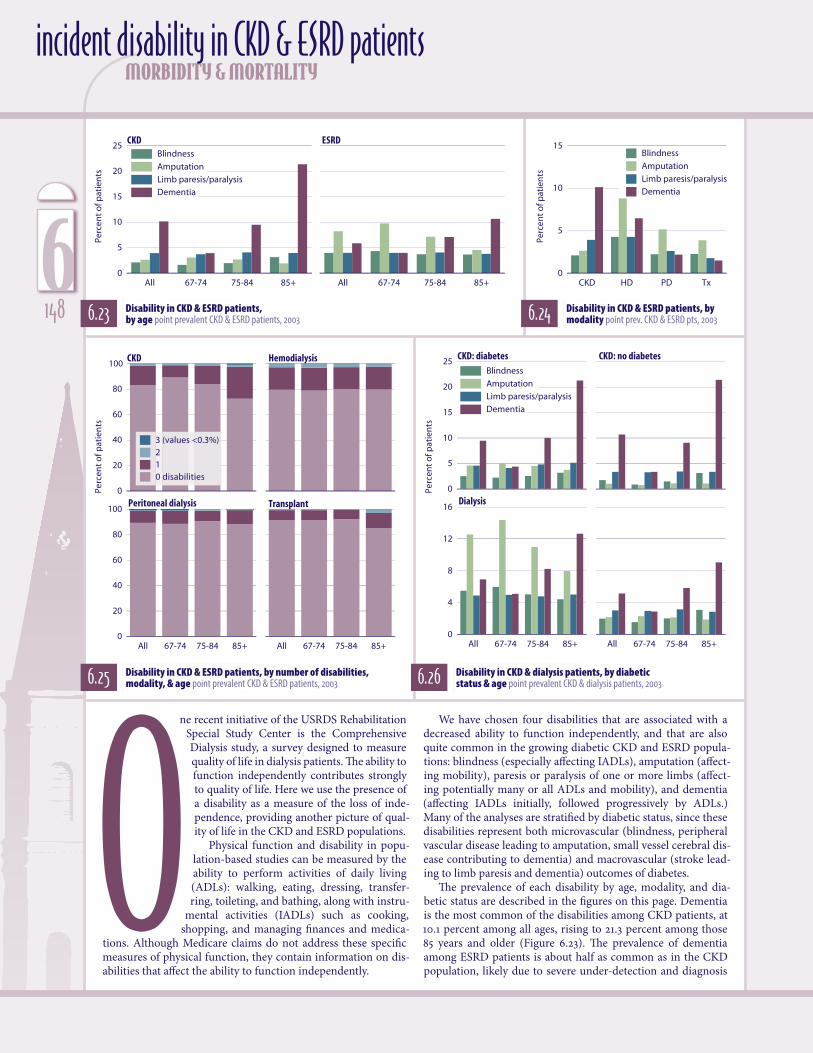
6.23 Disability in CKD & ESRD patients, by age point prevalent CKD & ESRD patients, 2003
incident disability in CKD & ESRD patients
6.24 Disability in CKD & ESRD patients, by modality point prev. CKD & ESRD pts, 2003
6.25 Disability in CKD & ESRD patients, by number of disabilities, modality, & age point prevalent CKD & ESRD patients, 2003 6.26 Disability in CKD & dialysis patients, by diabetic
status & age point prevalent CKD & dialysis patients, 2003
We have chosen four disabilities that are associated with a decreased ability to function independently, and that are also quite common in the growing diabetic CKD and ESRD popula-tions: blindness (especially affecting IADLs), amputation (affect-ing mobility), paresis or paralysis of one or more limbs (affect-ing potentially many or all ADLs and mobility), and dementia (affecting IADLs initially, followed progressively by ADLs.) Many of the analyses are stratified by diabetic status, since these disabilities represent both microvascular (blindness, peripheral vascular disease leading to amputation, small vessel cerebral dis-ease contributing to dementia) and macrovascular (stroke lead-ing to limb paresis and dementia) outcomes of diabetes.
The prevalence of each disability by age, modality, and dia-betic status are described in the figures on this page. Dementia is the most common of the disabilities among CKD patients, at 10.1 percent among all ages, rising to 21.3 percent among those 85 years and older (Figure 6.23). The prevalence of dementia among ESRD patients is about half as common as in the CKD population, likely due to severe under-detection and diagnosis
O
6148
All 67-74 75-84 85+0
2
4
6
8
10
0
2
4
6
8Blindness
Amputation
Limb paresis/paralysis
Dementia
CKD: diabetes
All 67-74 75-84 85+
CKD: no diabetes
Dialysis
Perc
ent
of p
atie
nts
of dementia in the dialysis population (Murray et al.). Demen-tia is three times more common among hemodialysis patients compared to peritoneal patients, and four times more com-mon than in the transplant population.
Blindness is the least common of the disabilities, but still affects 2.1 percent of CKD patients, and 4 percent of those with ESRD. In the non-ESRD elderly population, the combination of severe visual impairment and dementia is associated with a six-fold increased odds ratio for incident ADL disability over six years (Whitson et al.).
Amputation here includes minor and major upper and lower amputations. Amputation is the most common preva-lent disability in the ESRD cohort, at 8.2 percent. The preva-lence of amputation actually decreases with age in both the CKD and ESRD cohorts. This is likely due to the extremely high one-year mortality rates associated with amputation, at up to 62.0 percent in one USRDS study (Logar et al.). We included toe amputations in the prevalence figures because they are often the prelude to subsequent below- and above-the-knee amputations, and represent a potential opportunity to initiate aggressive management of severe peripheral vascular disease to prevent amputation.
Limb paresis or paralysis is prevalent in about 4 percent of both the CKD and ESRD patients. It is usually secondary to acute stroke, which is highly prevalent in both the older CKD (about 9.0 percent) and ESRD (about 17.0 percent) popula-tions (2006 ADR).
Relatively few prevalent CKD or ESRD patients have more than one of the four disabilities described here (Figure 6.25). The most common combination of two disabilities is dementia and limb paresis/paralysis for the CKD cohort, and dementia and amputation for the ESRD cohort (not shown). The prevalence of any one disability in the CKD population is 15.0 percent and increases with age; only 1.7 percent have two disabilities. Among hemodialysis patients, 17.7 percent have any one disability and 2.7 percent have two, but prevalence does not increase with age. This suggests a high mortality rate associated with these disabili-ties in the ESRD cohort, among patients that already have rela-tively low organ reserve compared to those in the CKD cohort. In the transplant cohort, 7.8 percent have at least one disability. Most common is amputation, in 3.9 percent, followed by blind-ness, in 2.3 percent.
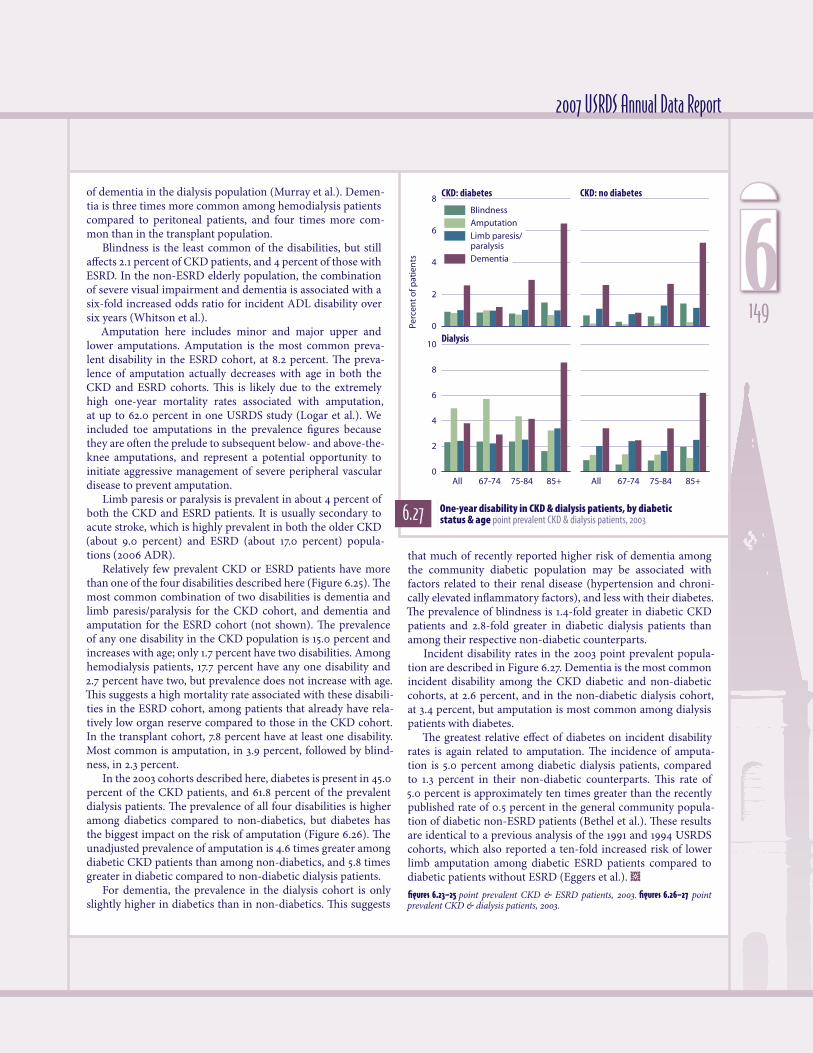
In the 2003 cohorts described here, diabetes is present in 45.0 percent of the CKD patients, and 61.8 percent of the prevalent dialysis patients. The prevalence of all four disabilities is higher among diabetics compared to non-diabetics, but diabetes has the biggest impact on the risk of amputation (Figure 6.26). The unadjusted prevalence of amputation is 4.6 times greater among diabetic CKD patients than among non-diabetics, and 5.8 times greater in diabetic compared to non-diabetic dialysis patients.
For dementia, the prevalence in the dialysis cohort is only slightly higher in diabetics than in non-diabetics. This suggests
2007 USRDS Annual Data Report
6.27 One-year disability in CKD & dialysis patients, by diabetic status & age point prevalent CKD & dialysis patients, 2003
that much of recently reported higher risk of dementia among the community diabetic population may be associated with factors related to their renal disease (hypertension and chroni-cally elevated inflammatory factors), and less with their diabetes. The prevalence of blindness is 1.4-fold greater in diabetic CKD patients and 2.8-fold greater in diabetic dialysis patients than among their respective non-diabetic counterparts.
Incident disability rates in the 2003 point prevalent popula-tion are described in Figure 6.27. Dementia is the most common incident disability among the CKD diabetic and non-diabetic cohorts, at 2.6 percent, and in the non-diabetic dialysis cohort, at 3.4 percent, but amputation is most common among dialysis patients with diabetes.
The greatest relative effect of diabetes on incident disability rates is again related to amputation. The incidence of amputa-tion is 5.0 percent among diabetic dialysis patients, compared to 1.3 percent in their non-diabetic counterparts. This rate of 5.0 percent is approximately ten times greater than the recently published rate of 0.5 percent in the general community popula-tion of diabetic non-ESRD patients (Bethel et al.). These results are identical to a previous analysis of the 1991 and 1994 USRDS cohorts, which also reported a ten-fold increased risk of lower limb amputation among diabetic ESRD patients compared to diabetic patients without ESRD (Eggers et al.). ½figures 6.23–25 point prevalent CKD & ESRD patients, 2003. figures 6.26–27 point prevalent CKD & dialysis patients, 2003.
1496
All 67-74 75-84 85+
PPPY
co
sts
(do
llars
, in
tho
usa
nd
s)
0
50
100
150Blindness
Amputation
Limb paresis/paralysis
Dementia
Diabetes
All 67-74 75-84 85+
No diabetes
0 disabilities
1
2
All 67-74 75-84 85+
No diabetes
All 67-74 75-84 85+
PPP
Y co
sts
(do
llars
, in
th
ous
and
s)
0
25
50
75
100
125 Diabetes
Months
0 2 4 6 8 10 12 14 16 18 20 22 24
Cu
mul
ativ
e p
erce
nta
ge
0.0
2.0
4.0
6.0
8.0
Dialysis
CKD
Months
0 2 4 6 8 10 12 14 16 18 20 22 24
Cu
mu
lati
ve p
erce
nta
ge
0.0
4.0
8.0
12.0
Dialysis
CKD
Months
0 2 4 6 8 10 12 14 16 18 20 22 24
Cu
mu
lati
ve p
erce
nta
ge
0.0
1.0
2.0
3.0
4.0
Dialysis
CKD
Months
0 2 4 6 8 10 12 14 16 18 20 22 24
Cu
mu
lati
ve p
erce
nta
ge
0.0
2.0
4.0
6.0
8.0
10.0
Dialysis
CKD
morbidity & mortalityexpenditures & mortality in patients with disabilities
6.28 Per person per year costs in dialysis patients, by diabetic status, type of disability, & age incident dialysis patients, 2003
6.29 Per person per year costs in dialysis patients, by diabetic status, number of disabilities, & age incident dialysis patients, 2003
6.30 Probability of blindness in dialysis & CKD patients incident dialysis & point prevalent CKD patients, 2003
6.32 Probability of limb paresis/paralysis in dialysis & CKD patients incident dialysis & point prevalent CKD patients, 2003
6.31 Probability of amputation in dialysis & CKD patients incident dialysis & point prevalent CKD patients, 2003
6.33 Probability of dementia in dialysis & CKD patients incident dialysis & point prevalent CKD patients, 2003
6150

2007 USRDS Annual Data Report
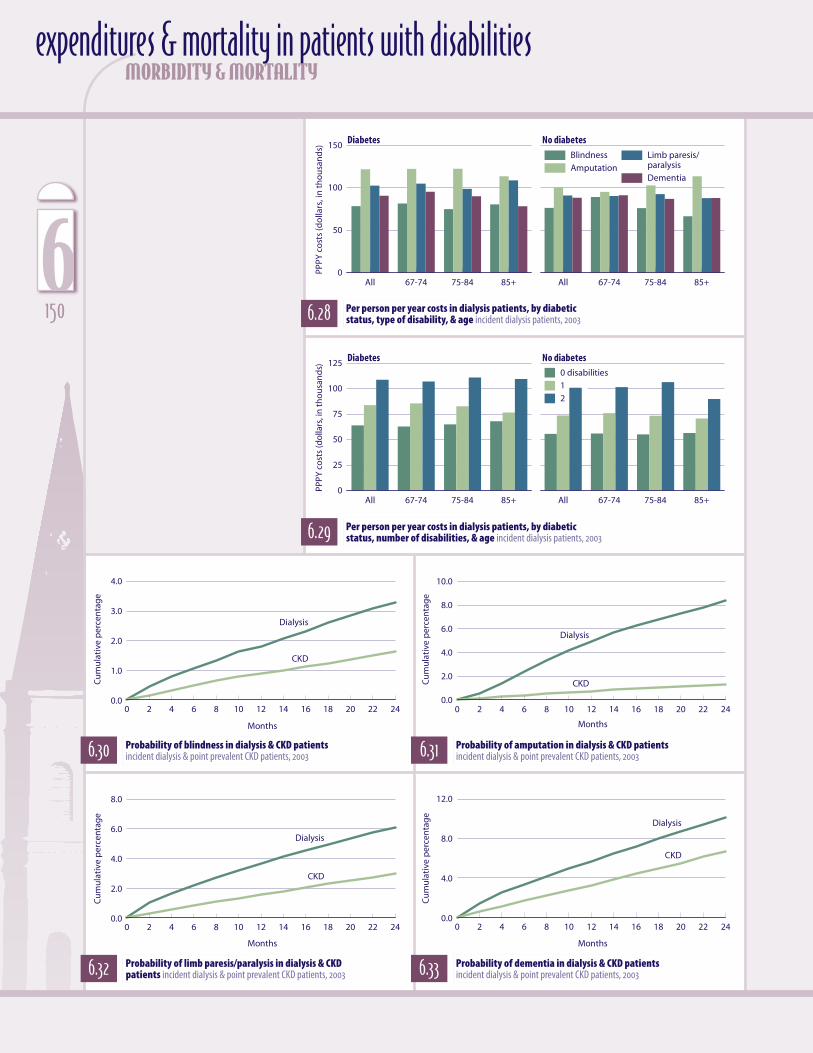
ot surprisingly, the cumu-lative per person per year (PPPY) costs associated with each of the disabili-ties examined here are, for the most part, substantially greater for dialysis patients with diabetes than for those without, and overall dif-ferences in cost vary by approximately 3 to 21 per-cent depending on the type of disability (Figure 6.28).
Amputation is the most costly disability regard-less of diabetic status, with
associated costs of $122,000 for diabetic patients—approximately $20,000 higher than in patients without diabetes. Costs for limb paresis/paralysis are $102,590 and $90,900, respectively, in patients with or without diabetes, and for diabetic patients with dementia are approximately 3 percent higher than in those with no diabetes.
Overall, PPPY costs do not vary sub-stantially with age. In diabetic patients age 85 and older, however, the associated costs for dementia are 18 percent lower than those found in the younger cohort. This may be due in part to the low number of subjects in the 85 and older age group and a “healthy survivor” effect—those who are able to sur-vive until age 85 may have lower comorbid-ity burden than those who didn’t survive.
PPPY costs of $108,820 in diabetic patients with two disabilities are consider-ably higher than costs of $64,020 incurred in patients with no disabilities (Figure 6.29). A similar pattern is seen in non-dia-betics, but baseline PPPY costs for non-dia-
betics with no disabilities are $8,280 lower, at $55,740. There is no appreciable effect of age on the relationship between cost and number of disabilities (costs for more than two disabilities are not shown because of low patient numbers).
The adjusted 24-month cumulative risk of each disability is far higher among dial-ysis patients compared to those with CKD (Figures 6.30–33). The cumulative risk of incident amputation in dialysis patients, for example, is 8.4 percent, more than six times that of CKD patients, at 1.3 percent; the risk of incident limb paresis/paralysis in dialysis patients, at 6.1 percent, is twice as high as the 3.0 percent risk found in CKD patients.
The burden of disability due to blind-ness, amputation, paresis/paralysis, and dementia is high in the CKD and dialysis populations. Amputation is the most com-mon disability among dialysis patients, and dementia the most common among those with CKD. Diabetes increases the risk of all disabilities, but especially amputation.
More aggressive diabetic foot care and management of peripheral vascular disease are especially needed to decrease the risk of amputation and the associated loss of mobility. Intensive diabetes management and control of blood pressure are critical to lower the risk of all four disabilities, and in turn would contribute to a higher quality of life and increased ability to function inde-pendently. ½
figures 6.28–29 incident dialysis patients, 2003. fig-ures 6.30–33 incident dialysis & point prevalent CKD patients, 2003; Medicare as primary payor on the first service date for dialysis patients & on January 1 for CKD patients. Adjusted for age, gender, diabetic status, & ASHD; 2003 dialysis patients used as reference.
N1516
and relocate the dialysis population were largely performed by local services, volunteers, dialysis units, and national and local affiliates of non-profit organizations such as the National Kidney Foundation and the American Association of Kidney Patients.
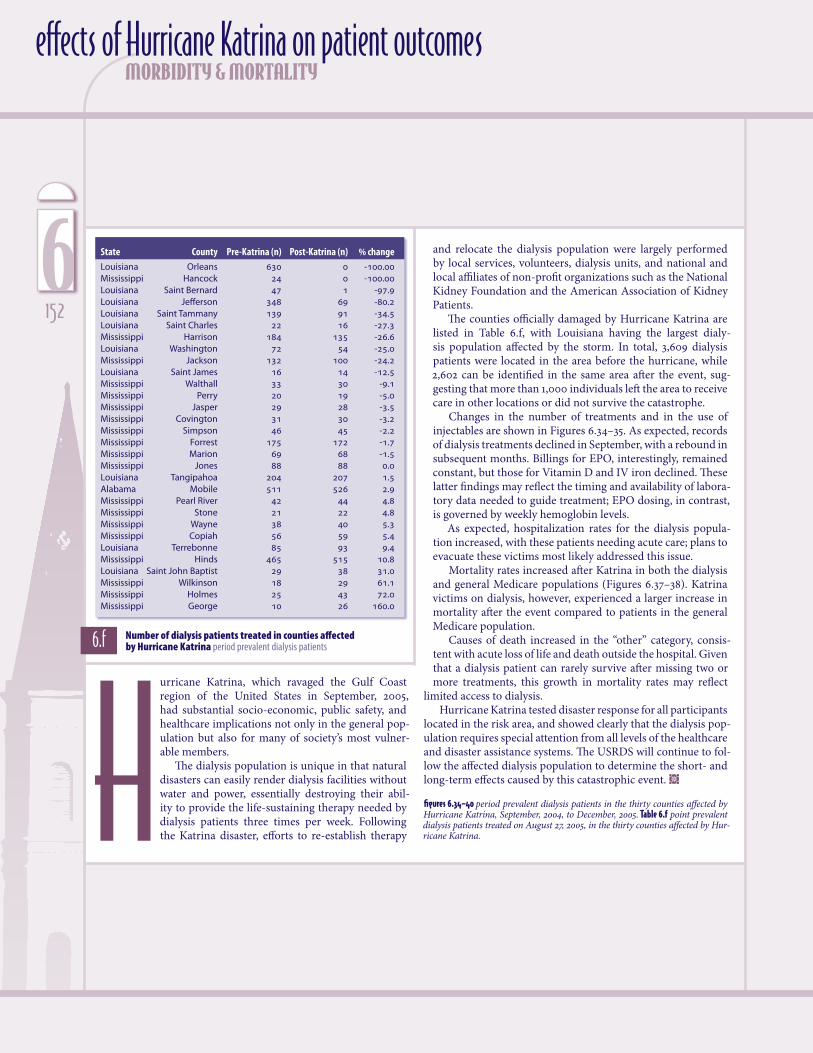
The counties officially damaged by Hurricane Katrina are listed in Table 6.f, with Louisiana having the largest dialy-sis population affected by the storm. In total, 3,609 dialysis patients were located in the area before the hurricane, while 2,602 can be identified in the same area after the event, sug-gesting that more than 1,000 individuals left the area to receive care in other locations or did not survive the catastrophe.
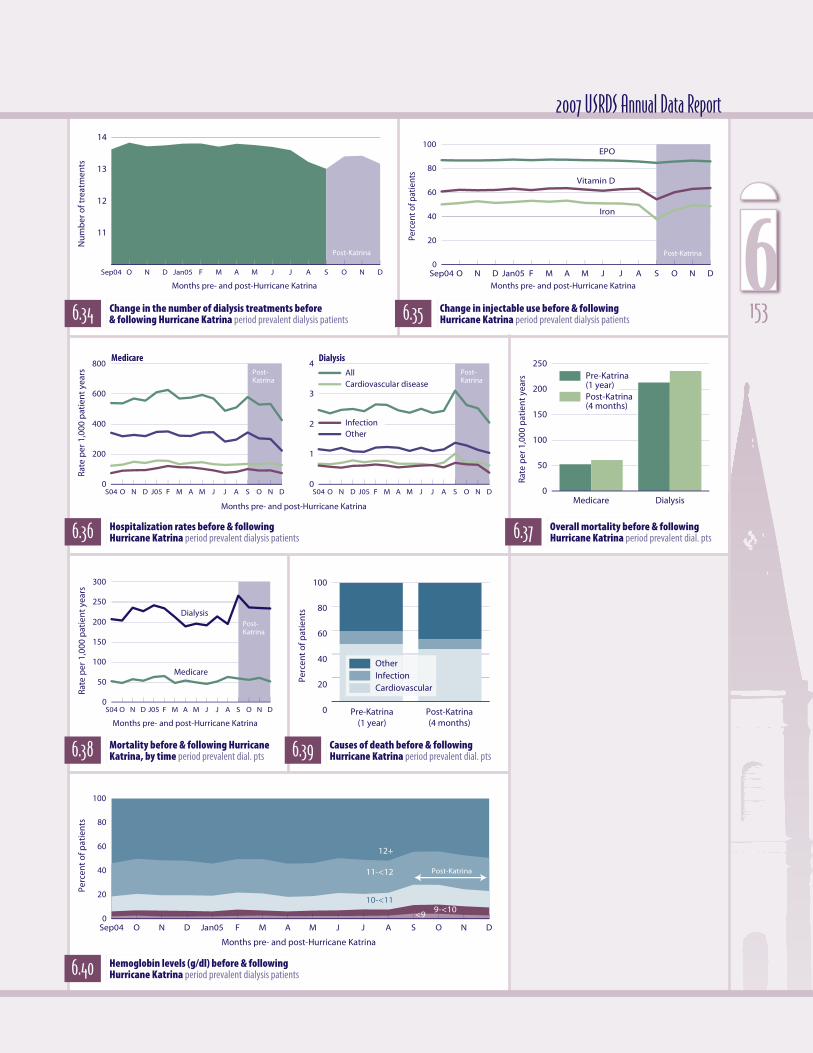
Changes in the number of treatments and in the use of injectables are shown in Figures 6.34–35. As expected, records of dialysis treatments declined in September, with a rebound in subsequent months. Billings for EPO, interestingly, remained constant, but those for Vitamin D and IV iron declined. These latter findings may reflect the timing and availability of labora-tory data needed to guide treatment; EPO dosing, in contrast, is governed by weekly hemoglobin levels.
As expected, hospitalization rates for the dialysis popula-tion increased, with these patients needing acute care; plans to evacuate these victims most likely addressed this issue.
Mortality rates increased after Katrina in both the dialysis and general Medicare populations (Figures 6.37–38). Katrina victims on dialysis, however, experienced a larger increase in mortality after the event compared to patients in the general Medicare population.
Causes of death increased in the “other” category, consis-tent with acute loss of life and death outside the hospital. Given that a dialysis patient can rarely survive after missing two or more treatments, this growth in mortality rates may reflect
limited access to dialysis.Hurricane Katrina tested disaster response for all participants
located in the risk area, and showed clearly that the dialysis pop-ulation requires special attention from all levels of the healthcare and disaster assistance systems. The USRDS will continue to fol-low the affected dialysis population to determine the short- and long-term effects caused by this catastrophic event. ½
figures 6.34–40 period prevalent dialysis patients in the thirty counties affected by Hurricane Katrina, September, 2004, to December, 2005. Table 6.f point prevalent dialysis patients treated on August 27, 2005, in the thirty counties affected by Hur-ricane Katrina.
morbidity & mortality
State County Pre-Katrina(n) Post-Katrina(n) %changeLouisiana Orleans 630 0 -100.�00Mississippi Hancock 24 0 -100.�00Louisiana Saint Bernard 47 1 -97.�9Louisiana Jefferson 348 69 -80.�2Louisiana Saint Tammany 139 91 -34.�5Louisiana Saint Charles 22 16 -27.�3Mississippi Harrison 184 135 -26.�6Louisiana Washington 72 54 -25.�0Mississippi Jackson 132 100 -24.�2Louisiana Saint James 16 14 -12.�5Mississippi Walthall 33 30 -9.�1Mississippi Perry 20 19 -5.�0Mississippi Jasper 29 28 -3.�5Mississippi Covington 31 30 -3.�2Mississippi Simpson 46 45 -2.�2Mississippi Forrest 175 172 -1.�7Mississippi Marion 69 68 -1.�5Mississippi Jones 88 88 0.�0Louisiana Tangipahoa 204 207 1.�5Alabama Mobile 511 526 2.�9Mississippi Pearl River 42 44 4.�8Mississippi Stone 21 22 4.�8Mississippi Wayne 38 40 5.�3Mississippi Copiah 56 59 5.�4Louisiana Terrebonne 85 93 9.�4Mississippi Hinds 465 515 10.�8Louisiana Saint John Baptist 29 38 31.�0Mississippi Wilkinson 18 29 61.�1Mississippi Holmes 25 43 72.�0Mississippi George 10 26 160.�0
6.f Number of dialysis patients treated in counties affected by Hurricane Katrina period prevalent dialysis patients
urricane Katrina, which ravaged the Gulf Coast region of the United States in September, 2005, had substantial socio-economic, public safety, and healthcare implications not only in the general pop-ulation but also for many of society’s most vulner-able members.
The dialysis population is unique in that natural disasters can easily render dialysis facilities without water and power, essentially destroying their abil-ity to provide the life-sustaining therapy needed by dialysis patients three times per week. Following the Katrina disaster, efforts to re-establish therapy H
effects of Hurricane Katrina on patient outcomes
6152
11
12
13
14
Medicare Dialysis
Rate
per
1,0
00 p
atie
nt
year
s
0
50
100
150
200
250Pre-Katrina (1 year)Post-Katrina(4 months)
Perc
ent
of p
atie
nts
0
20
40
60
80
100
Months pre- and post-Hurricane Katrina
9-<1010-<11
12+
Sep04 O N D Jan05 F M A M J J A S O N D
Perc
ent
of p
atie
nts
0
20
40
60
80
100
11-<12
<9
Post-Katrina
Post-Katrina
S04 O N D J05 F M A M J J A S O N D
Rate
per
1,0
00 p
atie
nt
year
s
0
50
100
150
200
250
300
Medicare
Dialysis
Months pre- and post-Hurricane Katrina
Post-Katrina
Months pre- and post-Hurricane Katrina
Sep04 O N D Jan05 F M A M J J A S O N D
Nu
mb
er o
f tre
atm
ents
Post-Katrina
Months pre- and post-Hurricane Katrina
Sep04 O N D Jan05 F M A M J J A S O N D
Perc
ent o
f pat
ient
s
0
20
40
60
80
100EPO
Iron
Vitamin D
Post-Katrina
Post-Katrina
S04 O N D J05 F M A M J J A S O N D
Rate
per
1,0
00 p
atie
nt
year
s
0
200
400
600
800
S04 O N D J05 F M A M J J A S O N D0
1
2
3
4Medicare Dialysis
AllCardiovascular disease
InfectionOther
Months pre- and post-Hurricane Katrina
CardiovascularInfectionOther
Pre-Katrina(1 year)
Post-Katrina(4 months)
2007 USRDS Annual Data Report
6.36 Hospitalization rates before & following Hurricane Katrina period prevalent dialysis patients 6.37 Overall mortality before & following
Hurricane Katrina period prevalent dial. pts
6.39 Causes of death before & following Hurricane Katrina period prevalent dial. pts 6.38 Mortality before & following Hurricane
Katrina, by time period prevalent dial. pts
6.40 Hemoglobin levels (g/dl) before & following Hurricane Katrina period prevalent dialysis patients
6.34 Change in the number of dialysis treatments before & following Hurricane Katrina period prevalent dialysis patients 6.35 Change in injectable use before & following
Hurricane Katrina period prevalent dialysis patients 1536
morbidity & mortality
overall hospitalizationfigure 6.3 Hospital admissions for vascular access in hemodialysis pa-tients continue to decline—34 percent since 1993.� Admissions for bacteremia/septicemia have been increasing since 2001, now reach-ing a rate nearly 29 percent greater than in 1993.� figure 6.6 Since 1995, admissions for infection have increased nearly 19 percent overall, 27 percent for patients 75 and older, and 28 percent for African Ameri-cans.� tables 6.a–c In the hemodialysis population, patients who have had ESRD for less than two years have the highest admission rates, while the greatest rates for peritoneal dialysis and transplant patients occur most often in those with ESRD for five years or longer.�
cause-specific hospitalizationfigure 6.7 All-cause hospitalizations in patients age 20–44 and those 75 and older have been nearly equal since the beginning of the de-cade, at 2.�2 admissions per patient year.� Admissions for cardiovas-cular disease, in contrast, rise with age, while the youngest patients have the highest rates of admission for infection due to internal de-vices.� figure 6.9 Rates of inpatient vascular access placements—overall and for catheters and grafts—continue to fall, as more procedures are performed on an outpatient basis.�
overall mortalityfigure 6.12 Among ESRD patients 65 and older, mortality rates are six times higher than in the general population; for patients younger than 20, in contrast, rates are not quite three times as high.� figure 6.14 Since 1985, mortality rates in patients who have had ESRD less than two years have fallen 27 percent, while rates for those of older vintage (five or more years) have increased 7 percent.� figure 6.17 Five years after a diagnosis of heart disease, the probability of survival in dialysis patients is only 0.�18, compared to 0.�64 in the general popu-lation and 0.�47 in transplant patients.�
cause-specific mortalitytable 6.e In the first three months of ESRD therapy, African American dialysis patients are 17 percent less likely to die of cardiovascular dis-ease than are their white counterparts, and 16 percent less likely to die within the first year.� figure 6.20 Cardiovascular mortality at one year has fallen 16–17 percent since 1995 for patients age 20–74, and 11.�6 percent for those age 75 and older.�
disability in CKD & ESRD patientsfigure 6.23 Dementia is the most common disabili-ty among CKD patients, at 10.�1 percent among all ages, rising to 21.�3 percent among those 85 years and older.� The prevalence of dementia among ESRD patients is about half as common as in the CKD population, likely due to severe under-detection and diagnosis of dementia in the dialysis population.� De-mentia is three times more common among hemodialysis patients compared to peritoneal patients, and four times more common than in the transplant population.�
expenditures & mortality in patients with disabilitiesfigure 6.28 Among incident dialysis patients in 2004, amputation was the most costly disability regardless of diabetic status, with associ-ated costs of $122,000 for patients with diabetes—approximately $20,000 higher than in patients with no diabetes.� Costs for limb paresis/paralysis are $102,590 and $90,900, respectively, in patients with or without diabetes, and for diabetic patients with dementia are approximately 5 percent higher than in those with no diabetes.�
effects of Hurricane Katrina on patient outcomesfigures 6.37–38 Mortality rates increased after Katrina in both the di-alysis and general Medicare populations.� Katrina victims on dialysis, however, experienced a larger increase in mortality after the event compared to patients in the general Medicare population.�
chapter summary
maps National means & patient populations for maps can be found in the Excel file for this chapter—on our website at www.usrds.org, & also on the CD-ROM included at the back of this book.
6154