Monthly Seasonal Factors of Selected Economic Time Series*
12
ARTICLE RBI Bulletin September 2015 73 Analysis of seasonal behavior helps in differentiating between the seasonal changes and long-run changes of economic time series, which is useful for understanding the underlying economic phenomenon. This article presents the estimated monthly seasonal factors of selected 85 economic/financial time series covering five broad sectors, namely, Monetary and Banking; Price; Industrial Production; External Trade and Services Sector, over the period 2005-06 to 2014-15. Analysis of average seasonal factors during the last 10 years (2005- 06 to 2014-15) revealed that the seasonal peak occurred during March-May for majority of monetary and banking indicators and Industrial production. Seasonal variation was found to be higher among sub-group (NIC 2 digit) level items of IIP-manufacturing and ‘coal production’. Seasonal variation was found to be minimal in CPI (AL, RL and IW) and WPI-all commodities. WPI-food article was, however, found to have higher seasonal variation with seasonal peak in October due to festive season. On the other hand, WPI-manufactured items indicated very low variation in seasonal factors and the seasonal peak occurred in May. Among service sector indicators like ‘sales of commercial motor vehicles’ and ‘production of commercial motor vehicles’ exhibited high seasonal variation. Seasonal fluctuation of monetary and banking series was found to have moderated during the last 10 years (2005-06 to 2014-15). Out of broad categories of IIP, seasonal variation increased for ‘consumer goods’ (durables and non-durables), ‘mining’, ‘manufacturing’ and ‘electricity’. Further, similar variation was observed in ‘cement production’, ‘coal production’, ‘crude oil production’ and ‘petroleum refinery production’. Among WPI items, seasonal variation of ‘food items’ increased significantly. During 2014-15, the seasonal peak and trough was found to have shifted by one month for majority of series though * Prepared in the Modeling and Forecasting Division of the Department of Statistics and Information Management, Reserve Bank of India, Mumbai. 1 The previous article in the series was published in October 2014 issue of the Reserve Bank of India, Bulletin 2 http://www.census.gov/srd/www/x13as/ Monthly Seasonal Factors of Selected Economic Time Series* seasonal variation remained same compared to the last five years (2009-10 to 2013-14). Economic variables, when measured at a frequency less than a year (e.g., weekly, monthly, quarterly etc.), may exhibit seasonal fluctuations around its annual trend. Such seasonal variations can occur due to climatic conditions, production cycle characteristics, seasonal nature of economic activity, festivals, vacation practices etc. Analysis of its direction and magnitude is useful in interpretation of movements of economic variables over time. Seasonal adjustment, i.e. , removal of seasonal effects, helps in bringing out long-run changes in the variables and is useful from the policy perspective in understanding the underlying economic phenomenon. Prior knowledge of seasonal fluctuations also allows the economic agents to setup policies or measurements to attenuate the impact. Towards this objective, monthly seasonal factors for selected economic and financial time series of the Indian economy are being regularly published in the RBI Bulletin since 1980 1 . 2. Data Coverage and Methodology For estimating and analysing the seasonal factors, 85 monthly economic/financial time series in the Indian context, covering (i) Monetary and Banking Indicators (17 series); (ii) Wholesale Price Index (WPI) (26 series); (iii) Consumer Price Index (CPI) (3 series); (iv) Industrial Production (29 series); (v) External Trade Sector (3 series) and (vi) Service Sector Indicators (7 series) have been considered in this article. The reference period was broadly considered as April 1994 to March 2015, i.e., last 20 years. For some series, the reference period was 10 years depending on the availability of consistent time series data. The seasonal factors have been estimated using X-13ARIMA-SEATS software package, developed by the US Bureau of Census 2 , taking care of Diwali as major
Transcript of Monthly Seasonal Factors of Selected Economic Time Series*

ARTICLE
RBI Bulletin September 2015 73
Monthly Seasonal Factors of Selected Economic Time Series
Analysis of seasonal behavior helps in differentiating between the seasonal changes and long-run changes of economic time series, which is useful for understanding the underlying economic phenomenon. This article presents the estimated monthly seasonal factors of selected 85 economic/financial time series covering five broad sectors, namely, Monetary and Banking; Price; Industrial Production; External Trade and Services Sector, over the period 2005-06 to 2014-15. Analysis of average seasonal factors during the last 10 years (2005-06 to 2014-15) revealed that the seasonal peak occurred during March-May for majority of monetary and banking indicators and Industrial production. Seasonal variation was found to be higher among sub-group (NIC 2 digit) level items of IIP-manufacturing and ‘coal production’. Seasonal variation was found to be minimal in CPI (AL, RL and IW) and WPI-all commodities. WPI-food article was, however, found to have higher seasonal variation with seasonal peak in October due to festive season. On the other hand, WPI-manufactured items indicated very low variation in seasonal factors and the seasonal peak occurred in May. Among service sector indicators like ‘sales of commercial motor vehicles’ and ‘production of commercial motor vehicles’ exhibited high seasonal variation. Seasonal fluctuation of monetary and banking series was found to have moderated during the last 10 years (2005-06 to 2014-15). Out of broad categories of IIP, seasonal variation increased for ‘consumer goods’ (durables and non-durables), ‘mining’, ‘manufacturing’ and ‘electricity’. Further, similar variation was observed in ‘cement production’, ‘coal production’, ‘crude oil production’ and ‘petroleum refinery production’. Among WPI items, seasonal variation of ‘food items’ increased significantly. During 2014-15, the seasonal peak and trough was found to have shifted by one month for majority of series though
* Prepared in the Modeling and Forecasting Division of the Department of Statistics and Information Management, Reserve Bank of India, Mumbai.
1 The previous article in the series was published in October 2014 issue of the Reserve Bank of India, Bulletin2 http://www.census.gov/srd/www/x13as/
Monthly Seasonal Factors of Selected Economic Time Series*
seasonal variation remained same compared to the last five years (2009-10 to 2013-14).
Economic variables, when measured at a frequency less than a year (e.g., weekly, monthly, quarterly etc.), may exhibit seasonal fl uctuations around its annual trend. Such seasonal variations can occur due to climatic conditions, production cycle characteristics, seasonal nature of economic activity, festivals, vacation practices etc. Analysis of its direction and magnitude is useful in interpretation of movements of economic variables over time. Seasonal adjustment, i.e., removal of seasonal effects, helps in bringing out long-run changes in the variables and is useful from the policy perspective in understanding the underlying economic phenomenon. Prior knowledge of seasonal fl uctuations also allows the economic agents to setup policies or measurements to attenuate the impact. Towards this objective, monthly seasonal factors for selected economic and financial time series of the Indian economy are being regularly published in the RBI Bulletin since 19801.
2. Data Coverage and Methodology
For estimating and analysing the seasonal factors, 85 monthly economic/fi nancial time series in the Indian context, covering (i) Monetary and Banking Indicators (17 series); (ii) Wholesale Price Index (WPI) (26 series); (iii) Consumer Price Index (CPI) (3 series); (iv) Industrial Production (29 series); (v) External Trade Sector (3 series) and (vi) Service Sector Indicators (7 series) have been considered in this article.
The reference period was broadly considered as April 1994 to March 2015, i.e., last 20 years. For some series, the reference period was 10 years depending on the availability of consistent time series data.
The seasonal factors have been estimated using X-13ARIMA-SEATS software package, developed by the US Bureau of Census2, taking care of Diwali as major

ARTICLE
RBI Bulletin September 201574
Monthly Seasonal Factors of Selected Economic Time Series
festival as well as trading day effects. The seasonality of the series is further subjected to various parametric and non-parametric statistical test procedures for their statistical signifi cance.
3. Salient Findings
3.1 Seasonal Variation during Last Ten Years (2005-06 to 2014-15)
The average monthly seasonal factors over the last ten years (2005-06 to 2014-15) are presented in Table 1. The annual estimates of seasonal variation, in terms of range (difference between peak and trough values of seasonal factors (SF) during a year), during the period, are presented in Table 2. The changing pattern of seasonality in the latest period i.e., 2014-15 is provided in Table 3. The list of top-twenty and bottom-twenty series based on the average range of seasonal factors, during last fi ve years (i.e., 2010-11 to 2014-15) and the corresponding peak and trough months are presented in Table 4. The salient features of observed seasonal variation over the reference period are briefl y discussed below.
3.2 Characteristics of Seasonal Factors
3.2.1 Seasonality across Indicators
Monetary and Banking Indicators: Seasonal variation remained stable and range bound for majority of monetary and banking indicators
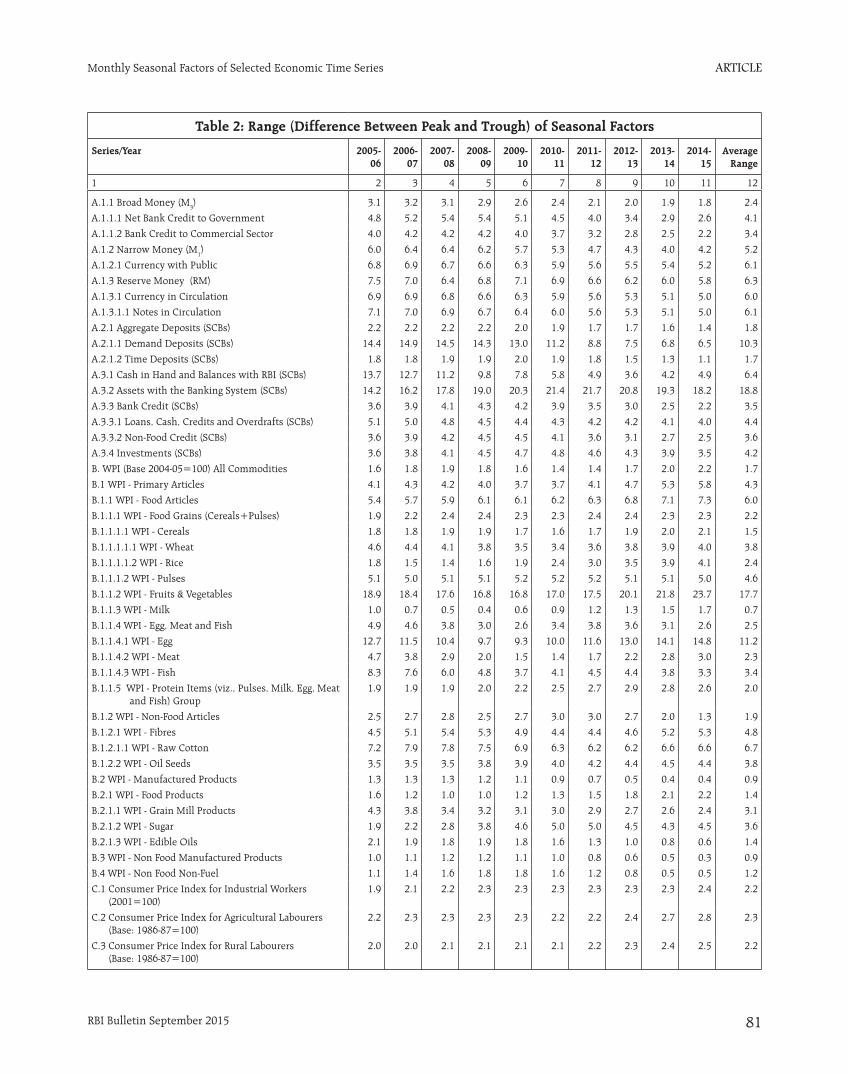
during the last 10 years. Aggregate deposits of schedule commercial banks (SCB) exhibited the lowest seasonal variation (average range =1.8), followed by broad money (average range =2.4) and bank credit (SCB) (average range = 3.5). Within aggregate deposits, seasonal variation of time deposits started moderating post 2009-10. Seasonal variation of broad money remained at a lower level than narrow money and reserve money. Assets with the banking system (SCB) and demand deposits (SCB) exhibited very high seasonal fl uctuation (Table 2). 15 out of 17 series (around 90%) have been found to have seasonal peak during March-May while seasonal trough of majority of series happened during August-September and in December (Chart 1).
Wholesale Price Index: The seasonal fl uctuation of WPI-all commodities increased marginally during the last 3 years primarily due to increase in seasonal fluctuation in prices of primary articles. Within primary articles, the seasonal variation of food articles remained much higher than non-food articles. Among food articles, WPI-fruit & vegetables and WPI-egg indicated the highest average seasonal variation of 17.7 and 11.2 respectively (Table 2). On the other hand, WPI-manufactured products exhibited very low seasonal fluctuation. Majority of WPI series

ARTICLE
RBI Bulletin September 2015 75
Monthly Seasonal Factors of Selected Economic Time Series
exhibited seasonal peaks in January and between
August-October while the seasonal trough was
visible in March for 10 out of 26 series (Chart 2).
Seasonal peaks of WPI-manufactured products
were observed in May whereas WPI-food articles
were found to have the highest seasonality in
October.
Consumer Price Index: The seasonal variation in
CPI series remained low. In the case of CPI for
Agricultural Labourers (AL) and Rural Labourers
(RL), similar movement in seasonal variations was
observed during the last ten years with CPI-AL
having consistently higher variation than the CPI-
RL. The seasonality of different CPI series were
marginally higher than WPI-all commodities.
However, the gap between seasonal variation of
CPI series and WPI-all commodities narrowed
down in recent times (Chart 3 & Table 2). CPI series
were found to have the highest seasonality in
October, probably due to the festive season, while
seasonal peak month for WPI occurred in August.
Industrial production: The seasonal variation was
found to be high in IIP-general index during the
last 10 years (2005-06 to 2014-15). As per use-based
classifi cation, IIP-consumer non-durable and IIP-
intermediate goods exhibited high and low
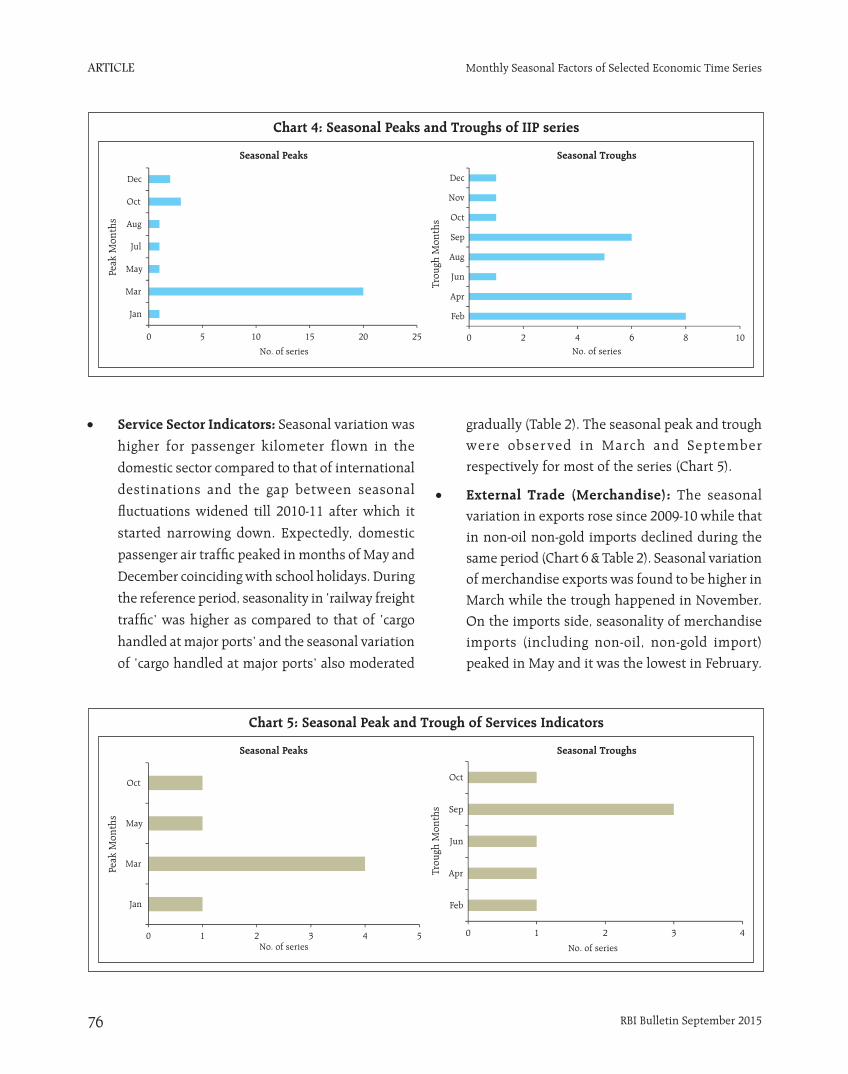
seasonal fl uctuation respectively (Table 2). IIP for mining and electricity exhibited the highest and the lowest seasonal variation respectively. Among the core-industries, seasonal patterns are found to be consistently higher for cement production compared to steel production. The highest seasonal fl uctuation was observed in March for majority of IIP series while February, April and August-September observed low level of seasonal variation for these series (Chart 4).
ARTICLE
RBI Bulletin September 201576
Monthly Seasonal Factors of Selected Economic Time Series
Service Sector Indicators: Seasonal variation was
higher for passenger kilometer flown in the
domestic sector compared to that of international
destinations and the gap between seasonal
fl uctuations widened till 2010-11 after which it
started narrowing down. Expectedly, domestic
passenger air traffi c peaked in months of May and
December coinciding with school holidays. During
the reference period, seasonality in ‘railway freight
traffi c’ was higher as compared to that of ‘cargo
handled at major ports’ and the seasonal variation
of ‘cargo handled at major ports’ also moderated
gradually (Table 2). The seasonal peak and trough were observed in March and September respectively for most of the series (Chart 5).
External Trade (Merchandise): The seasonal variation in exports rose since 2009-10 while that in non-oil non-gold imports declined during the same period (Chart 6 & Table 2). Seasonal variation of merchandise exports was found to be higher in March while the trough happened in November. On the imports side, seasonality of merchandise imports (including non-oil, non-gold import) peaked in May and it was the lowest in February.

ARTICLE
RBI Bulletin September 2015 77
Monthly Seasonal Factors of Selected Economic Time Series
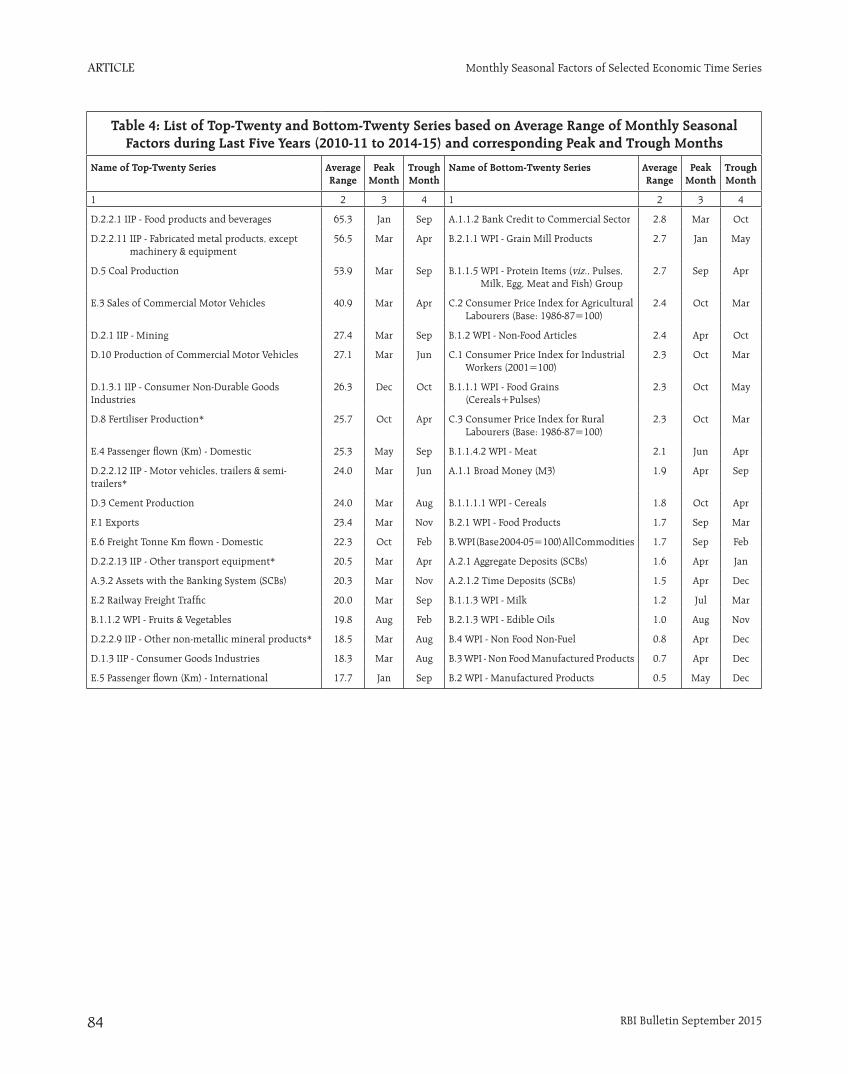
3.2.2 Indicators with High and Low Seasonality
Based on the average range of monthly seasonal factors during last fi ve years (i.e., 2010-11 to 2014-15), external trade and service sector indicators have exhibited highest seasonal volatility followed by industrial production (IIP General and its components) while seasonal variations of WPI and CPI have been found to be lower than other series. Money and banking series have shown lower seasonal variability relatively. Comparing seasonal variability of all 85 series, ‘IIP-Food products and beverages’ (Peak seasonal factor value of 134.8 in January vis-à-vis trough value 69.5 in September), ‘IIP-fabricated metal products, except machinery & equipment’ (Peak seasonal factor value of 139.7 in March vis-à-vis trough value 83.2 in April), ‘coal production’ (Peak seasonal factor value of 135.8 in March vis-à-vis trough value 81.9 in September), ‘sales of commercial motor vehicles’ (Peak seasonal factor value of 128.2 in March vis-à-vis trough value 87.3 in September) and ‘production of commercial motor vehicles’ (Peak seasonal factor value of 116.8 in March vis-à-vis trough value 89.5 in June) have exhibited high seasonal variation. On the other hand, ‘WPI-manufactured products’, ‘WPI-non food manufactured products’, ‘WPI-edible oil’, and ’WPI-milk’ have shown low seasonal variation (Table 4).
3.3 Changing Seasonality
3.3.1 Pattern in Seasonal Fluctuation over Last 10 Years
Seasonal fl uctuations in some of the indicators were found to be varying over past 10 years and also the pattern of change differed among indicators. A regression based test3 indicates that seasonal fl uctuation moderated in 39 series, 30 series exhibited increased volatility of seasonal component and remaining 16 series maintained the same level of volatility in terms of seasonality over the years (Chart 7). Out of these series, seasonal fl uctuation of monetary and banking series moderated or remained same over last 10 years. Among the broad categories of IIP, seasonal variation increased for ‘consumer goods’ (durables and non-durables), ‘mining’, ‘manufacturing’ and ‘electricity’. In the core industries, similar pattern was observed in ‘cement production’, ‘coal production’, ‘crude oil production’, and ‘petroleum refinery production’. Among WPI items, seasonal variation of ‘food items’
increased signifi cantly during the last 10 years.
3 Seasonal fl uctuation has been regressed over time and the signifi cance of the estimated time coeffi cient along with sign of the coeffi cient has been checked.
ARTICLE
RBI Bulletin September 201578
Monthly Seasonal Factors of Selected Economic Time Series
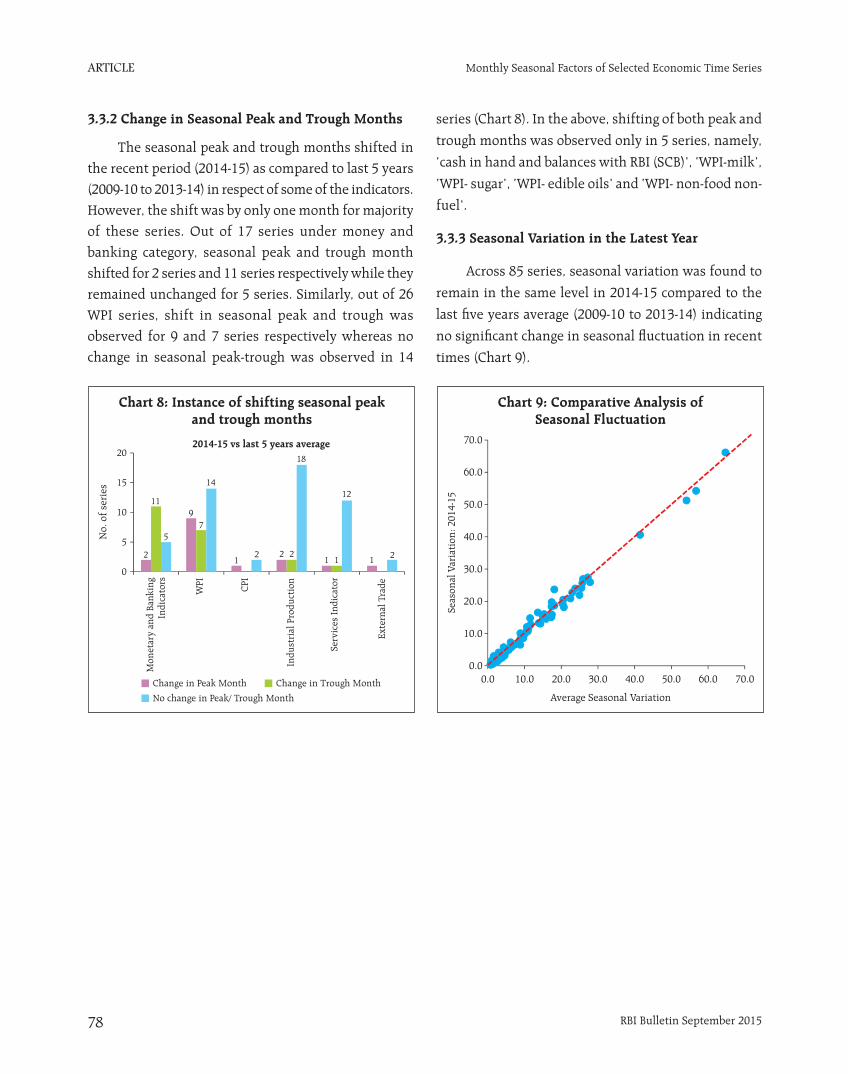
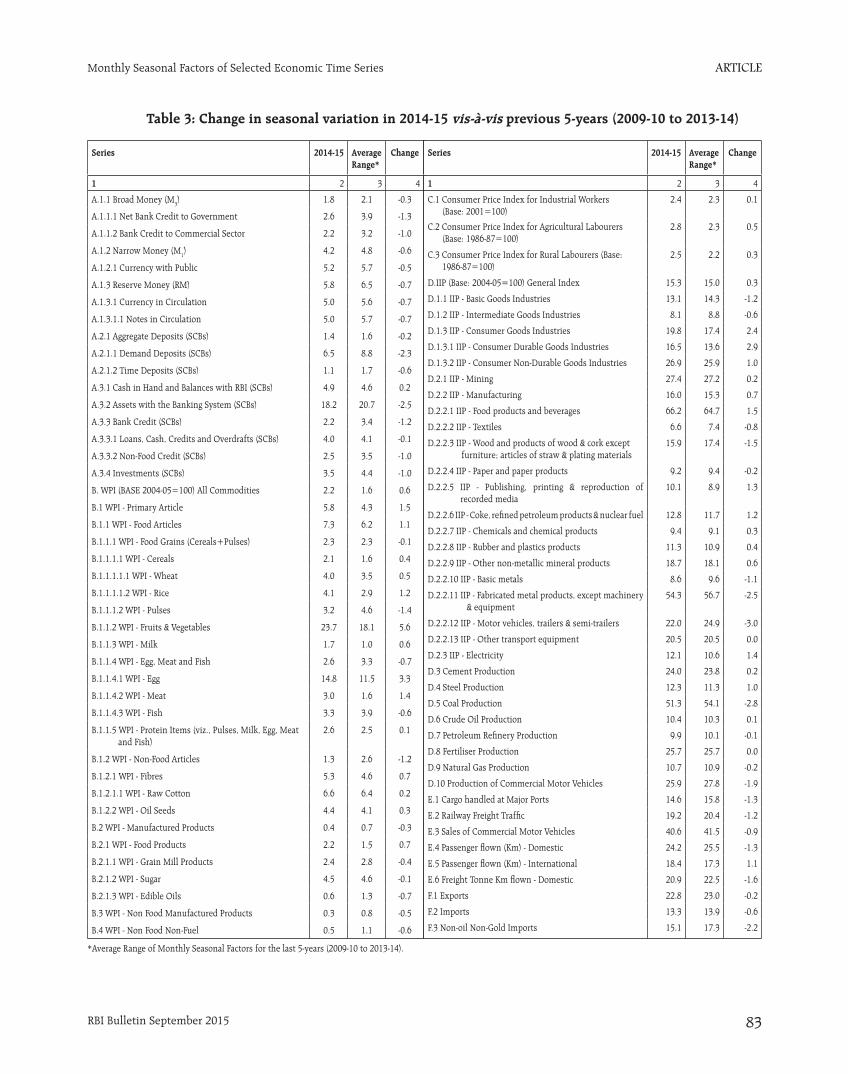
3.3.2 Change in Seasonal Peak and Trough Months
The seasonal peak and trough months shifted in the recent period (2014-15) as compared to last 5 years (2009-10 to 2013-14) in respect of some of the indicators. However, the shift was by only one month for majority of these series. Out of 17 series under money and banking category, seasonal peak and trough month shifted for 2 series and 11 series respectively while they remained unchanged for 5 series. Similarly, out of 26 WPI series, shift in seasonal peak and trough was observed for 9 and 7 series respectively whereas no change in seasonal peak-trough was observed in 14
series (Chart 8). In the above, shifting of both peak and
trough months was observed only in 5 series, namely,
‘cash in hand and balances with RBI (SCB)’, ‘WPI-milk’,
‘WPI- sugar’, ‘WPI- edible oils’ and ‘WPI- non-f ood non-
fuel’.
3.3.3 Seasonal Variation in the Latest Year
Across 85 series, seasonal variation was found to
remain in the same level in 2014-15 compared to the
last fi ve years average (2009-10 to 2013-14) indicating
no signifi cant change in seasonal fl uctuation in recent
times (Chart 9).
ARTICLE
RBI Bulletin September 2015 79
Monthly Seasonal Factors of Selected Economic Time Series
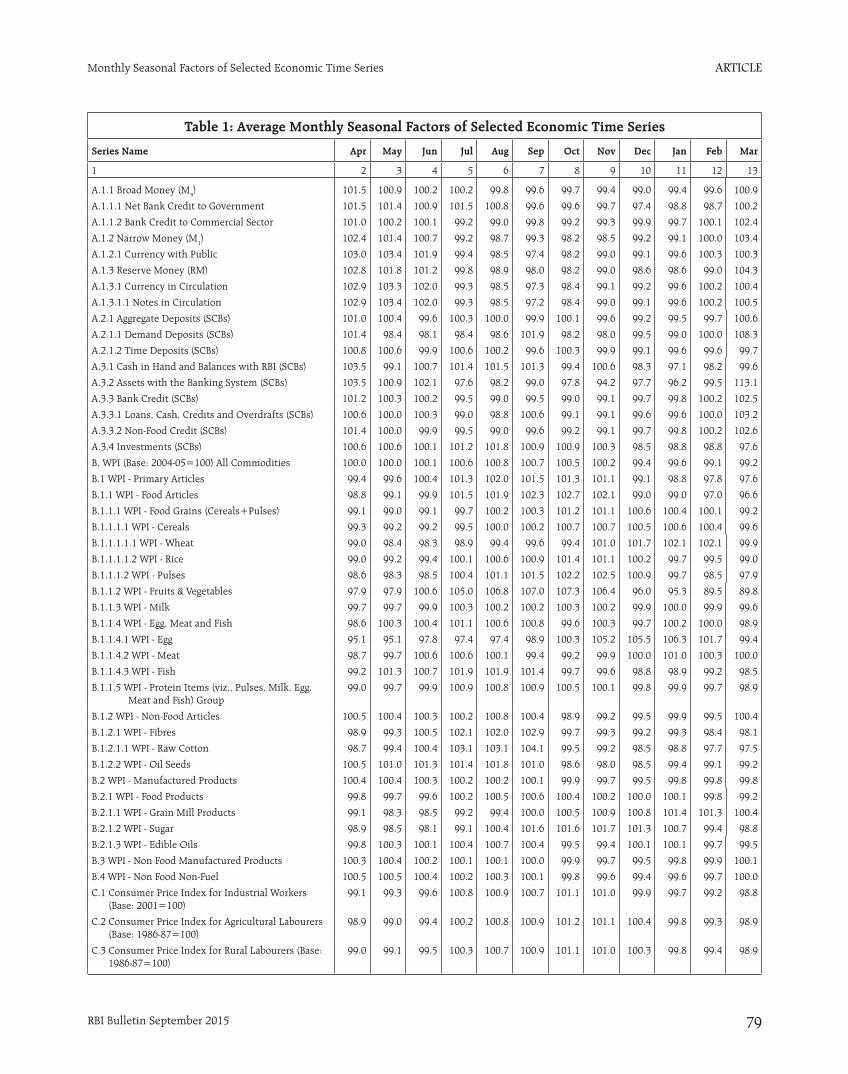
Table 1: Average Monthly Seasonal Factors of Selected Economic Time Series
Series Name Apr May Jun Jul Aug Sep Oct Nov Dec Jan Feb Mar
1 2 3 4 5 6 7 8 9 10 11 12 13
A.1.1 Broad Money (M3) 101.5 100.9 100.2 100.2 99.8 99.6 99.7 99.4 99.0 99.4 99.6 100.9
A.1.1.1 Net Bank Credit to Government 101.5 101.4 100.9 101.5 100.8 99.6 99.6 99.7 97.4 98.8 98.7 100.2
A.1.1.2 Bank Credit to Commercial Sector 101.0 100.2 100.1 99.2 99.0 99.8 99.2 99.3 99.9 99.7 100.1 102.4
A.1.2 Narrow Money (M1) 102.4 101.4 100.7 99.2 98.7 99.3 98.2 98.5 99.2 99.1 100.0 103.4
A.1.2.1 Currency with Public 103.0 103.4 101.9 99.4 98.5 97.4 98.2 99.0 99.1 99.6 100.3 100.3
A.1.3 Reserve Money (RM) 102.8 101.8 101.2 99.8 98.9 98.0 98.2 99.0 98.6 98.6 99.0 104.3
A.1.3.1 Currency in Circulation 102.9 103.3 102.0 99.3 98.5 97.3 98.4 99.1 99.2 99.6 100.2 100.4
A.1.3.1.1 Notes in Circulation 102.9 103.4 102.0 99.3 98.5 97.2 98.4 99.0 99.1 99.6 100.2 100.5
A.2.1 Aggregate Deposits (SCBs) 101.0 100.4 99.6 100.3 100.0 99.9 100.1 99.6 99.2 99.5 99.7 100.6
A.2.1.1 Demand Deposits (SCBs) 101.4 98.4 98.1 98.4 98.6 101.9 98.2 98.0 99.5 99.0 100.0 108.3
A.2.1.2 Time Deposits (SCBs) 100.8 100.6 99.9 100.6 100.2 99.6 100.3 99.9 99.1 99.6 99.6 99.7
A.3.1 Cash in Hand and Balances with RBI (SCBs) 103.5 99.1 100.7 101.4 101.5 101.3 99.4 100.6 98.3 97.1 98.2 99.6
A.3.2 Assets with the Banking System (SCBs) 103.5 100.9 102.1 97.6 98.2 99.0 97.8 94.2 97.7 96.2 99.5 113.1
A.3.3 Bank Credit (SCBs) 101.2 100.3 100.2 99.5 99.0 99.5 99.0 99.1 99.7 99.8 100.2 102.5
A.3.3.1 Loans, Cash, Credits and Overdrafts (SCBs) 100.6 100.0 100.3 99.0 98.8 100.6 99.1 99.1 99.6 99.6 100.0 103.2
A.3.3.2 Non-Food Credit (SCBs) 101.4 100.0 99.9 99.5 99.0 99.6 99.2 99.1 99.7 99.8 100.2 102.6
A.3.4 Investments (SCBs) 100.6 100.6 100.1 101.2 101.8 100.9 100.9 100.3 98.5 98.8 98.8 97.6
B. WPI (Base: 2004-05=100) All Commodities 100.0 100.0 100.1 100.6 100.8 100.7 100.5 100.2 99.4 99.6 99.1 99.2
B.1 WPI - Primary Articles 99.4 99.6 100.4 101.3 102.0 101.5 101.3 101.1 99.1 98.8 97.8 97.6
B.1.1 WPI - Food Articles 98.8 99.1 99.9 101.5 101.9 102.3 102.7 102.1 99.0 99.0 97.0 96.6
B.1.1.1 WPI - Food Grains (Cereals+Pulses) 99.1 99.0 99.1 99.7 100.2 100.3 101.2 101.1 100.6 100.4 100.1 99.2
B.1.1.1.1 WPI - Cereals 99.3 99.2 99.2 99.5 100.0 100.2 100.7 100.7 100.5 100.6 100.4 99.6
B.1.1.1.1.1 WPI - Wheat 99.0 98.4 98.3 98.9 99.4 99.6 99.4 101.0 101.7 102.1 102.1 99.9
B.1.1.1.1.2 WPI - Rice 99.0 99.2 99.4 100.1 100.6 100.9 101.4 101.1 100.2 99.7 99.5 99.0
B.1.1.1.2 WPI - Pulses 98.6 98.3 98.5 100.4 101.1 101.5 102.2 102.5 100.9 99.7 98.5 97.9
B.1.1.2 WPI - Fruits & Vegetables 97.9 97.9 100.6 105.0 106.8 107.0 107.3 106.4 96.0 95.3 89.5 89.8
B.1.1.3 WPI - Milk 99.7 99.7 99.9 100.3 100.2 100.2 100.3 100.2 99.9 100.0 99.9 99.6
B.1.1.4 WPI - Egg, Meat and Fish 98.6 100.3 100.4 101.1 100.6 100.8 99.6 100.3 99.7 100.2 100.0 98.9
B.1.1.4.1 WPI - Egg 95.1 95.1 97.8 97.4 97.4 98.9 100.3 105.2 105.5 106.3 101.7 99.4
B.1.1.4.2 WPI - Meat 98.7 99.7 100.6 100.6 100.1 99.4 99.2 99.9 100.0 101.0 100.3 100.0
B.1.1.4.3 WPI - Fish 99.2 101.3 100.7 101.9 101.9 101.4 99.7 99.6 98.8 98.9 99.2 98.5
B.1.1.5 WPI - Protein Items (viz., Pulses, Milk, Egg, Meat and Fish) Group
99.0 99.7 99.9 100.9 100.8 100.9 100.5 100.1 99.8 99.9 99.7 98.9
B.1.2 WPI - Non-Food Articles 100.5 100.4 100.3 100.2 100.8 100.4 98.9 99.2 99.5 99.9 99.5 100.4
B.1.2.1 WPI - Fibres 98.9 99.3 100.5 102.1 102.0 102.9 99.7 99.3 99.2 99.3 98.4 98.1
B.1.2.1.1 WPI - Raw Cotton 98.7 99.4 100.4 103.1 103.1 104.1 99.5 99.2 98.5 98.8 97.7 97.5
B.1.2.2 WPI - Oil Seeds 100.5 101.0 101.3 101.4 101.8 101.0 98.6 98.0 98.5 99.4 99.1 99.2
B.2 WPI - Manufactured Products 100.4 100.4 100.3 100.2 100.2 100.1 99.9 99.7 99.5 99.8 99.8 99.8
B.2.1 WPI - Food Products 99.8 99.7 99.6 100.2 100.5 100.6 100.4 100.2 100.0 100.1 99.8 99.2
B.2.1.1 WPI - Grain Mill Products 99.1 98.3 98.5 99.2 99.4 100.0 100.5 100.9 100.8 101.4 101.3 100.4
B.2.1.2 WPI - Sugar 98.9 98.5 98.1 99.1 100.4 101.6 101.6 101.7 101.3 100.7 99.4 98.8
B.2.1.3 WPI - Edible Oils 99.8 100.3 100.1 100.4 100.7 100.4 99.5 99.4 100.1 100.1 99.7 99.5
B.3 WPI - Non Food Manufactured Products 100.3 100.4 100.2 100.1 100.1 100.0 99.9 99.7 99.5 99.8 99.9 100.1
B.4 WPI - Non Food Non-Fuel 100.5 100.5 100.4 100.2 100.3 100.1 99.8 99.6 99.4 99.6 99.7 100.0
C.1 Consumer Price Index for Industrial Workers (Base: 2001=100)
99.1 99.3 99.6 100.8 100.9 100.7 101.1 101.0 99.9 99.7 99.2 98.8
C.2 Consumer Price Index for Agricultural Labourers (Base: 1986-87=100)
98.9 99.0 99.4 100.2 100.8 100.9 101.2 101.1 100.4 99.8 99.3 98.9
C.3 Consumer Price Index for Rural Labourers (Base: 1986-87=100)
99.0 99.1 99.5 100.3 100.7 100.9 101.1 101.0 100.3 99.8 99.4 98.9

ARTICLE
RBI Bulletin September 201580
Monthly Seasonal Factors of Selected Economic Time Series
Table 1: Average Monthly Seasonal Factors of Selected Economic Time Series (Concld.)
Series/Month Apr May Jun Jul Aug Sep Oct Nov Dec Jan Feb Mar
1 2 3 4 5 6 7 8 9 10 11 12 13
D. IIP (Base 2004-05 = 100) General Index 96.7 98.6 98.0 98.1 95.6 97.2 98.8 98.2 104.5 104.6 99.6 110.1
D.1.1 IIP - Basic Goods Industries 98.2 101.0 98.2 98.3 97.6 95.0 99.7 97.9 103.2 104.5 97.6 108.9
D.1.2 IIP - Intermediate Goods Industries 96.7 100.5 99.4 101.4 100.1 98.3 99.2 97.9 102.6 101.2 96.9 105.9
D.1.3 IIP - Consumer Goods Industries 99.1 98.5 97.0 97.5 92.5 95.0 96.2 95.9 105.8 108.9 104.5 108.9
D.1.3.1 IIP - Consumer Durable Goods Industries 99.0 100.8 98.7 100.7 96.1 101.5 105.8 99.3 93.0 100.1 99.5 105.3
D.1.3.2 IIP - Consumer Non-Durable Goods Industries 98.5 96.4 95.7 95.1 90.3 90.2 89.8 95.9 114.8 114.3 109.0 109.9
D.2.1 IIP - Mining 97.7 100.2 95.8 93.8 91.9 90.4 98.1 99.8 106.6 108.1 101.6 116.5
D.2.2 IIP - Manufacturing 96.1 97.9 97.8 98.3 95.8 97.9 98.6 97.9 104.7 104.5 100.2 110.3
D.2.2.1 IIP - Food products and beverages 97.5 90.1 89.2 82.0 72.3 70.1 76.8 97.6 134.6 135.6 126.9 126.7
D.2.2.2 IIP - Textiles 98.6 99.8 98.6 102.4 102.5 99.9 100.7 99.5 101.5 101.3 94.9 100.2
D.2.2.3 IIP - Wood and products of wood & cork except furniture; articles of straw & plating materials
90.2 101.8 98.0 100.7 99.6 96.2 95.6 98.9 108.6 101.0 104.5 105.0
D.2.2.4 IIP - Paper and paper products 96.9 101.6 98.6 102.4 101.4 99.9 100.7 98.3 100.0 99.4 95.5 105.4
D.2.2.5 IIP - Publishing, printing & reproduction of recorded media
98.6 101.3 98.8 103.0 101.3 98.3 103.1 99.4 102.3 99.8 94.4 99.8
D.2.2.6 IIP - Coke, refi ned petroleum products & nuclear fuel
94.6 98.8 100.0 101.8 100.6 96.4 101.0 97.9 102.4 104.1 96.7 106.0
D.2.2.7 IIP - Chemicals and chemical products 96.1 100.7 102.1 103.1 102.3 101.3 100.4 99.3 101.4 99.6 93.7 100.0
D.2.2.8 IIP - Rubber and plastics products 99.2 103.7 102.3 100.1 95.5 97.2 98.3 98.7 101.7 101.1 96.6 105.7
D.2.2.9 IIP - Other non-metallic mineral products 101.4 101.7 98.3 99.0 94.3 94.2 100.2 94.7 102.5 103.3 99.1 111.4
D.2.2.10 IIP - Basic metals 98.1 100.1 98.4 99.1 100.2 98.0 100.4 98.2 101.4 102.2 97.1 106.9
D.2.2.11 IIP - Fabricated metal products, except machinery & equipment
84.2 91.2 96.9 95.3 96.9 102.2 94.7 97.4 104.7 99.0 100.0 137.9
D.2.2.12 IIP - Motor vehicles, trailers & semi-trailers 96.9 97.4 90.0 98.5 97.3 98.1 101.9 100.7 92.0 105.9 105.6 115.2
D.2.2.13 IIP - Other transport equipment 91.1 95.4 94.8 97.7 98.9 103.8 110.9 102.5 96.1 100.4 97.8 111.0
D.2.3 IIP - Electricity 100.3 104.1 99.4 100.7 100.3 97.7 102.3 96.1 99.8 101.3 93.8 103.8
D.3 Cement Production 104.8 103.9 99.5 96.8 90.3 91.7 98.7 92.4 102.0 105.8 101.0 113.2
D.4 Steel Production 97.5 101.7 97.6 98.6 100.2 97.4 99.3 96.1 101.6 104.6 98.2 106.8
D.5 Coal Production 90.7 93.1 88.6 86.0 84.8 83.1 97.4 103.2 113.0 116.7 110.0 134.1
D.6 Crude Oil Production 99.0 101.3 99.2 101.3 100.7 97.9 102.0 98.9 102.3 101.6 92.7 103.0
D.7 Petroleum Refi nery Production 96.1 100.1 99.7 101.7 101.0 95.7 100.6 98.9 102.1 103.7 96.2 104.5
D.8 Fertiliser Production 82.1 94.8 99.3 105.9 106.6 104.2 108.2 106.1 107.9 102.5 93.6 88.5
D.9 Natural Gas Production 97.6 101.3 98.5 101.9 100.9 98.0 102.5 99.6 102.7 102.2 92.0 102.8
D.10 Production of Commercial Motor Vehicles 93.0 94.1 89.6 97.1 97.7 99.9 100.5 102.3 95.2 106.6 105.4 117.4
E.1 Cargo handled at Major Ports 99.7 103.0 95.5 97.8 97.2 92.8 99.5 99.7 103.2 105.3 96.2 109.3
E.2 Railway Freight Traffi c 97.7 101.1 96.7 97.9 95.4 92.9 97.5 98.1 104.2 106.6 98.4 113.5
E.3 Sales of Commercial Motor Vehicles 84.1 89.5 96.2 92.9 95.3 106.3 100.1 95.6 99.8 104.8 105.0 128.6
E.4 Passenger fl own (Km) - Domestic 101.1 112.4 104.4 95.5 93.3 88.5 98.7 100.2 108.8 103.3 96.0 97.6
E.5 Passenger fl own (Km) - International 97.0 100.4 100.8 106.0 104.0 92.5 92.3 94.8 106.2 110.0 94.9 101.5
E.6 Freight Tonne Km fl own - Domestic 93.5 99.5 97.0 101.4 102.8 104.1 111.5 101.5 101.0 95.0 91.2 100.9
F.1 Exports 97.4 100.3 100.0 99.4 97.7 101.4 98.1 93.0 101.2 100.0 95.8 115.4
F.2 Imports 100.1 106.6 99.1 103.0 99.3 103.6 105.9 98.4 97.1 98.4 89.8 99.1
F.3 Non-Oil Non-Gold Imports 96.4 105.8 102.6 102.6 99.6 102.0 105.6 101.5 101.3 98.3 87.3 96.7
ARTICLE
RBI Bulletin September 2015 81
Monthly Seasonal Factors of Selected Economic Time Series
Table 2: Range (Difference Between Peak and Trough) of Seasonal Factors
Series/Year 2005-06
2006-07
2007-08
2008-09
2009-10
2010-11
2011-12
2012-13
2013-14
2014-15
Average Range
1 2 3 4 5 6 7 8 9 10 11 12
A.1.1 Broad Money (M3) 3.1 3.2 3.1 2.9 2.6 2.4 2.1 2.0 1.9 1.8 2.4
A.1.1.1 Net Bank Credit to Government 4.8 5.2 5.4 5.4 5.1 4.5 4.0 3.4 2.9 2.6 4.1
A.1.1.2 Bank Credit to Commercial Sector 4.0 4.2 4.2 4.2 4.0 3.7 3.2 2.8 2.5 2.2 3.4
A.1.2 Narrow Money (M1) 6.0 6.4 6.4 6.2 5.7 5.3 4.7 4.3 4.0 4.2 5.2
A.1.2.1 Currency with Public 6.8 6.9 6.7 6.6 6.3 5.9 5.6 5.5 5.4 5.2 6.1
A.1.3 Reserve Money (RM) 7.5 7.0 6.4 6.8 7.1 6.9 6.6 6.2 6.0 5.8 6.3
A.1.3.1 Currency in Circulation 6.9 6.9 6.8 6.6 6.3 5.9 5.6 5.3 5.1 5.0 6.0
A.1.3.1.1 Notes in Circulation 7.1 7.0 6.9 6.7 6.4 6.0 5.6 5.3 5.1 5.0 6.1
A.2.1 Aggregate Deposits (SCBs) 2.2 2.2 2.2 2.2 2.0 1.9 1.7 1.7 1.6 1.4 1.8
A.2.1.1 Demand Deposits (SCBs) 14.4 14.9 14.5 14.3 13.0 11.2 8.8 7.5 6.8 6.5 10.3
A.2.1.2 Time Deposits (SCBs) 1.8 1.8 1.9 1.9 2.0 1.9 1.8 1.5 1.3 1.1 1.7
A.3.1 Cash in Hand and Balances with RBI (SCBs) 13.7 12.7 11.2 9.8 7.8 5.8 4.9 3.6 4.2 4.9 6.4
A.3.2 Assets with the Banking System (SCBs) 14.2 16.2 17.8 19.0 20.3 21.4 21.7 20.8 19.3 18.2 18.8
A.3.3 Bank Credit (SCBs) 3.6 3.9 4.1 4.3 4.2 3.9 3.5 3.0 2.5 2.2 3.5
A.3.3.1 Loans, Cash, Credits and Overdrafts (SCBs) 5.1 5.0 4.8 4.5 4.4 4.3 4.2 4.2 4.1 4.0 4.4
A.3.3.2 Non-Food Credit (SCBs) 3.6 3.9 4.2 4.5 4.5 4.1 3.6 3.1 2.7 2.5 3.6
A.3.4 Investments (SCBs) 3.6 3.8 4.1 4.5 4.7 4.8 4.6 4.3 3.9 3.5 4.2
B. WPI (Base 2004-05=100) All Commodities 1.6 1.8 1.9 1.8 1.6 1.4 1.4 1.7 2.0 2.2 1.7
B.1 WPI - Primary Articles 4.1 4.3 4.2 4.0 3.7 3.7 4.1 4.7 5.3 5.8 4.3
B.1.1 WPI - Food Articles 5.4 5.7 5.9 6.1 6.1 6.2 6.3 6.8 7.1 7.3 6.0
B.1.1.1 WPI - Food Grains (Cereals+Pulses) 1.9 2.2 2.4 2.4 2.3 2.3 2.4 2.4 2.3 2.3 2.2
B.1.1.1.1 WPI - Cereals 1.8 1.8 1.9 1.9 1.7 1.6 1.7 1.9 2.0 2.1 1.5
B.1.1.1.1.1 WPI - Wheat 4.6 4.4 4.1 3.8 3.5 3.4 3.6 3.8 3.9 4.0 3.8
B.1.1.1.1.2 WPI - Rice 1.8 1.5 1.4 1.6 1.9 2.4 3.0 3.5 3.9 4.1 2.4
B.1.1.1.2 WPI - Pulses 5.1 5.0 5.1 5.1 5.2 5.2 5.2 5.1 5.1 5.0 4.6
B.1.1.2 WPI - Fruits & Vegetables 18.9 18.4 17.6 16.8 16.8 17.0 17.5 20.1 21.8 23.7 17.7
B.1.1.3 WPI - Milk 1.0 0.7 0.5 0.4 0.6 0.9 1.2 1.3 1.5 1.7 0.7
B.1.1.4 WPI - Egg, Meat and Fish 4.9 4.6 3.8 3.0 2.6 3.4 3.8 3.6 3.1 2.6 2.5
B.1.1.4.1 WPI - Egg 12.7 11.5 10.4 9.7 9.3 10.0 11.6 13.0 14.1 14.8 11.2
B.1.1.4.2 WPI - Meat 4.7 3.8 2.9 2.0 1.5 1.4 1.7 2.2 2.8 3.0 2.3
B.1.1.4.3 WPI - Fish 8.3 7.6 6.0 4.8 3.7 4.1 4.5 4.4 3.8 3.3 3.4
B.1.1.5 WPI - Protein Items (viz., Pulses, Milk, Egg, Meat and Fish) Group
1.9 1.9 1.9 2.0 2.2 2.5 2.7 2.9 2.8 2.6 2.0
B.1.2 WPI - Non-Food Articles 2.5 2.7 2.8 2.5 2.7 3.0 3.0 2.7 2.0 1.3 1.9
B.1.2.1 WPI - Fibres 4.5 5.1 5.4 5.3 4.9 4.4 4.4 4.6 5.2 5.3 4.8
B.1.2.1.1 WPI - Raw Cotton 7.2 7.9 7.8 7.5 6.9 6.3 6.2 6.2 6.6 6.6 6.7
B.1.2.2 WPI - Oil Seeds 3.5 3.5 3.5 3.8 3.9 4.0 4.2 4.4 4.5 4.4 3.8
B.2 WPI - Manufactured Products 1.3 1.3 1.3 1.2 1.1 0.9 0.7 0.5 0.4 0.4 0.9
B.2.1 WPI - Food Products 1.6 1.2 1.0 1.0 1.2 1.3 1.5 1.8 2.1 2.2 1.4
B.2.1.1 WPI - Grain Mill Products 4.3 3.8 3.4 3.2 3.1 3.0 2.9 2.7 2.6 2.4 3.1
B.2.1.2 WPI - Sugar 1.9 2.2 2.8 3.8 4.6 5.0 5.0 4.5 4.3 4.5 3.6
B.2.1.3 WPI - Edible Oils 2.1 1.9 1.8 1.9 1.8 1.6 1.3 1.0 0.8 0.6 1.4
B.3 WPI - Non Food Manufactured Products 1.0 1.1 1.2 1.2 1.1 1.0 0.8 0.6 0.5 0.3 0.9
B.4 WPI - Non Food Non-Fuel 1.1 1.4 1.6 1.8 1.8 1.6 1.2 0.8 0.5 0.5 1.2
C.1 Consumer Price Index for Industrial Workers (2001=100)
1.9 2.1 2.2 2.3 2.3 2.3 2.3 2.3 2.3 2.4 2.2
C.2 Consumer Price Index for Agricultural Labourers (Base: 1986-87=100)
2.2 2.3 2.3 2.3 2.3 2.2 2.2 2.4 2.7 2.8 2.3
C.3 Consumer Price Index for Rural Labourers (Base: 1986-87=100)
2.0 2.0 2.1 2.1 2.1 2.1 2.2 2.3 2.4 2.5 2.2

ARTICLE
RBI Bulletin September 201582
Monthly Seasonal Factors of Selected Economic Time Series
Table 2: Range (Difference Between Peak and Trough) of Seasonal Factors (Concld.)
Series/Year 2005-06
2006-07
2007-08
2008-09
2009-10
2010-11
2011-12
2012-13
2013-14
2014-15
Average Range
1 2 3 4 5 6 7 8 9 10 11 12
D. IIP (Base 2004-05 = 100) General Index 13.9 14.1 13.9 14.2 14.5 14.8 15.1 15.2 15.3 15.3 14.5
D.1.1 IIP - Basic Goods Industries 12.4 13.2 13.8 14.3 14.6 14.8 14.6 14.1 13.6 13.1 13.8
D.1.2 IIP - Intermediate Goods Industries 9.8 10.1 10.1 9.8 9.4 9.0 8.7 8.4 8.3 8.1 9.2
D.1.3 IIP - Consumer Goods Industries 16.0 15.2 14.7 14.8 15.4 16.2 17.4 18.6 19.4 19.8 16.5
D.1.3.1 IIP - Consumer Durable Goods Industries 13.3 13.2 12.4 10.8 10.7 12.0 13.9 15.2 16.2 16.5 12.7
D.1.3.1 IIP - Consumer Non-Durable Goods Industries 22.6 23.2 23.8 24.6 25.1 25.7 25.9 26.4 26.7 26.9 25.0
D.2.1 IIP - Mining 22.7 23.9 25.0 25.8 26.5 27.0 27.5 27.6 27.6 27.4 26.1
D.2.2 IIP - Manufacturing 14.7 14.8 14.4 14.0 14.4 14.9 15.5 15.8 16.0 16.0 14.5
D.2.2.1 IIP - Food products and beverages* 68.0 67.6 66.5 65.5 64.7 64.1 64.6 65.5 66.0 66.2 65.4
D.2.2.2 IIP - Textiles* 9.0 9.0 8.8 8.3 7.8 7.6 7.6 7.5 7.0 6.6 7.6
D.2.2.3 IIP - Wood and products of wood & cork except furniture; articles of straw & plating materials*
21.1 20.8 20.1 19.5 18.8 18.4 17.6 16.7 16.0 15.9 18.4
D.2.2.4 IIP - Paper and paper products* 10.9 11.0 10.9 10.6 10.1 9.6 9.3 9.0 9.0 9.2 10.0
D.2.2.5 IIP - Publishing, printing & reproduction of recorded media*
8.6 8.6 8.5 8.3 8.2 8.3 8.9 9.3 9.8 10.1 8.7
D.2.2.6 IIP - Coke, refi ned petroleum products & nuclear fuel*
11.1 10.7 10.5 10.7 11.0 11.3 11.6 12.0 12.4 12.8 11.4
D.2.2.7 IIP - Chemicals and chemical products* 9.7 10.1 10.5 10.5 10.3 9.5 8.9 8.6 9.0 9.4 9.5
D.2.2.8 IIP - Rubber and plastics products* 8.5 8.9 9.1 9.5 10.1 10.5 11.1 11.3 11.4 11.3 10.2
D.2.2.9 IIP - Other non-metallic mineral products* 16.3 16.4 16.7 17.2 17.8 18.1 18.4 18.6 18.9 18.7 17.2
D.2.2.10 IIP - Basic metals* 10.7 10.8 10.7 10.5 10.1 10.3 10.2 9.5 8.6 8.6 9.8
D.2.2.11 IIP - Fabricated metal products, except machinery & equipment*
47.8 48.7 50.3 52.5 55.1 57.1 58.0 57.4 56.0 54.3 53.7
D.2.2.12 IIP - Motor vehicles, trailers & semi-trailers* 26.2 26.2 26.3 26.5 26.6 26.2 25.2 23.9 22.9 22.0 25.2
D.2.2.13 IIP - Other transport equipment* 24.1 23.8 22.9 21.3 20.6 20.5 20.5 20.5 20.5 20.5 19.9
D.2.3 IIP - Electricity 9.9 9.8 10.3 10.6 11.1 11.0 10.5 11.1 11.6 12.1 10.3
D.3 Cement Production 21.5 21.3 21.6 22.1 22.9 23.4 24.1 24.1 24.3 24.0 22.9
D.4 Steel Production 12.1 11.6 10.6 10.2 10.8 11.0 11.3 11.6 11.8 12.3 10.6
D.5 Coal Production 42.3 46.2 49.0 50.6 52.3 54.3 55.6 55.2 53.2 51.3 51.0
D.6 Crude Oil Production 10.1 10.1 10.2 10.1 10.2 10.3 10.5 10.4 10.5 10.4 10.2
D.7 Petroleum Refi nery Production 8.8 8.4 8.3 8.1 8.6 9.7 10.6 10.9 10.6 9.9 8.8
D.8 Fertiliser Production* 27.5 27.3 26.8 26.3 25.9 25.9 25.7 25.6 25.6 25.7 26.1
D.9 Natural Gas Production* 11.5 12.0 12.1 11.9 11.2 11.0 10.9 10.8 10.7 10.7 10.8
D.10 Production of Commercial Motor Vehicles 32.3 28.8 28.7 29.1 29.4 29.0 27.8 26.6 26.3 25.9 27.8
E.1 Cargo handled at Major Ports 18.3 18.2 17.8 17.3 16.8 16.3 15.9 15.3 14.9 14.6 16.5
E.2 Railway Freight Traffi c 20.7 21.3 21.5 21.4 21.2 20.9 20.4 20.0 19.5 19.2 20.6
E.3 Sales of Commercial Motor Vehicles 53.3 50.5 47.6 45.2 43.3 41.9 40.9 40.5 40.7 40.6 44.4
E.4 Passenger fl own (Km) - Domestic 20.7 21.1 22.6 23.8 25.3 25.9 26.1 25.4 24.8 24.2 23.9
E.5 Passenger fl own (Km) - International 20.1 19.5 18.7 18.1 17.2 17.1 17.3 17.7 18.0 18.4 17.7
E.6 Freight Tonne Km fl own - Domestic 14.8 16.6 18.5 20.3 22.0 23.3 23.3 22.4 21.4 20.9 20.4
F.1 Exports 24.4 22.1 20.2 19.9 20.8 22.4 23.9 24.2 23.7 22.8 22.4
F.2 Imports 21.9 22.6 22.1 20.4 17.4 14.7 12.9 12.1 12.5 13.3 16.8
F.3 Non-Oil Non-Gold Imports 21.0 23.5 24.6 24.0 21.0 19.1 16.8 15.4 14.6 15.1 18.6
* Seasonal adjustment for these series is based on 10 years data depending on availability. Guidelines of both, Offi ce of National Statistics (ONS), UK, and US Census Bureau, however, suggest using more than ten years data for estimating stable monthly seasonal factors.
ARTICLE
RBI Bulletin September 2015 83
Monthly Seasonal Factors of Selected Economic Time Series
Series 2014-15 Average Range*
Change
1 2 3 4
A.1.1 Broad Money (M3) 1.8 2.1 -0.3
A.1.1.1 Net Bank Credit to Government 2.6 3.9 -1.3
A.1.1.2 Bank Credit to Commercial Sector 2.2 3.2 -1.0
A.1.2 Narrow Money (M1) 4.2 4.8 -0.6
A.1.2.1 Currency with Public 5.2 5.7 -0.5
A.1.3 Reserve Money (RM) 5.8 6.5 -0.7
A.1.3.1 Currency in Circulation 5.0 5.6 -0.7
A.1.3.1.1 Notes in Circulation 5.0 5.7 -0.7
A.2.1 Aggregate Deposits (SCBs) 1.4 1.6 -0.2
A.2.1.1 Demand Deposits (SCBs) 6.5 8.8 -2.3
A.2.1.2 Time Deposits (SCBs) 1.1 1.7 -0.6
A.3.1 Cash in Hand and Balances with RBI (SCBs) 4.9 4.6 0.2
A.3.2 Assets with the Banking System (SCBs) 18.2 20.7 -2.5
A.3.3 Bank Credit (SCBs) 2.2 3.4 -1.2
A.3.3.1 Loans, Cash, Credits and Overdrafts (SCBs) 4.0 4.1 -0.1
A.3.3.2 Non-Food Credit (SCBs) 2.5 3.5 -1.0
A.3.4 Investments (SCBs) 3.5 4.4 -1.0
B. WPI (BASE 2004-05=100) All Commodities 2.2 1.6 0.6
B.1 WPI - Primary Article 5.8 4.3 1.5
B.1.1 WPI - Food Articles 7.3 6.2 1.1
B.1.1.1 WPI - Food Grains (Cereals+Pulses) 2.3 2.3 -0.1
B.1.1.1.1 WPI - Cereals 2.1 1.6 0.4
B.1.1.1.1.1 WPI - Wheat 4.0 3.5 0.5
B.1.1.1.1.2 WPI - Rice 4.1 2.9 1.2
B.1.1.1.2 WPI - Pulses 3.2 4.6 -1.4
B.1.1.2 WPI - Fruits & Vegetables 23.7 18.1 5.6
B.1.1.3 WPI - Milk 1.7 1.0 0.6
B.1.1.4 WPI - Egg, Meat and Fish 2.6 3.3 -0.7
B.1.1.4.1 WPI - Egg 14.8 11.5 3.3
B.1.1.4.2 WPI - Meat 3.0 1.6 1.4
B.1.1.4.3 WPI - Fish 3.3 3.9 -0.6
B.1.1.5 WPI - Protein Items (viz., Pulses, Milk, Egg, Meat and Fish)
2.6 2.5 0.1
B.1.2 WPI - Non-Food Articles 1.3 2.6 -1.2
B.1.2.1 WPI - Fibres 5.3 4.6 0.7
B.1.2.1.1 WPI - Raw Cotton 6.6 6.4 0.2
B.1.2.2 WPI - Oil Seeds 4.4 4.1 0.3
B.2 WPI - Manufactured Products 0.4 0.7 -0.3
B.2.1 WPI - Food Products 2.2 1.5 0.7
B.2.1.1 WPI - Grain Mill Products 2.4 2.8 -0.4
B.2.1.2 WPI - Sugar 4.5 4.6 -0.1
B.2.1.3 WPI - Edible Oils 0.6 1.3 -0.7
B.3 WPI - Non Food Manufactured Products 0.3 0.8 -0.5
B.4 WPI - Non Food Non-Fuel 0.5 1.1 -0.6
Series 2014-15 Average Range*
Change
1 2 3 4
C.1 Consumer Price Index for Industrial Workers (Base: 2001=100)
2.4 2.3 0.1
C.2 Consumer Price Index for Agricultural Labourers (Base: 1986-87=100)
2.8 2.3 0.5
C.3 Consumer Price Index for Rural Labourers (Base: 1986-87=100)
2.5 2.2 0.3
D.IIP (Base: 2004-05=100) General Index 15.3 15.0 0.3
D.1.1 IIP - Basic Goods Industries 13.1 14.3 -1.2
D.1.2 IIP - Intermediate Goods Industries 8.1 8.8 -0.6
D.1.3 IIP - Consumer Goods Industries 19.8 17.4 2.4
D.1.3.1 IIP - Consumer Durable Goods Industries 16.5 13.6 2.9
D.1.3.2 IIP - Consumer Non-Durable Goods Industries 26.9 25.9 1.0
D.2.1 IIP - Mining 27.4 27.2 0.2
D.2.2 IIP - Manufacturing 16.0 15.3 0.7
D.2.2.1 IIP - Food products and beverages 66.2 64.7 1.5
D.2.2.2 IIP - Textiles 6.6 7.4 -0.8
D.2.2.3 IIP - Wood and products of wood & cork except furniture; articles of straw & plating materials
15.9 17.4 -1.5
D.2.2.4 IIP - Paper and paper products 9.2 9.4 -0.2
D.2.2.5 IIP - Publishing, printing & reproduction of recorded media
10.1 8.9 1.3
D.2.2.6 IIP - Coke, refi ned petroleum products & nuclear fuel 12.8 11.7 1.2
D.2.2.7 IIP - Chemicals and chemical products 9.4 9.1 0.3
D.2.2.8 IIP - Rubber and plastics products 11.3 10.9 0.4
D.2.2.9 IIP - Other non-metallic mineral products 18.7 18.1 0.6
D.2.2.10 IIP - Basic metals 8.6 9.6 -1.1
D.2.2.11 IIP - Fabricated metal products, except machinery & equipment
54.3 56.7 -2.5
D.2.2.12 IIP - Motor vehicles, trailers & semi-trailers 22.0 24.9 -3.0
D.2.2.13 IIP - Other transport equipment 20.5 20.5 0.0
D.2.3 IIP - Electricity 12.1 10.6 1.4
D.3 Cement Production 24.0 23.8 0.2
D.4 Steel Production 12.3 11.3 1.0
D.5 Coal Production 51.3 54.1 -2.8
D.6 Crude Oil Production 10.4 10.3 0.1
D.7 Petroleum Refi nery Production 9.9 10.1 -0.1
D.8 Fertiliser Production 25.7 25.7 0.0
D.9 Natural Gas Production 10.7 10.9 -0.2
D.10 Production of Commercial Motor Vehicles 25.9 27.8 -1.9
E.1 Cargo handled at Major Ports 14.6 15.8 -1.3
E.2 Railway Freight Traffi c 19.2 20.4 -1.2
E.3 Sales of Commercial Motor Vehicles 40.6 41.5 -0.9
E.4 Passenger fl own (Km) - Domestic 24.2 25.5 -1.3
E.5 Passenger fl own (Km) - International 18.4 17.3 1.1
E.6 Freight Tonne Km fl own - Domestic 20.9 22.5 -1.6
F.1 Exports 22.8 23.0 -0.2
F.2 Imports 13.3 13.9 -0.6
F.3 Non-oil Non-Gold Imports 15.1 17.3 -2.2
Table 3: Change in seasonal variation in 2014-15 vis-à-vis previous 5-years (2009-10 to 2013-14)
*Average Range of Monthly Seasonal Factors for the last 5-years (2009-10 to 2013-14).
ARTICLE
RBI Bulletin September 201584
Monthly Seasonal Factors of Selected Economic Time Series
Table 4: List of Top-Twenty and Bottom-Twenty Series based on Average Range of Monthly Seasonal Factors during Last Five Years (2010-11 to 2014-15) and corresponding Peak and Trough Months
Name of Top-Twenty Series Average Range
Peak Month
Trough Month
Name of Bottom-Twenty Series Average Range
Peak Month
Trough Month
1 2 3 4 1 2 3 4
D.2.2.1 IIP - Food products and beverages 65.3 Jan Sep A.1.1.2 Bank Credit to Commercial Sector 2.8 Mar Oct
D.2.2.11 IIP - Fabricated metal products, except machinery & equipment
56.5 Mar Apr B.2.1.1 WPI - Grain Mill Products 2.7 Jan May
D.5 Coal Production 53.9 Mar Sep B.1.1.5 WPI - Protein Items (viz., Pulses, Milk, Egg, Meat and Fish) Group
2.7 Sep Apr
E.3 Sales of Commercial Motor Vehicles 40.9 Mar Apr C.2 Consumer Price Index for Agricultural Labourers (Base: 1986-87=100)
2.4 Oct Mar
D.2.1 IIP - Mining 27.4 Mar Sep B.1.2 WPI - Non-Food Articles 2.4 Apr Oct
D.10 Production of Commercial Motor Vehicles 27.1 Mar Jun C.1 Consumer Price Index for Industrial Workers (2001=100)
2.3 Oct Mar
D.1.3.1 IIP - Consumer Non-Durable Goods Industries
26.3 Dec Oct B.1.1.1 WPI - Food Grains (Cereals+Pulses)
2.3 Oct May
D.8 Fertiliser Production* 25.7 Oct Apr C.3 Consumer Price Index for Rural Labourers (Base: 1986-87=100)
2.3 Oct Mar
E.4 Passenger fl own (Km) - Domestic 25.3 May Sep B.1.1.4.2 WPI - Meat 2.1 Jun Apr
D.2.2.12 IIP - Motor vehicles, trailers & semi-trailers*
24.0 Mar Jun A.1.1 Broad Money (M3) 1.9 Apr Sep
D.3 Cement Production 24.0 Mar Aug B.1.1.1.1 WPI - Cereals 1.8 Oct Apr
F.1 Exports 23.4 Mar Nov B.2.1 WPI - Food Products 1.7 Sep Mar
E.6 Freight Tonne Km fl own - Domestic 22.3 Oct Feb B. WPI (Base 2004-05=100) All Commodities 1.7 Sep Feb
D.2.2.13 IIP - Other transport equipment* 20.5 Mar Apr A.2.1 Aggregate Deposits (SCBs) 1.6 Apr Jan
A.3.2 Assets with the Banking System (SCBs) 20.3 Mar Nov A.2.1.2 Time Deposits (SCBs) 1.5 Apr Dec
E.2 Railway Freight Traffi c 20.0 Mar Sep B.1.1.3 WPI - Milk 1.2 Jul Mar
B.1.1.2 WPI - Fruits & Vegetables 19.8 Aug Feb B.2.1.3 WPI - Edible Oils 1.0 Aug Nov
D.2.2.9 IIP - Other non-metallic mineral products* 18.5 Mar Aug B.4 WPI - Non Food Non-Fuel 0.8 Apr Dec
D.1.3 IIP - Consumer Goods Industries 18.3 Mar Aug B.3 WPI - Non Food Manufactured Products 0.7 Apr Dec
E.5 Passenger fl own (Km) - International 17.7 Jan Sep B.2 WPI - Manufactured Products 0.5 May Dec