MONTHLY ECONOMIC REPORT - IndBiz
15
MONTHLY ECONOMIC REPORT MAY 2020
Transcript of MONTHLY ECONOMIC REPORT - IndBiz
MONTHLY ECONOMIC REPORT MAY 2020
ED & States Division, MEA, Government of India
CONTENTSState of the Economy 3
Pre-COVID Improvement 6
Post-COVID Impact 7
Supply/Demand Disruptions 8
COVID-19 Impact on Inflation 9
Impact on Investment 10
Impact on External Sector 11
Fiscal Policy for FY 2020-21 12
Impact on Markets 13
Outlook for the Economy 14
2 Monthly Economic Report, May 2020
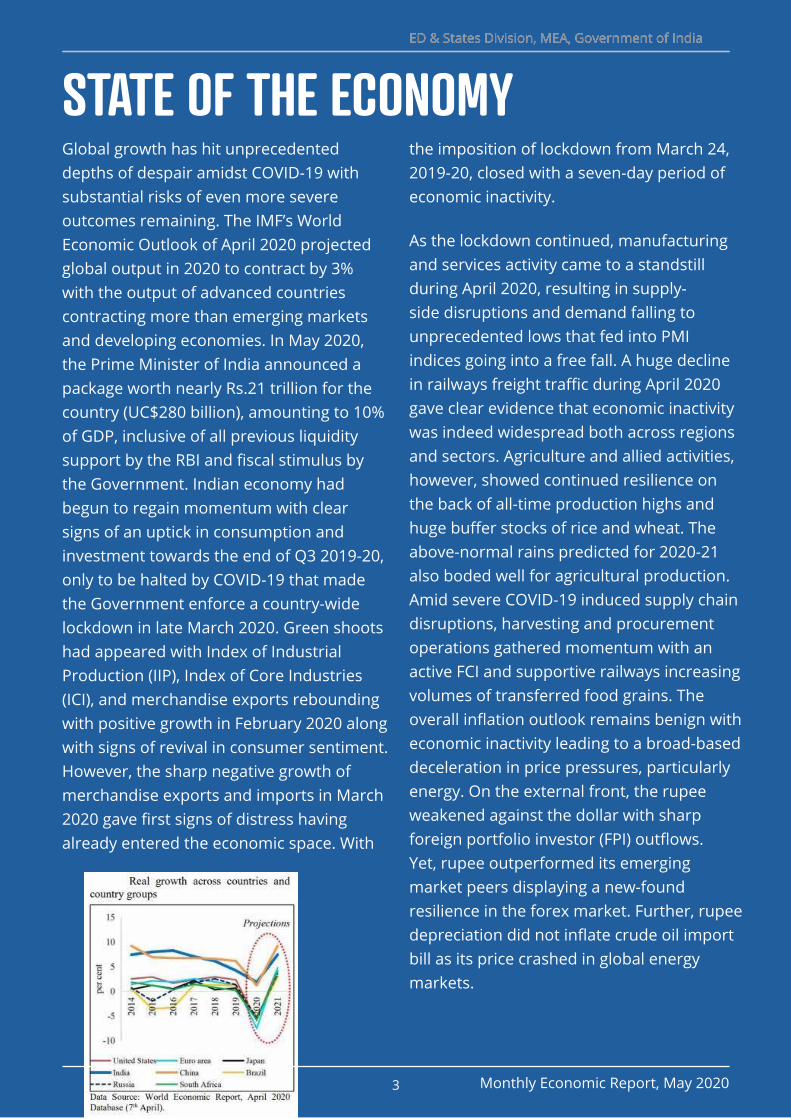
Global growth has hit unprecedented depths of despair amidst COVID-19 with substantial risks of even more severe outcomes remaining. The IMF’s World Economic Outlook of April 2020 projected global output in 2020 to contract by 3% with the output of advanced countries contracting more than emerging markets and developing economies. In May 2020, the Prime Minister of India announced a package worth nearly Rs.21 trillion for the country (UC$280 billion), amounting to 10% of GDP, inclusive of all previous liquidity support by the RBI and fiscal stimulus by the Government. Indian economy had begun to regain momentum with clear signs of an uptick in consumption and investment towards the end of Q3 2019-20, only to be halted by COVID-19 that made the Government enforce a country-wide lockdown in late March 2020. Green shoots had appeared with Index of Industrial Production (IIP), Index of Core Industries (ICI), and merchandise exports rebounding with positive growth in February 2020 along with signs of revival in consumer sentiment. However, the sharp negative growth of merchandise exports and imports in March 2020 gave first signs of distress having already entered the economic space. With
the imposition of lockdown from March 24, 2019-20, closed with a seven-day period of economic inactivity.
As the lockdown continued, manufacturing and services activity came to a standstill during April 2020, resulting in supply-side disruptions and demand falling to unprecedented lows that fed into PMI indices going into a free fall. A huge decline in railways freight traffic during April 2020 gave clear evidence that economic inactivity was indeed widespread both across regions and sectors. Agriculture and allied activities, however, showed continued resilience on the back of all-time production highs and huge buffer stocks of rice and wheat. The above-normal rains predicted for 2020-21 also boded well for agricultural production. Amid severe COVID-19 induced supply chain disruptions, harvesting and procurement operations gathered momentum with an active FCI and supportive railways increasing volumes of transferred food grains. The overall inflation outlook remains benign with economic inactivity leading to a broad-based deceleration in price pressures, particularly energy. On the external front, the rupee weakened against the dollar with sharp foreign portfolio investor (FPI) outflows. Yet, rupee outperformed its emerging market peers displaying a new-found resilience in the forex market. Further, rupee depreciation did not inflate crude oil import bill as its price crashed in global energy markets.
STATE OF THE ECONOMYED & States Division, MEA, Government of India
3 Monthly Economic Report, May 2020
ED & States Division, MEA, Government of India
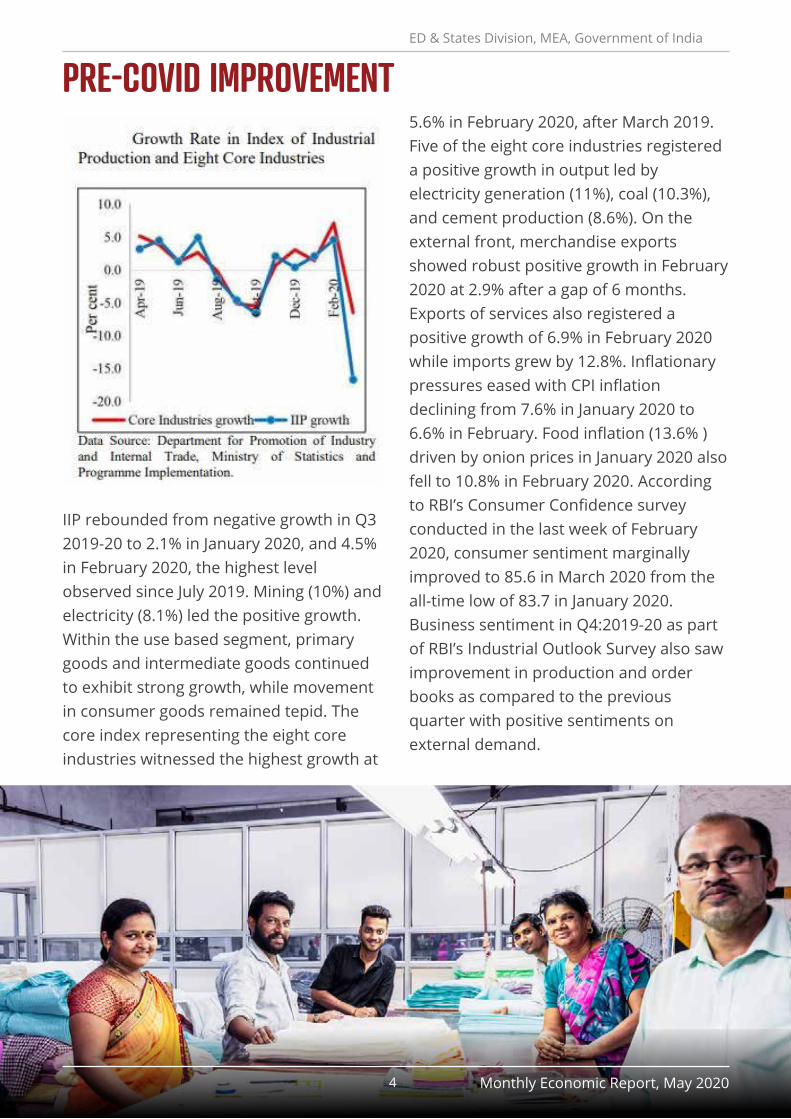
IIP rebounded from negative growth in Q3 2019-20 to 2.1% in January 2020, and 4.5% in February 2020, the highest level observed since July 2019. Mining (10%) and electricity (8.1%) led the positive growth. Within the use based segment, primary goods and intermediate goods continued to exhibit strong growth, while movement in consumer goods remained tepid. The core index representing the eight core industries witnessed the highest growth at
5.6% in February 2020, after March 2019. Five of the eight core industries registered a positive growth in output led by electricity generation (11%), coal (10.3%), and cement production (8.6%). On the external front, merchandise exports showed robust positive growth in February 2020 at 2.9% after a gap of 6 months. Exports of services also registered a positive growth of 6.9% in February 2020 while imports grew by 12.8%. Inflationary pressures eased with CPI inflation declining from 7.6% in January 2020 to 6.6% in February. Food inflation (13.6% ) driven by onion prices in January 2020 also fell to 10.8% in February 2020. According to RBI’s Consumer Confidence survey conducted in the last week of February 2020, consumer sentiment marginally improved to 85.6 in March 2020 from the all-time low of 83.7 in January 2020. Business sentiment in Q4:2019-20 as part of RBI’s Industrial Outlook Survey also saw improvement in production and order books as compared to the previous quarter with positive sentiments on external demand.
PRE-COVID IMPROVEMENT
4 Monthly Economic Report, May 2020
ED & States Division, MEA, Government of India
ED & States Division, MEA, Government of India
POST-COVID IMPACT
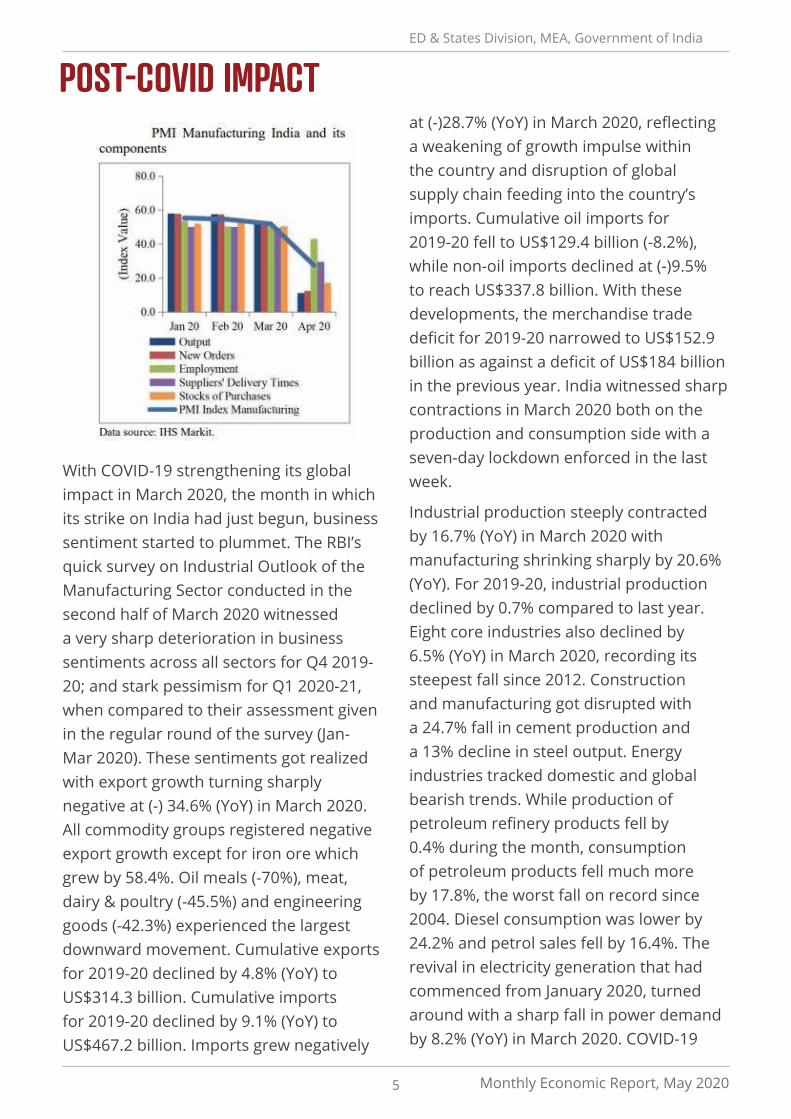
With COVID-19 strengthening its global impact in March 2020, the month in which its strike on India had just begun, business sentiment started to plummet. The RBI’s quick survey on Industrial Outlook of the Manufacturing Sector conducted in the second half of March 2020 witnessed a very sharp deterioration in business sentiments across all sectors for Q4 2019-20; and stark pessimism for Q1 2020-21, when compared to their assessment given in the regular round of the survey (Jan-Mar 2020). These sentiments got realized with export growth turning sharply negative at (-) 34.6% (YoY) in March 2020. All commodity groups registered negative export growth except for iron ore which grew by 58.4%. Oil meals (-70%), meat, dairy & poultry (-45.5%) and engineering goods (-42.3%) experienced the largest downward movement. Cumulative exports for 2019-20 declined by 4.8% (YoY) to US$314.3 billion. Cumulative imports for 2019-20 declined by 9.1% (YoY) to US$467.2 billion. Imports grew negatively
at (-)28.7% (YoY) in March 2020, reflecting a weakening of growth impulse within the country and disruption of global supply chain feeding into the country’s imports. Cumulative oil imports for 2019-20 fell to US$129.4 billion (-8.2%), while non-oil imports declined at (-)9.5% to reach US$337.8 billion. With these developments, the merchandise trade deficit for 2019-20 narrowed to US$152.9 billion as against a deficit of US$184 billion in the previous year. India witnessed sharp contractions in March 2020 both on the production and consumption side with a seven-day lockdown enforced in the last week.
Industrial production steeply contracted by 16.7% (YoY) in March 2020 with manufacturing shrinking sharply by 20.6% (YoY). For 2019-20, industrial production declined by 0.7% compared to last year. Eight core industries also declined by 6.5% (YoY) in March 2020, recording its steepest fall since 2012. Construction and manufacturing got disrupted with a 24.7% fall in cement production and a 13% decline in steel output. Energy industries tracked domestic and global bearish trends. While production of petroleum refinery products fell by 0.4% during the month, consumption of petroleum products fell much more by 17.8%, the worst fall on record since 2004. Diesel consumption was lower by 24.2% and petrol sales fell by 16.4%. The revival in electricity generation that had commenced from January 2020, turned around with a sharp fall in power demand by 8.2% (YoY) in March 2020. COVID-19
5 Monthly Economic Report, May 2020

brought further bad news for the auto sector, which was already battling a crisis before the outbreak. Sharp across the board contraction in automobile sales was seen in March 2020, with the greatest decline in commercial vehicles (-88.1% (YoY)) and passenger cars (-53.3% (YoY)). These developments adversely impacted market confidence with growth
in NIFTY-Consumption and NIFTY-Auto moving into negative territory in March 2020. Lockdown induced supply chain disruptions also negatively affected infrastructure industries with domestic air passenger volumes falling by 11.8% (YoY) in March 2020 with railways freight traffic (-13.9%) and port traffic (-5.2%) also declining sharply.
6 Monthly Economic Report, May 2020
ED & States Division, MEA, Government of India
ED & States Division, MEA, Government of India
SUPPLY/DEMAND DISRUPTIONS
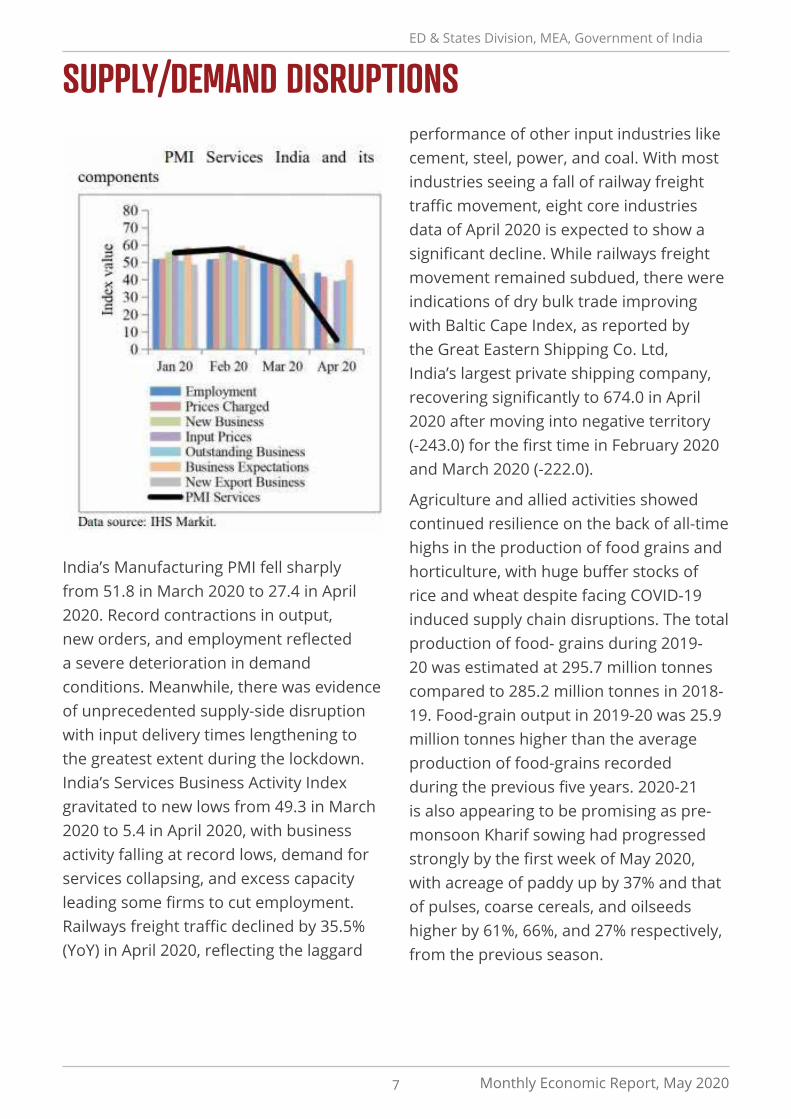
India’s Manufacturing PMI fell sharply from 51.8 in March 2020 to 27.4 in April 2020. Record contractions in output, new orders, and employment reflected a severe deterioration in demand conditions. Meanwhile, there was evidence of unprecedented supply-side disruption with input delivery times lengthening to the greatest extent during the lockdown. India’s Services Business Activity Index gravitated to new lows from 49.3 in March 2020 to 5.4 in April 2020, with business activity falling at record lows, demand for services collapsing, and excess capacity leading some firms to cut employment. Railways freight traffic declined by 35.5% (YoY) in April 2020, reflecting the laggard
performance of other input industries like cement, steel, power, and coal. With most industries seeing a fall of railway freight traffic movement, eight core industries data of April 2020 is expected to show a significant decline. While railways freight movement remained subdued, there were indications of dry bulk trade improving with Baltic Cape Index, as reported by the Great Eastern Shipping Co. Ltd, India’s largest private shipping company, recovering significantly to 674.0 in April 2020 after moving into negative territory (-243.0) for the first time in February 2020 and March 2020 (-222.0).
Agriculture and allied activities showed continued resilience on the back of all-time highs in the production of food grains and horticulture, with huge buffer stocks of rice and wheat despite facing COVID-19 induced supply chain disruptions. The total production of food- grains during 2019-20 was estimated at 295.7 million tonnes compared to 285.2 million tonnes in 2018-19. Food-grain output in 2019-20 was 25.9 million tonnes higher than the average production of food-grains recorded during the previous five years. 2020-21 is also appearing to be promising as pre-monsoon Kharif sowing had progressed strongly by the first week of May 2020, with acreage of paddy up by 37% and that of pulses, coarse cereals, and oilseeds higher by 61%, 66%, and 27% respectively, from the previous season.
7 Monthly Economic Report, May 2020
ED & States Division, MEA, Government of India
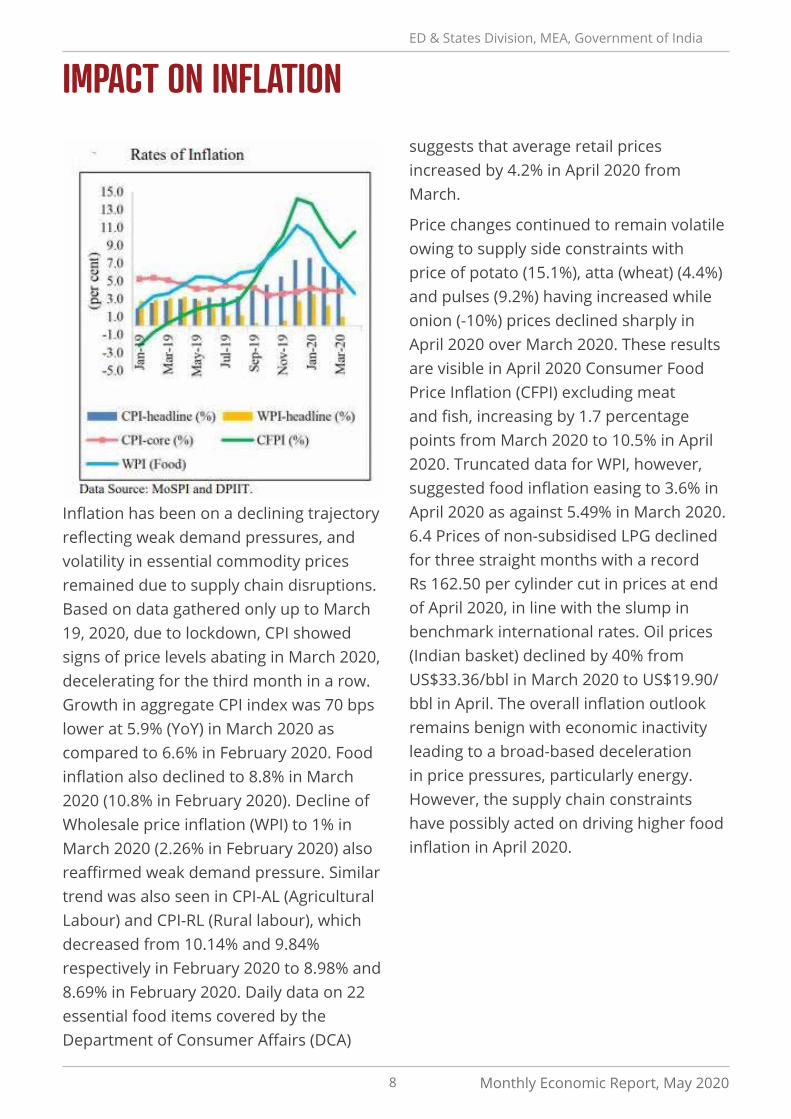
IMPACT ON INFLATION suggests that average retail prices increased by 4.2% in April 2020 from March.
Price changes continued to remain volatile owing to supply side constraints with price of potato (15.1%), atta (wheat) (4.4%) and pulses (9.2%) having increased while onion (-10%) prices declined sharply in April 2020 over March 2020. These results are visible in April 2020 Consumer Food Price Inflation (CFPI) excluding meat and fish, increasing by 1.7 percentage points from March 2020 to 10.5% in April 2020. Truncated data for WPI, however, suggested food inflation easing to 3.6% in April 2020 as against 5.49% in March 2020. 6.4 Prices of non-subsidised LPG declined for three straight months with a record Rs 162.50 per cylinder cut in prices at end of April 2020, in line with the slump in benchmark international rates. Oil prices (Indian basket) declined by 40% from US$33.36/bbl in March 2020 to US$19.90/bbl in April. The overall inflation outlook remains benign with economic inactivity leading to a broad-based deceleration in price pressures, particularly energy. However, the supply chain constraints have possibly acted on driving higher food inflation in April 2020.
Inflation has been on a declining trajectory reflecting weak demand pressures, and volatility in essential commodity prices remained due to supply chain disruptions. Based on data gathered only up to March 19, 2020, due to lockdown, CPI showed signs of price levels abating in March 2020, decelerating for the third month in a row. Growth in aggregate CPI index was 70 bps lower at 5.9% (YoY) in March 2020 as compared to 6.6% in February 2020. Food inflation also declined to 8.8% in March 2020 (10.8% in February 2020). Decline of Wholesale price inflation (WPI) to 1% in March 2020 (2.26% in February 2020) also reaffirmed weak demand pressure. Similar trend was also seen in CPI-AL (Agricultural Labour) and CPI-RL (Rural labour), which decreased from 10.14% and 9.84% respectively in February 2020 to 8.98% and 8.69% in February 2020. Daily data on 22 essential food items covered by the Department of Consumer Affairs (DCA)
8 Monthly Economic Report, May 2020
ED & States Division, MEA, Government of India
IMPACT ON INVESTMENT
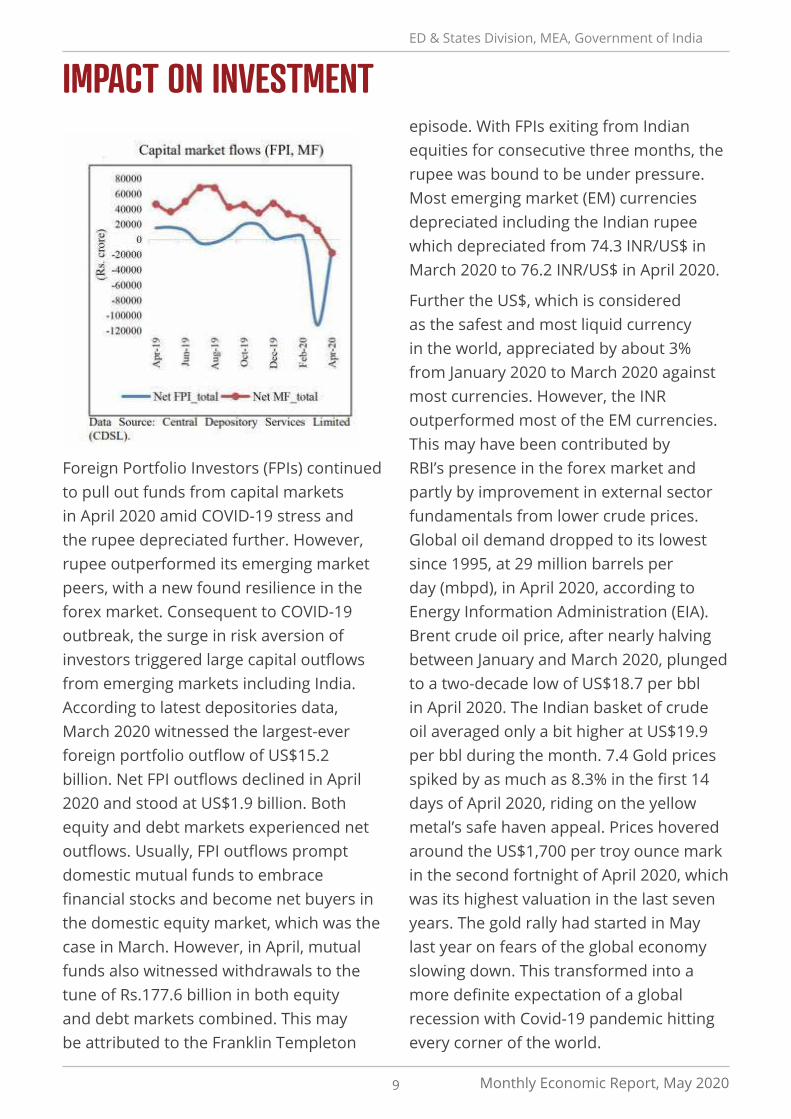
Foreign Portfolio Investors (FPIs) continued to pull out funds from capital markets in April 2020 amid COVID-19 stress and the rupee depreciated further. However, rupee outperformed its emerging market peers, with a new found resilience in the forex market. Consequent to COVID-19 outbreak, the surge in risk aversion of investors triggered large capital outflows from emerging markets including India. According to latest depositories data, March 2020 witnessed the largest-ever foreign portfolio outflow of US$15.2 billion. Net FPI outflows declined in April 2020 and stood at US$1.9 billion. Both equity and debt markets experienced net outflows. Usually, FPI outflows prompt domestic mutual funds to embrace financial stocks and become net buyers in the domestic equity market, which was the case in March. However, in April, mutual funds also witnessed withdrawals to the tune of Rs.177.6 billion in both equity and debt markets combined. This may be attributed to the Franklin Templeton
episode. With FPIs exiting from Indian equities for consecutive three months, the rupee was bound to be under pressure. Most emerging market (EM) currencies depreciated including the Indian rupee which depreciated from 74.3 INR/US$ in March 2020 to 76.2 INR/US$ in April 2020.
Further the US$, which is considered as the safest and most liquid currency in the world, appreciated by about 3% from January 2020 to March 2020 against most currencies. However, the INR outperformed most of the EM currencies. This may have been contributed by RBI’s presence in the forex market and partly by improvement in external sector fundamentals from lower crude prices. Global oil demand dropped to its lowest since 1995, at 29 million barrels per day (mbpd), in April 2020, according to Energy Information Administration (EIA). Brent crude oil price, after nearly halving between January and March 2020, plunged to a two-decade low of US$18.7 per bbl in April 2020. The Indian basket of crude oil averaged only a bit higher at US$19.9 per bbl during the month. 7.4 Gold prices spiked by as much as 8.3% in the first 14 days of April 2020, riding on the yellow metal’s safe haven appeal. Prices hovered around the US$1,700 per troy ounce mark in the second fortnight of April 2020, which was its highest valuation in the last seven years. The gold rally had started in May last year on fears of the global economy slowing down. This transformed into a more definite expectation of a global recession with Covid-19 pandemic hitting every corner of the world.
9 Monthly Economic Report, May 2020
ED & States Division, MEA, Government of India
IMPACT ON EXTERNAL SECTOR
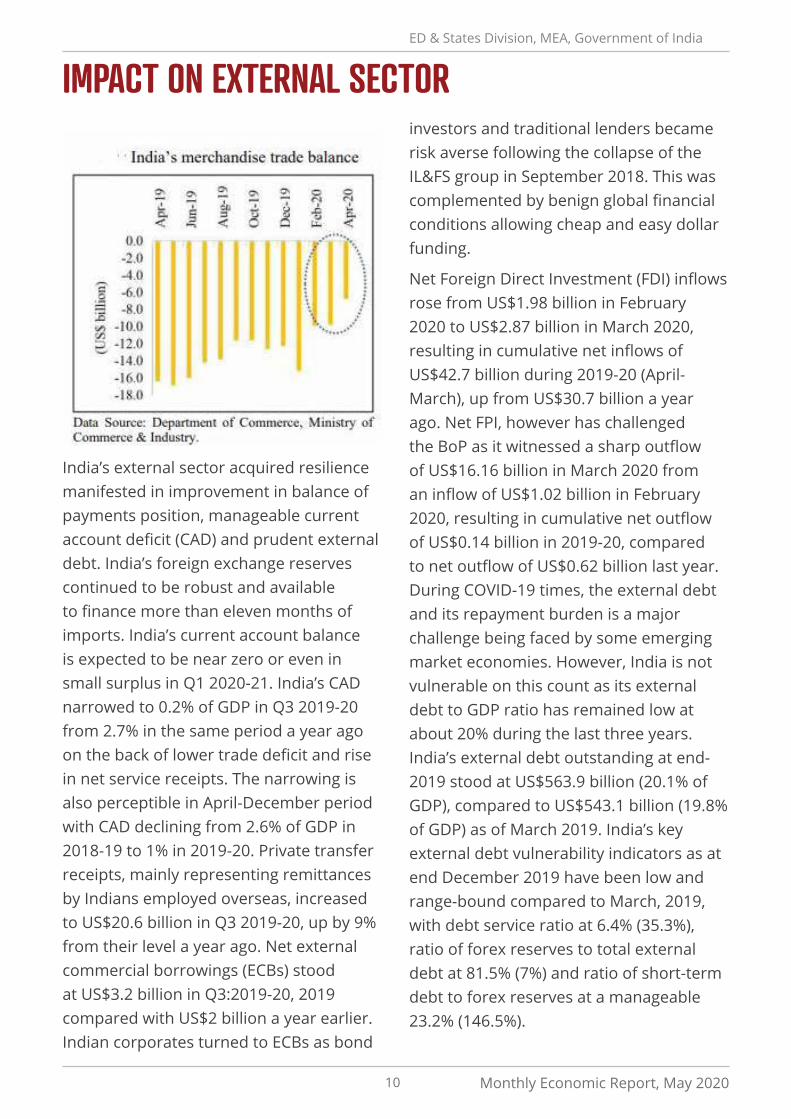
India’s external sector acquired resilience manifested in improvement in balance of payments position, manageable current account deficit (CAD) and prudent external debt. India’s foreign exchange reserves continued to be robust and available to finance more than eleven months of imports. India’s current account balance is expected to be near zero or even in small surplus in Q1 2020-21. India’s CAD narrowed to 0.2% of GDP in Q3 2019-20 from 2.7% in the same period a year ago on the back of lower trade deficit and rise in net service receipts. The narrowing is also perceptible in April-December period with CAD declining from 2.6% of GDP in 2018-19 to 1% in 2019-20. Private transfer receipts, mainly representing remittances by Indians employed overseas, increased to US$20.6 billion in Q3 2019-20, up by 9% from their level a year ago. Net external commercial borrowings (ECBs) stood at US$3.2 billion in Q3:2019-20, 2019 compared with US$2 billion a year earlier. Indian corporates turned to ECBs as bond
investors and traditional lenders became risk averse following the collapse of the IL&FS group in September 2018. This was complemented by benign global financial conditions allowing cheap and easy dollar funding.
Net Foreign Direct Investment (FDI) inflows rose from US$1.98 billion in February 2020 to US$2.87 billion in March 2020, resulting in cumulative net inflows of US$42.7 billion during 2019-20 (April- March), up from US$30.7 billion a year ago. Net FPI, however has challenged the BoP as it witnessed a sharp outflow of US$16.16 billion in March 2020 from an inflow of US$1.02 billion in February 2020, resulting in cumulative net outflow of US$0.14 billion in 2019-20, compared to net outflow of US$0.62 billion last year. During COVID-19 times, the external debt and its repayment burden is a major challenge being faced by some emerging market economies. However, India is not vulnerable on this count as its external debt to GDP ratio has remained low at about 20% during the last three years. India’s external debt outstanding at end-2019 stood at US$563.9 billion (20.1% of GDP), compared to US$543.1 billion (19.8% of GDP) as of March 2019. India’s key external debt vulnerability indicators as at end December 2019 have been low and range-bound compared to March, 2019, with debt service ratio at 6.4% (35.3%), ratio of forex reserves to total external debt at 81.5% (7%) and ratio of short-term debt to forex reserves at a manageable 23.2% (146.5%).
10 Monthly Economic Report, May 2020
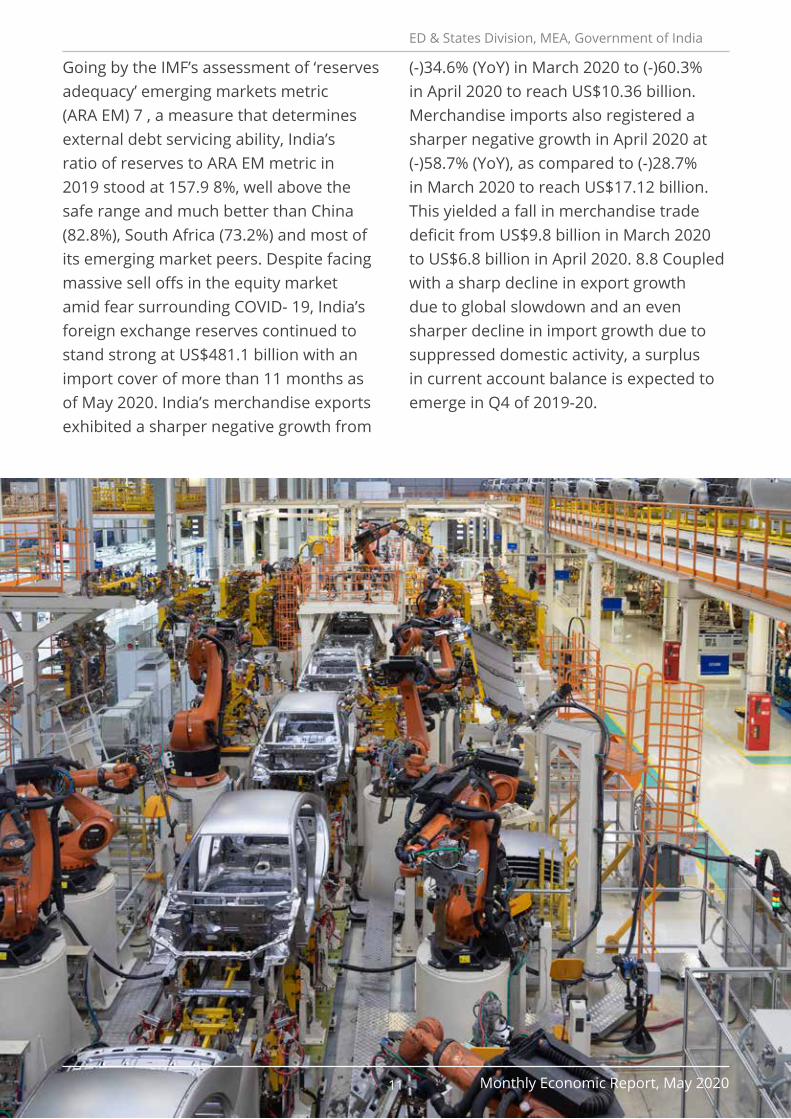
Going by the IMF’s assessment of ‘reserves adequacy’ emerging markets metric (ARA EM) 7 , a measure that determines external debt servicing ability, India’s ratio of reserves to ARA EM metric in 2019 stood at 157.9 8%, well above the safe range and much better than China (82.8%), South Africa (73.2%) and most of its emerging market peers. Despite facing massive sell offs in the equity market amid fear surrounding COVID- 19, India’s foreign exchange reserves continued to stand strong at US$481.1 billion with an import cover of more than 11 months as of May 2020. India’s merchandise exports exhibited a sharper negative growth from
(-)34.6% (YoY) in March 2020 to (-)60.3% in April 2020 to reach US$10.36 billion. Merchandise imports also registered a sharper negative growth in April 2020 at (-)58.7% (YoY), as compared to (-)28.7% in March 2020 to reach US$17.12 billion. This yielded a fall in merchandise trade deficit from US$9.8 billion in March 2020 to US$6.8 billion in April 2020. 8.8 Coupled with a sharp decline in export growth due to global slowdown and an even sharper decline in import growth due to suppressed domestic activity, a surplus in current account balance is expected to emerge in Q4 of 2019-20.
11 Monthly Economic Report, May 2020
ED & States Division, MEA, Government of India
ED & States Division, MEA, Government of India
Expansionary fiscal policy is on course in 2020-21 to mitigate the adverse impact of COVID-19, with increase in market borrowings by Central and State Governments. As on May 1, 2020, while the Centre raised 88% of its gross borrowings in the corresponding period last year, States raised more than 1.7 times, both on gross and net basis. For 2019-20, the fiscal deficit was budgeted at 3.3% of GDP, which was revised to 3.8%. This was consistent with the Centre’s net revenue receipts growing by 8.9% during April-February of 2020-21 over the corresponding period of 2019-20, while total expenditure increased by 12.6% in this period to Rs.24.7 trillion. Revenue and capital expenditure grew by 12.8% and 11.4% respectively during this period. Growth in GST collections declined from 8.3% (YoY) in February 2020 to (-)8.4% in March, 2020. The Central Government on March 31, 2020 announced that it will borrow Rs.4.88 trillion or 62.56% of the 2020-21 gross borrowing target in April-September, more than half the budgeted amount half way into the year. With RBI raising limits of Ways and Means Advances (WMA) for Centre and states in April 2020, the Central Government increased the utilization of this window to reach 56% of the limit as on 24 th April, 2020. State Governments, however, only used up 2.1% of the limit available, relying more on market borrowings.
The Government of India in consultation with RBI has revised issuance calendar for marketable dated securities for the remaining period of H1:2020-21 (May 11 to September 30, 2020). In this period, the Government plans to borrow Rs.6 trillion as against its original plan (Rs.4.88 trillion announced on March 31). The estimated gross market borrowings of the Centre in 2020-21 has been revised upwards by 53.8% to Rs.12 trillion in place of Rs.7.8 trillion as per BE 2020-21, necessitated on account of COVID-19 pandemic. As far as actual borrowings in 2020-21 are concerned, the Centre’s gross market borrowings picked up in the week ending May 1, 2020 to reach Rs.600 billion, 88% of the amount borrowed in the corresponding period of last year. States continued to be active borrowers in April 2020, raising more than 1.7 times both on gross and net basis compared to last year. Yet, surplus liquidity in the banking system resulted in 10-year G- Sec market yields falling by 29 bps during April 2020, although they started to rise in the second half of April 2020. With RBI conducting special Open Market Operation (OMO) (purchase of long term and sale of short term G-Secs for Rs.100 billion each) on 27 th April, 2020 and secondary market debt auctions subsequently, yields eased by as much as 111 bps from 6.84% on 3 rd April, 2020 to 5.73% as on 8 May, reaching their lowest since 2009.
FISCAL POLICY FOR FY 2020-21
12 Monthly Economic Report, May 2020
ED & States Division, MEA, Government of India
In April 2020, the RBI also introduced a separate Fully Accessible Route (FAR) for investment by nonresidents in specified G-Secs with such securities attracting no foreign portfolio investor (FPI) limits until maturity. Overall FPI investment limit as percentage of outstanding Government
stocks for 2020-21 was kept unchanged. With continuous selling in G-Secs by FPIs post emergence of COVID, general category FPI utilisation of investment limit in Central G-Secs has fallen to 55.2% as on April 30, 2020, compared to the peaks of over 75% at the beginning of 2020.
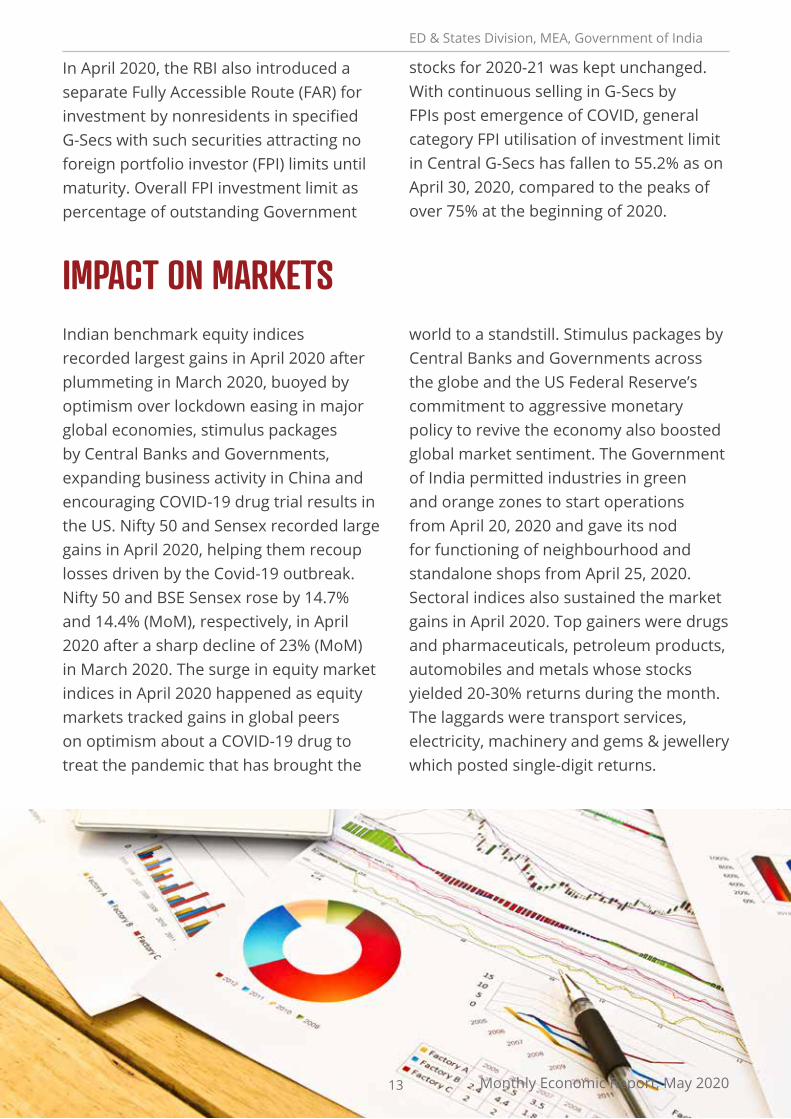
IMPACT ON MARKETSIndian benchmark equity indices recorded largest gains in April 2020 after plummeting in March 2020, buoyed by optimism over lockdown easing in major global economies, stimulus packages by Central Banks and Governments, expanding business activity in China and encouraging COVID-19 drug trial results in the US. Nifty 50 and Sensex recorded large gains in April 2020, helping them recoup losses driven by the Covid-19 outbreak. Nifty 50 and BSE Sensex rose by 14.7% and 14.4% (MoM), respectively, in April 2020 after a sharp decline of 23% (MoM) in March 2020. The surge in equity market indices in April 2020 happened as equity markets tracked gains in global peers on optimism about a COVID-19 drug to treat the pandemic that has brought the
world to a standstill. Stimulus packages by Central Banks and Governments across the globe and the US Federal Reserve’s commitment to aggressive monetary policy to revive the economy also boosted global market sentiment. The Government of India permitted industries in green and orange zones to start operations from April 20, 2020 and gave its nod for functioning of neighbourhood and standalone shops from April 25, 2020. Sectoral indices also sustained the market gains in April 2020. Top gainers were drugs and pharmaceuticals, petroleum products, automobiles and metals whose stocks yielded 20-30% returns during the month. The laggards were transport services, electricity, machinery and gems & jewellery which posted single-digit returns.
13 Monthly Economic Report, May 2020
ED & States Division, MEA, Government of India
The IMF has projected India’s GDP growth at 1.9% in 2020-21, but the Government is cognizant of the relative severity of lockdown on economic activity in the country and is cautiously optimistic about the signals from Indian benchmark equity indices. In February 2020, the National Statistical Office had estimated real GDP growth for 2019-20 at 5.0% and this was before COVID-19 made its presence felt in India. The last week of March 2020 was, however, clearly a COVID-19 impacted month as India closed 2019-20 with a lockdown of one week. This guided IMF’s downward revision of India’s GDP growth estimates of 2019-20 to 4.2% in its WEO statement of April 2020. For 2020-21, the Economic Survey in January, 2020 projected India’s GDP growth at 6-6.5%. However, WEO of April, 2020, after factoring in the COVID-19 impact, has projected India’s GDP in 2020-21 at 1.9%. Within the global downturn, India is among the handful of countries that is projected by the IMF to have positive growth in 2020-21. In fact, India’s growth is the highest
OUTLOOK FOR THE ECONOMY estimated growth by IMF for 2020-21 among G-20 economies, with the country expected to post a sharp turnaround and resume its pre-COVID trajectory by growing at 7.4% in 2021-22. These are still early days in 2020-21 and COVID-19 is yet to abate in India. The country’s actual GDP growth in 2020-21 will be contingent upon the intensity, spread and duration of the COVID-19 pandemic within national territory. On external front, downside risks to India’s growth emerge from the high possibility of global slowdown deepening and supply chain disruptions getting exacerbated due to prolonged spread of COVID-19 and lockdowns across countries. As India continues to tackle the health crisis unleashed by the COVID pandemic, the focus has now shifted to revive the economy which has been debilitated by the lockdown. The Government and RBI are working towards implementing substantial targeted fiscal and monetary measures to support affected sectors of the economy.
14 Monthly Economic Report, May 2020

ED & States Division, MEA, Government of India
For more information: Ministry of Finance, Department of Economic Affairs MONTHLY ECONOMIC REPORT MAY 2020
15 Monthly Economic Report, May 2020