MONTGOMERY COUNTY ENVIRONMENTAL...
3
ENVIRONMENTAL SERVICES MONTGOMERY COUNTY ENVIRONMENTAL SERVICES Drinking Water Quality Report for the 2016 Testing Year This year, Montgomery County is proud to say that your drinking water has once again met all state and federal water quality standards. Drink up!
Transcript of MONTGOMERY COUNTY ENVIRONMENTAL...
ENVIRONMENTAL SERVICES
MONTGOMERY COUNTY ENVIRONMENTAL SERVICES
Drinking Water Quality Report for the 2016 Testing Year
This year, Montgomery County is proud to say that your drinking water has once again met all state and federal water quality standards. Drink up!
Drinking Water & Water Reclamation Services 1850 Spaulding Road Kettering, Ohio 45432 www.mcohio.org/water
Solid Waste & Recycling Services 2550 Sandridge Drive Moraine, Ohio 45439 www.mcswd.org
Customer ServicesWater/Sewer Billing 781-2688Water/Sewer Emergency 781-2678Water Quality 781-2666Maintenance & Repairs 781-2678 Education & Outreach 781-3064Recycling Services 225-4999Report-a-Dumper 225-HELP
Engineering ServicesBackflow Prevention 781-2650Commercial Permits 781-2628Residential Permits 781-2628
Water Reclamation (Sewer)Eastern Regional 781-3034Western Regional 781-3029
Environmental Lab 781-3016GIS & Maps 781-2619Public Record Request 781-2532
ENVIRONMENTAL SERVICES
I am pleased to announce that our drinking water has once again met or exceeded all drinking water quality standards in 2016. For decades, our water has met or exceeded every water quality standard. Our citizens expect and deserve safe, reliable drinking water; as well as safe, effective sewer services.
But high-quality drinking water and sewer services come at a cost. The infrastructure that delivers water to your tap and removes wastewater from your home is aging faster than it
is being replaced. For example, more than 50% of our underground pipes are at least 50 years old. Our pumping stations, water towers and wastewater treatment plants are aging and must be maintained with ongoing capital investments.
This is not a unique problem. This is an issue facing communities large and small across our great nation. As a community, it is time for all of us to seriously reinvest in our infrastructure, so that Montgomery County Environmental Services can continue to provide you with the high-quality water and sewer services that you have come to expect.
As a public servant, I care deeply about the services that we provide to our citizens – water, sewer, trash and recycling. These are indispensable public services that improve our quality of life, and also preserve and protect our natural environment. We must ensure that our children enjoy the same quality of drinking water and sewer services that we have all enjoyed for decades.
I hope this Drinking Water Quality Report leaves you with an appreciation for the importance of our water resources, and the hard work our employees do every day to deliver clean water to your home.
For questions or concerns regarding this report, please contact (937) 781-2532.
Reinvest in Aging Infrastructure
Sincerely,
Patrick Turnbull, P.E.
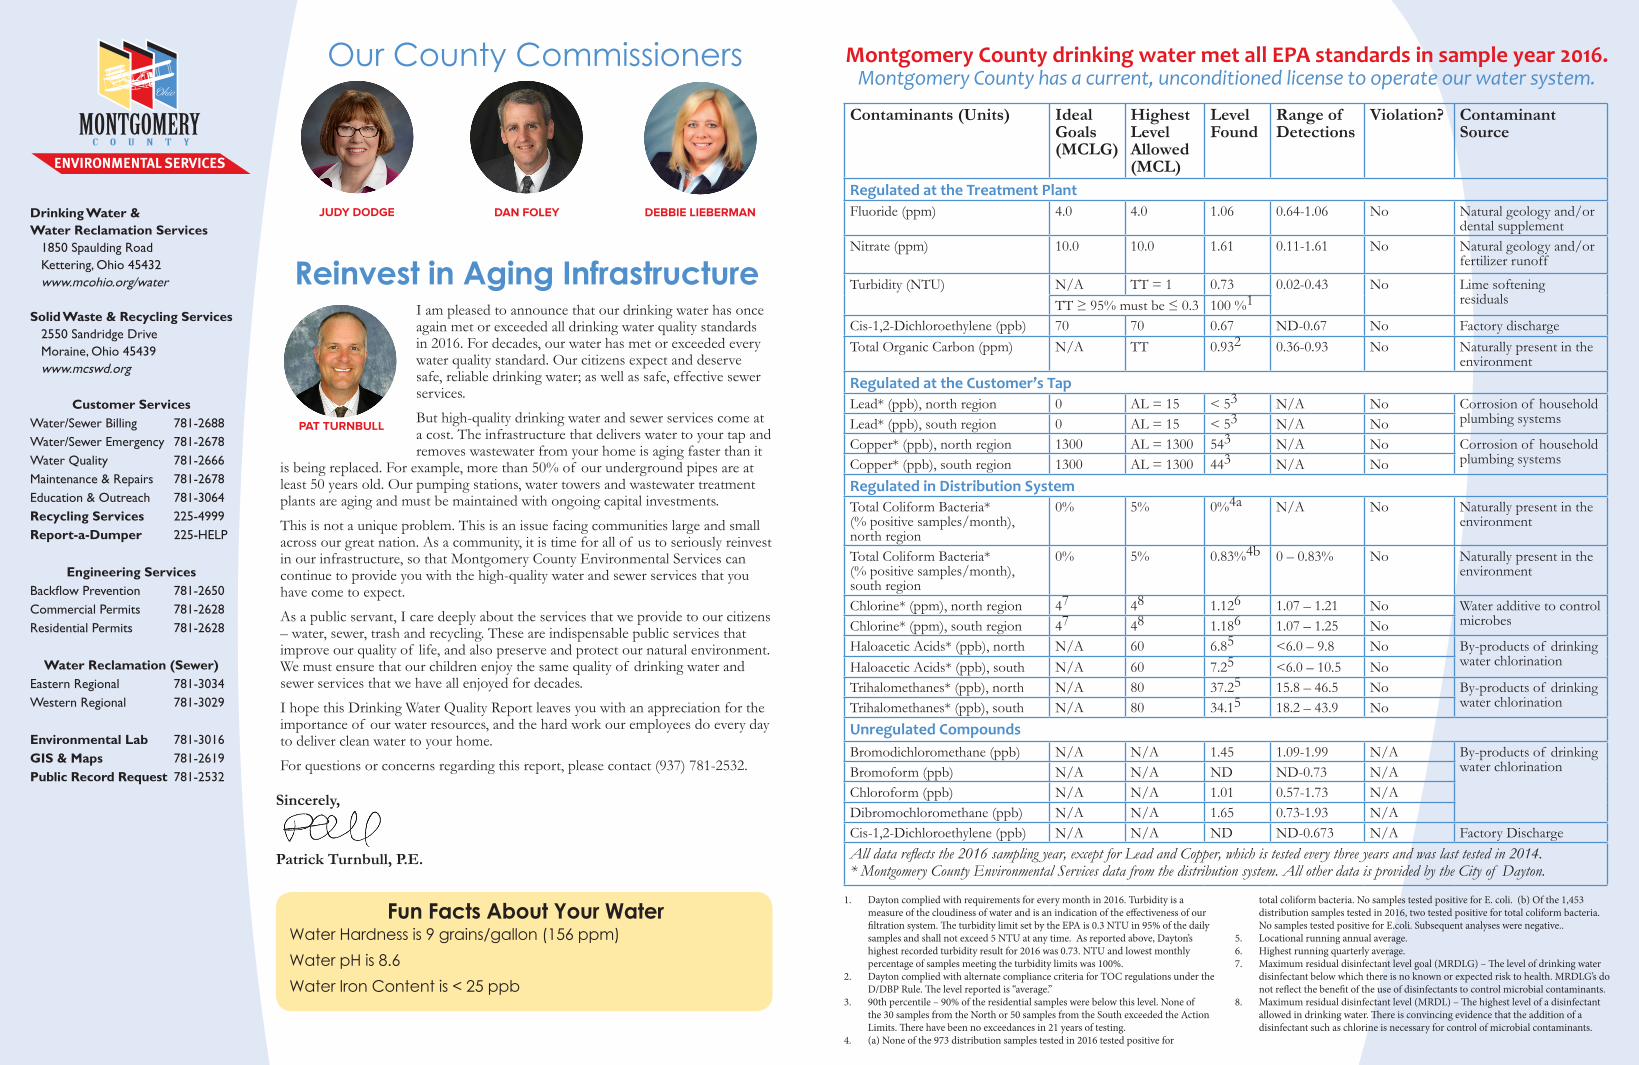
Our County CommissionersContaminants (Units) Ideal
Goals(MCLG)
Highest Level Allowed (MCL)
Level Found
Range of Detections
Violation? Contaminant Source
Regulated at the Treatment Plant Fluoride (ppm) 4.0 4.0 1.06 0.64-1.06 No Natural geology and/or
dental supplementNitrate (ppm) 10.0 10.0 1.61 0.11-1.61 No Natural geology and/or
fertilizer runoff
Turbidity (NTU) N/A TT = 1 0.73 0.02-0.43 No Lime softening residualsTT ≥ 95% must be ≤ 0.3 100 %1
Cis-1,2-Dichloroethylene (ppb) 70 70 0.67 ND-0.67 No Factory discharge Total Organic Carbon (ppm) N/A TT 0.932 0.36-0.93 No Naturally present in the
environmentRegulated at the Customer’s Tap Lead* (ppb), north region 0 AL = 15 < 53 N/A No Corrosion of household
plumbing systemsLead* (ppb), south region 0 AL = 15 < 53 N/A NoCopper* (ppb), north region 1300 AL = 1300 543 N/A No Corrosion of household
plumbing systemsCopper* (ppb), south region 1300 AL = 1300 443 N/A NoRegulated in Distribution SystemTotal Coliform Bacteria*(% positive samples/month), north region
0% 5% 0%4a N/A No Naturally present in the environment
Total Coliform Bacteria*(% positive samples/month), south region
0% 5% 0.83%4b 0 – 0.83% No Naturally present in the environment
Chlorine* (ppm), north region 47 48 1.126 1.07 – 1.21 No Water additive to control microbesChlorine* (ppm), south region 47 48 1.186 1.07 – 1.25 No
Haloacetic Acids* (ppb), north N/A 60 6.85 <6.0 – 9.8 No By-products of drinking water chlorinationHaloacetic Acids* (ppb), south N/A 60 7.25 <6.0 – 10.5 No
Trihalomethanes* (ppb), north N/A 80 37.25 15.8 – 46.5 No By-products of drinking water chlorinationTrihalomethanes* (ppb), south N/A 80 34.15 18.2 – 43.9 No
Unregulated Compounds Bromodichloromethane (ppb) N/A N/A 1.45 1.09-1.99 N/A By-products of drinking
water chlorination Bromoform (ppb) N/A N/A ND ND-0.73 N/AChloroform (ppb) N/A N/A 1.01 0.57-1.73 N/ADibromochloromethane (ppb) N/A N/A 1.65 0.73-1.93 N/ACis-1,2-Dichloroethylene (ppb) N/A N/A ND ND-0.673 N/A Factory DischargeAll data reflects the 2016 sampling year, except for Lead and Copper, which is tested every three years and was last tested in 2014. * Montgomery County Environmental Services data from the distribution system. All other data is provided by the City of Dayton.
1. Dayton complied with requirements for every month in 2016. Turbidity is a measure of the cloudiness of water and is an indication of the effectiveness of our filtration system. The turbidity limit set by the EPA is 0.3 NTU in 95% of the daily samples and shall not exceed 5 NTU at any time. As reported above, Dayton’s highest recorded turbidity result for 2016 was 0.73. NTU and lowest monthly percentage of samples meeting the turbidity limits was 100%.
2. Dayton complied with alternate compliance criteria for TOC regulations under the D/DBP Rule. The level reported is “average.”
3. 90th percentile – 90% of the residential samples were below this level. None of the 30 samples from the North or 50 samples from the South exceeded the Action Limits. There have been no exceedances in 21 years of testing.
4. (a) None of the 973 distribution samples tested in 2016 tested positive for
total coliform bacteria. No samples tested positive for E. coli. (b) Of the 1,453 distribution samples tested in 2016, two tested positive for total coliform bacteria. No samples tested positive for E.coli. Subsequent analyses were negative..
5. Locational running annual average.6. Highest running quarterly average.7. Maximum residual disinfectant level goal (MRDLG) – The level of drinking water
disinfectant below which there is no known or expected risk to health. MRDLG’s do not reflect the benefit of the use of disinfectants to control microbial contaminants.
8. Maximum residual disinfectant level (MRDL) – The highest level of a disinfectant allowed in drinking water. There is convincing evidence that the addition of a disinfectant such as chlorine is necessary for control of microbial contaminants.
Montgomery County drinking water met all EPA standards in sample year 2016.Montgomery County has a current, unconditioned license to operate our water system.
Fun Facts About Your WaterWater Hardness is 9 grains/gallon (156 ppm)Water pH is 8.6Water Iron Content is < 25 ppb
PAT TURNBULL
DAN FOLEYJUDY DODGE DEBBIE LIEBERMAN
The City of Dayton’s drinking water source is the Miami Valley Buried Aquifer, a large underground area of water-bearing sand and gravel deposits. Montgomery County purchases its water from the City of Dayton, and then distributes the water to you – our customers. Montgomery County has backup connections located in Greene County, West Carrollton, and Miamisburg.
As part of the Source Water Assessment and Protection Program, the Ohio Environmental Protection Agency (Ohio EPA) conducted a source water assessment of the Great Miami Buried Valley Aquifer. The assessment concluded that the aquifer, which supplies water to the City of Dayton’s well fields, has a high susceptibility to contamination. While Montgomery County customers receive high quality drinking water, the aquifer is still vulnerable to future contamination. This determination is based on the influence of surface water to replenish/recharge the aquifer, the presence of a relatively thin layer of clay overlaying the aquifer, the shallow depth of the aquifer, contaminant plumes in Dayton’s well field protection area, the presence of significant potential contaminant sources in the protection area, and the presence of contaminants in treated water.
Source Water ContaminationSources of drinking water (both tap and bottled water) include
rivers, lakes, streams, ponds, reservoirs, springs, and wells. As water travels over the surface of the land or through the ground, it dissolves naturally occurring minerals and, in some cases, radioactive material. Water may also pick up substances that result from the presence of animals or from human activity.
In order to ensure that tap water is safe to drink, USEPA prescribes regulations which limit the amount of certain contaminants in water provided by public water systems. FDA regulations establish limits for contaminants in bottled water which must provide the same protection for public health.
Drinking water, including bottled water, may reasonably be expected to contain at least small amounts of some contaminants. The presence of contaminants does not necessarily indicate that water poses a health risk. More information about contaminants and potential health effects can
be obtained by calling the Federal Environmental Protection Agency’s Safe Drinking Water Hotline (1-800-426-4791).
Lead PrecautionsIf present, elevated levels of lead can cause serious health
problems, especially for pregnant women and young children. Lead in drinking water is primarily from materials associated with service lines and home plumbing. When your water has been sitting for several hours, you can reduce the potential for lead exposure by running your tap for one to two minutes before using water for drinking or cooking. If you are concerned about lead in your water, you may wish to have your water tested. Information on lead, testing methods, and how to minimize exposure is available from the USEPA’s Safe Drinking Water Hotline at 1-800-426-4791 or www.epa.gov/safewater/lead.
Special Health Concerns Some people may be more vulnerable to contaminants
in drinking water than the general population. Immune-compromised persons (e.g., those who have undergone organ transplant), people with HIV/AIDS or other immune disorders, some elderly, and infants can be particularly at risk from infections. These people should seek advice about drinking water from their healthcare providers.
Guidelines on how to lessen the risk of infection by Cryptosporidium and other microbial contaminants are available from the USEPA’s Safe Drinking Water Hotline at 1-800-426-4791. More information and resources are available from the USEPA at http://water.epa.gov/drink, or from the Centers for Disease Control (CDC) at www.cdc.gov/healthywater.
Public Participation WelcomeMontgomery County welcomes public participation and
encourages citizens to express concerns and meet with officials. The Board of County Commissioners’ meetings are open to the public and are held most Tuesdays at 1:30 p.m. on the 10th Floor of the County Administration Building, 451 W. Third St., Dayton, OH 45422. Contact (937) 225-4690 for more info.
Our Water Source: Great Miami Buried Valley Aquifer
Drinking Water GlossaryAction Level (AL) – concentration of a contaminant that, if exceeded, triggers treatment or another required action by the system. Initial Distribution System Evaluation (IDSE) – evaluation required by the USEPA, intended to identify locations in the water distribution system with elevated concentrations of disinfection byproducts. Maximum Contaminant Level Goal (MCLG) – the level of a contaminant in drinking water below which there is no known or expected risk to health. MCLGs allow for a margin of safety.Maximum Contaminant Level (MCL) – the highest level of a contaminant allowed in drinking water. MCLs are set as close as feasible to the MCLGs, using the best available treatment technology. ND – None detected (no amount detected)NTU – Nephelometric Turbidity Units, which are used to measure water cloudiness.Parts per million (ppm) – one part per million (milligrams per liter), corresponds to one minute in two years or a penny in $10,000. Parts per billion (ppb) – one part per billion (micrograms per liter), corresponds to one minute in 2,000 years or a penny in $10 million.
TT – treatment technique, or required process intended to reduce the level of contamination in drinking water.
Possible Water ContaminantsMicrobial contaminants, such as viruses and bacteria, might come from sewage treatment plants, septic systems, agricultural livestock operations, and wildlife. Radioactive contaminants might be naturally occurring, or they can be the result of oil and gas production, and mining activities.Pesticides and herbicides might come from a variety of sources, including agriculture, urban storm water runoff, and residential uses. Inorganic compounds, such as salts and metals, might be naturally occurring or result from storm water runoff, industrial or domestic wastewater discharges, oil and gas production, mining, or farming. Organic chemical contaminants, including synthetic and volatile organic chemicals (VOCs), are byproducts of industrial processes and petroleum production. These contaminants might also come from gas stations, urban storm water runoff, and septic systems.