monroe county greenhouse industry market reasearch study
66
MONROE COUNTY GREENHOUSE INDUSTRY MARKET REASEARCH STUDY Prepared by ROBIN G. BRUMFIELD Specialist in Farm Management Department of Agriculture, Food, and Resource Economics 55 Dudley Road New Brunswick, NJ 08903-8520 Prepared for Monroe County Department of Planning and Development and Cornell Cooperative Extension of Monroe County October, 2001
Transcript of monroe county greenhouse industry market reasearch study

MONROE COUNTYGREENHOUSE INDUSTRY
MARKET REASEARCH STUDY
Prepared by
ROBIN G. BRUMFIELDSpecialist in Farm Management
Department of Agriculture, Food, and Resource Economics55 Dudley Road
New Brunswick, NJ 08903-8520
Prepared for
Monroe County Department of Planning and Development
and
Cornell Cooperative Extension of Monroe County
October, 2001
Monroe County Greenhouse IndustryMarket Research Study
i 10/17/01
ACKNOWLEDGEMENTS
The completion of this project would not be possible without the assistance of many individuals.I would like to thank the Monroe County Economic Development, Tom Battley, Manager, forproviding partial financial support for this project. I would like to extend special thanks toRochelle Bell, Peter Callen, and Mack Mariani at the Monroe County Department of Planningand Development; and Margaret O’Neill, Bob King, and Brian Eshenaur of Cornell CooperativeExtension of Monroe County for insight, arrangements and encouragement. Thanks also togreenhouse operators who returned their questionnaires, and to those who allowed me to visittheir businesses and gave me insight into the industry in Monroe County. Thanks to Wen-FeiUva, Ralph Freeman, Bridget Behe, and several Canadian growers for their insights into thegreenhouse business in the U.S. I would also like to extend special thanks to Edouard Mafoua forhis assistance in coding, entering, and analyzing the data, especially the empirical analysis.
This project is funded in part by the Rural New York Community Planning and PreservationGrant Program administered jointly by the New York Planning Federation and the PreservationLeague of New York State. Support is provided by the J.M Kaplan Fund and The Andy WarholFoundation for the Visual Arts.
In-kind services are provided my Lockwood Mapping Company, a division of Sanborn MapCompany, and from the following State University of New York Programs: Department ofGeography and Planning at Albany: Department of Landscape Architecture, School ofEnvironmental Science and Forestry at Syracuse; and the Department of Geography at New Paltz.
The Rural New York Grant Program supports local grassroots efforts throughout New York Statefocusing on the preservation of the built and natural environments and land use planning. Since1993, the Rural New York Grant Program was awarded over $2.0 million in direct support to 644projects.
Forty-six grants in thirty-one counties totalling $145,535 were made by the Rural New YorkCommunity Planning and Preservation Grant Program in 1999. Their grant to the MonroeCounty Department of Planning and Development in 1999 made the completion of this projectpossible.

Monroe County Greenhouse IndustryMarket Research Study
ii 10/17/01
TABLE OF CONTENTS
PageACKNOWLEDGEMENTS……………………………………………………………… i
LIST OF TABLES………………………………………………………………………. iii
LIST OF FIGURES……………………………………………………………………… iv
LIST OF APPENDICES……………………………………………………………..…. iv
EXECUTIVE SUMMARY…………………………………………………………..… v
1.0 INTRODUCTION………………………………………………………………….. 1
2.0 LITERATURE REVIEW………………………………………………………...… 22.1 The U.S. Green Industry………………………………………………………..….. 22.2 New York's Green Industry………………………………………………………... 5
3.0 MONROE COUNTY GREENHOUSE INDUSTRY SURVEY RESULTS……… 63.1 Survey Methodology…………………………………………………….………..… 63.2 Business Profile…………………………………………………….….…………… 63.3 Conclusions Drawn from Survey……………………………….………...………… 11
4.0 EMPIRICAL ANALYSIS OF GREENHOUSE INDUSTRY PRODUCTIVITY… 13
5.0 CASE STUDIES…………………………………………………………………… 165.1 New York…………………………………………………………………………... 165.2 Michigan…………………………………………………………………………… 175.3 Canada……………………………………………………………………………… 17
6.0 CONCLUSIONS AND RECOMMENDATIONS……………………………….… 196.1 Recommendations for Producers……………………………………………………. 216.2 Recommendations for Cornell Cooperative Extension and Monroe County
Department of Planning and Development……………………………………..…. 226.3 Funding Sources…………………………………………………………………….. 23
7.0 BIBLIOGRAPHY..………………………………………………………………… 24
Monroe County Greenhouse IndustryMarket Research Study
iii 10/17/01
LIST OF TABLES(Tables follow Text)
Table 1. Number, size, and sales of Monroe County greenhouses in each size category.
Table 2. Average age of Monroe County greenhouse firms by annual gross sales category.
Table 3. Marketing channels used by wholesale greenhouse firms in Monroe County.
Table 4. Marketing channels used by greenhouse businesses in Monroe County (Uva, 1997).
Table 5. Percent of retail growers in Monroe County rating the importance of each type ofcompetitor for their greenhouse firms.
Table 6. Percent of wholesale growers in Monroe County rating the importance of each type ofcompetitor for their greenhouse firms.
Table 7. The number of growers in Monroe County and approximate percentage of total salesfor each crop.
Table 8. Number and percentage of growers specialized in categories of bedding plantproduction and pre-finished plants.
Table 9. Average number of full-time, part-time, and seasonal employees per greenhouse permonth and total full-time, part-time, and seasonal, and total employees for MonroeCounty per month.
Table 10. Number of respondents ranking factors according to how much they impact business.
Table 11. Number of respondents ranking factors according to how much they impact theirability to grow healthy plants.
Table 12. Number of respondents ranking factors according to level of importance in pricedetermination.
Table 13. Number of respondents ranking factors according to level of importance in limitingexpansion.
Table 14. Number of operations, sales, wholesale sales, and payroll for selected states andcounties.
Table 15. Maximum Likelihood Estimates of Logit Model with Herfindahl Index.
Monroe County Greenhouse IndustryMarket Research Study
iv 10/17/01
LIST OF FIGURES(Figures follow Tables)
Figure 1. Annual gross sales for Monroe County greenhouse firms in 1999.
Figure 2. Percentage of the average greenhouse‘s total annual sales that occur during eachmonth.
Figure 3. Percentage of full-time and part-time firms in Monroe County.
Figure 4. Percentage of Monroe County greenhouses that provide major source of firm’sincome.
Figure 5. Age distribution of greenhouse firms in Monroe County.
Figure 6. Legal structure of greenhouse firms in Monroe County.
Figure 7. Distribution of the percent of sales from individual greenhouse firms that come fromwholesale and retail sales.
Figure 8. Average annual materials cost of Monroe County greenhouse firms in 1999.
Figure 9. Average materials cost per square foot by greenhouse size in Monroe County.
Figure 10. Average annual labor costs of Monroe County greenhouse firms in 1999.
Figure 11. Average labor costs per square foot by greenhouse size in Monroe County.
Figure 12. Average number of full-time, part-time, and seasonal employees (including familymembers) employed each month in Monroe County greenhouse firms.
Figure 13. Number of firms indicating a change in employees since 1995.
LIST OF APPENDICES(Appendices follow Figures)
Appendix A. Empirical Analysis of Monroe County Greenhouse Industry Productivity
Appendix B. Monroe County Greenhouse Industry Survey

Monroe County Greenhouse IndustryMarket Research Study
v 10/17/01
EXECUTIVE SUMMARY
The green industry is usually divided into the floriculture (greenhouse) sector and theenvironmental horticulture (nursery) sector. The floriculture sector includes cut flowers, cutcultivated greens, potted flowering plants, potted foliage plants, and bedding and garden plants.The environmental horticulture sector includes crops usually grown outdoors and used primarilyfor landscaping purposes, such as trees, shrubs, ground covers, turfgrass or sod, bulbs, andplanting stock (Johnson, 1997).
According to the U.S. Department of Agriculture (USDA) Economic Research Service (1999),the green industry is the fastest growing sector of U.S. agriculture, representing 11 percent ofgross cash farm crop receipts in 1997. New York is a key player in the green industry. New Yorkranks 10th in floriculture and environmental horticulture cash receipts, down from 5th in 1987.
Despite its lower rank, the green industry in New York benefits from a population with a highaverage income and a highly educated population. However, New York also has certainweaknesses. These include climate, cost of production, and labor shortages. The growth of themass market has reduced costs and resulted in consolidation, but the shift from a production-driven to market-driven economy has also resulted in numerous niche markets which can beexploited by local producers.
This project was conducted to explore the drivers of the greenhouse industry in Monroe County:its strengths, weaknesses, opportunities, and threats. The literature on floriculture in New Yorkand elsewhere was reviewed; a survey of greenhouse firms was conducted and analyzed; andprofessionals in the green industry on Long Island and in Michigan and Canada were interviewed.This paper will identify trends, market potential, growth potential and present recommendationsfor future directions.
Sixty-seven questionnaires were mailed in the winter of 2000. Thirty-six questionnaires werereturned, 21 of which were completely filled out, and indicated that they are a commercialgreenhouse business. The total annual gross sales volume for greenhouse floricultural crops inMonroe County in 1999, for the 21 respondents to the greenhouse survey, was $6.8 million. Theaverage sales per greenhouse firm are $326,095. The industry employs 114 people at the peakproduction time in May. The average greenhouse in Monroe County is 21,563 square feet in size,selling about ¾ of their product retail, and ¼ through wholesale channels. Bedding plants are themost important crop, but there is a lot of diversity within the county. Even though the averagegreenhouse is only about ½ acre in size, they are full-time businesses, generating a substantialamount of income. All respondents with greenhouses that are at least ¼ acre in size are full-timebusinesses for the owner, and are the owner’s major source of income.
Further analysis of the survey data suggest that retail growers in Monroe County consider largeretail chains that are mass merchandisers to be their major competition, while wholesale growersconsider Canadian growers to be their major competition. Despite competition from Canada andpreferential advantages afforded Canadian growers since NAFTA took effect in January 1994, theindustry is growing and thriving. New firms have been created, and older ones are still inbusiness. Survey results indicate that the years the firms were created range from 1880 to 1997.Six respondents increased the size of their greenhouse operation in the last five years, an averageof 16,844 square feet each. Only one firm decreased in size in the last five years, and thisdecrease was 4,000 square feet. Nine firms plan to expand their operation in the next five years.
Monroe County Greenhouse IndustryMarket Research Study
vi 10/17/01
When respondents identified the greatest deterrents to expanding their greenhouse operationsrespondents indicated that business management and marketing issues were much more importantthan production issues. These deterrents would negatively impact the greenhouse industry byresulting in excess supply. Thus, respondents ranked market demand, their own managerialexpertise, production costs, and competition to have the major impacts on their businesses in rankorder of importance from a list of choices that they were given. About an equal number ofrespondents ranked their own managerial expertise and their ability to attract and retain hourlyemployees as important as those whose ranked it very minor. This indicates wide variation inareas of expertise, and that greenhouse managers would learn a lot from each other throughmanagement clubs, discussion groups, grower associations, etc.
When asked to rank a list of factors which impact production (the traditional area extensionprograms emphasize), the uncontrollable factors such as weather and water quality were mostimportant. Crops scheduling, and cultural requirements were not considered very important.
In pricing their crops, producers considered market demand as the most important factor,followed by cost of production and product uniqueness.
Results of an empirical analysis conducted on the survey results show that increasingdiversification has a negative impact on the sales per square foot of greenhouse space. Thissuggests that while some degree of diversification reduces market risk, too much diversificationhas a negative impact on profitability. Producers should consider an attempt to specialize andperhaps buy in product from lower cost producers to supplement what they produce.
A review of other greenhouse industry in the northeastern United States indicates that LongIsland is a center of greenhouse production. Their success is due to a combination of factorsincluding weather, wealthy population, and a strong extension program. Michigan is anothersuccessful greenhouse producing area that has a large population center, a strong extensionprogram, and a history of grower organizations that fund research and educational meetings.Canada is a growing center of greenhouse production that is giving U.S. growers considerablecompetition. Canadian success include NAFTA; favorable exchange rate; Dutch immigrants inthe industry who brought in the concepts of specialization, automation, cost control, pre-sellingon a contract basis, and cooperative buying of energy. The Monroe County producers who aresuccessful despite competition from Canada seem to be the ones who don't compete head on, butinstead find niches that the Canadians don't serve. Some of them also buy the cheap, genericplants from the Canadians, and then grow other high value crops.
Monroe County producers have the advantage of a high-income population center, asdo Long Island and Michigan. They have Cornell Cooperative Extension of MonroeCounty (Extension) and the Monroe County Division of Planning interested in theirconcerns. This seems a key time to strengthen cooperation between these agencies andproducers, and to develop a strong grower organization to offer training and perhapscooperative marketing and purchasing services for producers.
Trends in the Monroe County Greenhouse Industry� The industry is growing at a rate of about 5% per year after a rapid growth of 10% annually
in the 1980s. The rate has slowed down, indicating that the industry is now a mature market.Producers will have to be more competitive than in the past to survive.

Monroe County Greenhouse IndustryMarket Research Study
vii 10/17/01
� Bedding plants are still the major crop in the region accounting for about one-third of sales,but there are several specialty growers. Each producer is unique and appears to have found aspecific niche that keeps them competitive.
� The greenhouses in Monroe County are fairly small (21,563 square feet in size) and the focusis on retail (3/4 of sales are retail).
� The focus on retail, and thus high sales per square foot of production mean that greenhousesthat are at least ¼ of an acre in size are full-time businesses for the owner, and are theowner’s major source of income.
� Business that have identified a niche market and are somewhat specialized have higher salesper square foot that less specialized producers.
� The business is very seasonal with the month of May, the prime bedding plant season,accounting for 40% of sales.
� The ratification of NAFTA in January 1994 has given Canadian growers just across theborder easy access to U. S. markets, and has made competing profitably more difficult forwholesale growers in Monroe County.
� The growth of mass merchandisers and consolidation is resulting in market saturation and isputting downward price pressure on all producers. Thus there is a need to focus on quality,service, and locally produced products and other marketing tools, as well as looking for waysto decrease cost of production.
� The recent increase in fuel prices, the potential of another increase in minimum wages, and aslowing economy all put pressure on producers to look for ways to reduce costs and controldebt so that they can survive a possible economic downturn.
� The USDA has targeted the Northeast as an under served area for crop insurance. The newAdjusted Gross Revenue crop insurance program was particularly developed for specialtycrops such as greenhouse crops. This program could address concern that some producersexpressed in visits to Monroe County for a need for affordable crop insurance.
Recommendations for Monroe County Producers� Look for energy conservation measures such as energy curtains and look at locking in fuel
purchases or having convertible boilers so they can switch fuels if the relative price changes.
� Consider automation and other ways to reduce labor and other costs. Labor costs arerelatively low in Monroe County compared to other locations, but many producers areworried that minimum wages may go up.
� Attend courses on labor management to maximize production by the labor force.
� Do not compete directly with Canada, but instead differentiate product: grow products ofdifferent sizes; choose products not grown in Canada; grow value added products; and lookfor markets Canada cannot service as well. Buy in plants from Canada that they growcheaper than the cost of production in Monroe County.
Monroe County Greenhouse IndustryMarket Research Study
viii 10/17/01
� Look for retail opportunities such as value added. Adding services and different types ofplants is generally welcome by high-income consumers. Pre-planting dish gardens, planters,and moss-lined hanging baskets are some examples of this that several producers in MonroeCounty are already doing.
� Look for niche markets. Most producers in the County are already doing this and have foundcrops that are unique to their operation, or that they produce better than the competition.Learn to listen to customers to pick up on these markets. Also look to sources such as MarthaStewart to spot trends.
�� Buy some crops from Canada and resell them, while specializing in higher value crops.
� Increase market demand by promoting locally grown, point-of-purchase promotions, etc.
�� Consider forming grower discussion groups to share managerial as well as production advice.The bimodal responses from growers on factors that impact how they grow healthy plantssuggest that growers can benefit from talking to each other.
� Increase business management expertise by taking part in training programs.
� Reduce debt if possible, or secure an operating line of credit to get through the season. Debtis necessary for capital improvements and operating costs, but producers with too much debtcannot weather a financial storm as well as those with lower debt. Work with lenders andaccountants to analyze your situation.
� Look into purchasing Adjusted Gross Revenue Crop insurance as a way of reducinguncontrollable risks.
Recommendations for Cornell Cooperative Extension and Monroe CountyDepartment of Planning and Development� Designate or hire someone to work specifically with the green industry.
� Continue cooperative arrangements between Extension and the Department of Planning andDevelopment and other agricultural agencies and surrounding counties to develop educationalprograms.
� Develop a green industry advisory committee consisting of extension and county staff as wellas growers to create a grower organization for the county and to deliver programs that addressgrower’s needs.
� Focus education efforts on marketing, business management, and labor management. Cornellhas excellent programs in labor management and greenhouse management. Utilize theseresources as well as bringing in outside expertise as needed.
� Convey energy conservation methods and repeat Extension programs on energy conservation.This is a particularly pressing issue now and should be a good program to revitalize theindustry participation in extension programs.
� Develop programs on debt reduction, cash flow management, and capital management. Thesetypes of programs will help growers compete with Canadian producers and the mass marketas well as survive an economic downturn.

Monroe County Greenhouse IndustryMarket Research Study
ix 10/17/01
� Provide subsidies or tax breaks for energy conservation or for paying the heat bills ingreenhouses along the lines of the energy conserving appliance rebate being given toconsumers by the state. If the county cannot offer these programs, work to have the statedevelop a rebate program for farmers.
� Focus educaton programs on cash flow management so that producers can weather energyprice increases.
� Focus on a marketing emphasis to find niches where they can charge higher prices to coverthe costs. Grower panels showcasing how some growers are doing this successfully wouldhelp build a grower organization, and help growers help others.
� Use New York FarmNet programs to help transition new producers into the business as olderones retire.
� Provide estate planning to help businesses continue.
� Work to promote locally grown programs and encourage state efforts in this direction.
� Provide programs in helping greenhouse owners determine their costs of production. Sincemost growers produce a multitude of crops, the often don’t know which ones are profitable.The empirical analysis suggests the productivity would increase by reducing the number ofcrops produced. Analyzing costs would help them determine which ones to drop and insteadpurchase from other growers.
� Continue to offer courses in production and new crops so that producers can compete onquality.
� Work closely with Extension staff and the Greenhouse Horticulture Program work team tomake sure problems in Monroe County are addressed and that the results of the efforts aredisseminated to producers in Monroe County via publications and extension programs.
Monroe County Greenhouse IndustryMarket Research Study
1 10/17/01
1.0 INTRODUCTION
Often overlooked in the agricultural sector are agricultural products that enhance the quality oflife either through their aesthetic properties or environmental enhancing properties. The U.S.leads the world in the production and marketing of flowers, cut foliage, potted plants, beddingplants, turfgrass, and other nursery crops. These combined products have grown to be known asthe “green” industry, also called floriculture and environmental horticulture.
The green industry is usually divided into the floriculture (greenhouse) sector and theenvironmental horticulture (nursery) sector. The floriculture sector includes cut flowers, cutcultivated greens, potted flowering plants, potted foliage plants, and bedding and garden plants.The environmental horticulture sector includes crops usually grown outdoors and used primarilyfor landscaping purposes, such as trees, shrubs, ground covers, turfgrass or sod, bulbs, andplanting stock (Johnson, 1997).
According to the U.S. Department of Agriculture (USDA) Economic Research Service (1999),the green industry is the fastest growing sector of U.S. agriculture, representing 11 percent ofgross cash farm crop receipts in 1997. New York ranks 10th in floriculture and environmentalhorticulture cash receipts, down from 5th in 1987. While sales in New York are growing, sales inthe South and West are growing faster.
Land in farms in New York decreased 3 percent and the number of farms decreased by 8 percentfrom 1992 to 1997 (New York State Dept. of Agriculture and Markets, 1999). Because NewYork has high labor costs and a cooler climate than states in the South, the state needs to focus onhigh value agriculture like the green industry to preserve farmland. Strengths for the New Yorkgreen industry include high personal income and a highly educated population. Weaknessesinclude climate, cost of construction, and labor shortages. The growth of the mass market hasreduced costs and resulted in consolidation, but the shift from a production-driven to market-driven economy has also resulted in numerous niche markets which can be exploited by localproducers.
This project was conducted to explore the drivers of the greenhouse industry in Monroe County:its strengths, weaknesses, opportunities, and threats. The literature on floriculture in New Yorkand elsewhere was reviewed; a survey of greenhouse firms was conducted and analyzed; andprofessionals in the green industry on Long Island and in Michigan and Canada were interviewed.This paper will identify trends, market potential, and growth potential, and presentrecommendations for future directions.
Monroe County Greenhouse IndustryMarket Research Study
2 10/17/01
2.0 LITERATURE REVIEW
2.1 The U.S. Green Industry
According to the USDA Economic Research Service (1999), the green industry is the fastestgrowing sector of U.S. agriculture; it represented 11 percent of gross cash farm crop receipts, or$3.5 billion, in 1997. The U.S. green industry experienced strong growth during the 1990's ofabout 5 percent annually. The value of production has grown an average of $440 million a yearsince 1991. This growth follows a decade of 10 percent growth in the 1980's (Johnson andChristensen, 1995; Johnson, 1988, 1991, and 1992; Johnson and Johnson, 1993). Grower cashreceipts for U.S. floriculture and environmental horticulture reached $12.1 billion in 1998, up 2percent from 1997. According to USDA, grower cash receipts should reach $15 billion in 2005.
The U.S. green industry is the second most important sector in U.S. agriculture in terms ofeconomic output, according to a University of Georgia study that took into account the value ofinputs purchased and returns from product handling, marketing, and distribution. This study alsorevealed that, among the various agricultural sectors, the green sector is a major employer. Onlythe combined crop sector including vegetables, fruits, tree nuts, and hay and pasture employedmore person-years in 1990 (Johnson and Christensen, 1995).
Several studies have analyzed the economic contribution of the green industry using Impact Analysisfor Planning (IMPLAN) an input-output model developed by the U.S. Forest Service. Thesestudies examined the relative size of the green industry within the U.S. economy and how it islinked to supporting industries through the volume of transactions and economic impactmultipliers. Turner and Kriesel (1995) examined the impact of the green industry on the U.S.economy in 1990 using IMPLAN. They concluded that in 1990, the green industry was the secondleading employer in the U.S. in production agriculture. In terms of output, the greenhouse andproducts sector ranked sixth within production agriculture, behind cattle, other livestock grains, othercrops and oil-bearing crops.
In 1997, U.S. consumers spent $16 billion on floriculture ($59 per capita), which was the 12th
highest in the world in terms of per capita expenditures on indoor flowers/plants. The leadingcountries with respect to per capita consumption of floriculture products are Japan, Austria,Belgium, Denmark, Finland, France, Germany, Netherlands, Norway, Sweden, and Switzerland(Johnson, 1997). Americans, on the other hand, are by far the leading consumers of outdoorlandscaping plants. In 1997, U.S. consumers spent $37 billion on environmental horticulturalproducts, or $138 per capita. A robust economy usually generates increases in housing and otherconstruction. This eventually leads to increased sales of environmental horticultural products,although there is usually a lag between sales of landscape plants and new construction. This lagcan be anywhere from 6 months (Johnson, 1997) to two years (Gineo and Omano, 1990).
Many problems in the green industry relate to economic and environmental constraints.Economic constraints include changing resources, costs (such as equipment, labor, andchemicals), and demand for plants. Environmental constraints revolve around water and soilquality, weather and pest-related stresses, and aesthetic and biological requirements.
Another important problem to be considered is the comparative advantages of producers in someregions of the United States. All 50 states produce greenhouse and nursery crops, but the top 10states (California, Florida, North Carolina, Texas, Ohio, Oregon, Michigan, Pennsylvania,Oklahoma, and New York) produce two-thirds of the total U.S. sales value of greenhouse andnursery crops. Aggregate data suggests that although the leading ten states' percentage of total
Monroe County Greenhouse IndustryMarket Research Study
3 10/17/01
grower cash receipts for greenhouse and nursery crops has remained stable (at between 65 and 70percent) over the last 30 years, the composition of these ten states has changed. From 1996 to1987, New York dropped from fifth to tenth (Johnson, 1990).
Issues addressed by research for the green industry include optimal product mix, cash flows,pricing strategies, and computer applications. These studies found that resource availabilities,input costs, and wholesale prices prevalent in climatic zones 8 and 9,as well as labor, capital, andcash flow constraints do indeed influence production decisions made by nurserymen. Nurserymenmust produce a certain minimum quantity of each plant species to make the nursery attractive tobuyers (Kizer, et al., 1987; Phillips, 1988; Hall and Phillips, 1989; Phillips and Hall, 1990;Rhodus and Taylor, 1990; Hall and Phillips, 1990a; Turner, 1990; Phillips, 1991; Hall andPhillips, 1990b; and Barton, et al., 1994).
Some studies have focused on the efficiency and profitability of the greenhouse industry bymarket period, market channel, size of firm, and crop (Kirschling and Jensen, 1974; Brumfield etal., 1982, 1984, Sowell et al., 1982; Johnson and Johnson, 1993). Small and medium-sized farmsare striving to maintain the efficiency and profitability of their operations and the financialviability of their families and communities. This is due to dramatic changes in the globalagricultural environment. In terms of policy implications, it is important to determine whatfactors lead to the improvement of the efficiency of small and medium-sized firms or to whichvariables it is related (e.g. age, education, extension services, access to credit, technical skills,farm size, fixed inputs, risk, leverage, etc.). Greenhouse firms are diversified multi-crop firms.They need to know which crops are most cost-effective for their operations. It is difficult for anoperator to determine how changing crop mixes may impact the firm’s scope efficiency (costsaving from diversification).
Adelaja et al. (1996) investigated the demand and supply side factors that drive the growth andcontraction of the ornamental industry in New Jersey using a revenue share model. Resultsobtained confirm the importance of consumer purchasing power, population growth, and realestate activity in encouraging increased ornamental activity.
Productivity refers to the efficiency of the operation of the greenhouse business. When eachproduction unit is utilized at peak efficiency revenues are increased, expenses contained, andprofitability maximized. A critical determinant of many growers’ profitability is the effectiveutilization of their greenhouse space. Achieving high sales per square foot of space is dependentupon maintaining the proper level and mix of crops, thereby realizing high turnover rates andhealthy margins. Higher sales per square foot in a greenhouse usually accompany higher profits(Strain and Hodges, 1987).
A series of studies was concerned with input-output relationships and costs of producing specificplant species including Kurume azaleas, crape myrtles, dogwood, forsythia, Buford holly, Pfitzerjuniper, and pin oaks (Badenhop, et al., 1979; Badenhop, 1980; Smith, 1980; Smith andMcConnell, 1981; Badenhop, 1979). In these studies, the advantages of various productionregions in competing for markets were delineated. Data relating to prices, product mix,distribution patterns, and other characteristics of marketing were analyzed, along with salesinvoices from representative samples of nurserymen (Free and Vitelli, 1979; Gamble, 1979;Massey, 1979; Phillips, 1979; Einert, 1979; Smith and McConnell, 1979; Smith, 1979; McNiel,1979; Wright, 1979; Crafton, et al., 1982). Differences in cultural practices accounted for most ofthe variation in the cost per salable plant. Wide variation also occurred in the kind, amount, andvalue of chemicals used in the production process. Variations in production techniques were morecommon than homogeneity of production. Economies of scale were evident.Variations in cost
Monroe County Greenhouse IndustryMarket Research Study
4 10/17/01
estimates may occur due to size of the container, kind of the plant, size and type of truck, type ofload, backhaul, loading and uploading rates, and shipping charge per mile.
The structure, conduct and performance (industrial organization) of the industry were theattention of studies of the competitive market situation and environment (Taylor, et al., 1989;Turner and Stegelin, 1989; Ames, 1990; Behe, et al., 1990; Hodges and Haydu, 1990; Phillips, etal., 1990; Bauer and Brooker, 1991; Brooker, 1991). The ornamental industry has expanded at agreater rate than almost any agricultural sector. Grower cash receipts grew from 5.0% of all cropsreceipts in 1981 to 9.1% in 1986. The trend continued in 1994 as receipts were estimated to beabout $7.0 billion or 11% of all cash crop receipts. The economic research in the area ofornamental horticulture involves four problem areas: (1) no homogeneous crops; (2) lack of dataon production, flows, and prices; (3) a general lack of uniformity (grades) with respect to specificcrops; and (4) difficulty in completing demand, price, and spatial equilibrium analysis.
Change of product ownership in competitive agricultural industries is a critical event, yet littleresearch has examined the transaction methods used by firms and the corresponding factors thatinfluence the choice of transaction method. A sample of landscape plant nurseries across the U.S.provided data to model this decision. Transaction methods included sales by telephone, personalvisits, mail order, and at trade shows. In addition, factors that influenced negotiated sales wereinvestigated. Influential factors included age of the business, size (as measured by gross sales),location, market channel used, ownership structure, and perspective on competitive situation.Using a tobit estimation procedure, profiles of nursery firms more likely to use a particulartransaction method were developed (Hinson, et al., 1995).
Recent Greenhouse ResearchA survey of the commercial members of the Perennial Plant Association (PPA) indicated thatgross sales of perennials by PPA members for 1994 was an estimated $1.38 billion, with 29percent of this amount generated from sales of perennial plants. Sales of perennials increasedover 1993 levels for 86 percent of all respondents. The most popular genus sold in the U.S. for1994 was Hosta, followed by: Hemerocallis, Coreopsis, Chrysanthemum, and Astilbe (Rhodusand Hoskins, 1995).
Research revealed that consumers preferred red poinsettia cultivars when compared to othercolors (Behe, et al., 1997b). Consumer research was conducted in garden centers to investigatepreferences for geraniums by asking the flower color, leaf variegation, and price combinations(viewed in photographs on display board) they would or would not purchase. Red and lavenderwere the preferred colors, while zonal and plain were the most preferred leaf variegation, and lowprices were preferred. A simulated blue geranium was not popular as it consistently ranked in thelower third of the preferred combinations (Behe, et al, 1997a). Another product demand that wasinvestigated using focus groups was wildflower sod (Barton, et al., 1996).
Research was conducted on consumer perceptions and expectations of garden center productsservice quality (Hudson, et al., 1997). Another project investigated the stability of target marketsfor landscape plants over a nine-year period (Turner, 1997). The different outlets analyzed in thisstudy were large retail stores (Kmart, Walmart, etc.), large lawn and garden centers (Pikes, etc.),and local lawn and garden centers. Economic models were developed to identify factors thatwould explain the percentage of plants purchased at different outlets. The results confirmprevious results that different target markets exist for different types of retail outlets for landscapeplants. The problem appears to be the lack of stability of the identified target markets. Althoughsome identified factors appear to be significant over a nine-year period, most of the identifiedsegmenting variables did not. This indicates that different markets will continue to exist, and that

Monroe County Greenhouse IndustryMarket Research Study
5 10/17/01
different producers can continue to fill those markets. For example, large producers can supplythe mass market, while smaller producers can capture more of the consumer dollar by directmarketing.
2.2 New York’s Green Industry
New York ranks 10th in floriculture and environmental horticulture cash receipts, down from 5th
in 1987. While sales in New York are growing, sales in the South and West are growing faster.New York accounted for 2 percent of U.S. output in 1998 (USDA Economic Research Service,1999). The green industry is the second largest sector of agriculture in New York State next todairy, with a production sales value reaching $264 million in 1998 (New York State Departmentof Agriculture and Markets, 1999). Total sales revenue from New York greenhouse productionalone was estimated to be $207 million during 1997 (Uva, 1999). However, as average annualgross receipts from greenhouse businesses showed an increasing trend for the nation, changes inreceipts in the Northeastern U.S. in general, and in New York, in particular, have not been asrobust over the last decade (Traver, 1998).
New York farmers face competition from non-agricultural industries for land and labor. Land infarms and number of farms in New York decreased 3 percent and 8 percent from 1992 to 1997,respectively (New York State Dept. of Agriculture and Markets, 1999). Because New York hashigh land and labor costs and a cooler climate than states in the South, New York producers needto focus on high value agriculture like the green industry to remain competitive and preservefarmland. The green industry is usually divided into the floriculture (greenhouse) sector and theenvironmental horticulture (nursery) sector. The floriculture sector includes cut flowers, cutcultivated greens, potted flowering plants, potted foliage plants, and bedding and garden plants.The environmental horticulture sector includes crops usually grown outdoors and used primarilyfor landscaping purposes, such as trees, shrubs, ground covers, turfgrass or sod, bulbs, andplanting stock (Johnson, 1997).
Uva (2000) showed that the size of greenhouse operations in New York State varied significantly,and bedding/garden plants were the most important product line and accounted for the highest sales.Although the majority of greenhouse producers (79 percent) used retail marketing, wholesale to massmarketers generated the highest total industry sales (45 percent). Using the IMPLAN input-outputmodel, Uva estimated the total output and employment multipliers to be, respectively, 1.552 and1.334. This means that the expenditures by greenhouse businesses for goods and services andpersonal consumption expenditures by firm employees resulted in $114.2 million in additionaloutput and 1,465 additional FTE jobs in other sectors of the state economy (indirect and inducedeffects). Therefore, the total (direct plus indirect and induced) output and employment effectsassociated with greenhouse businesses in New York were about $321 million and 5,850 FTE jobsin 1997. For every dollar of output generated by the state’s greenhouse businesses, $0.552 ofadditional output resulted through indirect and induced effect; and for every job created at agreenhouse firm, 0.334 additional jobs were generated from the secondary effects.
The green industry has become a major sector within U.S. agriculture and is of major importanceto farmers, rural communities, and consumers. The obvious prospect is for continued growthwithin the green industry.

Monroe County Greenhouse IndustryMarket Research Study
6 10/17/01
3.0 MONROE COUNTY GREENHOUSE INDUSTRY SURVEY RESULTS
The green industry is usually divided into the floriculture (greenhouse) sector and theenvironmental horticulture (nursery) sector. The floriculture sector includes cut flowers, cutcultivated greens, potted flowering plants, potted foliage plants, and bedding and garden plants.The environmental horticulture sector includes crops usually grown outdoors and used primarilyfor landscaping purposes, such as trees, shrubs, ground covers, turfgrass or sod, bulbs, andplanting stock (Johnson, 1997).
This survey was limited to the floriculture (greenhouse) sector. Potential growth also exists forthe nursery or environmental horticultural portion of the green industry. The sponsors of thisstudy may wish to examine the nursery industry in subsequent studies.
3.1 Survey Methodology
A mail questionnaire was developed to survey the greenhouse sector of the green industry inMonroe County, New York. This questionnaire was developed with input from the MonroeCounty Department of Planning and Development in conjunction with Cornell CooperativeExtension of Monroe County. Other surveys were used to develop this questionnaire. Theseinclude an unpublished survey of Monroe County greenhouse by Brian Eshenaur and aPennsylvania Greenhouse Survey (Brumfield, et al., 1993).
Sixty-seven questionnaires were mailed in March 2000 to all greenhouse growers in the Directoryof Certified Nurseries, Greenhouses, and Plant Dealers, published by the New York StateDepartment of Agriculture and Markets, Division of Plant Industry in 1999. This listdistinguishes greenhouses from nurseries.
This initial mailing was followed by a reminder postcard, and finally, by a second questionnaire.Thirty-six questionnaires were returned yielding a 55% response rate. Of those, 21 werecompletely filled out, and indicated that they are a commercial greenhouse business. These 21firms are used for the analysis, representing 26% of the original mailing list. Most of therespondents of the 15 unused returned questionnaires indicated that they did not have acommercial greenhouse. Others on the initial mailing list indicated that they were no longer inbusiness, or are non-commercial firms.
3.2 Business Profile
Annual Gross Sales VolumeThe total annual gross sales volume for greenhouse floricultural crops for the 21 respondents tothe greenhouse survey in Monroe County, was $6.8 million in 1999. Forty-three percent of therespondents had annual gross sales of $50,000 or less in 1999. The sales from these greenhousesaccounted for less than 3% of the total sales in the county. Fourteen percent (3 firms) had annualsales of $1 million or more (Figure 1). Sales from these three firms accounted for two-thirds ofthe sales volume in the county. The greenhouse industry in Monroe County does seem to closelyfollow the 80:20 rule (i.e. Twenty percent of the firms account for 80% of the sales). Seventy-sixpercent of the firms have sales of under $350,000 per year, and make up about 23% of thecounty’s total annual sales. The average annual gross sales per greenhouse firm in MonroeCounty in 1999 were $326,071, but the median gross annual sales were only $100,000.
In 1997, Wen-Fei Uva surveyed all registered plant growers in New York. The survey was mailedby the New York State Department of Agriculture and Markets, the Division of Plant Industry. In

Monroe County Greenhouse IndustryMarket Research Study
7 10/17/01
an unpublished draft, Uva reported the sales for the 29 survey returns from Monroe County ofbusinesses with more than $10,000 in annual greenhouse product sales in 1997. Uva reportedtotal receipts from greenhouse products in 1997of $25.6 million from 29 respondents with salesover $10,000. This would yield an average of $882,759 in annual gross receipts per firm, ascompared to $402,794 in gross receipts for the 17 firms with annual sales over $10,000 in thissurvey. This difference may be because several large greenhouses in Monroe County did notrespond to our survey. Both the current study and the one by Uva used the same mailing list. Herhigher response rate can probably be explained by the fact that the New York Department ofAgriculture mailed her survey, and Monroe County Cooperative Extension Service mailed ours.Producers are required by law to respond to the Census which is also administered by the NewYork Department of Agriculture, thus producers were probably more motivated to respond to thatone, and it also came earlier. Producers may have been tired of being surveyed by the time theyreceived ours.
Monthly Sales DistributionTo identify sales cycles during the year, we asked growers to indicate the percentage of the firm’stotal annual sales that occur during each month. Not surprisingly, nearly 40% of sales occurduring May, which corresponds with bedding plant sales season. June accounts for about 20% ofannual sales. Sales for July account for 7.5% of annual sales, followed by April and Decemberwith nearly 6% and 5% respectively. All of the other months account for less than 5% of annualsales. Only 5 respondents produce poinsettias, which explains why December sales account foronly 5% of annual sales. In general, the relative distribution of sales is about the same for allgreenhouse sizes (Figure 2).
Part-Time Versus Full-Time Greenhouse BusinessAbout one fourth (5) of the respondents feel their greenhouse is a part-time business, and aboutthree fourths (16) of the respondents say it is a full-time business (Figure 3). All of thegreenhouses that are over 10,000 square feet in size are full-time businesses.
Greenhouse Businesses as a Major Source of IncomeThirteen respondents (62%) derive their major income from their greenhouse (Figure 4). All butone greenhouse over 10,000 square feet in size considers the greenhouse to be their major sourceof income.
Geographical Sales AreaSeventeen greenhouses (81%) sell their products in the state of New York, three (14%) sell toneighboring states, three (14%) sell to distant states, and two (10%) sell out of the U.S.A. Forty-six percent of total sales of the three respondents who sell their products to other states are to out-of-state customers. The average out-of-country sales of the two export growers are 23% of totalsales.
Greenhouse SizeThe 21 useable questionnaires returned in this survey account for 452,827 square feet ofgreenhouse space is devoted to floricultural crops in Monroe County. The average firm size is21,563 square feet. Monroe County has several small greenhouses and a few fairly large ones(Table 1). Six greenhouses have less than 2,000 sq. ft. of greenhouse space, and four have over50,000 sq. ft. of greenhouse space. The size ranges from 100 sq. ft. to 80,000 sq. ft. The mediansize greenhouse is 8,000 sq. ft. The mode is 1,500 sq. ft. The smaller greenhouses tend to beheavily focused on retail sales. The correlation between size and age is positive, but notextremely strong. The largest four greenhouse firms who responded to the survey account for58% of the greenhouse space and 54% of the sales. Because of their emphasis on retail sales, the
Monroe County Greenhouse IndustryMarket Research Study
8 10/17/01
smaller greenhouses account for a larger percentage of sales than total greenhouse area. We knowthere are about 10 greenhouses that did not respond, including at least several very large ones. Ifthese had responded, the results would more closely match those found in the Uva study.
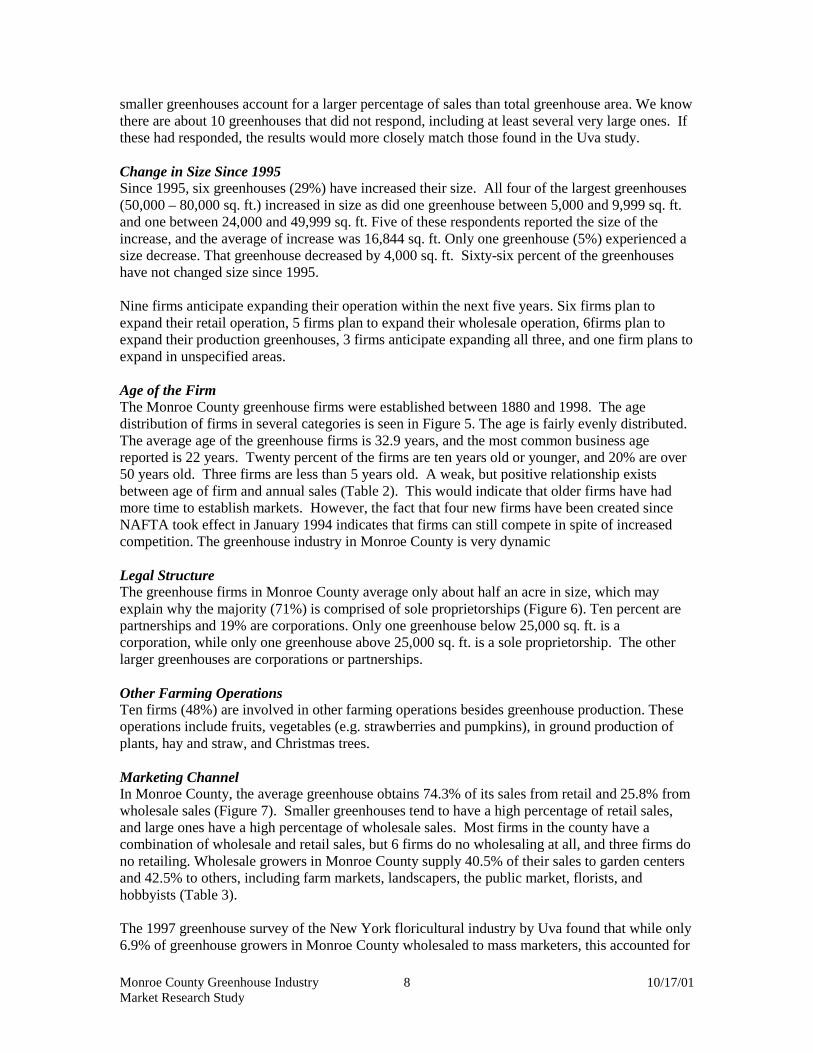
Change in Size Since 1995Since 1995, six greenhouses (29%) have increased their size. All four of the largest greenhouses(50,000 – 80,000 sq. ft.) increased in size as did one greenhouse between 5,000 and 9,999 sq. ft.and one between 24,000 and 49,999 sq. ft. Five of these respondents reported the size of theincrease, and the average of increase was 16,844 sq. ft. Only one greenhouse (5%) experienced asize decrease. That greenhouse decreased by 4,000 sq. ft. Sixty-six percent of the greenhouseshave not changed size since 1995.
Nine firms anticipate expanding their operation within the next five years. Six firms plan toexpand their retail operation, 5 firms plan to expand their wholesale operation, 6firms plan toexpand their production greenhouses, 3 firms anticipate expanding all three, and one firm plans toexpand in unspecified areas.
Age of the FirmThe Monroe County greenhouse firms were established between 1880 and 1998. The agedistribution of firms in several categories is seen in Figure 5. The age is fairly evenly distributed.The average age of the greenhouse firms is 32.9 years, and the most common business agereported is 22 years. Twenty percent of the firms are ten years old or younger, and 20% are over50 years old. Three firms are less than 5 years old. A weak, but positive relationship existsbetween age of firm and annual sales (Table 2). This would indicate that older firms have hadmore time to establish markets. However, the fact that four new firms have been created sinceNAFTA took effect in January 1994 indicates that firms can still compete in spite of increasedcompetition. The greenhouse industry in Monroe County is very dynamic
Legal StructureThe greenhouse firms in Monroe County average only about half an acre in size, which mayexplain why the majority (71%) is comprised of sole proprietorships (Figure 6). Ten percent arepartnerships and 19% are corporations. Only one greenhouse below 25,000 sq. ft. is acorporation, while only one greenhouse above 25,000 sq. ft. is a sole proprietorship. The otherlarger greenhouses are corporations or partnerships.
Other Farming OperationsTen firms (48%) are involved in other farming operations besides greenhouse production. Theseoperations include fruits, vegetables (e.g. strawberries and pumpkins), in ground production ofplants, hay and straw, and Christmas trees.
Marketing ChannelIn Monroe County, the average greenhouse obtains 74.3% of its sales from retail and 25.8% fromwholesale sales (Figure 7). Smaller greenhouses tend to have a high percentage of retail sales,and large ones have a high percentage of wholesale sales. Most firms in the county have acombination of wholesale and retail sales, but 6 firms do no wholesaling at all, and three firms dono retailing. Wholesale growers in Monroe County supply 40.5% of their sales to garden centersand 42.5% to others, including farm markets, landscapers, the public market, florists, andhobbyists (Table 3).
The 1997 greenhouse survey of the New York floricultural industry by Uva found that while only6.9% of greenhouse growers in Monroe County wholesaled to mass marketers, this accounted for
Monroe County Greenhouse IndustryMarket Research Study
9 10/17/01
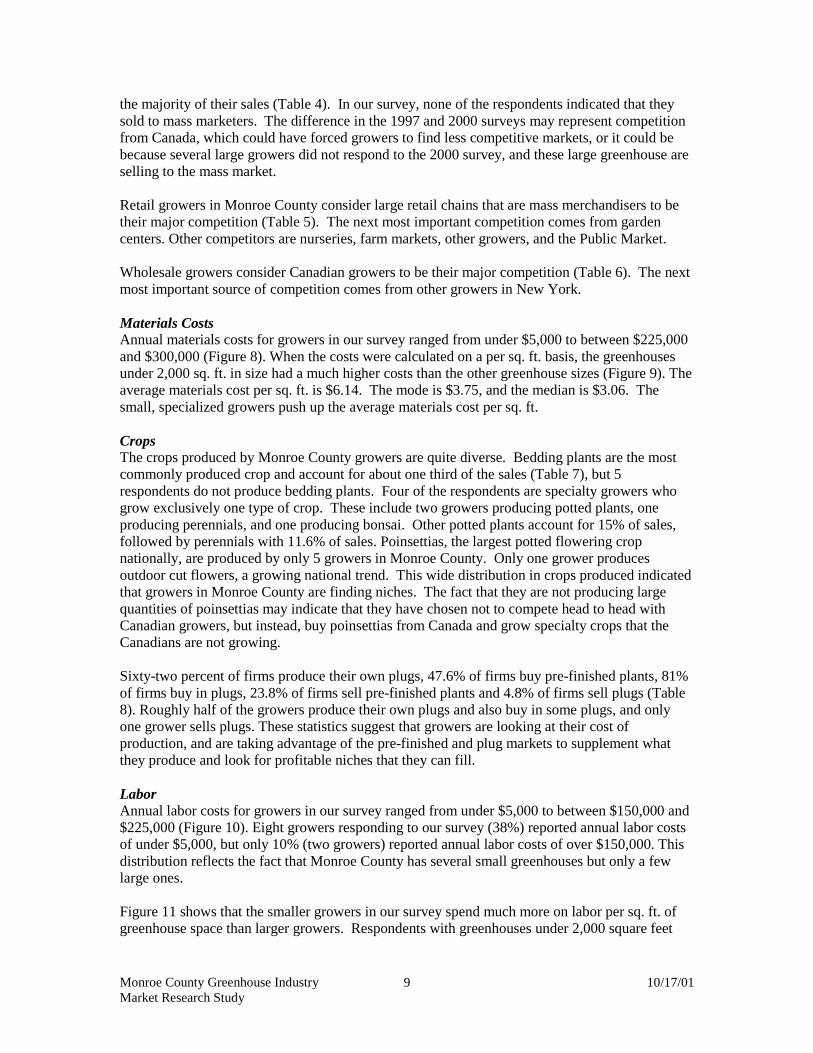
the majority of their sales (Table 4). In our survey, none of the respondents indicated that theysold to mass marketers. The difference in the 1997 and 2000 surveys may represent competitionfrom Canada, which could have forced growers to find less competitive markets, or it could bebecause several large growers did not respond to the 2000 survey, and these large greenhouse areselling to the mass market.
Retail growers in Monroe County consider large retail chains that are mass merchandisers to betheir major competition (Table 5). The next most important competition comes from gardencenters. Other competitors are nurseries, farm markets, other growers, and the Public Market.
Wholesale growers consider Canadian growers to be their major competition (Table 6). The nextmost important source of competition comes from other growers in New York.
Materials CostsAnnual materials costs for growers in our survey ranged from under $5,000 to between $225,000and $300,000 (Figure 8). When the costs were calculated on a per sq. ft. basis, the greenhousesunder 2,000 sq. ft. in size had a much higher costs than the other greenhouse sizes (Figure 9). Theaverage materials cost per sq. ft. is $6.14. The mode is $3.75, and the median is $3.06. Thesmall, specialized growers push up the average materials cost per sq. ft.
CropsThe crops produced by Monroe County growers are quite diverse. Bedding plants are the mostcommonly produced crop and account for about one third of the sales (Table 7), but 5respondents do not produce bedding plants. Four of the respondents are specialty growers whogrow exclusively one type of crop. These include two growers producing potted plants, oneproducing perennials, and one producing bonsai. Other potted plants account for 15% of sales,followed by perennials with 11.6% of sales. Poinsettias, the largest potted flowering cropnationally, are produced by only 5 growers in Monroe County. Only one grower producesoutdoor cut flowers, a growing national trend. This wide distribution in crops produced indicatedthat growers in Monroe County are finding niches. The fact that they are not producing largequantities of poinsettias may indicate that they have chosen not to compete head to head withCanadian growers, but instead, buy poinsettias from Canada and grow specialty crops that theCanadians are not growing.
Sixty-two percent of firms produce their own plugs, 47.6% of firms buy pre-finished plants, 81%of firms buy in plugs, 23.8% of firms sell pre-finished plants and 4.8% of firms sell plugs (Table8). Roughly half of the growers produce their own plugs and also buy in some plugs, and onlyone grower sells plugs. These statistics suggest that growers are looking at their cost ofproduction, and are taking advantage of the pre-finished and plug markets to supplement whatthey produce and look for profitable niches that they can fill.
LaborAnnual labor costs for growers in our survey ranged from under $5,000 to between $150,000 and$225,000 (Figure 10). Eight growers responding to our survey (38%) reported annual labor costsof under $5,000, but only 10% (two growers) reported annual labor costs of over $150,000. Thisdistribution reflects the fact that Monroe County has several small greenhouses but only a fewlarge ones.
Figure 11 shows that the smaller growers in our survey spend much more on labor per sq. ft. ofgreenhouse space than larger growers. Respondents with greenhouses under 2,000 square feet
Monroe County Greenhouse IndustryMarket Research Study
10 10/17/01
spend an average of $8.03 per sq. ft. on labor, whereas growers in the 50,000 to 80,000 sq. ft.category spend only $1.84 per sq. ft.
Total EmployeesThe greenhouse industry is a seasonal business. The average number of employees pergreenhouse varies from 1.9 per greenhouse in January, to 5.4 employees per greenhouse in May(Figure 12). This includes full-time, part-time, and seasonal employees. The total number for therespondents of this survey ranged from 40 in January to 114 in May (Table 9).
Since 1995, the number of employees has increased in 24% of firms, has stayed the same in 57%of firms, and decreased in only 5% of firms (Figure 13).
CompetitionMost of the greenhouses (81%) in this sample have not investigated plans for expansion by thecompetition. When asked about their own plans for expansion, five greenhouses indicated thatthey plan to expand into a niche market. The two niche markets mentioned are African violetproduction and container gardens.
In response to the open-ended survey question, “What is the greatest deterrent to expanding yourgreenhouse operation?” respondents indicated: time (4), availability of good hired labor (3),Canadian growers (3), capital (2), market saturation (2), age (of owner)(2), too tired, keeping ahandle on quality of the crop, labor cost, fuel cost, regulations, taxes, and cash flow from Julythrough April. In response to the open-ended survey question, “What is the greatest deterrent forthe industry expanding in Monroe County?” respondents reported: Canadian growers selling atlower costs (7), competition from mass marketers (3), taxes (2), business costs (2), marketsaturation (2), taxes (2), low demand for products, regulations, fire codes, and insurance costs. .
Respondents were given a list of factors and asked to rank them according to how much thesefactors impact their business (Table 10). The most important factor was market demand, whichwas ranked as very important by nine respondents. Seven respondents ranked their ownmanagerial expertise, production costs and competition as very important. Interestingly, 7respondents ranked their own managerial expertise as very minor in how it impacts theirbusinesses. The least important factor was the ability to attract and retain competentmanagement. This may be unimportant because they already have management in place, orbecause they are the manager and feel they are doing a good job or have the skills they need. Theability to attract and retain hourly employees also had a bimodal distribution with fiverespondents ranking it as very minor and six respondents ranking it as very important. A similarpattern appeared with environmental regulations and other governmental regulations where sixrespondents ranked these factors as very important, but five ranked them as very minor. Onerespondent ranked “other” as very important, and wrote in gas and electric costs as this factor.Since energy prices have risen considerably since the survey was conducted, this would probablybe a very important factor for many respondents now.
Respondents were given a list of factors and asked to rank them according to how much theyimpact their ability to grow healthy plants (Table 11). The most important factor was weatherfollowed by water quality. In general, producers think that scheduling crops in the greenhouse orthe cultural requirements (i.e. pinching, watering, fertilizing, pest and disease control, lighting,spacing, etc.) of new crops have a very minor impact on their ability to grow plants. Controllinginsects has a bimodal distribution with five respondents ranking it as very important and anotherfive ranking it as very minor. A similar pattern exists for controlling weeds and diseases.
Monroe County Greenhouse IndustryMarket Research Study
11 10/17/01
PricingWe asked respondents to rank the importance of a list of factors in price determination (Table12). Eleven respondents ranked market demand as very important. No respondents consideredmarket demand to be very minor or minor in price determination. Ten respondents rankedproduction and product uniqueness as very important. These responses indicate that marketing isvery important, as well as finding niches, but that competition is putting pressure on prices andforcing producers to reduce cost of production.
Factors Limiting Business ExpansionWe asked respondents to rank the importance of a list of factors according to level of importancein limiting expansion (Table 13). Eight respondents ranked capital and personnel as veryimportant limiting factors for the expansion of the business. Eight respondents ranked marketingas important. Transportation was not ranked as very important by anyone, and was ranked as veryminor by five respondents. Plant selection was considered a very important factor that limitsexpansion of the business by five respondents, but was considered a very minor factor in limitingexpansion by five other respondents.
3.3 Conclusions Drawn from Survey
The total annual gross sales volume for greenhouse floricultural crops in Monroe County in 1999,for the 21 respondents to the greenhouse survey, was $6.8 million. The average sales pergreenhouse firm are $326,095. The industry employs 114 people at the peak production time inMay. The average greenhouse in Monroe County is 21,563 square feet in size, selling about ¾ oftheir product retail, and ¼ through wholesale channels. Bedding plants are the most importantcrop, but there is a lot of diversity within the county. Even though the average greenhouse is onlyabout ½ acre in size, they are full-time businesses, generating a substantial amount of income. Allrespondents with greenhouses that are at least ¼ acre in size are full-time businesses for theowner, and are the owner’s major source of income.
Further analysis of the survey data suggest that retail growers in Monroe County consider largeretail chains that are mass merchandisers to be their major competition, while wholesale growersconsider Canadian growers to be their major competition. Despite competition from Canada andpreferential advantages afforded Canadian growers since NAFTA took effect in January 1994, theindustry is growing and thriving. New firms have been created, and older ones are still inbusiness. Survey results indicate that the years the firms were created range from 1880 to 1997.Six respondents increased the size of their greenhouse operation in the last five years, an averageof 16,844 square feet each. Only one firm decreased in size in the last five years, and thisdecrease was 4,000 square feet. Nine firms plan to expand their operation in the next five years.
When respondents identified the greatest deterrents to expanding their greenhouse operationsrespondents indicated that business management and marketing issues were much more importantthan production issues. These deterrents would negatively impact the greenhouse industry byresulting in excess supply. Thus, respondents ranked market demand, their own managerialexpertise, production costs, and competition to have the major impacts on their businesses in rankorder of importance from a list of choices that they were given. About an equal number ofrespondents ranked their own managerial expertise and their ability to attract and retain hourlyemployees as important as ranked it very minor. This suggests that greenhouse managers wouldlearn a lot from each other through management clubs, discussion groups, grower associations,etc.

Monroe County Greenhouse IndustryMarket Research Study
12 10/17/01
When asked to rank a list of factors which impact production (the traditional area extensionprograms emphasize), the uncontrollable factors such as weather and water quality were mostimportant. Crops scheduling, and cultural requirements were not considered very important.
In pricing their crops, producers consider market demand as the most important factor, followedby cost of production and product uniqueness.
Monroe County Greenhouse IndustryMarket Research Study
13 10/17/01
4.0 Empirical Analysis of Greenhouse Industry Productivity
The effective utilization of greenhouse space is one critical determinant of grower profitability. Inorder to achieve high sales per square foot of space, a grower must maintain the proper level andmix of crops, thereby realizing high turnover rates and healthy margins. Higher sales per squarefoot in a greenhouse are usually associated with higher profits (Strain and Hodges, 1987). Usingthe results of the survey, it is possible to identify a number of factors associated with theattainment of high space productivity.1
Measuring Firm ProfitabilityThe space productivity of a firm can be measured by its sales per square foot. Each firm’s salesper square foot can be calculated by taking its annual sales (Question 31) and dividing it by itssquare feet of production area (Question 8). For all the cases in the survey, the midpoint of salesper square foot was $25. Using this midpoint, firms were divided into two groups, those withsales above $25 per square foot and those below that point.
Factors Affecting Firm ProfitabilityThere are a number of factors likely to affect firm profitability, including the age of the business,the legal structure, the cost of materials and supplies, whether the firm includes a retail business,and whether the firm is the major source of income for the grower.
The firm’s degree of diversification may also have a positive impact on profitability.2Diversification versus specialization is an important element in understanding the structure of thegreenhouse industry in Monroe County, New York. Related diversification occurs when thegreenhouse firm participates in synergistic enterprises that is enterprises among which managerscan easily transfer their skills. In this study, we use Herfindahl and Entropy Indexes as scalemeasures of diversification or specialization. Indexes of firm diversification provide us with anidea of the number of crops a greenhouse produces and the relative importance of each crop to thefirm. These indexes have a continuous range between 0 and 1.
The AnalysisThe logit model was selected as a regression method since it is commonly used in settings wherethe dependent variable is binary. Because the data are individual firms rather than aggregate
observations, the appropriate estimation method of choice is the maximum likelihood method.3Due to a few growers not answering some of the questions associated with variables in theestimation, the sample size was reduced to 20 observations. The parameters of all models areestimated using cross-sectional firm-level data and SAS/ETS statistical package. An initial
1 Productivity refers to the efficiency of the operation of the greenhouse business. It is when eachproduction unit is utilized at peak efficiency that revenues are increased, expenses contained andprofitability maximized2 The relationship between diversification and profitability has been the subject of considerable research,with varying results. Rumelt (1974), Montgomery (1985) and Palapu (1985) found a positive relationshipbetween firm performance and related diversification due to synergy, scale economies in production andmarketing, or market power. Arnould (1969) and Markham (1973) found no significant positiverelationship between diversification and firm performance. More recent research by Ding et al. (1997) doesnot lend strong support to the diversification-performance relationship suggested by the previous studies.3 Among the beneficial characteristics of maximum likelihood method are that the parameter estimates areconsistent and asymptotically efficient.
Monroe County Greenhouse IndustryMarket Research Study
14 10/17/01
regression was estimated using all independent variables except those related to greenhouse firmdiversification or specialization (Herfindahl and Entropy Indexes). After evaluating the overall fitof the initial model along with each variable’s coefficient sign and significance, insignificantvariables were deleted in order to explore the impacts of diversification measures on the averagegreenhouse firm productivity. See the Appendix for further discussion of the model, firmdiversification theory and scale measures.
The Findings – Model #1The first model analyzes the affect of the following variables on space productivity:
• The age of the greenhouse firm (AGEi)• The cost of materials and supplies (MATSALESi)• The legal structure of the greenhouse firm, whether it is a sole proprietorship or otherwise
(SOLEi)• The firm’s reliance on retail, measured by whether the firm obtains at least 50% of its sales
from a retail operation (RETAILi)• Whether the greenhouse is the major source of income for the firm (INCOMEi)• The diversity of production at the greenhouse, as measured by the Herfindahl Index
(HFINDEXi).
The findings of this first model are summarized in Table 15. The independent variables explain76% of the variation in the productivity of greenhouse firms.
A number of variables had a negative impact on the probability that a grower would have highspace productivity (sales per square foot of $25 or more). A higher cost of materials and supplieswas negatively associated with space productivity. Likewise, a sole proprietorship structure, and afirm’s reliance on the greenhouse as the major source of income were negatively associated withproductivity.
There are also several variables in this first model that were positively associated with high spaceproductivity. Firms that were more reliant on retail were more likely to have high spaceproductivity, as were firms that scored high in specialization on the Herfindahl Index. The ageof the firm was also positively associated with space productivity, but the impact was not as great.
The Findings – Model #2A second model was created using an alternate measure of product diversity. While the firstmodel used the Herfindahl Index to measure diversity, the second model used an Entropy Indexto measure diversity (ENTROPYi). The other variables present in the first model (AGEi,MATSALESi, SOLEi, RETAILi, INCOMEi) are also included in this second model.
The independent variables in this second model explain 51% of the variation in the productivityof greenhouse firms. All the variables included in the first model have the same direction ofcausality. However, increasing product diversification as measured by the Entropy Index has anegative impact on the probability of high space productivity. This is consistent with the firstmodel with respect to variable HFINDEXi. The negative and significant impact of relateddiversification on greenhouse firm performance is expected and consistent with the findings ofseveral other diversification-performance studies (Arnould, 1969; Markham, 1973), which foundno significant positive relationship between diversification.
As in the first model, reliance on a retail operation for at least 50% of sales had a positiveassociation with space productivity. In the case of this second model, this relationship was also

Monroe County Greenhouse IndustryMarket Research Study
15 10/17/01
statistically significant. The age of the firm was also positively associated with high spaceproductivity, but the impact was relatively small and just beyond the range of statisticalsignificance.
Other findings also reflected those in the first model. The cost of materials and supplies had astrongly negative impact on the likelihood a firm would have high space productivity. A soleproprietor structure and reliance on the greenhouse as a major source of income for the firm werealso negatively associated with space productivity.

Monroe County Greenhouse IndustryMarket Research Study
16 10/17/01
5.0 CASE STUDIES
5.1 New York
In addition to statistical data, I spoke with Ralph Freeman, retired county agent from Long Island,and Karen Dean Hall, Extension Educator, CCE of Erie County, Margery Daughtrey, SeniorExtension Associate, Plant Pathology, Long Island Horticulture Research & Extension Center, aswell producers and numerous people in Cornell Cooperative Extension, the Monroe CountyDepartment of Planning and Development, and Farm Credit to get a picture of the greenhouseindustry in the key production centers in New York.
The centers of the green industry in New York in order of importance are:
1. Long Island – Suffolk County2. Erie County2. Orange County3. Monroe County
Long IslandThe 1998 Census of Horticultural Specialties reported that Suffolk County, Long Island had 180commercial operators and $697,667 in average sales per operation (Table 14). These figures aremore than triple the size of the Monroe County statistics. Wholesale operations in Suffolk Countyrepresented 71% of the commercial operations, and 88.5% of the sales were wholesale sales.This contrasts with Monroe County, which reported having only 51% wholesale operations, andonly 24.5% of the sales from wholesale transactions.
Long Island had favorable weather (high light, moderate temperatures, and adequate rainfall), alarge, high-income population base, and strong extension programs in horticulture. Long Islandgreenhouse businesses can be classified into three major types. The very largest growers sell tothe mass market stores, such as Home Depot and K-Mart, where products compete on price. Themedium sized growers try to grow something slightly different from what the mass markets sell.They tend to sell of upscale garden centers, where clients pay for high quality. Products includeProven Winners and large pots for patios. The smaller growers find a unique niche and focus onmarketing. Niches include specialty annuals, Phalaenopsis, and herbs.
Long Island has a strong extension program that is well staffed. Most of the funding comes fromcounty sources, user fees, and grants. Extension has a strong relationship with county officialsand legislators, who support extension programs.
Erie CountyErie County reported a high percentage of wholesale operations (64%), and 77.4% of greenhousesales are wholesale in the 1998 Census of Horticultural Specialties. The sales per operationaveraged $367,266 per operation in the 1998 Census of Horticultural Specialties, nearly doublethe sales per operation in Monroe County. The operations in Erie County were very laborintensive, with payroll accounting for 47.5% of sales.
Erie County has an active floricultural advisory group of 20 to 30 professional flower growerswho meet frequently meet for dinners to plan grower meetings. Erie County has a quarterlynewsletter that goes to greenhouse owners.
Monroe County Greenhouse IndustryMarket Research Study
17 10/17/01
Monroe CountyIn the 1998 Census of Horticultural Specialties greenhouse operators in Monroe County reporteda lower percentage of wholesale operations and a much lower percentage of wholesale sales thanother key floricultural areas of the state. Monroe County reported that only 51% of theiroperations were wholesale and only 24.5% of sales were wholesale. Monroe County also hadlower sales per greenhouse than Suffolk, Erie, or Orange Counties. Monroe County operatorsreported a relatively lower payroll than other key production areas. Payroll for Monroe Countywas only 23.8% of sales. Their focus on retail is probably appropriate given their proximity to ahigh-income population, and the competitive pressure from wholesale growers in Canada.
Both Long Island and Erie County have stronger grower organizations than does Monroe County.The producers in Suffolk and Erie County seem willing to share information with each other andattend extension meetings. Monroe and Erie County have a cooperative arrangement whereKaren Dean Hall covers the greenhouse industry for both Erie and Monroe County, and BrianEschenaur covers turf for both counties. Monroe County charges a fee to be a member ofextension and receive mailings, meeting notices, and publications. Notices of meetings go out toother growers as well. Monroe County does not have an active grower association, and producerstend not to attend extension meetings. In spite of a very timely program offered on energyconservation in November 2000, only 4 growers from Monroe County attended.
The major concerns are competition from Canadian producers, especially since NAFTA, and oversaturation of the market, primarily from chain stores.
5.2 Michigan
Michigan has three major centers of greenhouse production: the Detroit area, Ottawa County, andKalamazoo County. Each of these areas has more greenhouse operations, higher sales peroperation, a higher percentage of wholesale operations, a larger percentage of wholesale sales,and a higher percentage of sales spent on payroll than Monroe County.
I spoke with Dr. Bridget Behe, Associate Professor, and Dr. Wil Carlson, Professor andDistinguished Faculty Member, Department of Horticulture, Michigan State University to learnmore about why these areas developed as centers of production. The Kalamazoo bedding plantsindustry grew out of a changed vegetable industry. They are close to a large population center,thus the demand, and as food sourcing changed so did the growers.
Michigan has a strong extension program in the local centers of production and state-wide. Thereis a great deal of cooperation and two-way support between the industry and theuniversity/extension. Growers cooperatively fund research at Michigan State to solve theproblems of the industry. This appears to be driven by competent, charismatic faculty as well asthe industry itself. Bedding Plants International, a nationwide grower organization had itsbeginnings in Michigan largely through the efforts of Wil Carlson and his relationship with theindustry. Growers fund research at Michigan State University, and thus have a say in what typesof research is conducted, and ensuring that it addresses their needs.
5.3 Canada
Although Canadian growers are further north than Monroe County growers and may face moreheating requirements, poorer lighting conditions, and further distances from U.S. markets thangrowers in Monroe County, the Canadian greenhouse industry has continued to grow over thepast two decades. In 1998, total sales increased 7.7% to reach $1,189 million. However, the total
Monroe County Greenhouse IndustryMarket Research Study
18 10/17/01
area used for greenhouse production increased by only 0.2%, to 3,192 acres. Revenues generatedfrom the sale of flowers and plants increased by 7.3% to $904 million from $834 million in 1997.Ontario continues to account for the largest proportion of these sales at 51.7%, followed byBritish Columbia with 22.7%, and Quebec with 11.8%. Sales to wholesalers account for 25.4% oftotal flower and plant sales followed by 21.4% sold directly to the public. In 1998, the vegetableshare of total greenhouse sales decreased to 24%. The sale of vegetable bedding plants increaseddramatically by 37.2% from 254 million plants in 1997 to 348 million plants in 1998 (Prange andDean, 2001).
Several producers in Monroe County felt that the Canadians are unfairly subsidized andAmerican growers are not. I interviewed some of the Canadian growers to get their insight on thesuccess of Canadian floriculture. I obtained a list of 10 Canadian growers from a representative ofYoder Brothers, the largest propagator of chrysanthemums in the world. Yoder Brothers has aCanadian production facility. I spoke with several of these Canadian growers to gain insights intotheir reasons for success in the U.S. market. Keys to Canadian success from the viewpoint ofCanadian growers are:
� Many of the Canadian growers are Dutch immigrants who focus on cost cutting measures,automation, and efficient production so they can compete in price competitive markets.
� Canadian growers have formed an energy co-op of growers so they buy their energycooperatively, and the price is fixed for the season, thus keeping this input cost low.
� Most producers are very large relative to Monroe County growers, so they get economies ofscale.
� Canadian growers produce few crops, so they can specialize and automate, keeping costsdown.
� The U.S. market is huge, and the industry is booming, so the market is expanding with morepeople willing to buy floricultural crops.
� Some of the Canadian growers specialize and buy product from other growers rather thanproducing everything themselves.
� Canadian producers focus on the mass market, but some of them sell to supermarkets whereprices are not as competitive rather than the huge mass markets like WalMart where pricesare more competitive.
� NAFTA, which took effect in January 1994, gives Canadian growers easy access to U.S.markets.
� The current exchange rate with a strong U.S. dollar is favorable for Canadian growers whoare selling in the U.S.
� Canadian growers focus on improving the quality so that the market can continue to expand.
� Canadians try to make contracts at the beginning of the season.
� Canadian producers are always looking for new crops with higher profit margins. They findit difficult to make money on crops like pot mums where competition is stiff.
Monroe County Greenhouse IndustryMarket Research Study
19 10/17/01
6.0 CONCLUSIONS AND RECOMMENDATIONS
The total annual gross sales volume for greenhouse floricultural crops in Monroe County in 1999,for the 21 respondents to the greenhouse survey, was $6.8 million. The average sales pergreenhouse firm are $326,095. The industry employs 114 people at the peak production time inMay. The average greenhouse in Monroe County is 21,563 square feet in size, selling about ¾ oftheir product retail, and ¼ through wholesale channels. Bedding plants are the most importantcrop, but there is a lot of diversity within the county. Even though the average greenhouse is onlyabout ½ acre in size, they are full-time businesses, generating a substantial amount of income. Allrespondents with greenhouses that are at least ¼ acre in size are full-time businesses for theowner, and are the owner’s major source of income.
Further analysis of the survey data suggest that retail growers in Monroe County consider largeretail chains that are mass merchandisers to be their major competition, while wholesale growersconsider Canadian growers to be their major competition. Despite competition from Canada andpreferential advantages afforded Canadian growers since NAFTA took effect in January 1994, theindustry is growing and thriving. New firms have been created, and older ones are still inbusiness. Survey results indicate that the years the firms were created range from 1880 to 1997.Six respondents increased the size of their greenhouse operation in the last five years, an averageof 16,844 square feet each. Only one firm decreased in size in the last five years, and thisdecrease was 4,000 square feet. Nine firms plan to expand their operation in the next five years.
Producers indicated that the major factors that deter expansion of the industry are related tobusiness and marketing, primarily competition from Canada and mass marketers, cost ofproduction (especially labor and fuel), regulation, market saturation, their own managerial ability,and cash flow problems resulting from seasonality of the business.When asked to rank a list of factors which impact production (the traditional area extensionprograms emphasize), the uncontrollable factors such as weather and water quality were mostimportant. Crops scheduling, and cultural requirements were not considered very important.
In pricing their crops, producers consider market demand as the most important factor, followedby cost of production and product uniqueness.
Results of the empirical analysis showed that increasing diversification has a negative impact onthe sales per square foot of greenhouse space. This suggests that while some degree ofdiversification reduces market risk, too much diversification has a negative impact onprofitability. Producers should attempt to specialize and perhaps buy in product from lower costproducers to supplement what they produce.
Case StudiesLong Island is a center of greenhouse production. Their success is due to a combination offactors including weather, wealthy population, and a strong extension program. Michigan isanother successful greenhouse producing area that has a large population center, a strongextension program, and a history of grower organizations that fund research and educationalmeetings. Canada is a growing center of greenhouse production that is giving U.S. growersconsiderable competition. Canadian success include NAFTA; favorable exchange rate; Dutchimmigrants in the industry who brought in the concepts of specialization, automation, costcontrol, pre-selling on a contract basis, and cooperative buying of energy. The Monroe Countyproducers who are successful despite competition from Canada seem to be the ones who don'tcompete head on, but instead find niches that the Canadians don't serve. Some of them also buythe cheap, generic plants from the Canadians then grow other high value crops.
Monroe County Greenhouse IndustryMarket Research Study
20 10/17/01
The greenhouse growers in Monroe County who are successfully competing against theCanadians seem to be the ones who don't compete head on, but instead find niches that are notserved by the Canadians. Some successful producers in Monroe County use the cheaperCanadian products to their advantage by buying the cheap, genericplants from the Canadians and growing other high value crops.
Monroe County producers have the advantage of a high-income population center, asdo Long Island and Michigan. They have Cooperative Extension and the MonroeCounty Division of Planning interested in their concerns. This seems a key time tostrengthen cooperation between these agencies and producers, and to develop a stronggrower organization to offer training and perhaps cooperative marketing andpurchasing services for producers.
Summary of Trends� The industry is growing at a rate of about 5% per year after a rapid growth of 10% annual in
the 1980s, but the rate has slowed down, indicating that the industry is now a mature market.Producers will have to be more competitive than in the past to survive.
� Bedding plants are still the major crop in the region accounting for about one-third of sales,but there are several specialty growers. Each producer is unique and appears to have found aspecific niche that keeps them competitive.
� The greenhouses in Monroe County are fairly small (21,563 square feet in size) and the focusis on retail (3/4 of sales are retail).
� The focus on retail, and thus high sales per square foot of production mean that greenhousesthat are at least ¼ of an acre in size are full-time businesses for the owner, and are theowner’s major source of income.
� Business that have identified a niche market and are somewhat specialized have higher salesper square foot that less specialized, highly diversified producers.
� The business is very seasonal with the month of May, the prime bedding plant seasonaccounting for 40% of sales.
� The ratification of NAFTA in January 1994 has given Canadian growers just across theborder easy access to U. S. markets, and has made competing profitably more difficult forwholesale growers in Monroe County.
� The growth of mass merchandisers and consolidation is resulting in market saturation and isputting downward price pressure on all producers. Thus there is a need to focus on quality,service, and locally produced products and other marketing tools as well as looking for waysto decrease cost of production.
� The recent increase in fuel prices, the potential of another increase in minimum wages, and aslowing economy all put pressure on producers to look for ways to reduce costs and controldebt so that they can survive a possible economic downturn. This program could addressconcern that some producers expressed in visits to Monroe County for a need for affordablecrop insurance.
Monroe County Greenhouse IndustryMarket Research Study
21 10/17/01
� The USDA has targeted the Northeast as an under served area for crop insurance. The newAdjusted Gross Revenue crop insurance program was particularly developed for specialtycrops such as greenhouse crops.
6.1 Recommendations for Producers
� Look for energy conservation measures such as energy curtains and look at locking in fuelpurchases or having convertible boilers so they can switch fuels if the relative price changes.
� Consider automation and other ways to reduce labor and other costs. Labor costs arerelatively low in Monroe County compared to other locations, but many producers areworried that minimum wages may go up.
� Attend courses on labor management to help get the most production out of the labor force.
� Do not compete directly with Canada, but instead produce sizes of product, and differentproducts that they don’t grow, grow value added products, and look for markets they can’tservice as well. Buy in plants from Canada that they grow cheaper than the cost of productionin Monroe County.
� Look for retail opportunities such as value added. Adding services and different types ofplants is generally welcome by high-income consumers. Pre-planting dish gardens, planters,and moss-lined hanging baskets are some examples of this that some producers in MonroeCounty are already doing.
� Look for niche markets. Most producers in the County are already doing this and have foundcrops that are unique to their operation, or that they produce better than the competition.Learn to listen to customers to pick up on these markets. Also look to sources such as MarthaStewart to spot trends.
�� Buy some crops from Canada and resale them, while specializing in higher value crops.
� Increase market demand by promoting locally grown, point-of-purchase promotions, etc.
�� Consider forming grower discussion groups to share managerial as well as production advice.The bimodal responses from growers on factors that impact how they grow healthy plantssuggest that growers can benefit from talking to each other.
� Increase business management expertise by taking part in training programs.
� Reduce debt if possible, or secure an operating line of credit to get through this season. Debtis necessary for capital improvements and operating costs, but producers with too much debtcannot weather a financial storm as well as those with lower debt. Work with lenders andaccountants to analyze your situation.
� Look into purchasing Adjusted Gross Revenue Crop insurance as a way of reducinguncontrollable risks.
Monroe County Greenhouse IndustryMarket Research Study
22 10/17/01
6.2 Recommendations for Cornell Cooperative Extension and Monroe CountyDepartment of Planning and Development
� Designate or hire someone to work specifically with the green industry.
� Continue cooperative arrangements between Cooperative Extension and the Department ofPlanning and Development and other agricultural agencies and surrounding counties todevelop educational programs.
� Develop a green industry advisory committee consisting of extension and county staff as wellas growers to create a grower organization for the county and delivery programs that addressgrower’s needs.
� Focus education efforts on marketing, business management, and labor management. Cornellhas excellent programs in labor management and greenhouse management. Utilize theseresources as well as bringing in outside expertise as needed.
� Develop energy conservation methods and extension programs on energy conservation. Thisis a particularly pressing issue now and should be a good program to revitalize the industryparticipation in extension programs.
� Develop programs on debt reduction, cash flow management, and capital management. Thesetypes of programs will help growers compete with Canadian producers and the mass marketas well as survive an economic downturn.
� Provide subsidies or tax breaks for energy conservation or for paying the heat bills ingreenhouses along the lines of the energy conserving appliance rebate being given toconsumers by the state. If the county cannot offer these programs, work to have the statedevelop a rebate program for farmers.
� Focus on cash flow management and courses on this so they producers can weather energyprice increases.
� Marketing emphasis to find niches where they can charge higher prices to cover the costs.Grower panels showcasing how some growers are doing this successfully would help build agrower organization, and help grower help others. There are already many successful suchproducers in the county.
� Use New York FarmNet programs to help transition new producers into the business as olderones retire.
� Provide estate planning to help businesses continue.
� Work to promote locally grown programs and encourage state efforts in this direction.
� Provide programs in helping greenhouse owners determine their costs of production. Sincemost growers produce a multitude of crops, the often don’t know which ones are profitable.The empirical analysis suggests the productivity would increase by reducing the number ofcrops produced. Analyzing costs would help them determine which ones to drop and insteadpurchase from other growers.

Monroe County Greenhouse IndustryMarket Research Study
23 10/17/01
� Continue to offer courses in production and new crops so that producers can compete onquality.
� Work closely with Cornell’s Greenhouse Horticulture Work Team to make sure problems inMonroe County are addressed and that the results of the efforts are disseminated to producersin Monroe County via publications and extension programs.
6.3 Funding Sources
Possible funding sources for producers seeking to invest in energy saving technology include:
� New York State Department of Ag. and Markets, Thomas, Lindberg, Ag Energy PilotProject, 518-485-7728.
� New York State RITA (Energy Research and Development Authority,www.NYSERDA.ORG.
Possible funding sources for Monroe County Cooperative Extension Service and Monroe CountyDivision of Planning include:
� Raise registrations/fees for programs/services for growers.� Farm Credit/Farm Bureau/other agricultural support industries.

Monroe County Greenhouse IndustryMarket Research Study
24 10/17/01
7.0 BIBLIOGRAPHY
Abdelmagid, B.D., C.D. Safley, and M.K. Wohlgenant. 1996. “The Demand for Ornamental Products in NorthCarolina” Acta Hort. Proceedings XIIIth International Symposium on Horticultural Economics, ActaHort. 429, pp.317-324.
Abdelmagid, B. D., M.K. Wohlgenant, and C.D. Safley. 1996."Demand for Plants Sold in North Carolina
Garden Centers." Agricultural and Resource Economics Review 25(1):33-50. Adelaja A.O., R.G. Brumfield, and B.J. Schilling. 1996. “Share Analysis of Drivers of Growth in the
Ornamental Industry: A Case Study of New Jersey” Acta Hort. Proceedings XIIIth InternationalSymposium on Horticultural Economics, Acta Hort. 429:301-307.
Adrian, J.L., C. Lokey, and R. Dickens. 1985. Turfgrass-Sod Marketing in Alabama. Alabama Agricultural
Experiment Station, Bull. No. 571, Auburn University, Auburn, AL. Adrian, J.L., C. Lokey, and R. Dickens. 1986. "Sod Marketing at the Consumer Level." Journal of
Environmental Horticulture 4(1):15-31. Adrian, J.L., T.E. Johnson, and B.K. Behe. 1990. "Retail Nurseries and Garden Centers Important to the
Ornamentals Industry." Alabama Agricultural Experiment Station, Highlights of Ag. Res. 37(3):14. Adrian, J.L., R. White, and R. Dickens. 1992. "Turfgrass-Sod Production as an Alternative Use for
Resources," J. American Society of Farm Managers and Rural Appraisers 56(1):41-46. Adrian, J.L., P. Duffy and M. Loyd. 1995. Competitive relationship of three warm-season turfgrass species.
J. of Agribusiness, 13(1):1-15. Ames, C. and A.E. Einert. 1987. "Characterization and Purchasing Patterns of Arkansas Retail Nurseries,"
Proceedings of the Arkansas State Horticultural Society 1987: 128-129. Little Rock, AR. Ames, C. 1990. "Commercial Distribution and Procurement Patterns of Woody Landscape Ornamentals in
Arkansas." University of Arkansas Department of Agricultural Economics M.S. Thesis.Fayetteville, AR.
Arnould, R. J. 1960. “Conglomerate Growth and Public Policy.” In Gordon, L. (ed.), Economics of
Conglomerate Growth. Department of Agricultural Economics, Oregon State University, Corvallis,OR.
Badenhop, M.B. and S-103 Technical Committee. 1979. Factors Affecting Southern Regional Production
Advantages for Kurume Azaleas. Southern Cooperative Series Bulletin 241. Badenhop, M.B. 1979. "Pfitzer Juniper Cost of Production Budget" Economics of Producing and
Marketing Woody Landscape Plants, Bulletin Y-149, TVA, NFDC, Muscle Shoals, Alabama. Badenhop, M.B. 1980. Cost of Producing and Marketing A Shade Tree: The Pin Oak. Southern
Cooperative Series, Bulletin No. 244. Badenhop, M.B. 1981. "Marketing Woody Ornamental Plants by Tennessee Nursery Wholesalers."
Tennessee Farm and Home Science, No. 120, Tennessee Agricultural Experiment Station,Knoxville, TN.
Badenhop, M. S. and T.D. Phillips. 1983. Costs of Producing and Marketing Woody Ornamental
Landscape Plants: The Pfitzer Juniper. Southern Cooperative Series, Bulletin No. 299.

Monroe County Greenhouse IndustryMarket Research Study
25 10/17/01
Badenhop, M.B. and T. Glasgow. 1985. "A Production System and Cost for Propagating DogwoodCultivars from Softwood Cuttings.” Journal of Environmental Horticulture Vol. 3, No. 2.
Badenhop, M.B., T.D. Phillips, and F.B. Perry. 1985. Costs of Establishing and Operating Field Nurseries
Differentiated by Size of Firm and Species of Plant in U.S.D.A. Climatic Zones 7 and 8. SouthernCooperative Series, Bulletin No. 311.
Barton, S.S., J.L. Haydu, R.A Hinson, R.E. McNiel, T.D. Phillips, R. Powell, and F.E. Stegelin. 1992.
Establishing and Operating a Garden Center: Requirements and Costs. Garden Centers ofAmerica, 1250 I Street,N.W., Suite 500, Washington, D.C.
Barton, S.S., J. Mercer and C.J. Molnar. 1996. "Using Focus Groups to Determine Market Potential for
Wildflower Sod." HortTechnology 6(3):271-276. Barton, S.S., J.J. Haydu, R.A. Hinson, R.E. McNiel, T.D. Phillips, R. Powell and F.E. Stegelin. 1994.
"Requirements and Costs of Establishing and Operating a Garden Center." Nursery and LandscapeProgram 1993 Research Report, Kentucky Agricultural Experiment Station, University ofKentucky, College of Agriculture, Horticulture and Landscape Architecture, SR93-3:35-39.
Bauer, L.L. and J.R. Brooker. 1991. Characteristics of Ornamental Nursery Firms in South Carolina. Res.
Rpt. 91-1, South Carolina Agricultural Experiment Station, Clemson University, Clemson, SC. Behe, B.K., J.L. Adrian, and C.H. Gilliam. 1990. "Structure of Alabama's Nursery Industry." Alabama
Agricultural Experiment Station. Alabama Agribusiness, 28(4):2-4, Auburn, AL. Behe, B., R. Nelson, S. Barton, C. Hall, C.D. Safley, and S. Turner. 1999. "Consumer Preferences for
Geranium Flower color, Leaf Variegation, and Price." HortScience 34(3):740-742. Behe, B., P. Redman, and J. Dole. 1997. "Consumer Preferences for Poinsettia." Proceedings of the
Southern Nurserymen's Association Research Conference, Forty-Second Annual Report. 42:383-385.
Brooker, J.R. 1989. "Tennessee Nursery Marketing Channels," Proceedings of the Tennessee Nursery Short
Course 22. Knoxville, TN. Brooker, J.R. 1991. "Landscape Plants: Production and Marketing Trends," Proceedings of the SNA Res.
Conf. 36:350-353. Brooker, J.R., S.C. Turner, R.A. Hinson. 1995. "Trade Flows and Marketing Practices Within the United
States Nursery Industry: 1993." Southern Cooperative Series. Brooker, J.R. 1996. "Industry Growth and Limiting Factors: A Comparison Among States." Paper
presented as part of Free Session at AAEA Annual Conference entitled Quality Issues in the U.S.green Industry, San Antonio, Texas, July,
Brooker, J.R. 1996. "Nation-Wide Growth in the Nursery Industry: Are Southern States Gaining or Losing
Market Share." Proceedings of Research Conference, 40th Annual Report, Southern Nurserymen'sAssociation Research, Atlanta, GA, pp. 314-319.
Brooker, J.R. and H.D. Bryan. 1989. "Distribution of Tennessee Woody Ornamentals by Outlet and
Destination,” Proceedings of the SNA Res. Conf. 34: 161-166.
Brooker, J.R., and S.C. Turner. 1990. Trade Flows and Marketing Practices Within the United StatesNursery Industry. Southern Cooperative Series, Bulletin No. 358. Tenn. Agri. Exp. Sta.,Knoxville.
Monroe County Greenhouse IndustryMarket Research Study
26 10/17/01
Brumfield, R.G., A.J. Coutu, P.V. Nelson, D.H. Willits, R.S. Sowell, and R.G. Anderson, 1984. “DeterminingMarketing Efficiency of Floricultural Production Firms by Market Channel, Market Period, andSize of Firm.” Journal of American Society for Horticultural Science, Vol. 109(4):578-583.
Brumfield, R.G., P.V. Nelson, A.J. Coutu, R.G. Nelson, D.H. Willits, and R.S. Sowell, 1982. “Improve yourMarketing Efficiency by Analyzing Cost Differences.” Florists’ Review, Vol. 171 (4421).
Brumfield, R.G., E. K. Mafoua, R. Govindasamy, P.F. McSweeney, and J. Italia. 2001. “Profitability of
Australian Nursery Firms: A Two-Stage Least-Squares Analysis.” Manuscript.
Brumfield, R.G. and P.F. McSweeney. 1996. “Business Profiles for Australian Nurseries.” Burnley College,Faculty of Agriculture, Forestry and Horticulture, University of Melbourne.
Brumfield, R.G. and P.F. McSweeney. 1998. “Business Profiles for Australian Nurseries.” HortTechnology,Production and Marketing Reports, Vol. 8(2): pp.225-229.
Brumfield, R.G. and P.F. McSweeney. 1999. “Growing Down Under.” Greenhouse Product News. Brumfield, R.G., L.E. Sim, P. Ford, C. Frumento, and D.J. Wolnick. 1993. Pennsylvania greenhouse
survey. PA State College of Agr. Sci. Coop. Ext. Cir. 405. 60 pages.
Bryan, H.D., Jr. and J.R. Brooker. 1989. Tennessee's Ornamental Nursery Industry and Trade Flows andMarketing Practices. Dept of Ag. Econ. and Rural Soc., RR # 89-01, University of Tennessee,Knoxville, TN.
Cisar, J. L. and J. J. Haydu. 1991. "Adjustments in Market Channels and Labor Practices in the Florida Sod
Industry." J. of Agribusiness,24(2)33-40. Coutu, A.J. and V.A. Vitelli. 1979. "Transfer Costs as They Influence Regional Competition," Economics
of Producing and Marketing Woody Landscape Plants. TVA/NFDC Bulletin Y-149, MuscleShoals, AL.
Crafton, V.W., T.D. Phillips, and T.M. Blessington. 1982. Costs of Producing Woody Ornamental Plants.
Agricultural Economics Research Report 137, Mississippi Agricultural Experiment Station,Mississippi State, MS.
Crafton, V.W.and T.D. Phillips. 1984. Programming Container-Grown Woody Ornamental Crops.
Agricultural Economics Research Report 155, Mississippi Agricultural Experiment Station,Mississippi State, MS.
Deller, S.C. and T.R. Harris. 1993. "Estimation of Minimum Market Thresholds for Rural Commercial
Sectors Using Stochastic Frontier Estimations." Regional Science Perspectives. 23(1):3-17. Dickerson, H.L., M.B. Badenhop, and J.W. Day. 1983. Cost of Producing and Marketing Rooted Cuttings
of Three Woody Ornamental Species in Tennessee. University of Tennessee AgriculturalExperiment Station, Bulletin Number 624, University of Tennessee, Knoxville, TN.
Ding, J.Y., J.A. Casweell, and F. Zhou. 1997. “Relatedness an Performance: A Reexamination of the
Diversification-Performance Link.” Journal of Food Distribution Research, pp.66-73.
Doerer, D.A., R.D. Wright and L.F. Wick. 1982. "Transportation and Distribution of Woody Ornamentalsin Virginia," HortScience. 17:617-618.
Einert, A.E. 1979. "Pfitzer Juniper Production System Alternatives," Economics of Producing and
Marketing Woody Landscape Plants, Bulletin Y-149, TVA, NFDC, Muscle Shoals, Alabama.

Monroe County Greenhouse IndustryMarket Research Study
27 10/17/01
Foshee, K.H., T.D. Phillips, A.J. Laiche, Jr., and S.E. Newman. 1990. Cost of Production Estimates forContainer Grown Landscape Plants, Climatic Zones 7 and 8, 1990, Agricultural EconomicsResearch Report Series, 189, Mississippi Agri. and Forestry Exp. Sta., Mississippi State, MS.
Free, W.F. and A. Vitelli, 1979. "Using Budgets for Decision Making," Economics of Producing and
Marketing Woody Landscape Plants, Bulletin Y-149, TVA/ NFDC Muscle Shoals, Alabama.
Free, W.J. and V.A. Vitelli. 1980. "The Competitive Position of Alabama's Woody Ornamental Market,"Journal of the Alabama Academy of Science 51(3). Birmingham, AL.
Gamble, J.C. 1979. "Budgets and Financing," Economics of Producing and Marketing Woody Landscape
Plants, Bull. Y-149, TVA/NFDC, Muscle Shoals, AL. Gineo, W. 1990. “A Conjoint/Logit Analysis of Nursery Stock Purchases.” Northeastern J. Agricultural and
Res. Econ. 19(1):49-58.
Gineo, W. M. and S. W. Omano. 1990. "An Analysis of Household Expenditures on Nursery products inthe United States,” Southern Journal of Agricultural Economics 22(2):199-208.
Gunter, D.L. 1979. "Use of Computers in the Nursery," Economics of Producing and Marketing Woody
Landscape Plants. TVA/NFDC Bulletin Y-149. Muscle Shoals, AL. Hall, C.R., T.D. Phillips, A.J. Laiche, and S.E. Newman. 1987. Update of Production Systems and Cost of
Production Estimates for Container-Grown Landscape Plants, Climatic Zones 8 and 9. Ag.Econ. Res. Report 176, MAFES, Mississippi State, MS.
Hall, C.R., L.G. Kizer, J.V. Krans, T.D. Phillips, and G.E. Coats. 1988. An Economic and Agronomic
Analysis of Mississippi Turfgrass Sod Farms, Agricultural Economics Research Report 183,Mississippi State University, Mississippi State, MS.
Hall, C.R. and T.D. Phillips. 1989. "A Model for Determining Nursery Product Mix and Cash Flows,"
Proceedings of the SNA Research Conference 34. Marietta, GA. Hall, C.R. and T.D. Phillips. 1990. "A Model to Determine Product Mix," American Nurseryman 172(1). Hall, C.R. and T.D. Phillips. 1990. "Programming Product Mix Monthly Cash Flows for Nursery Crops in
the Southeast." J. of Econ. and Finance, 14(1), Spring. Hall, C.R. 1991. "Image Assessment for Retail Nurseries and Garden Centers," Proceedings of the SNA
Research Conference 36. Marietta, GA.
Harris, T.R., K. Chakraborty, L. Xiao, and R. Narayanan. 1996. "Application of Count Data Procedures toEstimate Thresholds for Rural Commercial Sectors." The Review of Regional Studies 26(1):75-88,
Harris, T. R., L. J. Rader and W. S. Johnson. 1992. “Economic Linkages of the U.S. Greenhouse and Nursery
Products Industry” Journal of Environmental Horticulture 10(1):4-7.
Haydu, J. J. and A.W. Hodges. 1996. "Improving Labor Efficiency in Florida's Nursery Industry."Extension Notes, EN-35, Food & Resource Economics Department, Cooperative ExtensionService, Institute of Food & Agricultural Sciences, University of Florida.
Haydu, J.J., A.W. Hodges, and P. van Blokland. 1996."The Sod Production Sector's Contribution toFlorida's Economy." Turfgrass Research in Florida, Food & Resource Economics Department,IFAS, University of Florida, 6 pp.
Monroe County Greenhouse IndustryMarket Research Study
28 10/17/01
Haydu, J. J., A.W. Hodges, P. van Blokland, and J. Cisar. 1996."The Turfgrass Industry's Contribution toFlorida's Economy." Turfgrass Research in Florida, Food & Resource Economics Department,IFAS, University of Florida, 14 pp.
Hinson, R. A. 1983. "The Nursery Industry in Louisiana," Louisiana Rural Economist 45 (4). Baton Rouge,
LA. Hinson, R., S. Cyrus and C. Ackroyd. 1994. "A Case Example of Employee Empowerment." Proceedings
of SNA Research Conference, Vol. 39. Hinson, R. and D. Hughes. 1996."Estimating the Value of Ornamental Plants and Turfgrass Industries in
Louisiana." Proceedings of Southern Nurserymen's Association Research Conference, Vol. 41.
Hinson, R. and S. Turner. 1994. "Choice of Nursery-Appropriate Marketing Channels in the LandscapePlant Industry." Journal of Environmental Horticulture, 12(2):76-79.
Hinson, R.A., S.C. Turner. and J.R. Brooker. 1995. Transaction Methods Among Wholesale U.S.
Nurseries. Agribusiness: An International Journal 11(2):147-154. Hinson, R. 1996. "Destination Markets for Louisiana Woody Ornamental Plants." Louisiana Agriculture,
LAES, Louisiana State University Agricultural Center, Louisiana State University, Baton Rouge,Vol. 39, No. 3, p.26-27.
Hinson, R. And D. Hughes. 1997. "Nursery and Turf Crop Industry: Adding Value to Louisiana's
Economy." Louisiana Agriculture, LAES, Louisiana State University Agricultural Center, La.State Univ., Baton Rouge, Vol. 40, No. 2, p. 29-31.
Hodges, A. and J.J. Haydu. 1990. An Economic Overview of Florida's Woody Ornamental Industry.
Economic Report 120. Food & Resource Economics Department, IFAS, University of Florida,Gainesville, FL.
Hodges, A. W. and J. J. Haydu. 2000. “Economic Impact of Florida’s Environmental Horticulture Industry”
Acta Hort. Proceedings XIV the International Symposium on Horticultural Economics, Acta Hort.536:251-258.
Hudson, J., B.K. Behe, H.G. Ponder, W.E. Barrick. 1997. Consumer Perceptions and Expectations ofGarden Center Product and Service Quality. Journal of Environmental Horticulture 15:12-15.
Hymum, K. and T.D. Phillips. 1979. "Retail Nursery and Garden Center Operations in Mississippi,"
Agricultural Economics Marketing Research No. 81. Mississippi State, MS. Johnson, D., 1988. "Ornamental Horticulture is Blooming,” Agricultural Outlook, USDA: Washington,
D.C. p. 12-15. Johnson, D.C. 1990. Floriculture and Environmental Products: A Production and Marketing Statistical
Review, 1960-88, Statistical Bulletin 817, USDA/ERS: Washington, D.C. Johnson, D.C. and R.L. Christensen, 1995. The Green Industry Today - Some Issues and Future Prospects.
J. of Agribusiness, 13(1):63-76. Johnson, D., 1992. "Floriculture - A Growth Industry," Agricultural Outlook, USDA: Washington, D.C., p.
25-27. Johnson, D., 1991. "U.S. & World Floriculture Continues Up.” Agricultural Outlook, USDA: Washington,
D.C., p. 32-37.
Monroe County Greenhouse IndustryMarket Research Study
29 10/17/01
Johnson, D.C. FLO-97, "Floriculture and Environmental Horticulture Situation and Outlook Report.”U.S.D.A., Economic Research Service. October 1997.
Johnson, C. D. and T. M. Johnson. 1993. “Financial Performance of U.S. Floriculture and Environmental
Horticulture Farm Businesses, 1987-91.” USDA, ERS, Statistical Bulletin Number 862.
Kirschling, P.J. and F.E. Jensen, 1974, “Profitability of Pot Chrysanthemum Production under GlassGreenhouses.” NJAE/Cook College/Rutgers University, New Brunswick, Bulletin 835.
Kizer, L., T.D. Phillips, J. Kras, and S. Suwanabatr. 1987. Financial Analysis of North Mississippi
Turfgrass Sod Farms. Ag. Econ. Res. Report 174, MAFES, Mississippi State. MS. Leones J. P. and V. Ralph. 1995. “Economic Contribution of Arizona’s Green Industry.” Manuscript
Submitted to: Arizona Landscape Contractors Association.
Markham, J. W.1973. “Conglomerate Enterprise and Economic Performance.” Harvard University Press,Cambridge, MA.
Massey, P.H., Jr. 1979. "Economics of Producing and Marketing Woody Ornamentals in the South,"Economics of Producing and Marketing Woody Landscape Plants, Bulletin Y-149, TVA/NFDC,Muscle Shoals, Alabama.
McNiel, R.G. 1979. "In Oak Production System Alternatives," Economics of Producing and Marketing
Woody Landscape Plants, Bulletin Y-149, TVA, NFDC, Muscle Shoals, Alabama. Montgomery, C.A. 1985. “Product-Market Diversification and Market Power.” Academy of Management
Journal, 28, pp.181-191.
Mysore, S. and W. Uva. 2000 “International Competition in the Greenhouse Production of FloricultureProducts- Lessons for New York and India.” Staff Paper 2000-04, Department of Agricultural,Resource and Managerial Economics, Cornell University, Ithaca, New York 14853-7801 USA.
New York State Department of Agriculture and Markets. 1999. "New York Agricultural Statistics.”Albany, New York.
Perry, F.B. and M.B. Badenhop. 1982. Production and Marketing of Woody Ornamentals in Alabama.Alabama Agricultural Experiment Station, Bulletin No. 546, Auburn University, Auburn, AL.
Perry, F.B., M.S. Badenhop, and T.D. Phillips. 1987. Costs of Establishing and Operating A Small and
Large Container Nursery in U.S.D.A. Climatic Zones 7 and 8. Southern Cooperative Series,Bulletin No. 327.
Perry F.B., T.D. Phillips, L.W. Wilson, and J.L. Adrian. 1990. Establishment and Operation of 20- and 40-
Acre Container Nurseries in Climatic Zone 9. Southern Cooperative Series, Bulletin No. 341. Phillips, T.D. 1979. "Development of Cost of Production Budgets for Landscape Plants in the South,"
Economics of Producing and Marketing Woody Landscape Plants, Bulletin Y-149, TVA, NFDC,Muscle Shoals, Alabama.
Phillips, T.D. and V.A. Ward, 1980. "Programming for Optimum Crop Combinations for a Small Nursery,"
Proceedings of SNA Res. Conf. 25:165-167. Phillips, T.D. and M.B. Badenhop. 1983. "South's Competitive Advantage in Producing Junipers," Proc. of
the SNA Res. Conf., 28 Annual Report.

Monroe County Greenhouse IndustryMarket Research Study
30 10/17/01
Phillips, T.D. 1984. "Regional Advantages in Producing Container-Grown Nursery Stocks," Agri. Econ.Staff Paper No. 66, MAFDS, Mississippi State, MS.
Phillips, T.D. 1984. "Alternative Methods for Pricing Landscape Maintenance Services," Agri. Economics
Staff Paper No. 68. Mississippi State, MS.
Phillips, T.D. 1988. "Pricing Landscaping and Related Products and Services for Profit," Mississippi StateUniversity Agricultural Economics Staff Paper No. 82. Mississippi State, MS.
Phillips, T. D. 1989. "A Review of Economic Research in Ornamental Horticulture." Presented at the
American Agricultural Economics Association, Annual Meeting, Baton Rouge, LA. Phillips, T. D. and C.R. Hall. 1990. "Programming Product Mix Monthly Cash Flows for Nursery Crops in
the Southeast," J. of Econ. and Finance. Vol. 14. Phillips, T. D., Johnson, H. Kneen, and J. Brooker. 1990. "Market and Economic Research in Ornamental
Horticulture," University of Georgia Division of Agricultural Economics Faculty Series 90-06.Athens, GA.
Phillips, T.D. 1991. "Pricing for Profit: An Introduction," Landscape Management 30(2). Phillips, T.D. 1991. "Pricing for Profit II," Landscape Management 30(3). Palepu, K. 1985. “Diversification Strategy, Profit Performance, and Entropy Measure.” Strategic
Management Journal, 6, pp.239-255.
Prange, R. and D. Dean, 2001, Statistics Canada, Publication 22-202XIB, Directory of CanadianHorticultural Research Organizations and Professionalshttp://res2.agr.gc.ca/kentville/pubs/resdirectory/index.htm, June 8,2001.
Redman, P.B., B.K. Behe, J.M. Dole. 1997. Consumers Prefer Red Poinsettia Cultivars. HortTechnology7:438-441.
Rhodus, T. and R. Taylor. 1990. "Nursery Stock Dealer Survey. The Buckeye Nurseryman, May. Rhodus, T. and J. Hoskins. "1995. Perennial Sales Survey." Perennial Plants, Quarterly Journal of the
Perennial Plant Association, Volume 3, No. 2, Spring. Rumelt, R.P. 1974. “Strategy, Structure and Economic Performance.” Harvard University Press,
Cambridge, MA.
Sabota, C. 1987. “Linear Programming Models for Wholesale Nursery Product Mix Planning.” J. of Amer. Soc.of Hort. Sci. 112(3):506-510.
Safley, C. D. and M. K. Wohlgenant, Factors that Influence Consumer Selection of Garden Centers, J. ofAgribusiness, 13(1):33-50.
Shonkwiler, J. Scott and Thomas R. Harris. 1996. "Rural Retail Business Thresholds and
Interdependencies." Journal of Regional Science 36(4):617-630, Smith, C.N. 1979. "Krume Azalea Cost of Production Budget," Economics of Producing and Marketing
Woody Landscape Plants, Bulletin Y-149,TVA,NFDC, Muscle Shoals, Alabama. Smith, C.N. and D.B. McConnell. 1979. "Effects of Changes in Prices of Selected Production Inputs on
Azalea Costs Per Container," Proceedings of the Florida State Horticultural Society 91:217-220.Winter Haven, FL.
Monroe County Greenhouse IndustryMarket Research Study
31 10/17/01
Smith, C.N. 1980. "Kurume Azaleas, Cost of Production Budget.” Nurserymen's Digest 14:12 :60-66. Smith, C.N. and D. B. McConnell. 1981. "Effects of Shifts in Prices of Land, Labor, and Capital on the
Cost of Producing Pfitzer Juniper," Proceedings, Florida State Horticultural Society, 94:91-93. Sowell R.S., D.H. Willits, R.G. Brumfield, and A.J. Coutu, 1982. “Optimizing Greenhouse Production
Management Decisions using Linear Programming.” Presentation at the 1982 Summer Meeting,American Society of Agricultural Engineers, University of Wisconsin-Madison, June 27-30.
Stegelin, F.E. and A.J. Powell. 1991. "Scope of the Kentucky Turf Industry." AgriBusiness News for
Kentucky 72, April-May. Strain, J. R. and A. W. Hodges. 1987. “Business Analysis of Container Nurseries in Florida, 1986” Economic
Information Report 238, Food and Resource Economics Department, Agricultural ExperimentStations, Cooperative Extension Service, Institute of Food and Agricultural Sciences, University ofFlorida, Gainesville 32611.
Tavernier, E.M. and R. G. Brumfield. 2000. “The Importance of Nurseries, Greenhouses and Sod.” TheNew Jersey Farmer, September Issue, p.9. Ag Economist.
Tavernier, E. M., F. Li and D. W. Thatch. 1995. “Proving the Economic Importance of the Greenhouse,Nursery and Sod Industry” Journal of Environmental Horticulture 13(2):86-88.
Taylor, R.D., E.M. Smith, and T. Rhodus. 1989. "Selected Characteristics and Practices of Ohio Nurseries,"The Buckeye Nurseryman, Issue 09/89:7, Columbus, OH.
Taylor, R.D., E.M. Smith, D.J. Beattie, and G.P. Pealer. 1990. Requirements and Costs of Establishing and
Operating a Three-Acre Herbaceous Perennial Container Nursery. Southern Cooperative Series,Bulletin 354.
Taylor, R.D., H.H. Kneen, D.E. Hahn, and E.M. Smith. 1983. Costs of Establishing and Operating
Container Nurseries Differentiated by Size of Firm and Species of Plant in U.S.D.A. ClimaticZone 6. Southern Cooperative Series, Bulletin No. 301.
Traver, T. 1998. The Greenhouse Industry – Northeast Business Trends. Special Report. First Pioneer
Farm Credit, ACA. Flemington, New Jersey.
Trieb, S.E. 1979. "Personnel Management in the Wholesale Nursery Industry,” Economics of Producing
and Marketing Woody Landscape Plants. TVA/NFDC Bulletin Y-149. Muscle Shoals, AL. Turner, S.C. 1989. "Landscape Expenditures Analysis for Georgia Consumers." American Nurseryman,
July 1, 1989:202. Turner, S.C. 1990. "Computer Use in the Georgia Nursery Industry." Proceedings of the SNA Res. Conf.,
35:203-207.
Turner, S.C. 1991. "The Importance of Advertising Media and Store Characteristics in Landscape PlantPurchase and Retail Outlet Selection Decisions." Proceedings of the SNA Res. Conf. 36:336-338.
Turner, S.C. 1994. "Georgia Household Purchase Patterns of Landscape Plants." Georgia Green Industry
Association Newsletter. 5(2)27-30.
Monroe County Greenhouse IndustryMarket Research Study
32 10/17/01
Turner, S. C. 1997. "The Stability of Target Markets for Retail Outlets of Landscape Plants." Proceedingsof the Southern Nurserymen's Association Research Conference, Forty-Second AnnualReport.42:400-402.
Turner, S.C., and J.H. Dorfman. 1990. "Retail Target Markets for Landscape Plants." Journal ofEnvironmental Horticulture, 8(3):115-117.
Turner, S.C. and J.H. Dorfman. 1991. "Identifying Retail Target Markets," American Nurseryman 173(3):
85-86.
Turner, S.C., J.H. Dorfman, and S.M. Fletcher. 1990. "Target Markets for Retail Outlets of LandscapePlants." So. J. of Agri. Econ., (22)1:177-183.
Turner, S.C. and S.M. Fletcher. 1989. "An Economic Analysis of Retail Outlet Selection for Consumer
Purchases of Environmental Plants," Proceedings of the SNA Res. Conf. 34:172-175. Turner, S.C. and W. Kriesel. 1994. "The Green Industry's Interlinkages with Georgia's Economy."
Proceedings of SNA Research Conference, Vol. 39.
Turner, S. and Kriesel, W. 1995. The Relative Importance of the Green Industry in the U.S. AgriculturalEconomy. J. of Agribusiness, 13(1):51-62.
Turner, S.C. and F.E. Stegelin. 1989. "Market and Economic Research in Ornamental Horticulture, the
"New" and Fastest_Growing Agricultural Industry in the United States," Amer. Jour. of Agri.Econ. 71(5):1329(abstract).
Turner, S.C., F. Stegelin, and R.E. Cleland. 1996. "Influential Factors on Out-of-State Product Sales by
U.S. Wholesale Nurseries." Proceedings of Research Conference, 40th Annual Report, SouthernNurserymen's Association Research, Atlanta, GA. pp. 330-333.
USDA. 1999. 1997 Census of Agriculture. United States Department of Agriculture, Washington, DC.
USDA. 1999. Floriculture and Environmental Horticulture – Situation and Outlook Yearbook. EconomicResearch Service, United States Department of Agriculture, Washington D.C. October 1999.
Uva, W.L. 1997. 1997 greenhouse survey for Monroe County. Unpublished draft not for publication fromthe 1997 New York State Greenhouse Industry Survey conducted by the Cornell Greenhouse andControlled Environment Agricultural Program, partially funded by the New York State FlowerIndustries.
Uva, W.L. 1999. An Analysis of the Economic Dimensions of the New York State Greenhouse Industry.RB 99-08, Department of Agricultural, Resource, and Managerial Economics, Cornell University.
Uva, W. 2000 “An Analysis of the Economic Dimensions of the Greenhouse Industry in New York, United
States.” Proceedings XIV the International Symposium on Horticultural Economics, Acta Hort.536:397-403.
van Blokland, P.J., J.J. Haydu and A.W. Hodges. "Measuring the Economic Contribution of Florida's
Turfgrass Industry Using a Value Added Methodology." Journal of International TurfgrassResearch. 8(1):1127-1133.
Vitelli, V.A. and W.J. Free. 1980. "Competitive Position of Southern Nurserymen in the Woody
Ornamental Market," Proc. of the SNA Res. Conf. 25:189-198. White, R. W., J. L. Adrian, and R. Dickens. 1991. Alabama's Turfgrass-Sod Industry, Bull. 610, Alabama
Agricultural Experiment Station, Auburn University, Auburn, AL.

Monroe County Greenhouse IndustryMarket Research Study
33 10/17/01
Williams, F.W. and G.F. Musillo. 1984. "Wholesale and Retail Distribution Patterns of Georgia Woody
Ornamental Nursery Stock," Georgia Agricultural Experiment Station Research Report No. 461.Athens, GA.
Willis, C. and M. Willis. 1990. “Multiple Objective and Nearly Optimal Solutions in Greenhouse
Management.” Selected Paper, Annual American Agricultural Economics Association Meetings,Vancouver, British Columbia.
Wright, R.D. 1979. "Pin Oak Cost of Production Budget," Economics of Producing and Marketing Woody
Landscape Plants, Bulletin Y-149, TVA, NFDC, Muscle Shoals, Alabama.

TABLES
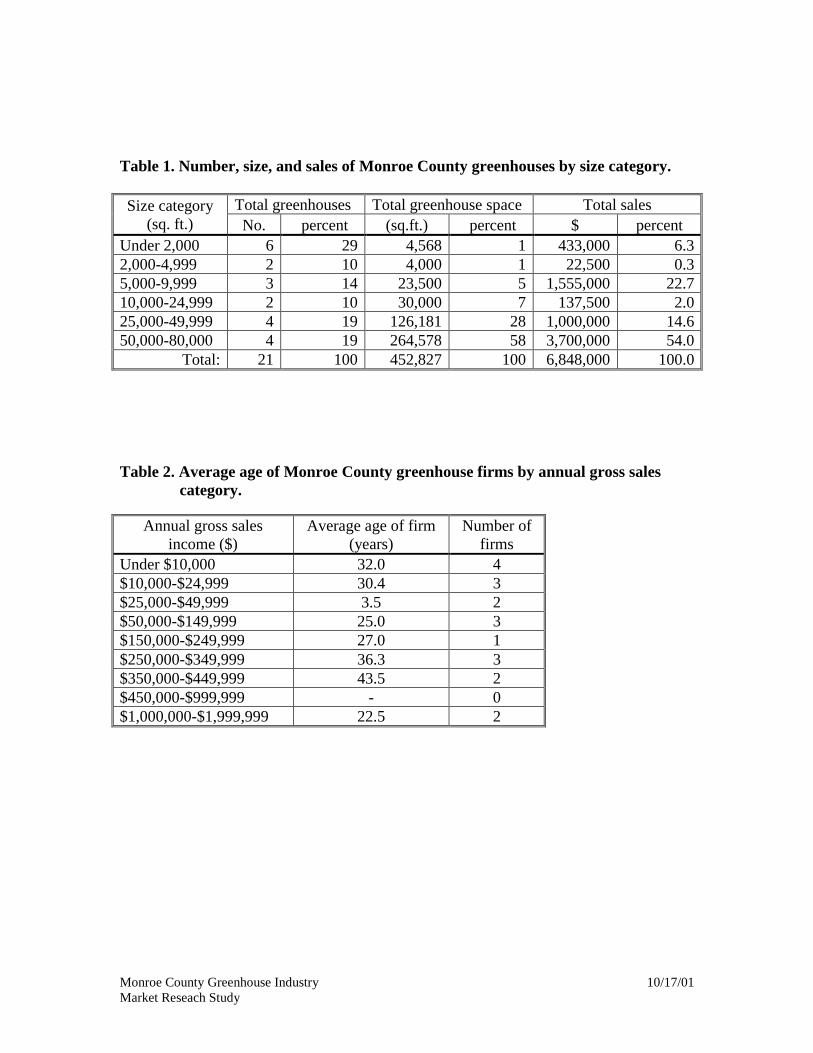
Monroe County Greenhouse Industry 10/17/01Market Reseach Study
Table 1. Number, size, and sales of Monroe County greenhouses by size category.
Total greenhouses Total greenhouse space Total salesSize category(sq. ft.) No. percent (sq.ft.) percent $ percent
Under 2,000 6 29 4,568 1 433,000 6.32,000-4,999 2 10 4,000 1 22,500 0.35,000-9,999 3 14 23,500 5 1,555,000 22.710,000-24,999 2 10 30,000 7 137,500 2.025,000-49,999 4 19 126,181 28 1,000,000 14.650,000-80,000 4 19 264,578 58 3,700,000 54.0
Total: 21 100 452,827 100 6,848,000 100.0
Table 2. Average age of Monroe County greenhouse firms by annual gross salescategory.
Annual gross salesincome ($)
Average age of firm(years)
Number offirms
Under $10,000 32.0 4$10,000-$24,999 30.4 3$25,000-$49,999 3.5 2$50,000-$149,999 25.0 3$150,000-$249,999 27.0 1$250,000-$349,999 36.3 3$350,000-$449,999 43.5 2$450,000-$999,999 - 0$1,000,000-$1,999,999 22.5 2
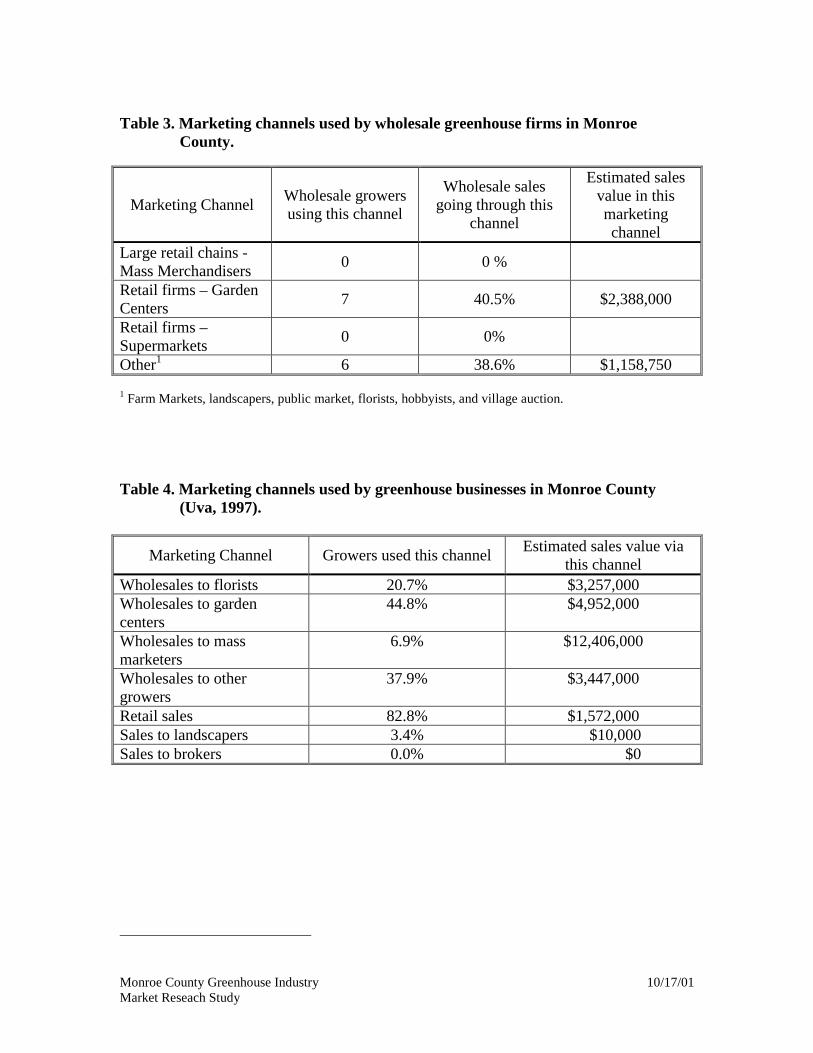
Monroe County Greenhouse Industry 10/17/01Market Reseach Study
Table 3. Marketing channels used by wholesale greenhouse firms in MonroeCounty.
Marketing Channel Wholesale growersusing this channel
Wholesale salesgoing through this
channel
Estimated salesvalue in thismarketingchannel
Large retail chains -Mass Merchandisers 0 0 %
Retail firms – GardenCenters 7 40.5% $2,388,000
Retail firms –Supermarkets 0 0%
Other1 6 38.6% $1,158,750
1 Farm Markets, landscapers, public market, florists, hobbyists, and village auction.
Table 4. Marketing channels used by greenhouse businesses in Monroe County(Uva, 1997).
Marketing Channel Growers used this channel Estimated sales value viathis channel
Wholesales to florists 20.7% $3,257,000Wholesales to gardencenters
44.8% $4,952,000
Wholesales to massmarketers
6.9% $12,406,000
Wholesales to othergrowers
37.9% $3,447,000
Retail sales 82.8% $1,572,000Sales to landscapers 3.4% $10,000Sales to brokers 0.0% $0

Monroe County Greenhouse Industry 10/17/01Market Reseach Study
Table 5. Percent of retail growers in Monroe County rating the importance of eachtype of competitor for their greenhouse firms.
Competitor StronglyAgree Agree Disagree Strongly
DisagreeNo
ResponseLarge retail chains - Mass Merchandisers 42% 32% 0% 5% 21%Retail Firms - Garden Centers 21% 47% 5% 5% 21%Retail Firms – Supermarkets 5% 47% 11% 5% 32%Other 16% 16% 0% 0% 68%
Table 6. Percent of wholesale growers in Monroe County rating the importance ofeach type of competitor for their greenhouse firms.
Competitor StronglyAgree Agree Disagree Strongly
DisagreeNo
ResponseGrowers in New York 17% 17% 6% 0% 61%Growers in other states 6% 17% 6% 0% 72%Growers in Canada 39% 6% 0% 6% 50%Other 6% 0% 0% 0% 94%
Table 7. The number of growers in Monroe County and approximate percentage oftotal sales for each crop.
Crop Respondentsproducing this crop
Approximatepercentage of total
salesBedding plants 16 33.4%Hanging baskets 15 8.1%Geraniums 14 8.0%Perennials 12 11.6%Other potted plants 9 17.0%Pot mums 8 2.0%Other crops 5 8.6%Herbs 5 3.0%Poinsettias 5 1.6%Outdoor cut flowers 1 0.2%

Monroe County Greenhouse Industry 10/17/01Market Reseach Study
Table 8. Number and percentage of growers specialized in categories of beddingplant production and pre-finished plants.
Category Number PercentProduce your own plugs 13 61.9%Buy plugs 17 81.0%Both produce and buy plugs 10 47.6%Sell plugs 1 4.8%Buy pre-finished plants 10 47.6%
Table 9. Average number of full-time, part-time, and seasonal employees pergreenhouse per month and total full-time, part-time, and seasonal, andtotal employees for Monroe County per month.
Average per greenhouse Total in Monroe CountyMonth Full-
timePart-time Seasonal Total Full-
timePart-time Seasonal Total
January 1.2 0.5 0.2 1.9 25 11 4 40February 1.2 0.9 0 2.1 26 18 0 44March 1.7 1.9 0.5 4.1 35 40 11 86April 1.7 2.1 0.8 4.6 35 45 16 96May 1.8 2.5 1.1 5.4 38 53 23 114June 1.7 2.0 1.0 4.7 36 43 20 99July 1.6 1.1 0.4 3.1 34 24 9 67August 1.6 1.1 0.4 3.1 34 23 9 66September 1.6 1.1 0.4 3.1 34 24 9 67October 1.6 1.0 0.7 3.3 34 20 14 68November 1.4 0.6 0 2.0 30 13 0 43December 1.2 0.6 0.2 2.0 26 13 4 43
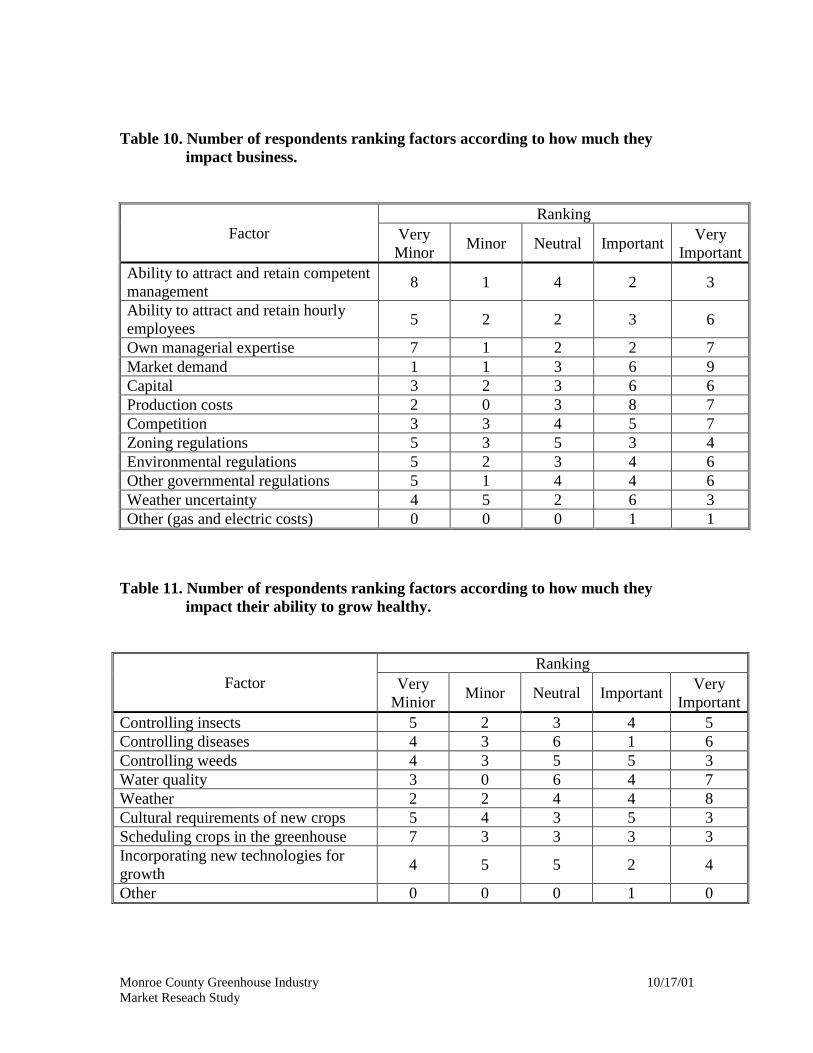
Monroe County Greenhouse Industry 10/17/01Market Reseach Study
Table 10. Number of respondents ranking factors according to how much theyimpact business.
RankingFactor Very
Minor Minor Neutral Important VeryImportant
Ability to attract and retain competentmanagement 8 1 4 2 3
Ability to attract and retain hourlyemployees 5 2 2 3 6
Own managerial expertise 7 1 2 2 7Market demand 1 1 3 6 9Capital 3 2 3 6 6Production costs 2 0 3 8 7Competition 3 3 4 5 7Zoning regulations 5 3 5 3 4Environmental regulations 5 2 3 4 6Other governmental regulations 5 1 4 4 6Weather uncertainty 4 5 2 6 3Other (gas and electric costs) 0 0 0 1 1
Table 11. Number of respondents ranking factors according to how much theyimpact their ability to grow healthy.
RankingFactor Very
Minior Minor Neutral Important VeryImportant
Controlling insects 5 2 3 4 5Controlling diseases 4 3 6 1 6Controlling weeds 4 3 5 5 3Water quality 3 0 6 4 7Weather 2 2 4 4 8Cultural requirements of new crops 5 4 3 5 3Scheduling crops in the greenhouse 7 3 3 3 3Incorporating new technologies forgrowth 4 5 5 2 4
Other 0 0 0 1 0

Monroe County Greenhouse Industry 10/17/01Market Reseach Study
Table 12. Number of respondents ranking factors according to level of importancein price determination.
RankingFactor Very
Minor Minor Neutral Important VeryImportant
Cost of production 1 1 0 8 10Inflation 0 2 8 6 3Other grower’s prices 3 0 6 7 3Grade of plants 2 0 4 5 8Market demand 0 0 2 6 11Product uniqueness 1 0 2 6 10Inventory levels 2 0 8 7 2Last year’s price 3 0 7 8 2Other 0 0 0 0 1
Table 13. Number of respondents ranking factors according to level of importancein limiting expansion.
RankingFactor Very
Minor Minor Neutral Important VeryImportant
Capital 3 3 3 3 8Marketing 3 1 2 10 3Personnel 3 2 3 3 8Production 2 2 6 5 4Transportation 7 3 5 4 0Plant Selection 5 1 1 6 5

Monroe County Greenhouse Industry 10/17/01Market Reseach Study
Table 14. Number of operations, sales, wholesale sales, and payroll for selectedstates and counties.
Location Number of Percent that Sales per Percent of Payroll as Percent ofOperations are Wholesale Operation sales that are a Percent operations
Operations Wholesale of Sales that Hire LaborMichigan 1216 71.4% $387,928 70.6% 49.4% 86.2% Detroit area 225 67.1% $412,564 57.7% 30.9% 81.8% Ottawa 129 86.0% $656,791 74.5% 37.1% 89.1% Kalamazoo 73 84.9% $648,164 83.2% 31.6% 94.5%Pennsylvania 1387 75.8% $443,557 88.7% 32.0% 78.7%New York 985 63.0% $270,238 72.9% 33.0% 81.7% Suffolk 180 71.1% $697,667 88.5% 37.6% 92.2% Erie 64 78.1% $367,266 77.4% 47.5% 87.5% Orange 59 61.0% $244,508 74.1% 22.9% 81.4% Monroe 47 51.1% $191,255 24.5% 23.8% 80.9%
Table 15. Maximum Likelihood Estimates of Logit Model with Herfindahl Index
Variable Coefficient Std. Error Chi Square Prob> Chi Value squareAge of theGreenhouse Firm(AGE)
0.0700 0.0454 2.3733 0.1234
Total cost ofmaterials andsupplies(MATSALES)
-25.3911 13.4318 3.5735 0.0587∗
Legal Structure ofthe firm; soleproprietorship orotherwise (SOLE)
-2.9326 3.0648 0.9156 0.3386
At least 50% offirm sales fromretail operation(RETAIL)
2.6805 2.5129 1.1379 0.2861
If the greenhousefirm is the majorsource of income orotherwise(INCOME)
-5.5121 3.2239 2.9233 0.0873*
Herfindahl Index(HFINDEX) 8.7423 4.8929 3.1924 0.0740*
∗ Denotes a parameter significantly significant at the 10% level.

FIGURES
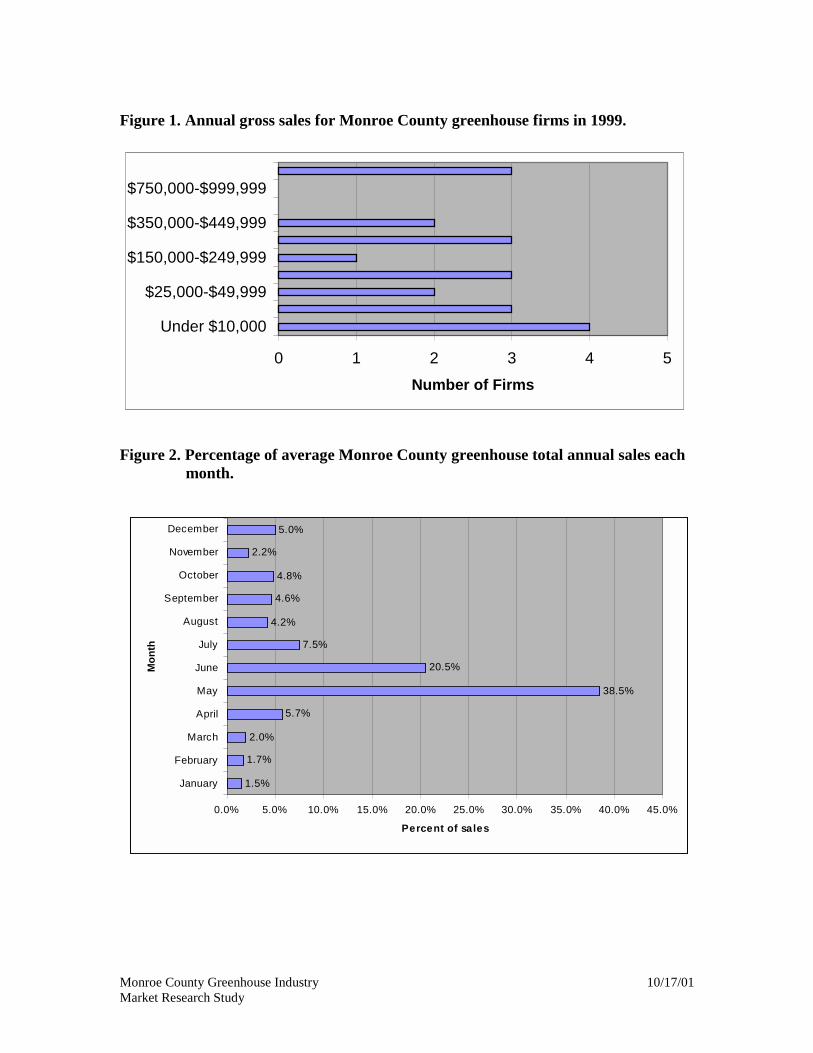
Monroe County Greenhouse Industry 10/17/01Market Research Study
Figure 1. Annual gross sales for Monroe County greenhouse firms in 1999.
0 1 2 3 4 5
Under $10,000
$25,000-$49,999
$150,000-$249,999
$350,000-$449,999
$750,000-$999,999
Number of Firms
Figure 2. Percentage of average Monroe County greenhouse total annual sales eachmonth.
1.5%
1.7%
2.0%
5.7%
38.5%
20.5%
7.5%
4.2%
4.6%
4.8%
2.2%
5.0%
0.0% 5.0% 10.0% 15.0% 20.0% 25.0% 30.0% 35.0% 40.0% 45.0%
January
February
March
April
May
June
July
August
September
October
November
December
Mon
th
Percent of sales
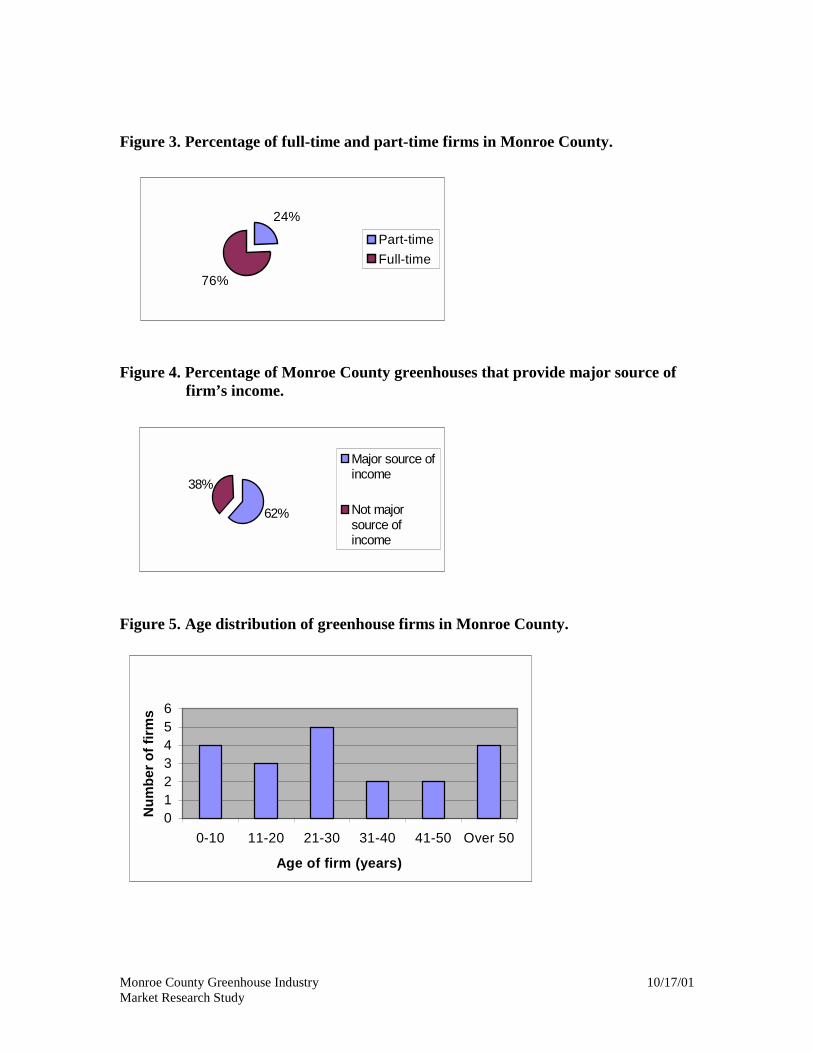
Monroe County Greenhouse Industry 10/17/01Market Research Study
Figure 3. Percentage of full-time and part-time firms in Monroe County.
Figure 4. Percentage of Monroe County greenhouses that provide major source offirm’s income.
Figure 5. Age distribution of greenhouse firms in Monroe County.
24%
76%
Part-timeFull-time
62%
38%
Major source ofincome
Not majorsource ofincome
0123456
0-10 11-20 21-30 31-40 41-50 Over 50
Age of firm (years)
Num
ber o
f firm
s

Monroe County Greenhouse Industry 10/17/01Market Research Study
Figure 6. Legal structure of greenhouse firms in Monroe County.
Figure 7. Distribution of the percent of sales from individual greenhouse firms thatcome from wholesale and retail sales.
7 1 %
1 0 %
1 9 %S o leP r o p r ie to r s h ipP a r tn e r s h ip
C o r p o r a t io n
0
2
4
6
8
10
12
14
16
0% 1-25% 26-50% 51-75% 76-100%
Percentage of sales
Num
ber o
f gre
enho
use
firm
s
RetailWholesale

Monroe County Greenhouse Industry 10/17/01Market Research Study
Figure 8. Average annual materials cost of Monroe County greenhouse firms in1999.
0 1 2 3 4 5
Under $5,000
$10,000-$14,999
$45,000-$74,999
$100,000-$149,999
$225,000-$299,999
Ann
ual m
ater
ials
cos
ts
Number of greenhouses
Figure 9. Average materials cost per square foot by greenhouse size in MonroeCounty.
$0.00 $20.00 $40.00 $60.00 $80.00
Under 2,000
5,000-9,999
25,000-49,999
Gre
enho
use
size
(sq.
ft.)
Cost per square foot
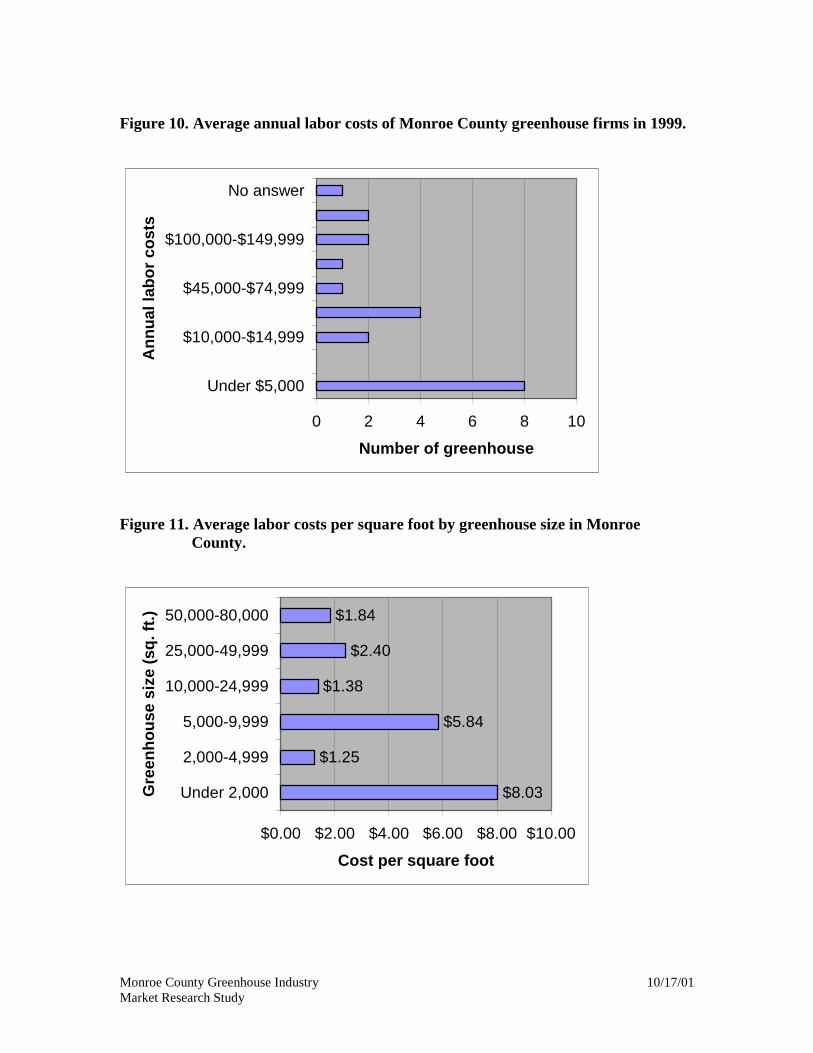
Monroe County Greenhouse Industry 10/17/01Market Research Study
Figure 10. Average annual labor costs of Monroe County greenhouse firms in 1999.
0 2 4 6 8 10
Under $5,000
$10,000-$14,999
$45,000-$74,999
$100,000-$149,999
No answer
Ann
ual l
abor
cos
ts
Number of greenhouse
Figure 11. Average labor costs per square foot by greenhouse size in MonroeCounty.
$8.03
$1.25
$5.84
$1.38
$2.40
$1.84
$0.00 $2.00 $4.00 $6.00 $8.00 $10.00
Under 2,000
2,000-4,999
5,000-9,999
10,000-24,999
25,000-49,999
50,000-80,000
Gre
enho
use
size
(sq.
ft.)
Cost per square foot

Monroe County Greenhouse Industry 10/17/01Market Research Study
Figure 12. Average number of full-time, part-time, and seasonal employees(including family members) employed each month in Monroe Countygreenhouse firms.
Figure 13. Number of Monroe County greenhouse firms indicating a change inemployees since 1995.
0 0.5 1 1.5 2 2.5 3
January
February
March
April
May
June
July
August
September
October
November
December
Mon
th
Number of employees
SeasonalPart-timeFull-time
24%
5%
57%
14% IncreaseDecreaseNo changeNo response

APPENDIX A
Empirical Analysis of Monroe CountyGreenhouse Industry Productivity

Monroe County Greenhouse Industry 1 10/17/01Market Research Study
Empirical Analysis of Greenhouse Industry Productivity
The logit model assumes that the probability of a grower attaining a high spaceproductivity, Pi , depends on a vector of independent variables (Xij�s) associated with thegrower i and variable j, and vector of parameters �s. A dependent variable such as yi = 1if the productivity of the grower is above some predetermined value (in sales per squarefoot), and yi = 0 otherwise. For the logit model, the probability of attaining highproductivity (i.e., yi = 1) is given by:
Pi = F(Zi) = F(α + βXij) + 1 / [1+exp (-Zi)]
Where:
Pi = probability that a grower will have a high productivity or not, given theknowledge of various factors (Xij�s);
F(Zi) = the value of the cumulative logistic function associated with eachpossible value of the underlying index Zi;
Exp = base of natural logarithms; andZi = underlying index number of βXij, is a linear function of the independent
variables.
Thus:
Zi = log [Pi/(1- Pi)] = β0 + β1X11 + β2X12 +�+ βnX1n + ε
Where:
Zi = the unobserved index level or the log odds of the choice for the ithobservation
i = 1, 2,�, I denotes the individual growers;j = 1, 2,�, n represents the independent variables;Xij = the jth explanatory variable for the ith individual;β = the parameters to be estimated; andε = error term or disturbance term.
The dependent variable Zi in the above equation is the logarithm of the probability that aparticular choice will be made. In empirical analysis, the following models were used topredict the probability that a grower would attain high space productivity:
Model 1 with Herfindahl Index as a Measure of Specialization
Prodratei = β0 + β1Agei + β2Matsalesi + β3Solei +β4Hfindexi + β5Retaili + β6Incomei + ε.
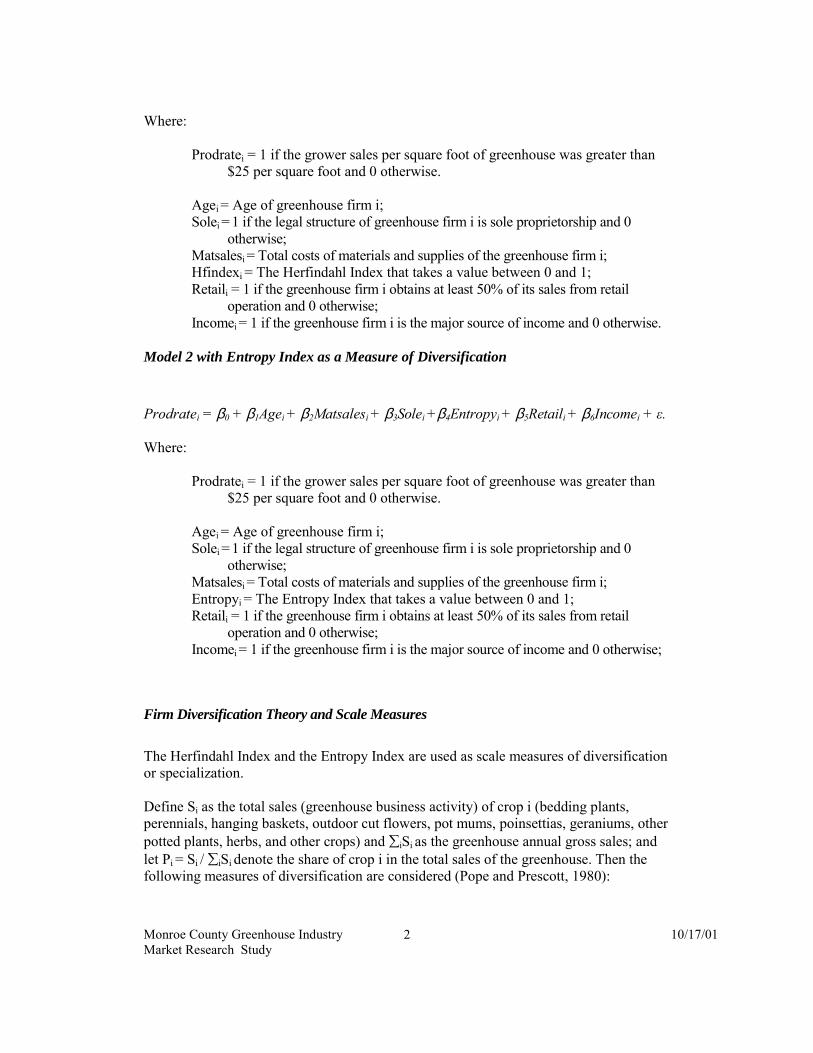
Monroe County Greenhouse Industry 10/17/01Market Research Study
2
Where:
Prodratei = 1 if the grower sales per square foot of greenhouse was greater than$25 per square foot and 0 otherwise.
Agei = Age of greenhouse firm i;Solei = 1 if the legal structure of greenhouse firm i is sole proprietorship and 0
otherwise;Matsalesi = Total costs of materials and supplies of the greenhouse firm i;Hfindexi = The Herfindahl Index that takes a value between 0 and 1;Retaili = 1 if the greenhouse firm i obtains at least 50% of its sales from retail
operation and 0 otherwise;Incomei = 1 if the greenhouse firm i is the major source of income and 0 otherwise.
Model 2 with Entropy Index as a Measure of Diversification
Prodratei = β0 + β1Agei + β2Matsalesi + β3Solei +β4Entropyi + β5Retaili + β6Incomei + ε.
Where:
Prodratei = 1 if the grower sales per square foot of greenhouse was greater than$25 per square foot and 0 otherwise.
Agei = Age of greenhouse firm i;Solei = 1 if the legal structure of greenhouse firm i is sole proprietorship and 0
otherwise;Matsalesi = Total costs of materials and supplies of the greenhouse firm i;Entropyi = The Entropy Index that takes a value between 0 and 1;Retaili = 1 if the greenhouse firm i obtains at least 50% of its sales from retail
operation and 0 otherwise;Incomei = 1 if the greenhouse firm i is the major source of income and 0 otherwise;
Firm Diversification Theory and Scale Measures
The Herfindahl Index and the Entropy Index are used as scale measures of diversificationor specialization.
Define Si as the total sales (greenhouse business activity) of crop i (bedding plants,perennials, hanging baskets, outdoor cut flowers, pot mums, poinsettias, geraniums, otherpotted plants, herbs, and other crops) and �iSi as the greenhouse annual gross sales; andlet Pi = Si / �iSi denote the share of crop i in the total sales of the greenhouse. Then thefollowing measures of diversification are considered (Pope and Prescott, 1980):

Monroe County Greenhouse Industry 10/17/01Market Research Study
3
The Herfindahl Index is:
�i (crop i % of total business activity)2 = �iP2i .
The Herfindahl Index takes a value of 1 when there is complete specialization andapproaches 0, as the number of crops (N) gets large. That is, if diversification is perfect,such that:
Si = 1/N)*S and N → ∞ , the �iP2i = 1/N → 0.
The Entropy Index is:
-�i (crop i % of total business activity)* log (crop i % of total business activity) = - �iPi *logPi.
The value of the Entropy Index for completely specialized firms, those with only oneproduct line is 0. That is, if diversification is perfect, the Entropy Index approaches itsmaximum when Pi = 1/N. The index of maximum crop share in the total sales is: Max(crop i % of total business activity) = max Pi.
The results from the Herfindahl and Entropy Indexes are summarized in the table below:
Empirical Measures of Greenhouse Firm Diversification.
Greenhouse Firm Firm Size Herfindahl Index Entropy Index Max. Crop Share 1 300 1.00 0.00 1.00 2 1500 0.42 0.41 0.50 3 25000 0.25 0.20 0.45 4 10000 0.24 0.65 0.30 5 59000 0.35 0.62 0.55 6 43181 0.52 0.41 0.70 7 80000 0.73 0.22 0.85 8 288 1.00 0.00 1.00 9 2000 1.00 0.00 1.00 10 7500 0.37 0.45 0.50 11 30000 0.34 0.65 0.55 12 60000 0.32 0.61 0.50 13 65578 0.25 0.67 0.40 14 8000 0.24 0.73 0.40 15 2000 0.38 0.45 0.50 16 1500 0.68 0.22 0.80 17 28000 0.51 0.45 0.70 18 20000 0.19 0.73 0.25 19 8000 0.29 0.60 0.45 20 100 0.90 0.08 0.95

APPENDIX B
Monroe County Greenhouse Industry Survey
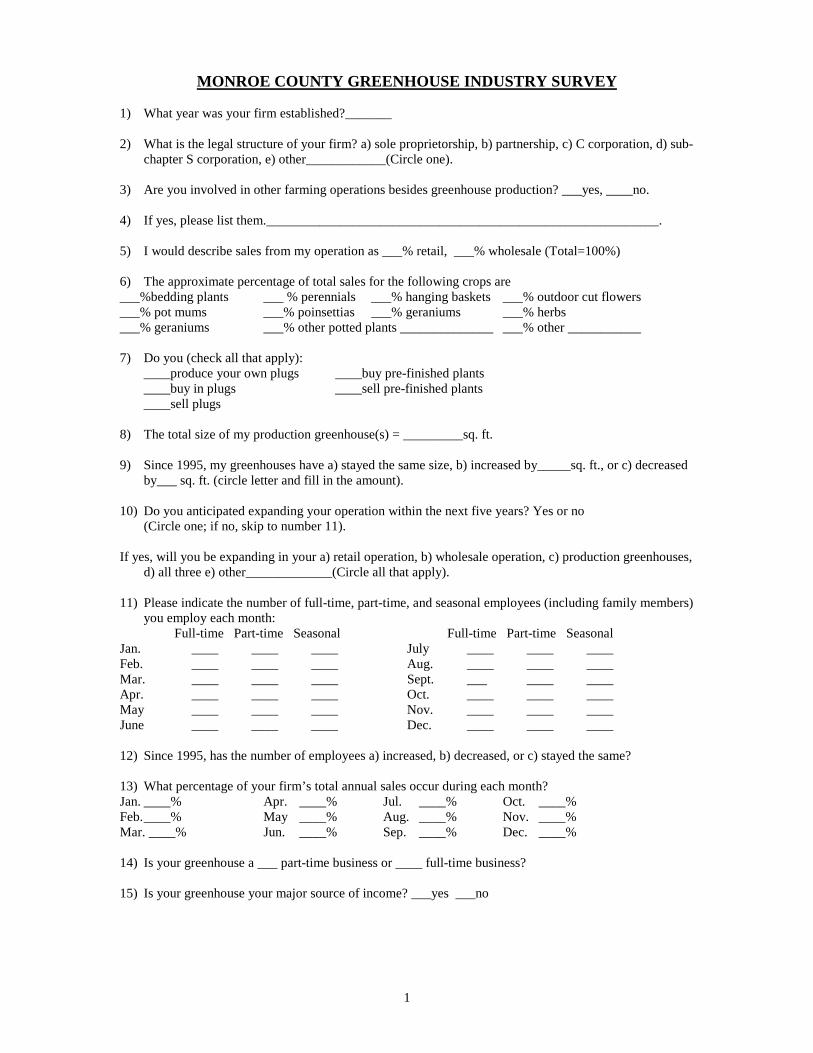
1
MONROE COUNTY GREENHOUSE INDUSTRY SURVEY
1) What year was your firm established?_______
2) What is the legal structure of your firm? a) sole proprietorship, b) partnership, c) C corporation, d) sub-chapter S corporation, e) other____________(Circle one).
3) Are you involved in other farming operations besides greenhouse production? ___yes, ____no.
4) If yes, please list them.___________________________________________________________.
5) I would describe sales from my operation as ___% retail, ___% wholesale (Total=100%)
6) The approximate percentage of total sales for the following crops are___%bedding plants ___ % perennials ___% hanging baskets ___% outdoor cut flowers___% pot mums ___% poinsettias ___% geraniums ___% herbs___% geraniums ___% other potted plants ______________ ___% other ___________
7) Do you (check all that apply):____produce your own plugs ____buy pre-finished plants____buy in plugs ____sell pre-finished plants____sell plugs
8) The total size of my production greenhouse(s) = _________sq. ft.
9) Since 1995, my greenhouses have a) stayed the same size, b) increased by_____sq. ft., or c) decreasedby___ sq. ft. (circle letter and fill in the amount).
10) Do you anticipated expanding your operation within the next five years? Yes or no(Circle one; if no, skip to number 11).
If yes, will you be expanding in your a) retail operation, b) wholesale operation, c) production greenhouses,d) all three e) other_____________(Circle all that apply).
11) Please indicate the number of full-time, part-time, and seasonal employees (including family members)you employ each month:
Full-time Part-time Seasonal Full-time Part-time SeasonalJan. ____ ____ ____ July ____ ____ ____Feb. ____ ____ ____ Aug. ____ ____ ____Mar. ____ ____ ____ Sept. ___ ____ ____Apr. ____ ____ ____ Oct. ____ ____ ____May ____ ____ ____ Nov. ____ ____ ____June ____ ____ ____ Dec. ____ ____ ____
12) Since 1995, has the number of employees a) increased, b) decreased, or c) stayed the same?
13) What percentage of your firm’s total annual sales occur during each month?Jan. ____% Apr. ____% Jul. ____% Oct. ____%Feb.____% May ____% Aug. ____% Nov. ____%Mar. ____% Jun. ____% Sep. ____% Dec. ____%
14) Is your greenhouse a ___ part-time business or ____ full-time business?
15) Is your greenhouse your major source of income? ___yes ___no
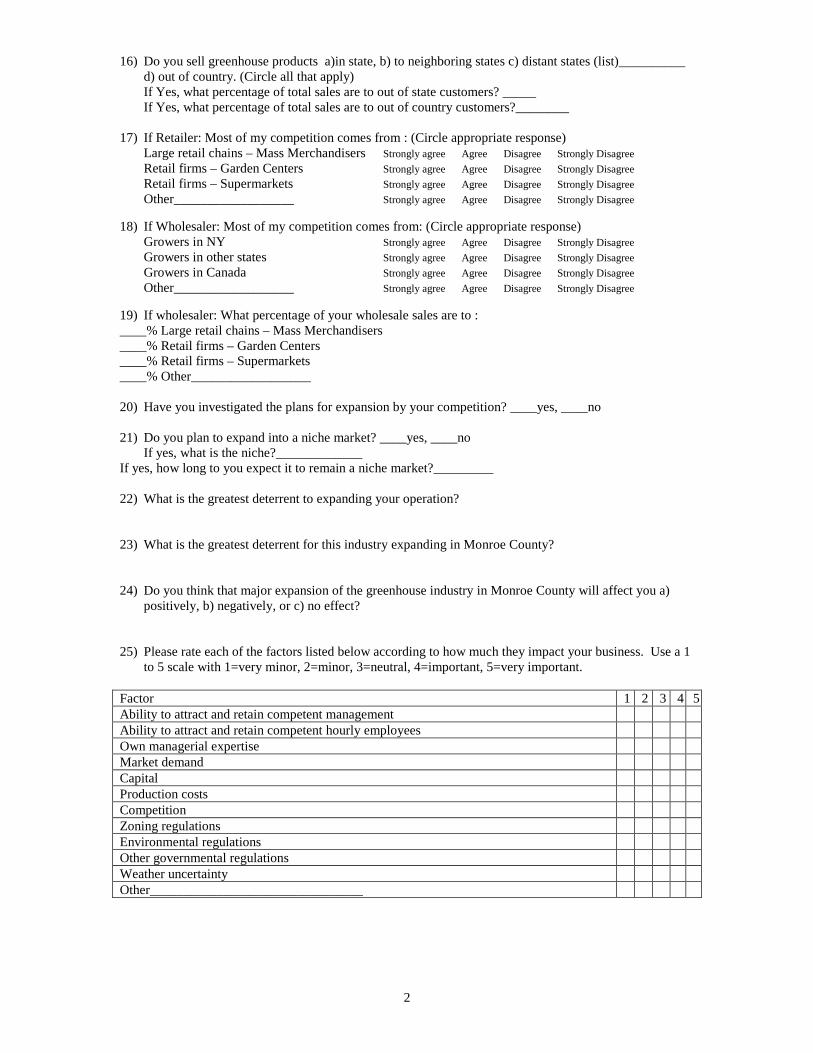
2
16) Do you sell greenhouse products a)in state, b) to neighboring states c) distant states (list)__________d) out of country. (Circle all that apply)If Yes, what percentage of total sales are to out of state customers? _____If Yes, what percentage of total sales are to out of country customers?________
17) If Retailer: Most of my competition comes from : (Circle appropriate response)Large retail chains – Mass Merchandisers Strongly agree Agree Disagree Strongly DisagreeRetail firms – Garden Centers Strongly agree Agree Disagree Strongly DisagreeRetail firms – Supermarkets Strongly agree Agree Disagree Strongly DisagreeOther__________________ Strongly agree Agree Disagree Strongly Disagree
18) If Wholesaler: Most of my competition comes from: (Circle appropriate response)Growers in NY Strongly agree Agree Disagree Strongly DisagreeGrowers in other states Strongly agree Agree Disagree Strongly DisagreeGrowers in Canada Strongly agree Agree Disagree Strongly DisagreeOther__________________ Strongly agree Agree Disagree Strongly Disagree
19) If wholesaler: What percentage of your wholesale sales are to :____% Large retail chains – Mass Merchandisers____% Retail firms – Garden Centers____% Retail firms – Supermarkets____% Other__________________
20) Have you investigated the plans for expansion by your competition? ____yes, ____no
21) Do you plan to expand into a niche market? ____yes, ____noIf yes, what is the niche?_____________
If yes, how long to you expect it to remain a niche market?_________
22) What is the greatest deterrent to expanding your operation?
23) What is the greatest deterrent for this industry expanding in Monroe County?
24) Do you think that major expansion of the greenhouse industry in Monroe County will affect you a)positively, b) negatively, or c) no effect?
25) Please rate each of the factors listed below according to how much they impact your business. Use a 1to 5 scale with 1=very minor, 2=minor, 3=neutral, 4=important, 5=very important.
Factor 1 2 3 4 5Ability to attract and retain competent managementAbility to attract and retain competent hourly employeesOwn managerial expertiseMarket demandCapitalProduction costsCompetitionZoning regulationsEnvironmental regulationsOther governmental regulationsWeather uncertaintyOther________________________________
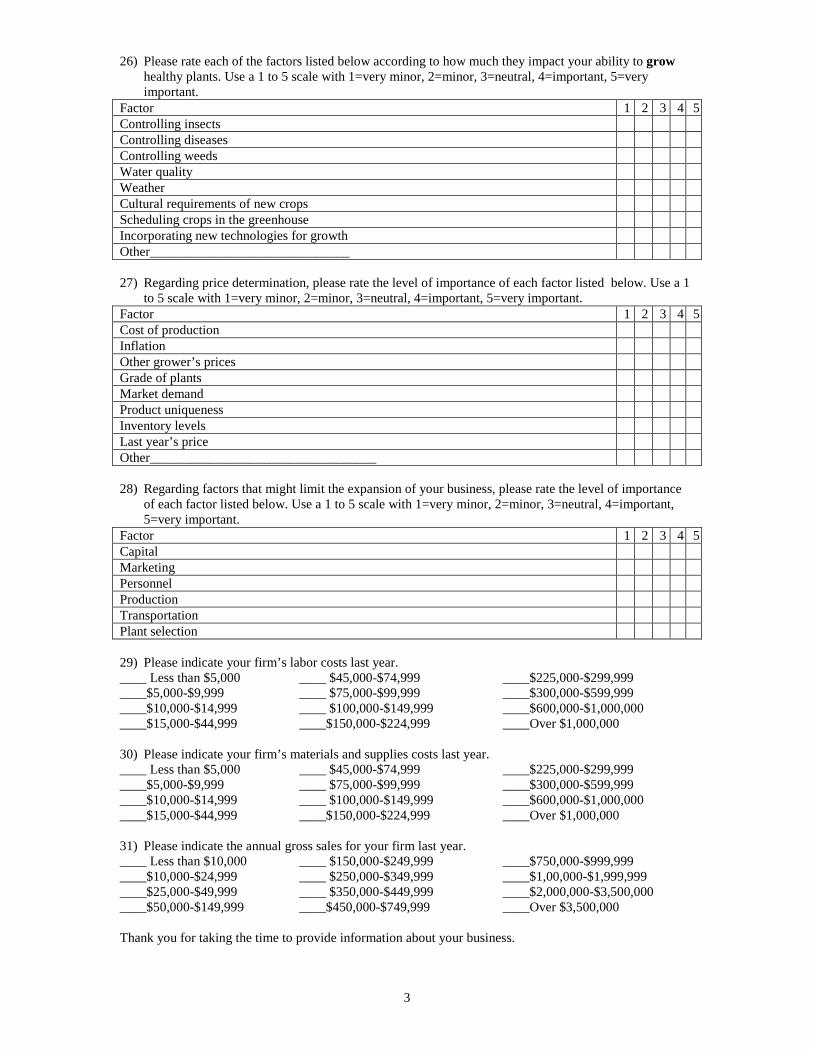
3
26) Please rate each of the factors listed below according to how much they impact your ability to growhealthy plants. Use a 1 to 5 scale with 1=very minor, 2=minor, 3=neutral, 4=important, 5=veryimportant.
Factor 1 2 3 4 5Controlling insectsControlling diseasesControlling weedsWater qualityWeatherCultural requirements of new cropsScheduling crops in the greenhouseIncorporating new technologies for growthOther______________________________
27) Regarding price determination, please rate the level of importance of each factor listed below. Use a 1to 5 scale with 1=very minor, 2=minor, 3=neutral, 4=important, 5=very important.
Factor 1 2 3 4 5Cost of productionInflationOther grower’s pricesGrade of plantsMarket demandProduct uniquenessInventory levelsLast year’s priceOther__________________________________
28) Regarding factors that might limit the expansion of your business, please rate the level of importanceof each factor listed below. Use a 1 to 5 scale with 1=very minor, 2=minor, 3=neutral, 4=important,5=very important.
Factor 1 2 3 4 5CapitalMarketingPersonnelProductionTransportationPlant selection
29) Please indicate your firm’s labor costs last year.____ Less than $5,000 ____ $45,000-$74,999 ____$225,000-$299,999____$5,000-$9,999 ____ $75,000-$99,999 ____$300,000-$599,999____$10,000-$14,999 ____ $100,000-$149,999 ____$600,000-$1,000,000____$15,000-$44,999 ____$150,000-$224,999 ____Over $1,000,000
30) Please indicate your firm’s materials and supplies costs last year.____ Less than $5,000 ____ $45,000-$74,999 ____$225,000-$299,999____$5,000-$9,999 ____ $75,000-$99,999 ____$300,000-$599,999____$10,000-$14,999 ____ $100,000-$149,999 ____$600,000-$1,000,000____$15,000-$44,999 ____$150,000-$224,999 ____Over $1,000,000
31) Please indicate the annual gross sales for your firm last year.____ Less than $10,000 ____ $150,000-$249,999 ____$750,000-$999,999____$10,000-$24,999 ____ $250,000-$349,999 ____$1,00,000-$1,999,999____$25,000-$49,999 ____ $350,000-$449,999 ____$2,000,000-$3,500,000____$50,000-$149,999 ____$450,000-$749,999 ____Over $3,500,000
Thank you for taking the time to provide information about your business.