Monitoring Wps
58
IBM WebSphere Process Server for Multiplatforms Monitoring WebSphere Process Server Version 7.0.0
-
Upload
rsantkumar -
Category
Documents
-
view
59 -
download
1
description
monitoring wps
Transcript of Monitoring Wps

IBM WebSphere Process Server for Multiplatforms
Monitoring WebSphere Process ServerVersion 7.0.0
���

30 April 2010
This edition applies to version 7, release 0, modification 0 of WebSphere Process Server for Multiplatforms (productnumber 5724-L01) and to all subsequent releases and modifications until otherwise indicated in new editions.
To send us your comments about this document, send an e-mail message to [email protected]. We lookforward to hearing from you.
When you send information to IBM, you grant IBM a nonexclusive right to use or distribute the information in anyway it believes appropriate without incurring any obligation to you.
© Copyright IBM Corporation 2006, 2010.US Government Users Restricted Rights – Use, duplication or disclosure restricted by GSA ADP Schedule Contractwith IBM Corp.

Contents
Service component monitoring overview 1Why use monitoring? . . . . . . . . . . . 1What do you monitor? . . . . . . . . . . . 2How do you enable monitoring?. . . . . . . . 3
Enabling and configuring servicecomponent monitoring . . . . . . . . 7Monitoring performance . . . . . . . . . . 7
Performance Monitoring Infrastructure statistics . 8Application Response Measurement statistics forthe Service Component Architecture . . . . . 13
Monitoring service component events . . . . . 26Enabling monitoring of business process andhuman task events . . . . . . . . . . . 27Configuring logging for service componentevents . . . . . . . . . . . . . . . 28Monitoring service components with theCommon Event Infrastructure server . . . . . 34Session monitoring . . . . . . . . . . . 38
Viewing monitored events . . . . . . 39Viewing performance metrics with the TivoliPerformance Viewer . . . . . . . . . . . 39Viewing and interpreting service component eventlog files. . . . . . . . . . . . . . . . 40
Event catalog . . . . . . . . . . . . 43The Common Base Event standard elements . . . 43Business objects in events. . . . . . . . . . 44Business Process Choreographer events . . . . . 45WebSphere Process Server events . . . . . . . 45
Resource Adapter events . . . . . . . . . 45Business rule events . . . . . . . . . . 47Business state machine events . . . . . . . 47Map events . . . . . . . . . . . . . 49Mediation events . . . . . . . . . . . 49Recovery events . . . . . . . . . . . . 50Service Component Architecture events . . . . 51Selector events . . . . . . . . . . . . 52
© Copyright IBM Corp. 2006, 2010 iii

iv Monitoring

Service component monitoring overview
A conceptual overview of the reasons you monitor service components on theprocess server; which event points within the service components you select tomonitor; and, how to configure monitoring on your system.
WebSphere® Process Server provides capabilities for monitoring servicecomponents to aid in system administration functions, such as performance tuningand problem determination. It goes beyond these traditional functions by alsoproviding the capability for persons who are not necessarily informationtechnology specialists to continually monitor the processing of the servicecomponents within the applications deployed on your system. By overseeing theoverall processing flow of the interconnected components, you can ensure thatyour system is producing what you expect it to produce.
WebSphere Process Server operates on top of an installation of WebSphereApplication Server, and, consequently, uses much of the functionality of theapplication server infrastructure for monitoring system performance andtroubleshooting. It also includes some extra functionality that is designed formonitoring process server service components. This section focuses on how youmonitor server-specific service components. It is intended to supplement themonitoring and troubleshooting topics found in the WebSphere Application ServerInformation Center; therefore; refer to that documentation for details of the othermonitoring capabilities in the combined product.
Why use monitoring?You monitor service components within WebSphere Process Server to assessperformance, to troubleshoot problems, and to evaluate the overall processingprogress of service components that make up the applications deployed on yoursystem.
Service components are the integral functions incorporated into WebSphere ProcessServer, with which you can create and deploy applications on your system thatmirror the processes employed in your enterprise. Effectively monitoring thoseservice components is, therefore, essential to managing the tasks that the server isintended to accomplish. There are three main reasons you need to monitor servicecomponents on the server:
Problem determinationYou can diagnose particular errors by using the logging and tracingfacilities provided by WebSphere Application Server, which underliesWebSphere Process Server. For example, if a particular application is notproducing the expected results, you can set up a logger to monitor theprocessing of the service components that make up that application. Youcan have the log output published to a file, which you can then examine topinpoint the cause of the problem. Troubleshooting is a task that is ofimportance to system administrators and others concerned with themaintenance of system hardware and software.
Performance tuningYou can monitor certain performance statistics that most processserver-specific service components produce. Use this information tomaintain and tune your system health, and ensure that your applications
© Copyright IBM Corp. 2006, 2010 1

are tuned optimally and efficiently. You can also spot situations where oneor more of your services are performing at a poor level, which mayindicate that other problems are present in your system. Like problemdetermination, performance tuning is a task typically performed byinformation technology specialists.
Assessing the processing of service componentsProblem determination and performance tuning are tasks you perform on ashort-term basis, to solve a particular issue or problem. You can also set upthe process server to continually monitor the service componentsincorporated into the applications deployed on your system. This type ofservice component monitoring is of importance to those who areresponsible for designing, implementing, and ensuring that the processesachieve their design goals, and may be accomplished persons who are notnecessarily specialists in information technology.
What do you monitor?You can monitor service component events in WebSphere Process Server byselecting certain points that a service component event reaches during processing.Each service component defines these event points, which generate (or “fire”) anevent when the application processes at that given point. You can also monitorperformance statistics for service component events.
Regardless of the type of monitoring you intend to perform on your servicecomponents (problem determination, performance tuning, or process monitoring),you monitor a certain point that is reached during processing. This point isreferred to as an event point, and it is these points that you select to be monitored.Each event point encapsulates the service component kind tag, an optional elementkind (which are specific functions of a service component type), and the nature ofthe event. All these factors determine the type of event generated by monitoring.
Event natures describe the situations required to generate events during theprocessing of service components. These natures are key points in the logicstructure of a service component that you select to be monitored. The mostcommon natures for service component events are ENTRY, EXIT, and FAILURE,but there are many other natures depending on the particular component andelement. Whenever an application containing the specified service component islater invoked, an event is fired every time the processing of a service componentcrosses the points corresponding to the event nature.
As an example of how events are defined for a service component kind, the MAPservice component kind can directly fire events with natures of ENTRY, EXIT, andFAILURE. It also includes an element kind, called Transformation, which defines aspecific type of functionality within the MAP component kind. This element alsofires events with ENTRY, EXIT, and FAILURE natures. Consequently, the MAPservice component kind can fire up to six different events depending on thecombination of elements and natures that you specify. The list of all servicecomponents, their elements, and their event natures is contained in the eventcatalog.
Monitoring is a separate layer of functionality that lies atop the processing of yourapplications, and does not interfere with the processing of your servicecomponents. Monitoring is concerned with service component processing onlyinsofar as it detects activity at a specified event point. When activity is detected, an
2 Monitoring

event is fired by monitoring, which determines where the event is sent, and whatdata is contained in that event, based on the type of monitoring you areperforming:
Performance metricsIf you are monitoring a service component in order to gather performancemetrics, light weight events are fired to the Performance MonitoringInfrastructure. You can select for monitoring one or more of the threeperformance statistics generated for server-specific server components:v A counter for each EXIT event nature – counts successful computations.v A counter for each FAILURE event nature – counts failed computationsv The processing duration calculated between corresponding ENTRY and
EXIT events (synchronous computations only).
You can also monitor the performance of applications at the ServiceComponent Architecture (SCA) level by using Application ResponseMeasurement (ARM) statistics. These measures allow you to monitor anapplication at a much finer level of detail within the application than isotherwise available in other service component events. You can use thesestatistics to monitor many different points between initial application callinvocations and service responses, when they use the SCA.
Service component events with business objectsIf you want to capture the data from events fired by monitoring atspecified event points in service component, then you would configure theserver to generate the event and its data to be encoded in Common BaseEvent formats. You can specify the level of detail of business object data tocapture in each service component event. You can publish these events toeither a logger or to the Common Event Infrastructure (CEI) bus, whichdirects the output to a specially configured CEI server database.
How do you enable monitoring?The are several methods that you can use to specify service component eventpoints for monitoring, depending on the type of monitoring you are planning todo.
Performance statisticsFor Performance Monitoring Infrastructure (PMI) statistics, use theadministrative console to specify the particular event points and theirassociated performance measurements that you want to monitor. After youstart monitoring service component performance, the generated statisticsare published at certain intervals to the Tivoli® Performance Viewer. Youcan use this viewer to watch the results as they occur on your system, and,optionally, log the results to a file that can be later viewed and analyzedwithin the same viewer.
For Application Response Measurement (ARM) statistics, use theadministrative console Request Metrics section to specify and the statisticsyou want to monitor.
Common Base Events for problem determination and business processmonitoring
You can specify, at the time you create an application, to monitor servicecomponent event points — along with a certain level of detail for thoseevents — on a continual basis after the application is deployed on arunning server. You can also select event points to monitor after theapplication has been deployed and the events invoked at least once. In
Service component monitoring overview 3

both cases, the events generated by monitoring are fired across theCommon Event Infrastructure (CEI) bus. These events can be published toa log file, or to a configured CEI Server database. WebSphere ProcessServer supports two types of Common Base Event enablement for problemdetermination and business process monitoring:
Static Certain events points within an application and their level of detailcan be tagged for monitoring using WebSphere IntegrationDeveloper tooling. The selections indicate what event points are tobe continuously monitored, and are stored in a file with a .monextension that is distributed and deployed along with theapplication. When WebSphere Process Server has been configuredto use a CEI server, the monitoring function begins firing servicecomponent events to a CEI server whenever the specified servicesare invoked. As long as the application is deployed on WebSphereProcess Server, the service component event points specified in the.mon file is constantly monitored until the application is stopped.You can specify additional events to be monitored in a runningapplication, and increase the detail level for event points that arealready monitored. But while that application remains active youcannot stop, or lower the detail level of, the monitored eventpoints specified by the .mon of the deployed application.
DynamicIf additional event points need to be monitored during theprocessing of an application without shutting down the server,then you can use dynamic monitoring. Use the administrativeconsole to specify service component event points for monitoring,and set detail level for the payload that will be included in theCommon Base Event. A list is compiled of the event points thathave been reached by a processed service component after theserver was started. Choose from this list individual event points orgroups of event points for monitoring, with the service componentevents directed either to the logger or to the CEI server database.
The primary purpose of the Dynamic enablement is for creatingcorrelated service component events that are published to logs,which allow you to perform problem determination on services.Service component events can be large — depending on how muchdata is being requested — and can tax database resources if youchoose to send events to the CEI server. Consequently, you shouldpublish dynamically monitored events to the CEI server only ifyou need to read the business data of the events, or if youotherwise need to keep a database record of the events. If,however, you are monitoring a particular session, then you need touse the CEI server database to access the service component eventsrelated to that session.
4 Monitoring

Related concepts
“Monitoring performance” on page 7Performance measurements are available for service component event points, andare processed through the Performance Monitoring Infrastructure. You configurethe process server to gather performance metrics from service component eventpoints. You can also collect Service Component Architecture-specific performancestatistics directly from service invocations of applications.“Session monitoring” on page 38You can monitor multiple events that are part of the same session, by using theCommon Base Event browser to find all events on the Common EventInfrastructure database that contain the identical session ID attribute.Related tasks
“Enabling and configuring service component monitoring” on page 7To be able to monitor service components, you must first enable the monitoringcapabilities. Then you must specify the events you want to monitor, theinformation you want to capture from the event, and the method used to publishthe results.
Administering Common Event Infrastructure
Enabling Common Base Events and the audit trail, using the administrativeconsole
Getting performance data from request metrics
Service component monitoring overview 5

6 Monitoring

Enabling and configuring service component monitoring
To be able to monitor service components, you must first enable the monitoringcapabilities. Then you must specify the events you want to monitor, theinformation you want to capture from the event, and the method used to publishthe results.Related concepts
“How do you enable monitoring?” on page 3The are several methods that you can use to specify service component eventpoints for monitoring, depending on the type of monitoring you are planning todo.
Monitoring performancePerformance measurements are available for service component event points, andare processed through the Performance Monitoring Infrastructure. You configurethe process server to gather performance metrics from service component eventpoints. You can also collect Service Component Architecture-specific performancestatistics directly from service invocations of applications.
Whether you are tuning service components for optimal efficiency or diagnosing apoor performance, it is important to understand how the various run time andapplication resources are behaving from a performance perspective. ThePerformance Monitoring Infrastructure (PMI) provides a comprehensive set of datathat explains the runtime and application resource behavior. Using PMI data, theperformance bottlenecks in the application server can be identified and fixed. PMIdata can also be used to monitor the health of the application server.
The PMI is included in the base WebSphere Application Server installation. Thissection provides only supplemental information about performance monitoring asit relates to the service components specific to WebSphere Process Server; therefore,consult the information in the WebSphere Application Server documentation forusing PMI with other parts of the entire product.
The service component event points specific to WebSphere Process Server that canbe monitored by the PMI are those events that include ENTRY, EXIT, andFAILURE event natures. Event sources which are not defined according to thispattern are not supported. Events that are supported have three types ofperformance statistics that can be measured:v Successful invocations.v Failed invocations.v Elapsed time for event completion.
You can also monitor performance statistics derived from the service invocations ofapplications by using the Application Response Measurement (ARM) statistics.These statistics measure the actual runtime processes that underlie the processserver service component events making up an enterprise application. You canderive various performance measurements for the processing of your applicationsusing these statistics.
© Copyright IBM Corp. 2006, 2010 7

Related concepts
“How do you enable monitoring?” on page 3The are several methods that you can use to specify service component eventpoints for monitoring, depending on the type of monitoring you are planning todo.
Performance Monitoring Infrastructure statisticsYou can monitor three types of performance statistics using the PerformanceMonitoring Infrastructure: the number of successful invocations, the number offailures, and the elapsed time to completion of an event. These statistics are onlyavailable for events that have event natures of type ENTRY, EXIT, and FAILURE.
Enabling PMI using the administrative consoleTo monitor performance data you must first enable the Performance MonitoringInfrastructure on the server.
About this task
You can enable the Performance Monitoring Infrastructure (PMI) through theadministrative console.
Procedure
Procedure1. Open the administrative console.2. Click Servers > Server Types > WebSphere application servers in the console
navigation tree.3. Click server_name.
Note: From the administrative console, you can click Monitoring and Tuning> Performance Monitoring Infrastructure (PMI) > server_name to open thesame panel
4. Click the Configuration tab.5. Select the Enable Performance Monitoring Infrastructure (PMI) check box.6. Optional: Select the check box for Use sequential counter updates to enable
precise statistic updates.7. Go back to the server PMI configuration page by clicking the server name
link.8. Click Apply or OK.9. Click Save.
10. Restart the server.
What to do next
The changes you make will not take effect until you restart the server.
Event performance statisticsPerformance monitoring statistics are available for most server events. You can useperformance monitoring statistics to monitor the counts of successful andunsuccessful invocation requests, and the time taken to complete events.
8 Monitoring

You can use the Performance Monitoring Infrastructure (PMI) to monitor threeperformance statistics generated by certain server events, as shown in thefollowing table:
Table 1. PMI statistics for events
Statistic name Type Description
BadRequests Counter Number of failed invocations of the event.
GoodRequests Counter Number of successful invocations of the event.
ResponseTime Timer Elapsed time for event completion.
These statistics are limited to service component events with elements havingENTRY, EXIT, and FAILURE natures. Each statistic is created for a single event of agiven server event type in an application. All performance measurements are eithercounters (a cumulative number of the firings of a given event point), or timers (theduration, measured in milliseconds, between the firings of two event points). Eachevent kind (and their relevant elements) that can be monitored are listed below:
Table 2. Event types and elements that can produce event performance statistics
Event type Element(s)
Business process ProcessInvokeStaffReceiveWaitCompensatePickScope
Human task Task
Business rule Operation
Business state machine TransitionGuardActionEntryActionExitAction
Selector Operation
Map MapTransformation
Mediation OperationBindingParameterMediation
Resource adapter InboundEventRetrievalInboundEventDeliveryOutbound
Enabling and configuring service component monitoring 9

Related reference
“Application Response Measurement statistics for the Service ComponentArchitecture” on page 13There are 25 performance statistics that you can monitor at the Service ComponentArchitecture (SCA) level. You can use these Application Response Measurement(ARM) statistics, which are either counters or timers, to measure invocations to andresponses from services in various patterns.
Specifying performance statistics to monitorYou can specify single statistics, multiple statistics, or groups of related statisticsfor monitoring through the Performance Monitoring Infrastructure by using theadministrative console.
Before you begin
Ensure that you have enabled performance monitoring, and that you have at leastonce invoked the event you want to monitor before performing this task.
Procedure
Procedure1. Open the administrative console.2. Select Monitoring and Tuning → Performance Monitoring Infrastructure.3. Select the server or node agent that contains the event points that you want to
monitor.
Note: You cannot choose to monitor statistics on a cluster; you can only do soon a specific server or node.
4. Expand some of the groups, such as WBIStats.RootGroup or Enterprise Beans.All the statistics that can be monitored are in the listed groups. Some statisticscannot be listed because they have not been invoked since the server was laststarted.
5. Select a statistic you want to monitor from the tree on the left side of the panel,and then select the statistics that you want to collect on the right side, thenclick Enable. Repeat for all statistics that you want to monitor.
6. Go back to the server PMI configuration page by clicking the server name link.7. Click Apply or OK.8. Click Save.
Results
You can now start monitoring the performance of your chosen statistics in theTivoli Performance Viewer.
Note: When viewing these statistics, Do not mix counter-type statistics withduration-type statistics. Counters are cumulative, and the scales against which theyare graphed them can quickly grow depending on your application. Durationstatistics, in contrast, tend to remain within a certain range because they representthe average amount of time that it takes your system to process each event.Consequently, the disparity between the statistics and their relative scales cancause one or the other type of statistic to appear skewed in the viewer graph.
10 Monitoring

Tutorial: Service component performance monitoringThis tutorial guides you through an example of setting up performancemonitoring, and how to view the resulting statistics.
For service component event points that you monitor, you can publish to thePerformance Monitoring Infrastructure (PMI) and view the resulting performancestatistics on the Tivoli Performance Viewer (TPV). This exercise demonstrates howperformance monitoring of service component event points differs from monitoringusing the Common Event Infrastructure (CEI) server and loggers. The majordifference that you notice is that you select an entire service component elementfor performance monitoring, instead of individual events with specific natures.Because WebSphere Process Server can monitor performance only on servicecomponent elements having events with ENTRY, EXIT, and FAILURE natures, youhave only those kinds of service component elements available to you to select formonitoring.
While the service component event points ENTRY, EXIT, and FAILURE areidentical for all monitoring types, the performance monitoring function in theserver fires "minimized" events that do not contain all the informationencompassed in CEI events. These events are sent to the PMI, which calculatesthese performance statistics from corresponding sets of events:v Successful invocation — the firing of an event of nature type EXIT that follows a
corresponding ENTRY event.v Failed invocation — the firing of an event with a FAILURE nature following a
corresponding ENTRY event.v Time for successful completion — the elapsed time between the firing an ENTRY
event and the firing of the corresponding EXIT event point.
The PMI publishes the statistics to the TPV, which presents cumulative counters forthe number of successful and failed invocations and a running average of thecompletion response times.
Objectives of this tutorial
After completing this tutorial, you will be able to:v Select the performance statistics of service component elements that you want to
monitor.v View and interpret the resulting performance statistics.
Time required to complete this tutorial
This tutorial requires approximately 15-20 minutes to complete.
Prerequisites
In order to perform this tutorial, you must have:v Configured and started a server.v Enabled the PMI on the server.v Installed and started the Samples Gallery application on the server.v Installed and started the business rules sample application on the server. Follow
the instructions on the Samples Gallery page to set up and run the businessrules sample application.
Enabling and configuring service component monitoring 11

After all these prerequisites have been completed, run the business rules sampleapplication from the Samples Gallery at least once before proceeding with thetutorial.
Example: Monitoring service component performance:
For monitoring performance, you can use the administrative console to selectservice components for monitoring and view performance measurements. Thisexample shows the use of the console to monitor performance statistics.
About this task
You will use the business rules sample application for this scenario, where you willmonitor all three of the performance statistics: successes, failures, and responsetimes. You should have the web page containing this application already open;keep it open, because you will be running the sample several times after you beginmonitoring. Ensure that you have already run the sample at least once, whichcauses it to appear in the list of functions that you can select to monitor.
Procedure
Procedure
1. Open the administrative console.2. Select the cluster or server to monitor.
v To monitor a cluster, click Servers → Clusters → WebSphere applicationserver clusters → cluster_name.
v To monitor a single server, click Servers → Server Types → WebSphereapplication servers → server_name.
3. Click the Runtime tab.4. Under Performance, click Performance Monitoring Infrastructure.5. Select Custom.6. Expand WBIStats.RootGroup → BR → brsample_module.DiscountRuleGroup
→ Operation.7. Select _calculateDiscount
8. Select the check boxes next to BadRequests, GoodRequests, andResponseTime.
9. Click Enable
10. In the navigation pane, click Monitoring and Tuning → Performance Viewer →Current Activity.
11. Select the check box next to server_name, then click Start Monitoring.12. Click server_name.13. Expand WBIStats.RootGroup → BR → brsample_module.DiscountRuleGroup
→ Operation.14. Select the check box next to _calculateDiscount
Results
You should now see a blank graph, and underneath that the names and values forthe three statistics. Select the check boxes next to the statistic names, if they are notalready checked. The PMI is now ready to publish performance data for theselected event, and the Tivoli Performance Viewer is ready to present the results.
12 Monitoring

Run the business rules sample application several times, and then watch theperformance viewer as it periodically refreshes. Notice that there are now lines onthe graph, representing the cumulative number of successful requests and theaverage response time for each successful request. You can also see the values nextto the name for each statistic below the graph. The line for the number of successesshould continue to rise as you perform additional invocations of the sample, whilethe response time line should level off after a few refreshes.
After you have completed this example, you should understand how WebSphereProcess Server implements performance monitoring of service components. Youshould know how to select service components for monitoring, and how theperformance statistics are calculated. You will also be able to start the performancemonitors, and view the performance measurements for your applications as theyare being used.
What to do next
Performance monitoring can tax system resources; therefore, after you havecompleted this task you should stop the monitors. To do this, click the TivoliPerformance Viewer link, select both the node and the server, and press StopMonitoring.
Application Response Measurement statistics for the ServiceComponent Architecture
There are 25 performance statistics that you can monitor at the Service ComponentArchitecture (SCA) level. You can use these Application Response Measurement(ARM) statistics, which are either counters or timers, to measure invocations to andresponses from services in various patterns.
The Application Response Measurement (ARM) statistics shown in the followingtables are — in a simplified manner — time and count measurements of callerinvocations to the Service Component Architecture (SCA) layer, and the resultsreturned from a service. There are, in fact, a number of service invocation patternsthat vary between synchronous and asynchronous implementations of deferredresponses, results retrievals, callbacks, and one-way invocations. All patterns,however, are between the caller invocation and a service, the response from theservice, or, in some cases, a data source, with the SCA layer interposed in between.
You can specify the ARM statistics that you want to monitor by opening theMonitoring and Tuning > Request Metrics panel on the administrative console.Request metrics information might be either saved to the log file for later retrievaland analysis, be sent to ARM agents, or both. WebSphere Process Server does notship an ARM agent; however, it supports the use of agents adhering to ARM 4.0.You can choose your own ARM implementation provider to obtain the ARMimplementation libraries. Follow the instructions from the ARM provider, andensure that the ARM API Java archive (JAR) files found in the ARM provider areon the class path so that WebSphere Process Server can load the needed classes.Then you need to add the following entries into the system properties for eachserver by selecting from the administrative console Application servers >server_name > Process Definition > Java Virtual Machine > Custom Propertiesbefore restarting the server:v Arm40.ArmMetricFactory — the full Java class name of your ARM
implementation providers metrics factory.v Arm40.ArmTranReportFactory — the full Java class name of your ARM
implementation providers transaction report factory.
Enabling and configuring service component monitoring 13
v Arm40.ArmTransactionFactory — the full Java class name of your ARMimplementation providers transaction factory.
See the WebSphere Application Server documentation for further details on how toconfigure the server to collect ARM statistics.
Table 3. Event types and elements that can produce ARM statistics
Event type Element
Business process Process
Human task Task
Business rule Operation
Business state machine TransitionGuardActionEntryActionExitAction
Selector Operation
Map MapTransformation
Mediation OperationBindingParameterMediation
Resource adapter InboundEventRetrievalInboundEventDeliveryOutbound
Table 4. Common. These statistics are common to all service invocation patterns.
Statistic name Type Description
GoodRequests Counter Number of server invocations not raising exceptions.
BadRequests Counter Number of server invocations raising exceptions.
ResponseTime Timer Duration measured on the server side between thereception of a request and computing the result.
TotalResponseTime Timer
Duration measured on the caller side, from the time acaller requests a service to the time when the result isavailable for the caller. Does not include the processing ofthe result by the caller.
RequestDeliveryTime Timer
Duration measured on the caller side, from the time acaller requests a service to the time when the request ishanded over to the implementation on the server side. Ina distributed environment, the quality of thismeasurement depends on the quality of synchronizationof system clocks.
ResponseDeliveryTime Timer
The time required to make the result available to theclient. For a deferred response, this time does not includethe result retrieve time. In a distributed environment, thequality of this measurement depends on the quality ofsynchronization of system clocks.
14 Monitoring

Table 5. Reference. These statistics occur when a caller makes an invocation to the SCA layer or a data source,without a response from the service.
Statistic name Type Description
GoodRefRequests CounterNumber of caller invocations to the SCA layer that donot raise exceptions.
BadRefRequests CounterNumber of caller invocations to the SCA layer that doraise exceptions.
RefResponseTime TimerDuration measured on the caller side, from the time thecaller makes a request to the SCA layer and the timewhen the results of that call are returned to the caller.
BadRetrieveResult CounterNumber of caller invocations to a data source that doraise exceptions.
GoodRetrieveResult CounterNumber of caller invocations to a data source that donot raise exceptions.
RetrieveResultResponseTime TimerDuration measured on the caller side, from the time thecaller makes a request to the data source and the timewhen the data source response is returned to the caller.
RetrieveResultWaitTime TimerDuration measured on the caller side if a timeoutoccurs.
Table 6. Target. These statistics occur when there are requests that originate between the service and the SCA or adata source.
Statistic name Type Description
GoodTargetSubmit CounterNumber of SCA invocations to the service that do not raiseexceptions.
BadTargetSubmit CounterNumber of SCA invocations to the service that do raiseexceptions.
TargetSubmitTime TimerDuration measured on the server side, from the time the SCAmakes a request to the service and the time when the results ofthat call are returned to the SCA.
GoodResultSubmit CounterNumber of service invocations to the data source that do not raiseexceptions.
BadResultSubmit CounterNumber of service invocations to the data source that do raiseexceptions.
ResultSubmitTime TimerDuration measured on the server side, from the time the servicemakes a request to the data source and the time when the resultsof are returned to the service.
Table 7. Callback. These statistics occur when a callback (a "sibling" of the original call) is present on the caller.
Statistic name Type Description
GoodCB Counter Number of SCA invocations to the callback that do not raise exceptions.
BadCB Counter Number of SCA invocations to the callback that do raise exceptions.
CBTime Timer Duration from the time the SCA makes a request to the callback, and thetime when the results from the callback are returned to the SCA.
GoodCBSubmit Counter Number of invocations from the service to the SCA handling the callbackthat do not raise exceptions.
BadCBSubmit Counter Number of invocations from the service to the SCA handling the callbackthat do raise exceptions.
Enabling and configuring service component monitoring 15

Table 7. Callback (continued). These statistics occur when a callback (a "sibling" of the original call) is present onthe caller.
Statistic name Type Description
CBSubmitTime Timer Duration from the time the service makes a request to the SCA handlingthe callback, and the time when the results from the SCA to the service.
Related reference
“Performance Monitoring Infrastructure statistics” on page 8You can monitor three types of performance statistics using the PerformanceMonitoring Infrastructure: the number of successful invocations, the number offailures, and the elapsed time to completion of an event. These statistics are onlyavailable for events that have event natures of type ENTRY, EXIT, and FAILURE.Related information
WebSphere Application Server documentation Network Deployment
Synchronous invocationsYou can obtain Application Response Measurement (ARM) performance statisticsfrom a simple Service Component Architecture (SCA) call to a service and theresponse from the service.
Parameters
Event monitoring for SCA components includes the event points that are shown in
black , while the event points shown in blue are used only to calculateand fire PMI/ARM statistics.
In the table and diagram below, the "current" ARM transaction (denoted as X1) iscreated when the calling service component was invoked for the first time. If thecaller is not a service component, the current ARM transaction is used, or a newone is created. If it is not the starting transaction then it has a parent, asrepresented in the following table and diagram with the notation Xn.Xn+1. Thenotation is used to document the transaction lineage. Every SCA invocation starts anew transaction, which is parented by the current transaction of the caller. You cancreate new transactions and you can access the current transaction, but they do notmodify the SCA transaction lineage.
Table 8. ARM statistics for synchronous invocations of SCA
Statistics Formula ARM Transaction
TotalResponseTime t3 - t0 X0 .X1
RequestDeliveryTime t1 - t0 X1 .X2
ResponseDeliveryTime t3 - t2
GoodRequests CountEXIT
BadRequests CountFAILURE
ProcessTime t2 - t1
16 Monitoring

Service
CallerX0.X1
X1.X2
Executionthread
EXIT EXIT
SCA
FAILURE FAILURE
t0 t 1
t 3t 2
ENTRY ENTRY
Deferred response with synchronous implementationYou can obtain Application Response Measurement (ARM) statistics with asynchronous invocation of the request. The returned result is sent as output to adata store for a synchronous implementation.
Parameters
Event monitoring for Service Component Architecture (SCA) components includes
the event points that are shown in black , while the event points shown in
blue are used only to calculate and fire PMI/ARM statistics.
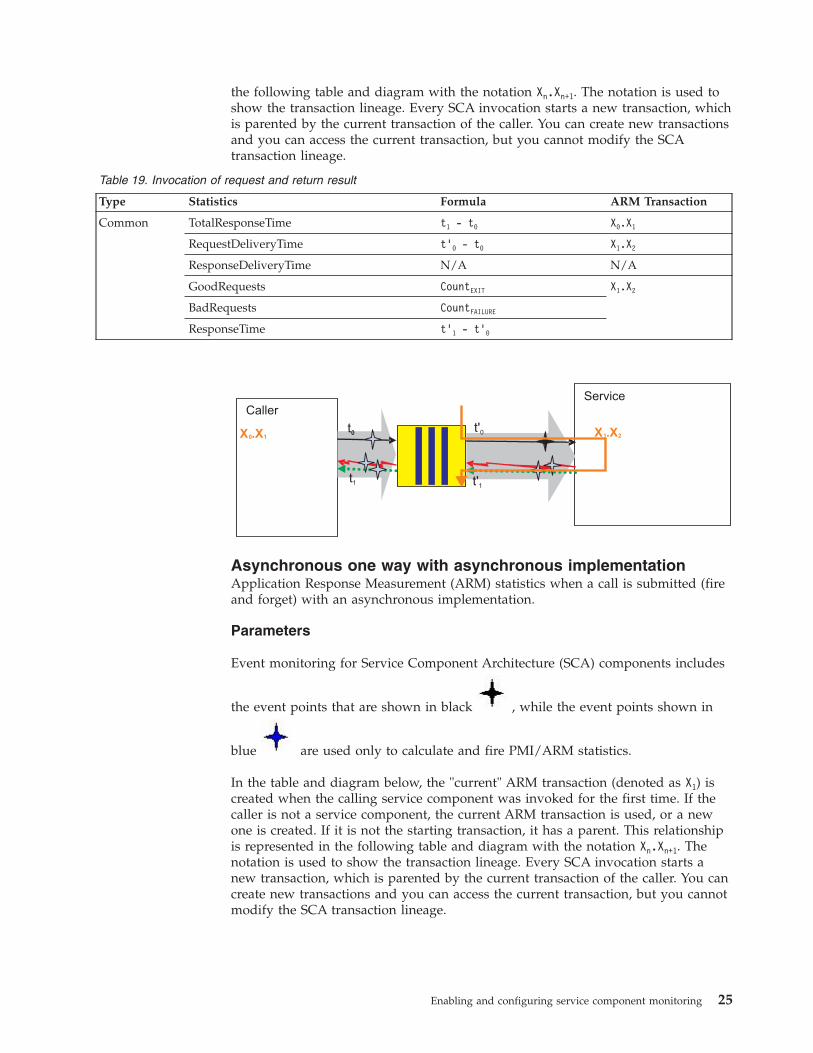
In the table and diagram below, the "current" ARM transaction (denoted as X1) iscreated when the calling service component was invoked for the first time. If thecaller is not a service component, the current ARM transaction is used, or a newone is created. If it is not the starting transaction, it has a parent, as represented inthe following table and diagram with the notation Xn.Xn+1. The notation is used toshow the transaction lineage. Every SCA invocation starts a new transaction, whichis parented by the current transaction of the caller. You can create new transactionsand you can access the current transaction, but you cannot modify the SCAtransaction lineage.
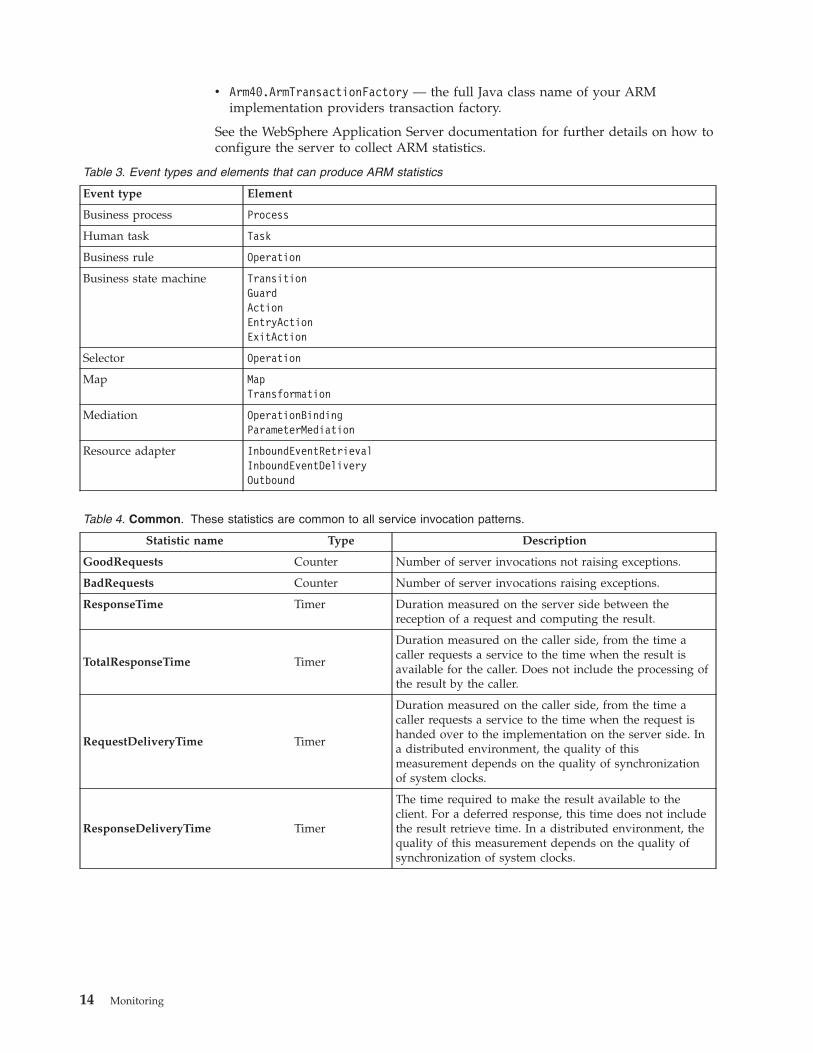
Table 9. Invocation of request and return result
Type Statistics Formula ARM Transaction
Common TotalResponseTime t3 - t0 X0.X1
RequestDeliveryTime t’0 - t0 X1.X2
ResponseDeliveryTime N/A N/A
GoodRequests CountEXIT X1.X2
BadRequests CountFAILURE
ResponseTime t’1 - t’0
Enabling and configuring service component monitoring 17
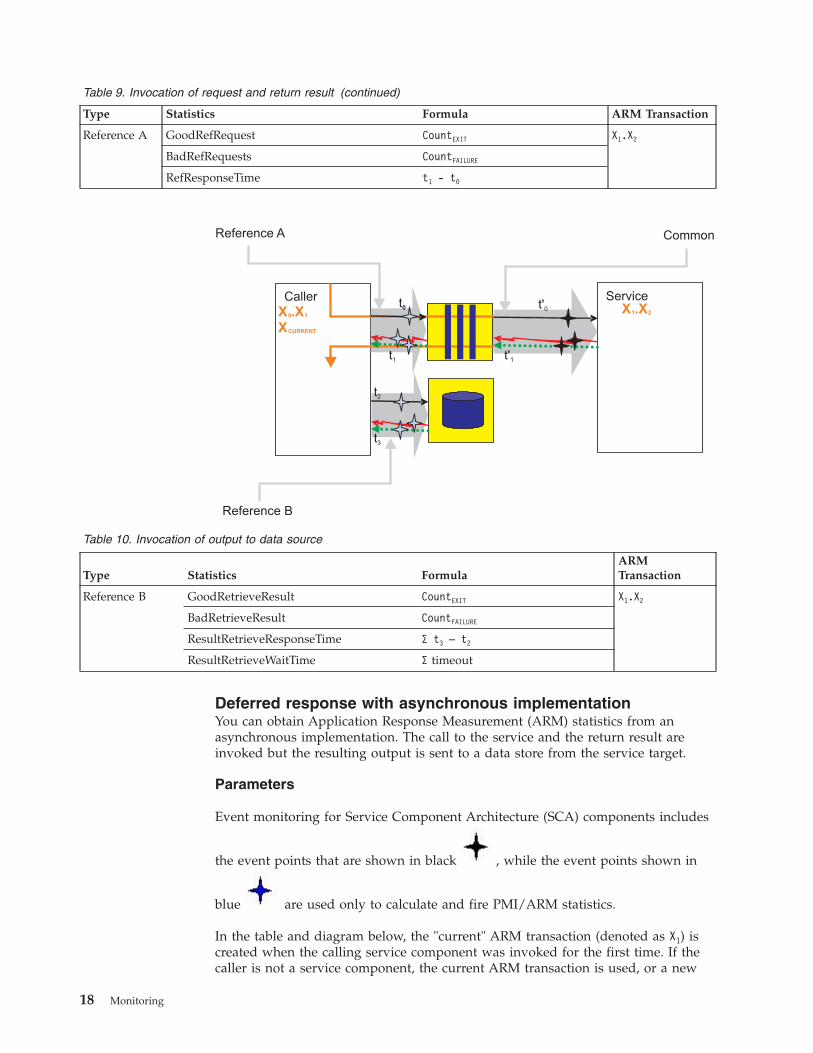
Table 9. Invocation of request and return result (continued)
Type Statistics Formula ARM Transaction
Reference A GoodRefRequest CountEXIT X1.X2
BadRefRequests CountFAILURE
RefResponseTime t1 - t0
ServiceCaller
X0.X1
XCURRENT
X1.X2
CommonReference A
Reference B
t'0t0
t1
t2
t3
t'1
Table 10. Invocation of output to data source
Type Statistics FormulaARMTransaction
Reference B GoodRetrieveResult CountEXIT X1.X2
BadRetrieveResult CountFAILURE
ResultRetrieveResponseTime Σ t3 – t2
ResultRetrieveWaitTime Σ timeout
Deferred response with asynchronous implementationYou can obtain Application Response Measurement (ARM) statistics from anasynchronous implementation. The call to the service and the return result areinvoked but the resulting output is sent to a data store from the service target.
Parameters
Event monitoring for Service Component Architecture (SCA) components includes
the event points that are shown in black , while the event points shown in
blue are used only to calculate and fire PMI/ARM statistics.
In the table and diagram below, the "current" ARM transaction (denoted as X1) iscreated when the calling service component was invoked for the first time. If thecaller is not a service component, the current ARM transaction is used, or a new
18 Monitoring
one is created. If it is not the starting transaction, it has a parent, as represented inthe following table and diagram with the notation Xn.Xn+1. The notation is used toshow the transaction lineage. Every SCA invocation starts a new transaction, whichis parented by the current transaction of the caller. You can create new transactionsand you can access the current transaction, but you cannot modify the SCAtransaction lineage.
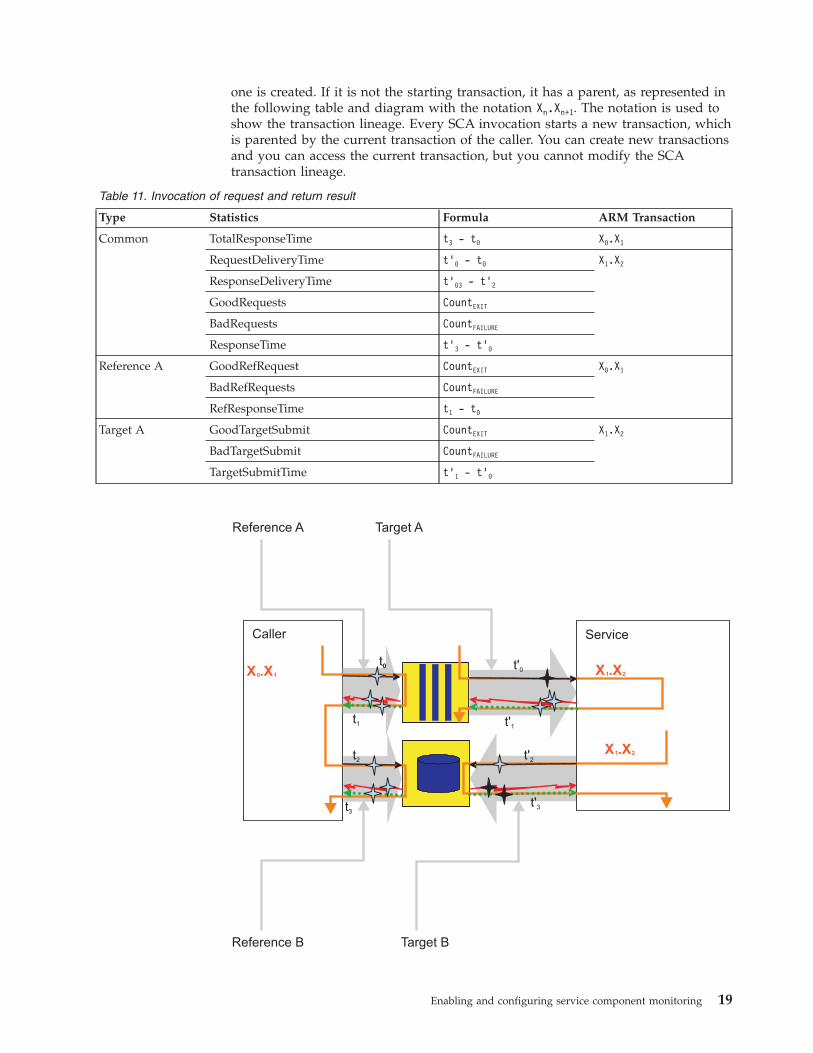
Table 11. Invocation of request and return result
Type Statistics Formula ARM Transaction
Common TotalResponseTime t3 - t0 X0.X1
RequestDeliveryTime t’0 - t0 X1.X2
ResponseDeliveryTime t’03 - t’2
GoodRequests CountEXIT
BadRequests CountFAILURE
ResponseTime t’3 - t’0
Reference A GoodRefRequest CountEXIT X0.X1
BadRefRequests CountFAILURE
RefResponseTime t1 - t0
Target A GoodTargetSubmit CountEXIT X1.X2
BadTargetSubmit CountFAILURE
TargetSubmitTime t’1 - t’0
ServiceCaller
X0.X1 X1.X2
X1.X2
Target A
Target B
Reference A
Reference B
t'0t0
t1 t'1
t2 t'2
t3t'3
Enabling and configuring service component monitoring 19

Table 12. Invocation of return result to a data store
Type Statistics Formula ARM Transaction
Reference B GoodResultSubmit CountEXIT X0.X1
BadResultSubmit CountFAILURE
ResultResponseTime t’3 - t’2
Target B GoodResultRetrieve CountEXIT X1.X2
BadResultRetrieve CountFAILURE
ResultRetrieveResponseTime Σ t3 - t2
ResultRetrieveWaitTime Σ timeout
Deferred response with asynchronous result retrieveThe ResultRetrieve Application Response Measurement (ARM) statistic can becorrelated to some original request using the ARM transactions only if XPARENT-1and XPARENT-2 have a common ancestor transaction. The invocation of request, andresult retrieve occur on different threads
Parameters
Event monitoring for Service Component Architecture (SCA) components includes
the event points that are shown in black , while the event points shown in
blue are used only to calculate and fire PMI/ARM statistics.
In the table and diagram below, the "current" ARM transaction (denoted as X1) iscreated when the calling service component was invoked for the first time. If thecaller is not a service component, the current ARM transaction will be used, or anew one will be created. If it is not the starting transaction it will have a parent.This is represented in the following table and diagram with the notation Xn.Xn+1.These are used to show the transaction lineage. Every SCA invocation starts a newtransaction, which is parented by the current transaction of the caller. You cancreate new transactions and you can access the current transaction, but this willnot modify the SCA transaction lineage.
Table 13. Invocation of request and return result
Type Statistics Formula ARM Transaction
Common TotalResponseTime t3 - t0 X0.X1
RequestDeliveryTime t’0 - t0 X1.X2
ResponseDeliveryTime N/A N/A
GoodRequests CountEXIT X1.X2
BadRequests CountFAILURE
ResponseTime See specific diagrams
Reference A GoodReferenceRequest CountEXIT X1.X2
BadReferenceRequests CountFAILURE
ReferenceResponseTime t1 - t0
20 Monitoring

Caller
X
X'
0
0
.X
.X'
1
1
Reference A
Reference B
t0
t1
t2
t3
For the right side of the diagram seethe diagrams in the “Deferred responsewith synchronous/asynchronousimplementations” topics.
The request receive time t'0 is thesame in both cases.
Table 14. Invocation of request and return result
Type Statistics Formula ARM Transaction
Reference B GoodRetrieveResult CountEXIT X’0.X’1
BadRetrieveResult CountFAILURE
RetrieveResultResponseTime Σ t3 - t2
RetrieveResultWaitTime Σ timeout
Asynchronous callback with synchronous implementationYou can obtain Application Response Measurement (ARM) statistics when callbackrequests and callback executions use different threads on a synchronousimplementation.
Parameters
Event monitoring for Service Component Architecture (SCA) components includes
the event points that are shown in black , while the event points shown in
blue are used only to calculate and fire PMI/ARM statistics.
In the table and diagram below, the "current" ARM transaction (denoted as X1) iscreated when the calling service component was invoked for the first time. If thecaller is not a service component, the current ARM transaction is used, or a newone is created. If it is not the starting transaction, it has a parent, as represented inthe following table and diagram with the notation Xn.Xn+1. The notation is used toshow the transaction lineage. Every SCA invocation starts a new transaction, whichis parented by the current transaction of the caller. You can create new transactionsand you can access the current transaction, but you cannot modify the SCAtransaction lineage.
Enabling and configuring service component monitoring 21

Table 15. Invocation of request and return result
Type Statistics FormulaARMTransaction
Common TotalResponseTime t2 - t0 X0.X1
RequestDeliveryTime t’0 - t0 X1.X2
ResponseDeliveryTime t2 - t’1
GoodRequests CountEXIT
BadRequests CountFAILURE
ResponseTime t3 - t2
Reference GoodRefRequest CountEXIT X1.X2
BadRefRequests CountFAILURE
RefResponseTime t’1 - t’0
ServiceCallerX0.X1
X1.X2
Callback
X2.X3
Reference Common
Callback
t'0t0
t1 t'1
t2
t3
Table 16. Invocation of callback
Type Statistics Formula ARM Transaction
Callback GoodCB CountEXIT X1.X3
BadCB CountFAILURE
CBTime t3 – t2
Asynchronous callback with asynchronous implementationApplication Response Measurement (ARM) statistics are available for callbackrequests and callback executions using different threads with an asynchronousimplementation
22 Monitoring

Parameters
Event monitoring for Service Component Architecture (SCA) components includes
the event points that are shown in black , while the event points shown in
blue are used only to calculate and fire PMI/ARM statistics.
In the table and diagram below, the "current" ARM transaction (denoted as X1) iscreated when the calling service component was invoked for the first time. If thecaller is not a service component, the current ARM transaction is used, or a newone is created. If it is not the starting transaction it has a parent, as represented inthe following table and diagram with the notation Xn.Xn+1. The notation is used toshow the transaction lineage. Every SCA invocation starts a new transaction, whichis parented by the current transaction of the caller. You can create new transactionsand you can access the current transaction, but you cannot modify the SCAtransaction lineage.
Table 17. Invocation of request and return result
Type Statistics Formula ARM Transaction
Common TotalResponseTime t2 - t0 X0.X1
RequestDeliveryTime t’0 - t0 X1.X2
ResponseDeliveryTime t2 - t’2
GoodRequests CountEXIT
BadRequests CountFAILURE
ResponseTime t’3 - t’0
Reference A GoodRefRequest CountEXIT X0.X1
BadRefRequests CountFAILURE
RefResponseTime t1 - t0
Target A GoodTargetSubmit CountEXIT X1.X2
BadTargetSubmit CountFAILURE
TargetSubmitTime t’1 - t’0
Enabling and configuring service component monitoring 23

ServiceCaller
X0.X1
XCURRENT
X1.X2
X1.X2
Callback
X2.X3
'
Reference A
Reference B
Target A
Target B
t0 t'0
t1t'1
t2t'2
t3 t'3
Table 18. Invocation of callback
Type Statistics Formula ARM Transaction
Reference B GoodCBSubmit CountEXIT X1.X2
BadCBSubmit CountFAILURE
CBSubmitTime t’3 - t’2
Target B GoodCB CountEXIT X0.X1
BadCB CountFAILURE
CBTime t3 - t2
Asynchronous one way with synchronous implementationThese Application Response Measurement (ARM) statistics can be obtained when acall is submitted (fire and forget) with a synchronous implementation.
Parameters
Event monitoring for Service Component Architecture (SCA) components includes
the event points that are shown in black , while the event points shown in
blue are used only to calculate and fire PMI/ARM statistics.
In the table and diagram below, the "current" ARM transaction (denoted as X1) iscreated when the calling service component was invoked for the first time. If thecaller is not a service component, the current ARM transaction is used, or a newone is created. If it is not the starting transaction, it has a parent, as represented in
24 Monitoring
the following table and diagram with the notation Xn.Xn+1. The notation is used toshow the transaction lineage. Every SCA invocation starts a new transaction, whichis parented by the current transaction of the caller. You can create new transactionsand you can access the current transaction, but you cannot modify the SCAtransaction lineage.
Table 19. Invocation of request and return result
Type Statistics Formula ARM Transaction
Common TotalResponseTime t1 - t0 X0.X1
RequestDeliveryTime t’0 - t0 X1.X2
ResponseDeliveryTime N/A N/A
GoodRequests CountEXIT X1.X2
BadRequests CountFAILURE
ResponseTime t’1 - t’0
ServiceCaller
X0.X1X1.X2
t'0t0
t1 t'1
Asynchronous one way with asynchronous implementationApplication Response Measurement (ARM) statistics when a call is submitted (fireand forget) with an asynchronous implementation.
Parameters
Event monitoring for Service Component Architecture (SCA) components includes
the event points that are shown in black , while the event points shown in
blue are used only to calculate and fire PMI/ARM statistics.
In the table and diagram below, the "current" ARM transaction (denoted as X1) iscreated when the calling service component was invoked for the first time. If thecaller is not a service component, the current ARM transaction is used, or a newone is created. If it is not the starting transaction, it has a parent. This relationshipis represented in the following table and diagram with the notation Xn.Xn+1. Thenotation is used to show the transaction lineage. Every SCA invocation starts anew transaction, which is parented by the current transaction of the caller. You cancreate new transactions and you can access the current transaction, but you cannotmodify the SCA transaction lineage.
Enabling and configuring service component monitoring 25

Table 20. Invocation of request and return result
Type Statistics Formula ARM Transaction
Common TotalResponseTime t1 - t0 X0.X1
RequestDeliveryTime t’0 - t0 X1.X2
ResponseDeliveryTime N/A N/A
GoodRequests CountEXIT X1.X2
BadRequests CountFAILURE
ResponseTime t2 - t0
Reference GoodRefRequest CountEXIT X0.X1
BadRefRequest CountFAILURE
RefResponseDuration t1 - t0
Reference
CompletionReportUtility
X .X0 1
X .X1 2
X .X1 2
t'0t0
t1 t'1
Service
Caller
'
t2
Monitoring service component eventsWebSphere Process Server monitoring can capture the data in a service componentat a certain event point. You can view each event in a log file, or you can use themore versatile monitoring capabilities of a Common Event Infrastructure server.
Applications that are deployed on the process server may contain a specification ofservice component events that will be monitored for as long as the applicationruns. If you developed the application using the WebSphere Integration Developer,then you can specify service component events to monitor continuously. Thisspecification is included as part of the application, and comes in the form of filewith a .mon extension that is read by the process server when the application isdeployed. After the application is started, you will not be able to turn offmonitoring of the service components specified in the .mon file. Thedocumentation for the WebSphere Process Server does not address this type ofcontinuous monitoring. For more information about this subject, refer to theWebSphere Integration Developer documentation.
You can use WebSphere Process Server to monitor service component events thatare not already specified in the .mon file of the application. You can configure theprocess server to direct the output of the event monitors to a log file, or to aCommon Event Infrastructure server database. The monitored events will be
26 Monitoring

formatted using the Common Base Event standard, but you can regulate theamount of information contained in each event. Use the monitoring facilities inWebSphere Process Server to diagnose problems, analyze the process flow of yourapplications, or audit how your applications are used.
Enabling monitoring of business process and human taskevents
You must configure WebSphere Process Server to support monitoring of businessprocess and human task service components before you do any actual monitoringof those service component kinds.
Before you begin
You must have previously created the business process container and the humantask container on the process server.
About this task
Perform this task to enable Common Event Infrastructure monitoring support onWebSphere Process Server.
Procedure
Procedure1. Open the administrative console.2. If Business Process Choreographer is configured on a single server, complete
the following steps to enable the server to generate business process events:a. To enable business process events for the Human Task Manager, click
Servers → Server Types → WebSphere application servers → server_name,then on the Configuration tab under Business Integration, expandBusiness Process Choreographer, click Human Task Manager. In thesection State Observers, ensure that the boxes for Enable Common EventInfrastructure Logging, Enable audit logging, and Enable task history areselected. If the check boxes are not selected, then you must select them andrestart the server.
b. To enable business process events for the Business Flow Manager, clickServers → Server Types → WebSphere application servers → server_name,then on the Configuration tab under Business Integration, expandBusiness Process Choreographer, click Business Flow Manager. In thesection State Observers, ensure that the boxes for Enable Common EventInfrastructure Logging and Enable audit logging are selected. If the checkboxes are not selected, then you must select them and restart the server.
3. If Business Process Choreographer is configured on a cluster, complete thefollowing steps to enable the cluster to generate business process events:a. To enable business process events for the Human Task Manager, click
Servers → Clusters → WebSphere application server clusters → cluster_name,then on the Configuration tab under Business Integration, expandBusiness Process Choreographer, click ensure that the boxes for EnableCommon Event Infrastructure Logging, Enable audit logging, and Enabletask history are selected. If the check boxes are not selected, then you mustselect them and restart the server.
b. To enable business process events for the Business Flow Manager, clickServers → Clusters → WebSphere application server clusters → cluster_name,
Enabling and configuring service component monitoring 27

then on the Configuration tab under Business Integration, expandBusiness Process Choreographer, click Business Flow Manager. In thesection State Observers, ensure that the boxes for Enable Common EventInfrastructure Logging and Enable audit logging are selected. If the checkboxes are not selected, then you must select them and restart the server.
What to do next
If you had to select any of the boxes, then you must restart the server or cluster forthe changes to take effect.
Configuring logging for service component eventsYou can choose to use the logging facilities of WebSphere Application Server tocapture the service component events fired by process server monitoring. Use theloggers to view the data in events when you diagnose problems with theprocessing of your applications.
WebSphere Process Server uses the extensive logging facilities of the underlyingWebSphere Application Server to allow you to capture the events fired by servermonitoring at service component event points. You can use the administrativeconsole to specify the particular service component event points that you want tomonitor, the amount of payload detail contained in the resulting servicecomponent events, and the method used to publish the results, such as to a file ofa certain format, or directly to a console. Monitor logs contain events encoded inCommon Base Event format, and you can use the information contained in theevent elements to trace problems with the processing of your service components.
The functionality of WebSphere Application Server logging and tracing capabilitiesis documented in considerable detail in the WebSphere Application Serverdocumentation, with complete details of how logging and tracing is used withinthe entire product. This section provides only supplemental information aboutlogging as it relates to the service components that are specific to WebSphereProcess Server. Consult the information in the WebSphere Application Serverdocumentation for using logging and trace with other components of the entireproduct.
Enabling the diagnostic trace serviceUse this task to enable the diagnostic trace service, which is the logging servicethat can manage the amount of detail contained in the service component event.
Before you begin
You must have the business process and human task containers configured toallow Common Event Infrastructure (CEI) logging and audit logging.
About this task
The diagnostic trace service is the only logger type that can provide the level ofdetail required to capture the detail contained in the elements of servicecomponent events. You must enable the diagnostic trace service before you startthe process server in order to log events. The service must also be enabled if youuse the administrative console to select service component event points formonitoring using the CEI server.
Procedure
28 Monitoring

Procedure1. In the navigation pane, click Servers → Server Types → WebSphere application
servers.2. Click the name of the server that you want to work with.3. Under Troubleshooting, click Diagnostic Trace service.4. Select Enable log on the Configuration tab.5. Click Apply, and then Save.6. Click OK.
What to do next
If the server was already started, then you must restart it for the changes to takeeffect.
Configuring logging properties using the administrative consoleUse this task to specify that the monitoring function publish service componentevents to a logger file.
About this task
Before applications can log monitored events, you must specify the servicecomponent event points that you want to monitor, what level of detail you requirefor each event, and format of the output used to publish the events to the logs.Using the administrative console, you can:v Enable or disable a particular event log.v Specify the level of detail in a log.v Specify where log files are stored, how many log files are kept, and a format for
log output.
You can change the log configuration statically or dynamically. Static configurationchanges affect applications when you start or restart the application server.Dynamic or run time configuration changes apply immediately.
When a log is created, the level value for that log is set from the configurationdata. If no configuration data is available for a particular log name, the level forthat log is obtained from the parent of the log. If no configuration data exists forthe parent log, the parent of that log is checked, and so on, up the tree until a logwith a non-null level value is found. When you change the level of a log, thechange is propagated to the children of the log, which recursively propagates thechange to their children, as necessary.
Procedure
Procedure1. Enable logging and set the output properties for a log:2. In the navigation pane, click Servers > Server Types > WebSphere
application servers.3. Click the name of the server that you want to work with.4. Under Troubleshooting, click Logging and tracing.5. Click Change Log Detail levels.6. The list of components, packages, and groups displays all the components that
are currently registered on the running server; only server events that have
Enabling and configuring service component monitoring 29

been invoked at least once appear on this list. All server components withevent points that can be logged are listed under one of the components thatstart with the name WBILocationMonitor.LOG.
v To select events for a static change to the configuration, click theConfiguration tab.
v To select events for a dynamic change to the configuration, click theRuntime tab.
7. Select the event or group of events that you want to log.8. Set the logging level for each event or group of events.
Note: Only the levels FINE, FINER, and FINEST are valid for CEI eventlogging.
9. Click Apply.10. Click OK.11. To have static configuration changes take effect, stop then restart the server.
Results
By default, the loggers publish their output to a file called trace.log, located in theinstall_root/profiles/profile_name/logs/server_name folder.
Tutorial: Logging service component eventsFor service component event points that you monitor, events can be published tothe logging facilities of the underlying WebSphere Application Server. This tutorialguides you through an example of setting up monitoring with logging, and how toview events stored in a log file.
The scenario you will follow for this example will show you how to select servicecomponent event points for monitoring in applications already deployed andrunning on a server. You will see how the monitoring function fires an eventwhenever the processing of an application reaches one of those event points. Eachof those fired events takes the form of a standardized Common Base Event, whichis published as an XML string directly to a log file.
Objectives of this tutorial
After completing this tutorial you will be able to:v Select service component event points to monitor, with the output published to
the server loggers.v View the stored events in the log files.
Time required to complete this tutorial
This tutorial requires approximately 15-20 minutes to complete.
Prerequisites
In order to perform this tutorial, you must have:v Configured and started a server.v Configured Common Event Infrastructure.v Enabled the diagnostic trace service on the server.v Installed and started the Samples Gallery application on the server.
30 Monitoring

v Installed and started the business rules sample application on the server. Followthe instructions on the Samples Gallery page to set up and run the businessrules sample application.
After all of these prerequisites have been completed, run the business rules sampleapplication from the Samples Gallery at least once before proceeding with thetutorial.
Example: Monitoring events in the logger:
For monitoring with logging, you can use the administrative console to managethe details for event types. This example shows the use of the console to changethe level of detail recorded for some event types and to use a text editor to openthe trace.log file to view the information for individual events.
About this task
You will use the business rules sample application for this scenario, so you shouldalready have the web page containing this application already open. Keep it open,since you will be running the sample after you specify monitoring parameters.Ensure that you have already run the sample at least once, so that it will appear inthe list of functions that you can select to monitor.
Procedure
Procedure
1. Open the administrative console.2. In the navigation pane, click Servers → Application Servers.3. Click server_name.4. Under Troubleshooting, click Logging and tracing
5. Click Change Log Detail levels
6. Select the Runtime tab.7. Expand the tree for WBILocationMonitor.LOG.BR and you will see seven
event types under the WBILocationMonitor.LOG.BR.brsample.* element. Thefirst event is calledWBILocationMonitor.LOG.BR.brsample_module.DiscountRuleGroup, whichincludes a single function, named Operation._calculateDiscount, with thefollowing natures:v ENTRYv EXITv FAILUREv SelectionKeyExtractedv TargetFound
8. Click on each of the events and select finest.9. Click OK.
10. Switch the business rules sample application page, and run the applicationonce.
11. Use a text editor to open the trace.log file located in the profile_root/logs/server_name folder on your system.
Enabling and configuring service component monitoring 31

Results
You should see lines in the log containing the business rule events fired by themonitor when you ran the sample application. The main thing you will probablynotice is that the output consists of lengthy, unparsed XML strings conforming tothe Common Base Event standard. Examine the ENTRY and EXIT events, and youwill see that business object — which was included because you selected the finestlevel of detail — is encoded in hexadecimal format. Compare this output withevents published to the Common Event Infrastructure server, which parses theXML into a readable table and decodes any business object data into a readableformat. You may want to go back through this exercise and change the level ofdetail from finest to fine or finer, and compare the differences between the events.
After completing this exercise, you should understand how to select servicecomponent event points for monitoring to the logger. You have seen that theevents fired in this type monitoring have a standard format, and that the resultsare published as a string in raw XML format directly to a log file. To view thepublished events, open the log file in a text editor, and decipher the contents ofindividual events.
What to do next
If you no longer want to monitor the business rules sample application, you can goback to through the steps outlined here and reset the level of detail for the sampleevents to info.
Audit logging for business rules and selectorsYou can set up WebSphere Process Server to automatically log any changes madeto business rules and selectors.
You can configure your server to automatically detect when changes are made tobusiness rules and selectors, and create an entry in a log file detailing the changes.
You can choose to have the log entries written to either the standard JVMSystemOut.log file, or to a custom audit log file of your choice. Depending on howthe changes are made, the process server where each business rule or selectorchange is made logs the:v name of the person making the changev location from where the change request originatedv old business rule or selector objectv new business rule or selector replacing the old object
The business rule and selector objects are the complete business rule set, decisiontable, business rule group, or selector for both the business rule or selector that isreplaced and the new version which replaced it. You can examine the logs (theaudit output cannot be directed to the Common Event Infrastructure database) todetermine the changes that were made, by comparing the old and new businessrules or selectors. The following scenarios describe the circumstance when loggingoccurs, if it has been configured, and the contents of the log entry:
32 Monitoring

Scenario Result Log entry contents
Publish business rules using theBusiness Rule Manager
RequestUser ID, Server name (including Celland Node, if applicable), old businessrule ruleset, new ruleset.
FailureUser ID, Server name (including Celland Node, if applicable), old businessrule ruleset, new ruleset.
Repository database update andcommit (from attempt to publishusing the Business Rule Manager)
Success User ID, old ruleset, new ruleset.
Failure User ID, new ruleset.
Exporting a selector or business rulegroup
RequestUser ID, selector, or business rulegroup name.
Success
User ID, Server name (including Celland Node, if applicable), copy ofexported selector or business rulegroup
FailureUser ID, Server name (including Celland Node, if applicable), selector orbusiness rule group name.
Importing a selector or business rulegroup
RequestUser ID, copy of new selector orbusiness rule group.
Success
User ID, Server name (including Celland Node, if applicable), copy ofimported selector or business rulegroup, copy of selector or businessrule group that was replaced by theimported version.
Failure
User ID, Server name (including Celland Node, if applicable), copy ofselector or business rule group thatwas to be imported.
Application installation
SuccessUser ID, Server name (including Celland Node, if applicable), selector orbusiness rule group name.
FailureUser ID, Server name (including Celland Node, if applicable), selector orbusiness rule group name.
Application update (through theadministrative console or wsadmincommand)
Success
User ID, Server name (including Celland Node, if applicable), copy of newselector or business rule group, copyof old selector or business rule group.
FailureUser ID, Server name (including Celland Node, if applicable), copy of newselector or business rule group
Previously deployed application withexisting business rules, selectors orboth is started
SuccessServer name (including Cell andNode, if applicable), copy of selectoror business rule group.
FailureServer name (including Cell andNode, if applicable), copy of selectoror business rule group.
Enabling and configuring service component monitoring 33

Monitoring service components with the Common EventInfrastructure server
You can choose to have service component monitoring results published to aCommon Event Infrastructure (CEI) server. Service component event points can bespecified for monitoring with the CEI server on a permanent basis for viewing andmanaging application flow, or on an temporary basis for troubleshooting problems.
You can use monitoring to publish the data in service component event pointswithin service component events that are fired across the CEI bus. This approachto monitoring allows you much more flexibility in analyzing your servicecomponent activities on your system. You can also use browsers optimized for CEIevents, such as the Common Base Event browser.
The events are structured identically to the events sent to loggers, but are storedon a database which can be accessed by viewers designed specifically for analyzingservice component events. Service component event points can be specified withinan application when it is created, for continual monitoring at all times after theapplication is deployed and running on a server (a method known as “static”monitoring). You perform static monitoring on service component event points thatare of particular importance in the proper flow of component processing on yoursystem. With this information, you can easily oversee the actions of, andinteractions between, the service component processes running on your system.You can also quickly detect deviations from the normal flow of these processes,which can indicate that your service components are not working properly.
To configure static monitoring of service components, you use WebSphereIntegration Developer to select the service component event points in yourapplications. The selections are specified in the form of an XML file with a .monextension that is deployed along with the application. After you have deployed theapplication on a running server, you cannot turn off or lower the detail level of themonitoring for events specified in the .mon file of the application. To stop thismonitoring, you must stop the server and undeploy the application.
You can also select service component event points for “dynamic” monitoring,which can be enabled and disabled on an application already deployed to arunning server. The rationale for performing dynamic monitoring using the CEIserver is essentially the same as that for logging: to diagnose and troubleshootproblems on your system. The output is essentially the same as the output that ispublished to loggers, with Common Base Event elements that make up thestructure for each event fired across the CEI bus. Also, like logging data, thedifferences in detail levels affect only how much of the payload is encoded withinthe event.
Configuring service component event monitoring using theadministrative consoleUse the administrative console to dynamically specify the monitoring function topublish service component events to the Common Event Infrastructure server.
Before you begin
You must enable the diagnostic trace service, just as you would with the logger.After you restart your server you would invoke the events you want to monitoronce, because that will cause them to appear on the list of events available formonitoring.
34 Monitoring

About this task
This method of selecting events for monitoring is used for applications that havealready been deployed on a process server. Events that are specified in a .mon filethat is deployed with the application on the process server are monitored by theCommon Event Infrastructure (CEI) database regardless of any changes you makehere. For those events, you can only specify a greater level of detail to be capturedand published to the CEI database. The output that is published to the CEIdatabase is very similar to that published by loggers.
Procedure
Procedure1. From the administrative console, click Troubleshooting > Logging and tracing.2. Click Change Log Detail levels
3. The list of components, packages, and groups displays all the components thatare currently registered on the running server; only process server events thathave been invoked at least once appear on this list. All process server eventsthat can be logged are listed under one of the components that start with thename WBILocationMonitor.CEI.v To make a static change to the configuration, click the Configuration tab.v To change the configuration dynamically, click the Runtime tab.
4. Select an event or group of events to monitor.5. Click the level of detail that you want to capture for each event.
Note: Only the levels FINE, FINER, and FINEST are valid for CEI events.6. Click Apply, and then Save.7. Click OK.8. If you made a static change to the configuration, then you will have to restart
the process server for the changes to take effect.
Results
You can view the monitored event results in the Common Base Event browser.
Tutorial: Using the Common Event Infrastructure server for eventmonitoringThis tutorial guides you through an example of setting up monitoring with the CEIserver, and how to view events stored in the database.
For service component event points that you monitor, events can be published tothe Common Event Infrastructure (CEI) server and stored in the CEI serverdatabase. Once events have been captured, use the Common Base Event browser toview those stored events. The example you use in this scenario does not involvestatic monitoring, whereby an application deployed with a .mon file continuallymonitors specific service components event points. For information about how toperform static monitoring, consult the IBM® WebSphere Integration DeveloperInformation Center.
The scenario you follow for this example, instead, shows you how to select formonitoring event points on service components in applications already deployedand running on a server. You can see how the monitoring function fires an eventwhenever the processing of an application reaches one of those event points. Each
Enabling and configuring service component monitoring 35

of those fired events are published to the CEI server, which stores the eventinformation about its database. You then use the Common Base Event browser toview the events.
Objectives of this tutorial
After completing this tutorial you will be able to:v Select service component event points to monitor, with events published to the
CEI server.v View the stored events with the Common Base Event browser.
Time required to complete this tutorial
This tutorial requires approximately 15-20 minutes to complete.
Prerequisites
In order to perform this tutorial, you must have:v Configured and started a server.v Configured the CEI and its database.v Enabled the diagnostic trace service on the server.v Installed and started the Samples Gallery application on the server.v Installed and started the business rules sample application on the server. Follow
the instructions on the Samples Gallery page to set up and run the businessrules sample application.
After all these prerequisites have been completed, run the business rules sampleapplication from the Samples Gallery at least once before proceeding with thetutorial.
Example: Monitoring with the Common Event Infrastructure server:
For monitoring with the CEI server, you can use the administrative console tomanage the details for event types and to display recorded events in the CommonBase Event browser. This example shows the use of the console to change the levelof detail recorded for some event types and to use the Common Base Eventbrowser to view the information for individual events.
About this task
You will use the business rules sample application for this scenario; consequently,you should already have the web page containing this application already open.Keep it open, since you will be running the sample after you specify monitoringparameters. Ensure that you have already run the sample at least once, becausethat will cause it to appear in the list of functions that you can select to monitor.
Procedure
Procedure
1. Open the administrative console.2. In the navigation pane, click Servers → Server Types → WebSphere application
servers.3. Click server_name.4. Under Troubleshooting, click Logging and tracing
36 Monitoring

5. Click Change Log Detail levels
6. Select the Runtime tab.7. Expand the tree for WBILocationMonitor.CEI.BR and you will see five event
types under the WBILocationMonitor.CEI.BR.brsample.* element. Each eventtype includes the nameWBILocationMonitor.CEI.BR.brsample_module.DiscountRuleGroup,appended by the function Operation._calculateDiscount, and the followingnatures:v ENTRYv EXITv FAILUREv SelectionKeyExtractedv TargetFound
8. Click on each of the events and select finest.9. Click OK.
10. Switch the business rules sample application page, and run the applicationonce.
11. Go back to the administrative console, and select Integration Applications →Common Base Event Browser from the navigation pane.
12. If you are running your server on node within a Network Deploymentenvironment, then you may need to modify the Event Data Store field toinclude to the names of your server and node. Enter the string in thefollowing form: 'cell/nodes/node_name/servers/server_name/ejb/com/ibm/events/access/EventAccess'.
13. Press Get Events.
Results
You should now see a list in the upper pane of the Common Base Event browserof the four business rule events that were published to the CEI server when youran the sample application. Select one of the events, and you will be shown thecontents of the event in the lower pane. Compare this to the events published tothe loggers. Notice that the browser has parsed the original XML string that waspublished to the CEI server, and that the business object code in the ENTRY andEXIT events was converted from the original hexadecimal format to readable XML.You may want to go back through this exercise and change the level of detail fromfinest to fine or finer, and compare the differences between the events.
After completing this exercise, you should understand how to select servicecomponent event points for monitoring using the CEI server. You have seen thatthe events fired in this type monitoring have a standard format, and that theresults are published to a database. You should also be able to use the CommonBase Event browser to retrieve events from the database, and view the informationfor individual events in a parsed table format on the browser.
What to do next
If you no longer want to monitor the business rules sample application, you can goback to through the steps outlined here and reset the level of detail for the sampleevents to info.
Enabling and configuring service component monitoring 37

Session monitoringYou can monitor multiple events that are part of the same session, by using theCommon Base Event browser to find all events on the Common EventInfrastructure database that contain the identical session ID attribute.
WebSphere Process Server has enhanced capabilities with which you can identifyall the service component events that are part of a single session. The standardelements for the Common Base Event include an attribute under thecontextDataElement element, called WBISessionID. A unique identifier for anindividual session is stored in this attribute, for all service component events thatwere part of that session. You can use the SessionID field in the Common BaseEvent browser to search for events stored on the Common Event Infrastructure(CEI) database that match the session ID you specify. With this capability, you caneasily review the process flow and contents of all the service component events.You can use this information to assess the efficiency of your applications, and aidyou in diagnosing problems that occur only under certain circumstances.
You can use the Common Base Event browser to view the returned list of eventsand their associated contents. If you click the All Events view, you can see columnsof links for more details about events. If a particular event has a link in the Failedcolumn, you can click that link to view more details about the failed event.Similarly, if there is a link in the Business Process associated with a particularevent, you can click that link to open the Business Process Choreographer Explorerand view further information about the business process or human task event.Related concepts
“How do you enable monitoring?” on page 3The are several methods that you can use to specify service component eventpoints for monitoring, depending on the type of monitoring you are planning todo.
38 Monitoring

Viewing monitored events
There are a number of ways for you to view the published results of yourmonitored events, depending on the type of monitoring you are using. This sectionpresents methods that you can use to view performance data, event logs, andservice component events stored on a Common Event Infrastructure database.
Viewing performance metrics with the Tivoli Performance ViewerYou can use the Tivoli Performance Viewer to start and stop performancemonitoring; view Performance Monitoring Infrastructure data in chart or tableform as it occurs on your system; and, optionally, log the data to a file that youcan later review in the same viewer.
Before you begin
Before you can view performance metrics with the Tivoli Performance Viewer, thefollowing conditions must be true:v The servers that you want to monitor must be running on the nodev The Performance Monitoring Infrastructure (PMI) is enabledv The service component event points that you want to monitor have been
invoked at least once so that they can be selected from within the viewer.
About this task
The Tivoli Performance Viewer (TPV) is a powerful application that allows youview various details of about the performance of your server. The section entitled“Monitoring performance with Tivoli Performance Viewer” in the WebSphereApplication Server Information Center contains details about how to use this toolfor various purposes, including the resource for complete instructions on using thisprogram. This section is limited to discussing the viewing of performance data forevents specific to WebSphere Process Server.
The performance viewer enables administrators and programmers to monitor thecurrent health of WebSphere Process Server. Because the collection and viewing ofdata occurs on the process server, performance is affected. To minimizeperformance impacts, monitor only those servers whose activity you want tomonitor.
Note: When viewing these statistics, do not mix counter-type statistics withduration-type statistics. Counters are cumulative, and the scales against which theyare graphed can quickly grow depending on your application. Duration statistics,in contrast, tend to remain within a certain range because they represent theaverage amount of time that it takes your system to process each event.Consequently, the disparity between the statistics and their relative scales cancause one or the other type of statistic to appear skewed in the viewer graph.
Procedurev View current performance activity
1. Click Monitoring and Tuning → Performance Viewer → Current Activity inthe administrative console navigation tree.
© Copyright IBM Corp. 2006, 2010 39
2. Select Server, then click the name of the server whose activity you want tomonitor. You can alternatively select the check box for the server whoseactivity you want to monitor, then click Start Monitoring. To startmonitoring multiple servers at the same time, select the servers then clickStart Monitoring.
3. Select Performance Modules.4. Select the check box beside the name of each performance module that you
want to view. WebSphere Process Server events that emit performancestatistics, and that have been invoked at least once, are listed under theWBIStats.RootGroup hierarchy. Expand the tree by clicking + next to a nodeand shrink it by clicking – next to a node.
5. Click View Modules. A chart or table providing the requested data isdisplayed on the right side of the page. Charts are displayed by default.Each module has several counters associated with it. These counters aredisplayed in a table underneath the data chart or table. Selected counters aredisplayed in the chart or table. You can add or remove counters from thechart or table by selecting or clearing the check box next to them. By default,the first three counters for each module are shown.You can select up to 20 counters and display them in the TPV in the CurrentActivity mode.
6. Optional: To remove a module from a chart or table, clear the check box nextto the module then click View Modules again.
7. Optional: To view the data in a table, click View Table on the counterselection table. To toggle back to a chart, click View Graph.
8. Optional: To view the legend for a chart, click Show Legend. To hide thelegend, click Hide Legend.
9. When you have finished monitoring the performance of your events, clickTivoli Performance Viewer, select the server you were monitoring, and clickStop Monitoring.
v Log performance statisticsWhile monitoring is active on a server, you can log the data from all the PMIcounters that are currently enabled and record the results in a TPV log file. Youcan view the TPV log file for a particular time period multiple times, selectingdifferent combinations of up to 20 counters each time. You have the flexibility toobserve the relationships among different performance measures in the serverduring a particular period.1. Click Start Logging when viewing summary reports or performance
modules.2. When finished, click Stop Logging. By default, the log files are stored in the
profile_root/logs/tpv directory on the node on which the server is running.The TPV automatically compresses the log file when it finishes writing to itto conserve space. There must only be a single log file in each compressedfile and it must have the same name as the compressed file.
3. Click Monitoring and Tuning → Performance Viewer → View Logs in theadministrative console navigation tree to view the logs
Viewing and interpreting service component event log filesThis topic discusses how you would interpret the information in a log filegenerated by service component monitoring. You can view the log files in the logviewer on the administrative console, or in a separate text file editor of yourchoice.
40 Monitoring

Events fired to the logger by service component monitoring are encoded inCommon Base Event format. When published to a log file, the event is included asa single, lengthy line of text in XML tagging format, which also includes severallogger-specific fields. Consult the event catalog section of this documentation fordetails on deciphering the Common Base Event coding of the logged event. Usethis section to understand the other fields contained in each entry of the log file,and how the format you chose for the log file when you configured the logger isstructured.
Basic and advanced format fields
Logging output can be directed either to a file or to an in-memory circular buffer.If trace output is directed to the in-memory circular buffer, it must be dumped to afile before it can be viewed. Output is generated as plain text in either basic,advanced or log analyzer format as specified by the user. The basic and advancedformats for output are like the basic and advanced formats that are available forthe message logs. Basic and Advanced Formats use many of the same fields andformatting techniques. The fields that can be used in these formats include:TimeStamp
The timestamp is formatted using the locale of the process where it isformatted. It includes a fully qualified date (YYMMDD), 24 hour time withmillisecond precision and the time zone.
ThreadIdAn 8-character hexadecimal value generated from the hash code of thethread that issued the trace event.
ThreadNameThe name of the Java thread that issued the message or trace event.
ShortNameThe abbreviated name of the logging component that issued the traceevent. This is typically the class name for WebSphere Process Serverinternal components, but can be some other identifier for user applications.
LongNameThe full name of the logging component that issued the trace event. This istypically the fully qualified class name for WebSphere Process Serverinternal components, but can be some other identifier for user applications.
EventTypeA one-character field that indicates the type of the trace event. Trace typesare in lowercase. Possible values include:1 a trace entry of type fine or event.2 a trace entry of type finer.3 a trace entry of type finest, debug, or dump.Z a placeholder to indicate that the trace type was not recognized.
ClassNameThe class that issued the message or trace event.
MethodNameThe method that issued the message or trace event.
OrganizationThe organization that owns the application that issued the message or traceevent.
ProductThe product that issued the message or trace event.
ComponentThe component within the product that issued the message or trace event.
Viewing monitored events 41

Basic format
Trace events displayed in basic format use the following format:<timestamp><threadId><shortName><eventType>[className][methodName]<textmessage>
[parameter 1][parameter 2]
Advanced format
Trace events displayed in advanced format use the following format:<timestamp><threadId><eventType><UOW><source=longName>[className][methodName]<Organization><Product><Component>[thread=threadName]<textMessage>[parameter 1=parameterValue][parameter 2=parameterValue]
Log analyzer format
Specifying the log analyzer format allows you to open trace output using the LogAnalyzer tool, which is an application included with WebSphere ApplicationServer. This is useful if you are trying to correlate traces from two different serverprocesses, because it allows you to use the merge capability of the Log Analyzer.
42 Monitoring

Event catalog
The event catalog contains the specifications for all the events that can bemonitored for each service component type, and the associated Common BaseEvent extended data elements produced by each event.
Use the information presented in this section as reference material that enables youto understand how individual events are structured. This knowledge helps youdecipher the information contained in each event, so that you can quickly identifythe pieces of information you need from the relatively large amount of datagenerated by each event.
The information included in this section covers the following items:v The structure and standard elements of the Common Base Eventv The list of events for the Business Process Choreographer service componentsv The list of WebSphere Process Server-specific service componentsv The extensions to the Common Base Event unique to each event type
There is also a discussion of how business objects that might be processed by aservice component are captured in service component events.
When an event of a given type is fired across the Common Event Infrastructure(CEI) bus to the CEI server or to a logger, it takes the form of a Common BaseEvent — which is, essentially, an XML encapsulation of the event elements createdaccording to the event catalog specification. The Common Base Event includes aset of standard elements, server component identification elements, EventCorrelation Sphere identifiers, and additional elements unique to each event type.All of these elements are passed to the CEI server or logger whenever an event isfired by a service component monitor, with one exception: if the event includes thebusiness object code within the payload, you may specify the amount of businessobject data that you want to include in event.
The Common Base Event standard elementsThe elements of the Common Base Event that are included in all events fired fromservice component monitoring are listed here.
Attribute Description
version Set to 1.0.1.
creationTime The time at which the event is created, in UTC.
globalInstanceId The identifier of the Common Base Event instance. This ID is automaticallygenerated.
localInstanceId This ID is automatically generated (may be blank).
severity The impact that the event has on business processesor on human tasks. Thisattribute is set to 10 (information). Otherwise, it is not used.
priority Not used.
reporterComponentId Not used.
locationType Set to Hostname.
location Set to the host name of the executing server.
© Copyright IBM Corp. 2006, 2010 43

Attribute Description
application Not used.
executionEnvironment A string that identifies the operating system.
component Process server version. For business processes and human tasks: Set to WPS#,followed by the SCA version, the identification of the current platform, andthe version identification of the underlying software stack.
componentType The component QName, based on the Apache QName format.
For business processes, set to:
www.ibm.com/namespaces/autonomic/Workflow_Engine
For human tasks, set to:
www.ibm.com/xmlns/prod/websphere/scdl/human-task
subComponent The observable element name.
For business processes, set to BFM.For human tasks, set to HTM.
componentIdType Set to ProductName.
instanceId The identifier of the server. This identifier has the formatcell_name/node_name/server_name. The delimiters are operating systemdependent.
processId The process identifier of the operating system.
threadId The thread identifier of the Java virtual machine (JVM).
Situation Type The type of situation that caused the event to be reported. For specificcomponents, set to ReportSituation.
Situation Category The category of the type of situation that caused the event to be reported.For specific components, set to STATUS.
Situation Reasoning Scope The scope of the impact of the situation reported. For specific components,set to EXTERNAL.
ECSCurrentID The value of the current Event Correlation Sphere ID.
ECSParentID The value of the parent Event Correlation Sphere ID.
WBISessionID The value of the current Session ID.
extensionName Set to the event name.
Business objects in eventsBusiness object data is, starting with version 6.1, carried within the event in XMLformat. The Common Base Event format includes an xs:any schema, whichencapsulates the business object payload in XML elements.
You specify the level of business object detail that will be captured in servicecomponent events. This level of detail affects only the amount of business objectcode that will be passed to the event; all of the other Common Base Eventelements (both standard and event-specific) will be published to the event. Thenames of the detail levels applicable to service component events differ dependingon whether you created a static monitor using WebSphere Integration Developer,or a dynamic monitor on the administrative console, but they correspond as shownin the table below:
44 Monitoring

Administrative consoledetail level
Common BaseEvent/WebSphereIntegration Developer detaillevel
Payload informationpublished
FINE EMPTY None.
FINER DIGEST Payload description only.
FINEST FULL All of the payload.
The detail level is specified by PayloadType element which is part of the eventinstance data. The actual business object data is included in the event only if themonitor is set to record FULL/FINEST detail. The business object data itself isincluded in the Common Base Event under an xsd:any schema. You can see theprocess server business object payloads with the root element named wbi:event. Ifyou are publishing the event output to the logger, then you will see the outputwhen you view the log files. If the event is published to the CEI server, then youcan use the Common Base Event browser to view the event. You can then click thewbi:event link to view the business object data.
Business Process Choreographer eventsWebSphere Process Server incorporates the Business Process Choreographer servicecomponents for business processes and human tasks. The event points that can bemonitored in these components are described in this section.
WebSphere Process Server eventsWebSphere Process Server features its own service components, and each of thesecomponents has its own set of event points that can be monitored.
Service components contain one or more elements, which are sets of different stepsprocessed in each service component. In turn, each element has its own set ofevent natures, that are key points that are reached when processing a servicecomponent element. All service components, their elements and associated eventnatures, and the extended data elements unique to each event are listed.
Resource Adapter eventsThe event types available for the resource adapter component are listed.
The elements of the resource adapter component (base name eis:WBI.JCAAdapter)that can be monitored are listed here, along with their associated event natures,event names, and the extended data elements that are unique to each event.
Event Name Event Natures Event Contents Type
InboundEventRetrieval element
eis:WBI.JCAAdapter. InboundEventRetrieval.ENTRY
ENTRY
pollQuantity int
status int
eventTypeFilters string
eis:WBI.JCAAdapter. InboundEventRetrieval.EXIT
EXIT N/A
eis:WBI.JCAAdapter. InboundEventRetrieval.FAILURE
FAILURE FailureReason exception
Event catalog 45

Event Name Event Natures Event Contents Type
InboundEventDelivery element
eis:WBI.JCAAdapter.InboundEventDelivery.ENTRY
ENTRY N/A
eis:WBI.JCAAdapter.InboundEventDelivery.EXIT
EXIT N/A
eis:WBI.JCAAdapter.InboundEventDelivery.FAILURE
FAILURE FailureReason exception
Outbound element
eis:WBI.JCAAdapter. Outbound.ENTRY ENTRY N/A
eis:WBI.JCAAdapter. Outbound.EXIT EXIT N/A
eis:WBI.JCAAdapter. Outbound.FAILURE FAILURE FailureReason exception
InboundCallbackAsyncDeliverEvent element
eis:WBI.JCAAdapter.InboundCallbackAsyncDeliverEvent. ENTRY
ENTRY N/A
eis:WBI.JCAAdapter.InboundCallbackAsyncDeliverEvent. EXIT
EXIT N/A
eis:WBI.JCAAdapter.InboundCallbackAsyncDeliverEvent. FAILURE
FAILURE FailureReason exception
InboundCallbackSyncDeliverEvent element
eis:WBI.JCAAdapter.InboundCallbackSyncDeliverEvent. ENTRY
ENTRY N/A
eis:WBI.JCAAdapter.InboundCallbackSyncDeliverEvent. EXIT
EXIT N/A
eis:WBI.JCAAdapter.InboundCallbackSyncDeliverEvent. FAILURE
FAILURE FailureReason exception
Polling element
eis:WBI.JCAAdapter. Polling.STARTED STARTEDPollFrequency int
PollQuantity int
eis:WBI.JCAAdapter. Polling.STOPPED STOPPED N/A
Delivery element
eis:WBI.JCAAdapter. Delivery.EXIT EXIT N/A
eis:WBI.JCAAdapter. Delivery.FAILURE FAILUREEventID string
FailureReason exception
Retrieval element
eis:WBI.JCAAdapter. Retrieval.FAILURE FAILUREEventID string
FailureReason exception
Endpoint element
eis:WBI.JCAAdapter. Endpoint.FAILURE FAILURE FailureReason exception
Recovery element
eis:WBI.JCAAdapter. Recovery.EXIT EXIT N/A
eis:WBI.JCAAdapter. Recovery.FAILURE FAILURE FailureReason exception
EventFailure element
eis:WBI.JCAAdapter. EventFailure.FAILURE FAILURE FailureReason exception
46 Monitoring

Event Name Event Natures Event Contents Type
Connection element
eis:WBI.JCAAdapter. Connection.FAILURE FAILURE FailureReason exception
Business rule eventsThe event types available for the business rule component are listed.
The business rule component (base name br:WBI.BR) contains a single element thatcan be monitored. All event types for this element are listed here, with theirassociated event natures, event names, and the extended data elements that areunique to each event.
Event Name Event Nature Event Contents Type
br:WBI.BR.ENTRY ENTRY operationName string
br:WBI.BR.EXIT EXIT operationName string
br:WBI.BR.FAILURE FAILUREErrorReport Exception
operationName string
WBI.BR. br:SelectionKeyExtracted SelectionKeyExtracted operationName string
br:WBI.BR.TargetFound TargetFoundoperationName string
target string
Business state machine eventsThe event types available for the business state machine component are listed.
The elements from the business state machine component (base name bsm:WBI.BSM)that can be monitored are listed here, along with their associated event natures,event names, and all extended data elements that are unique to each event.
Event Name Event Nature Event Contents Type
StateMachineDefinition element
bsm:WBI.BSM. StateMachineDefinition.ALLOCATED
ALLOCATED instanceID string
bsm:WBI.BSM. StateMachineDefinition.RELEASED
RELEASED instanceID string
Transition element
bsm:WBI.BSM.Transition.ENTRY ENTRYinstanceID string
name string
bsm:WBI.BSM.Transition.EXIT EXITinstanceID string
name string
bsm:WBI.BSM.Transition.FAILURE FAILURE
ErrorReport Exception
instanceID string
name string
State element
bsm:WBI.BSM.State.ENTRY ENTRYinstanceID string
name string
Event catalog 47
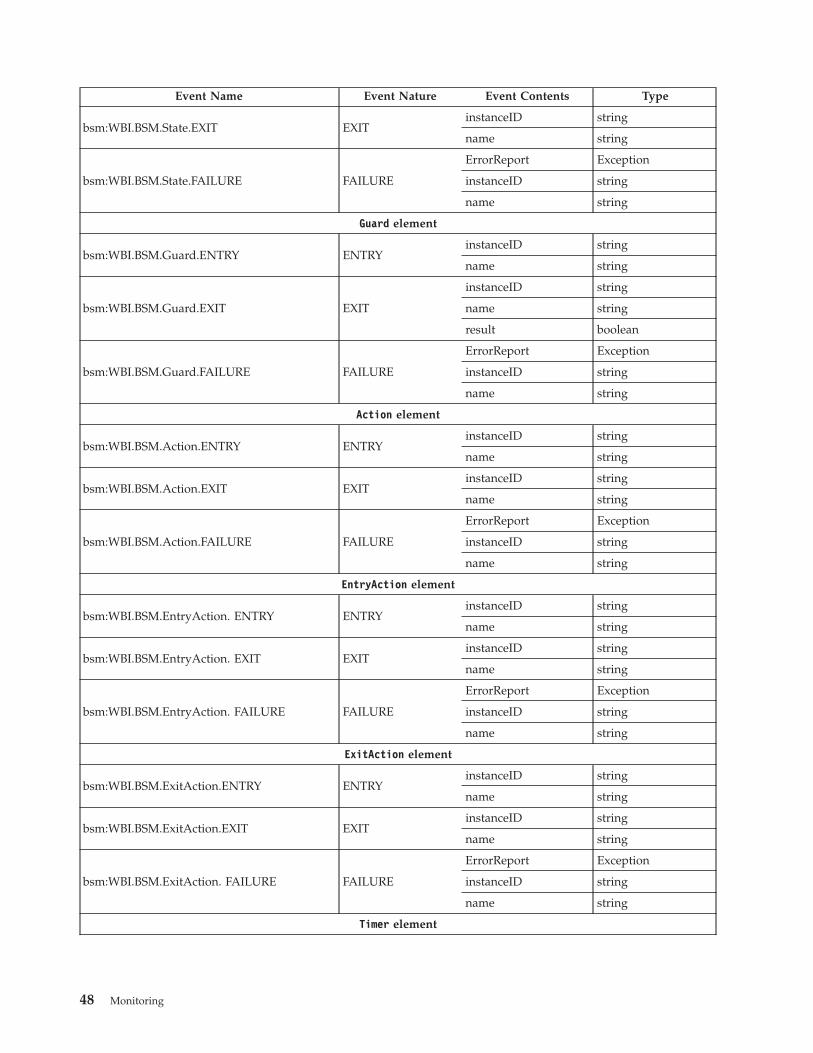
Event Name Event Nature Event Contents Type
bsm:WBI.BSM.State.EXIT EXITinstanceID string
name string
bsm:WBI.BSM.State.FAILURE FAILURE
ErrorReport Exception
instanceID string
name string
Guard element
bsm:WBI.BSM.Guard.ENTRY ENTRYinstanceID string
name string
bsm:WBI.BSM.Guard.EXIT EXIT
instanceID string
name string
result boolean
bsm:WBI.BSM.Guard.FAILURE FAILURE
ErrorReport Exception
instanceID string
name string
Action element
bsm:WBI.BSM.Action.ENTRY ENTRYinstanceID string
name string
bsm:WBI.BSM.Action.EXIT EXITinstanceID string
name string
bsm:WBI.BSM.Action.FAILURE FAILURE
ErrorReport Exception
instanceID string
name string
EntryAction element
bsm:WBI.BSM.EntryAction. ENTRY ENTRYinstanceID string
name string
bsm:WBI.BSM.EntryAction. EXIT EXITinstanceID string
name string
bsm:WBI.BSM.EntryAction. FAILURE FAILURE
ErrorReport Exception
instanceID string
name string
ExitAction element
bsm:WBI.BSM.ExitAction.ENTRY ENTRYinstanceID string
name string
bsm:WBI.BSM.ExitAction.EXIT EXITinstanceID string
name string
bsm:WBI.BSM.ExitAction. FAILURE FAILURE
ErrorReport Exception
instanceID string
name string
Timer element
48 Monitoring

Event Name Event Nature Event Contents Type
bsm:WBI.BSM.Timer.START START
instanceID string
name string
duration string
bsm:WBI.BSM.Timer.STOPPED STOPPED
instanceID string
name string
duration string
Map eventsThe event types available for the map component are listed.
The elements from the map component (base name map:WBI.MAP) that can bemonitored are listed here, along with their event natures, event names, and allextended data elements that are unique to each event.
Table 21. Base element
Event Name Event Nature Event Contents Type
map:WBI.MAP.ENTRY ENTRY N/A N/A
map:WBI.MAP.EXIT EXIT N/A N/A
map:WBI.MAP.FAILURE FAILURE FailureReason Exception
Transformation element
map:WBI.MAP.Transformation. ENTRY ENTRY N/A N/A
map:WBI.MAP.Transformation. EXIT EXIT N/A N/A
map:WBI.MAP.Transformation. FAILURE FAILURE FailureReason Exception
Mediation eventsThe event types available for the mediation component are listed.
The elements from the mediation component (base name ifm:WBI.MEDIATION) thatcan be monitored are listed here, along with their associated event natures, names,and all extended data elements that are unique to each event.
Event Name Event Nature Event Contents Type
OperationBinding element
ifm:WBI.MEDIATION. OperationBinding.ENTRY ENTRY
InteractionType string
TicketID string
Source string
Target string
ifm:WBI.MEDIATION. OperationBinding.EXIT EXIT
InteractionType string
TicketID string
Source string
Target string
Event catalog 49

Event Name Event Nature Event Contents Type
ifm:WBI.MEDIATION.OperationBinding.FAILURE
FAILURE
InteractionType string
TicketID string
Source string
Target string
ErrorReport Exception
ParameterMediation element
ifm:WBI.MEDIATION. ParameterMediation.ENTRY
ENTRYType string
TransformName string
WBI.MEDIATION. ParameterMediation. EXIT EXITType string
TransformName string
ifm:WBI.MEDIATION. ParameterMediation.FAILURE
FAILURE
Type string
TransformName string
ErrorReport Exception
Recovery eventsThe event types available for the recovery component are listed.
The recovery component (base name recovery:WBI.Recovery) contains a singleelement that can be monitored. All event types for this element are listed here,along with their associated event natures, event names, and the extended dataelements that are unique to each event.
Event Name Event Nature Event Contents Type
recovery:WBI.Recovery. FAILURE FAILURE
MsgId string
DestModuleName string
DestComponentName string
DestMethodName string
SourceModuleName string
SourceComponentName string
ResubmitDestination string
ExceptionDetails string
SessionId string
FailureTime dateTime
ExpirationTime dateTime
Status int
MessageBody byteArray
Deliverable boolean
recovery:WBI.Recovery. DEADLOOP DEADLOOP
DeadloopMsgId string
SIBusName string
QueueName string
Reason string
50 Monitoring

Event Name Event Nature Event Contents Type
recovery:WBI.Recovery. RESUBMIT RESUBMIT
MsgId string
OriginalMesId string
ResubmitCount int
Description string
recovery:WBI.Recovery. DELETE DELETE
MsgId string
deleteTime dateTime
Description string
Service Component Architecture eventsThe event types available for the Service Component Architecture are listed.
The Service Component Architecture (SCA) contains a single element, with a basename of sca:WBI.SCA.MethodInvocation. All the events and associated natures ofthis element are listed here, along with all extended data elements and that areunique to each event.
Note: Do not confuse these events with SCA-specific Application ResponseMeasurement (ARM) performance statistics.
Event Name Event Nature Event Contents Type
WBI.SCA. MethodInvocation. ENTRY ENTRY
SOURCE COMPONENT string
SOURCE INTERFACE string
SOURCE METHOD string
SOURCE MODULE string
SOURCE REFERENCE string
TARGET COMPONENT string
TARGET INTERFACE string
TARGET METHOD string
TARGET MODULE string
WBI.SCA. MethodInvocation. EXIT EXIT
SOURCE COMPONENT string
SOURCE INTERFACE string
SOURCE METHOD string
SOURCE MODULE string
SOURCE REFERENCE string
TARGET COMPONENT string
TARGET INTERFACE string
TARGET METHOD string
TARGET MODULE string
Event catalog 51

Event Name Event Nature Event Contents Type
WBI.SCA. MethodInvocation. FAILURE FAILURE
SOURCE COMPONENT string
SOURCE INTERFACE string
SOURCE METHOD string
SOURCE MODULE string
SOURCE REFERENCE string
TARGET COMPONENT string
TARGET INTERFACE string
TARGET METHOD string
TARGET MODULE string
Exception string
Selector eventsThe event types available for the Selector component are listed.
The selector component contains a single element that can be monitored. All eventtypes for this element are listed here, along with their associated event natures,event names, and the extended data elements that are unique to each event. Allselector events have a base name of sel:WBI.SEL.
Event Name Event Nature Event Contents Type
sel:WBI.SEL.ENTRY ENTRY operationName string
sel:WBI.SEL.EXIT EXIT operationName string
sel:WBI.SEL.FAILURE FAILUREErrorReport Exception
operationName string
sel:WBI.SEL. SelectionKeyExtracted SelectionKeyExtracted operationName string
sel:WBI.SEL.TargetFound TargetFoundoperationName string
target string
52 Monitoring

Event catalog 53

����
Printed in USA