
Monitoring the WASH-related SDG targets
58
Monitoring the WASH-related SDG targets MDG+ Initiative: High Level Meeting on the Water-related Sustainable Development Goals Amman, Jordan November 2, 2016 Rick Johnston [email protected]
Transcript of Monitoring the WASH-related SDG targets

Monitoring the WASH-related SDG targets
MDG+ Initiative: High Level Meeting on the
Water-related Sustainable Development Goals
Amman, Jordan November 2, 2016
Rick Johnston

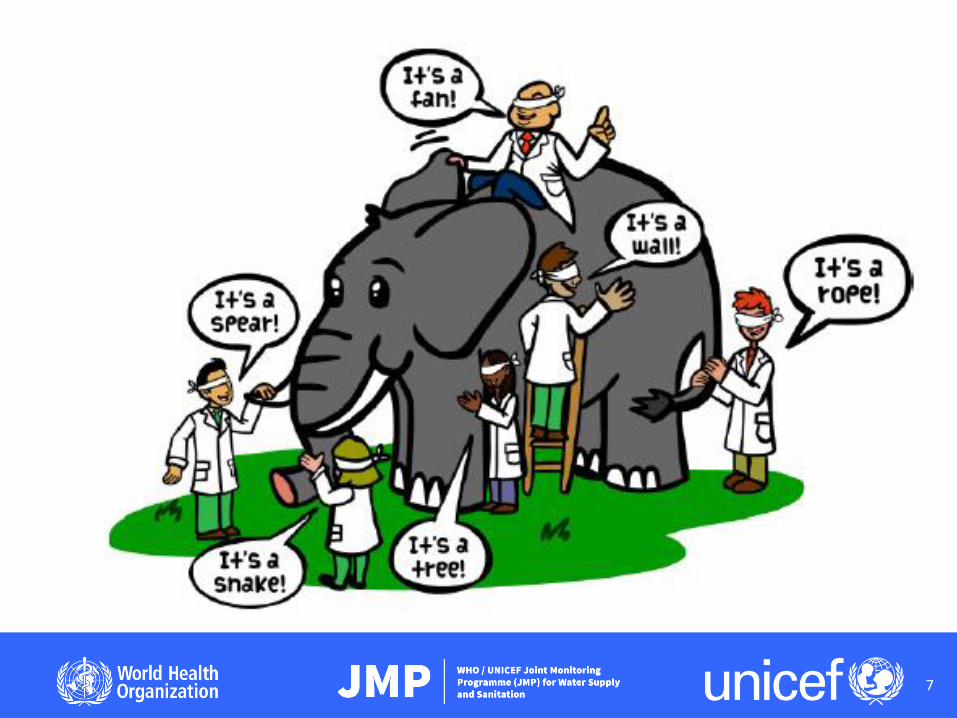
Elephants
2
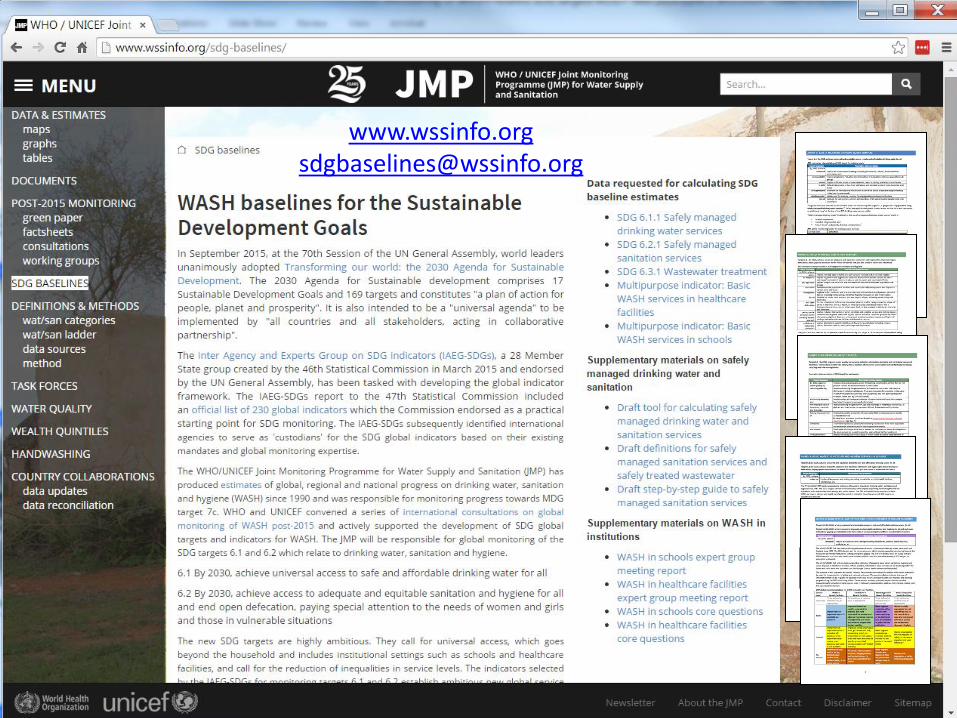
Water Supply in Palestine (urban)
• Accessibility
– 3210/3577 = 90% connected to supply network
– 37.7/3577 = 1% connected to public standpipe
3
Source: MDG+ report 2015

Water Supply in Palestine (urban)
• Availability
– 502/3577 = 14% continuous daily
– 2326/3577 = 65% 3-4 days weekly
4
Source: MDG+ report 2015
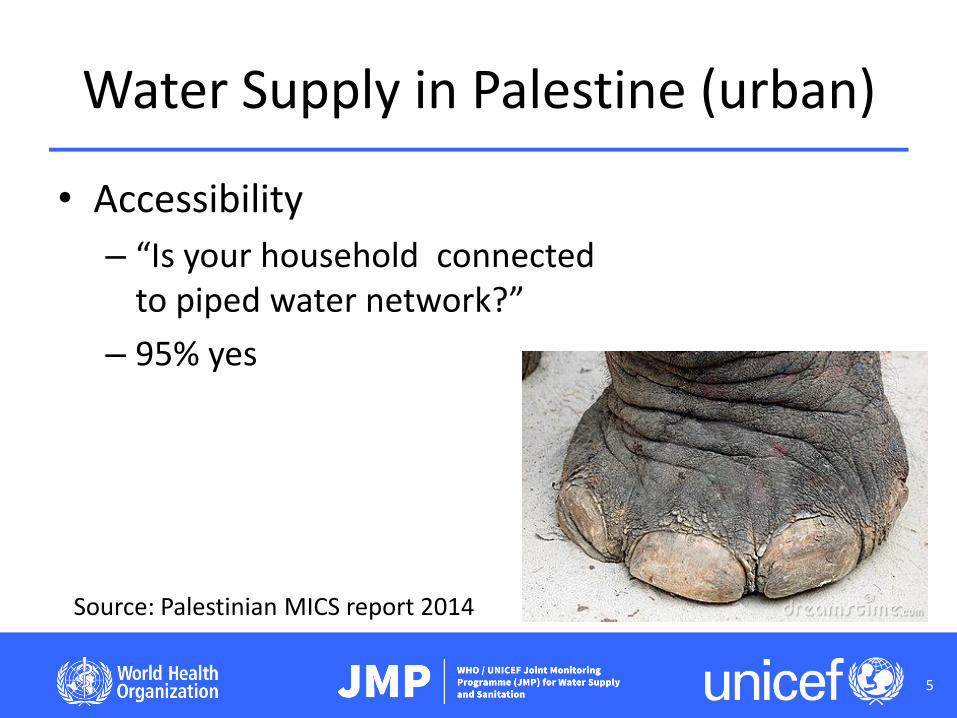
Water Supply in Palestine (urban)
• Accessibility
– “Is your household connected to piped water network?”
– 95% yes
5
Source: Palestinian MICS report 2014

Water Supply in Palestine (urban)
• Use
– “What is the main source of drinking water for members of your household?”
– 54% piped water
– 32% tanker truck
– 9% small cart
– 2% protected well
– 1% bottled water
6
Source: Palestinian MICS report 2014
7
8
Safely Managed Drinking Water Services
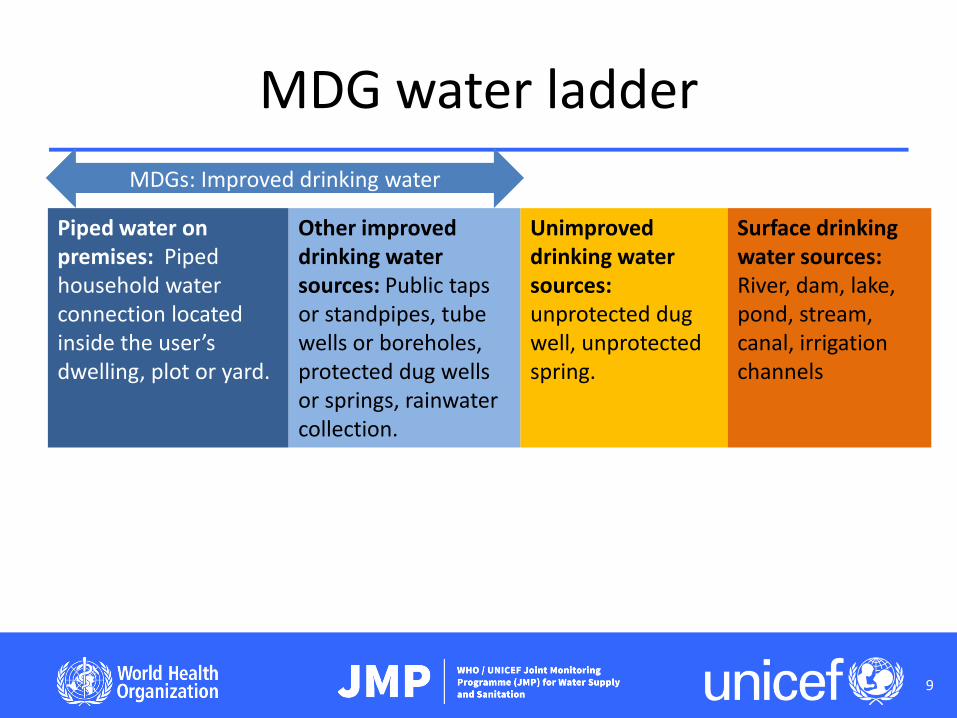
MDG water ladder
Piped water on premises: Piped household water connection located inside the user’s dwelling, plot or yard.
Other improved drinking water sources: Public taps or standpipes, tube wells or boreholes, protected dug wells or springs, rainwater collection.
Unimproved drinking water sources: unprotected dug well, unprotected spring.
Surface drinking water sources: River, dam, lake, pond, stream, canal, irrigation channels
9
MDGs: Improved drinking water
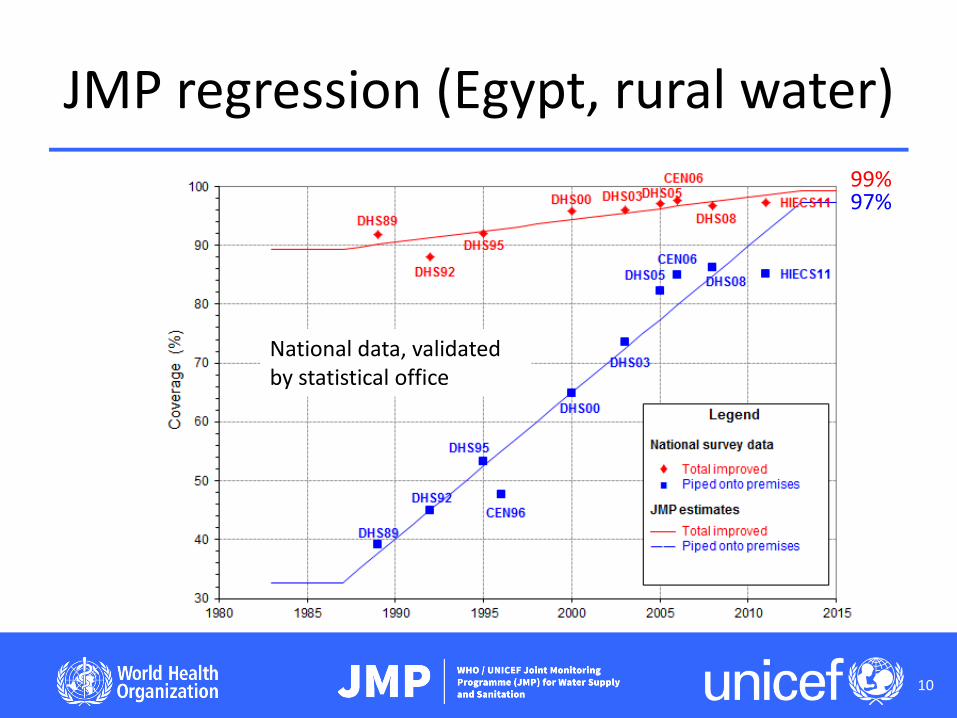
JMP regression (Egypt, rural water)
10
National data, validated by statistical office
99% 97%
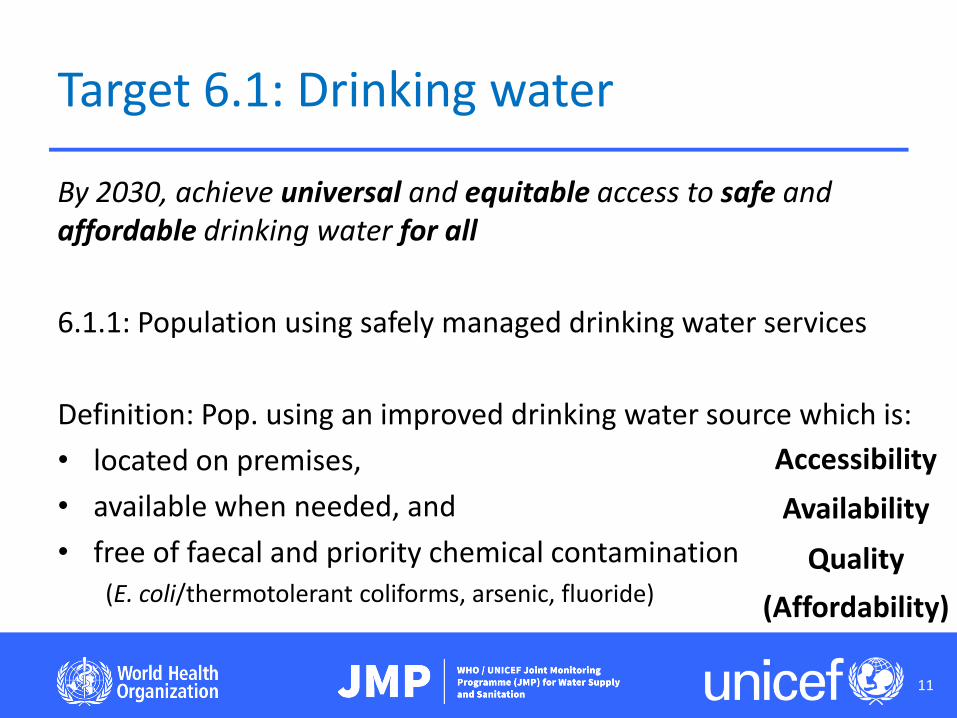
Target 6.1: Drinking water
By 2030, achieve universal and equitable access to safe and affordable drinking water for all
6.1.1: Population using safely managed drinking water services
Definition: Pop. using an improved drinking water source which is:
• located on premises,
• available when needed, and
• free of faecal and priority chemical contamination (E. coli/thermotolerant coliforms, arsenic, fluoride)
11
Accessibility
Quality
Availability
(Affordability)
12
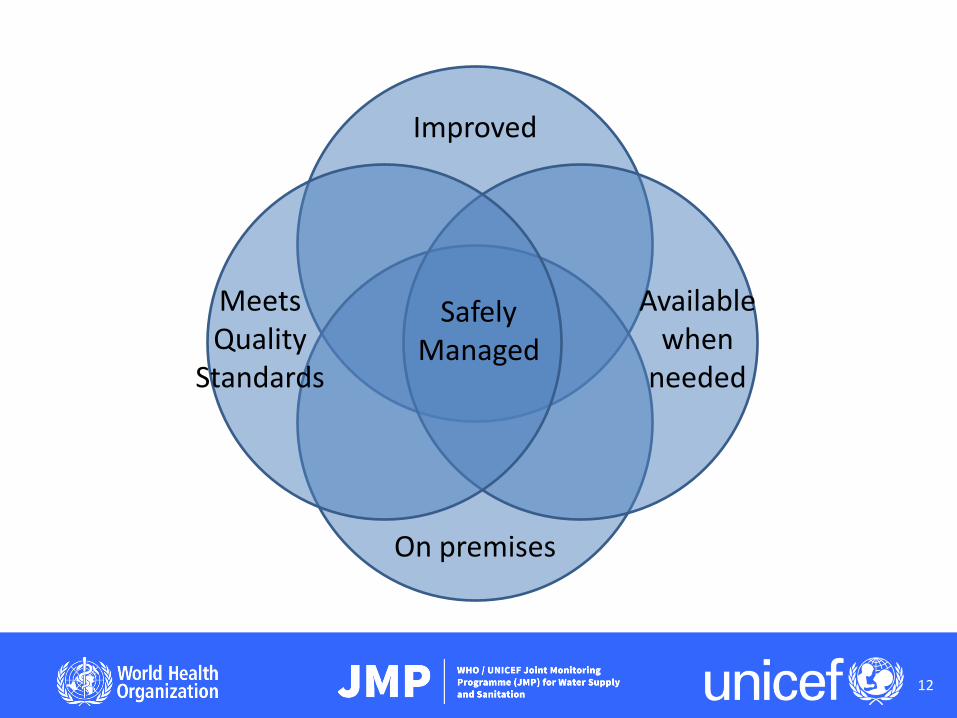
Improved
On premises
Available when
needed
Meets Quality
Standards
Safely Managed

MDG/SDG Service ladder Progressive realization
SDG 6.1
Safely managed drinking water
services
Improved source located on premises, available when needed, and free from contamination
Basic service Improved source within 30 minutes round trip collection time
Limited service Improved source over 30 minutes round trip collection time
Unimproved Unimproved source does not protect against contamination
No service Surface water 13
P
rog
res
siv
e R
ea
lis
ati
on

Data sources
Criterion Household Surveys Sectoral data
Accessibility Now: Travel time (or distance), is
the water supply on premises
Maximum distance/
travel time
Household connections
(piped supplies)
Availability Now: What people report using
New: In the last month, have you
been unable to get water from your
main drinking water source?
Coverage
Continuity (piped)
Hours of service
Days per week
Quality New: Water quality testing in
household surveys
Compliance with national
standards, WSPs
14

Definitions, standards, methods
• Definitions should be harmonized
– What is meant by…
• Fluoride in drinking water
• Litres per capita per day
• Hours of service
• Safely managed drinking water services
• Standards and targets should be contextual
• Methods can be different, but compatible
15

Accessibility (travel time)
• On premises (for safely managed indicator)
• Within 30 minutes (for basic indicator)
• Household surveys and censuses
– Available for most DHS and MICS countries
• “How long does it take to go there, get water, and come back?”
• Sector data
– Household connections
– Maximum distances
16

Algeria MICS 2012-13
17
93
3 4 0
81
8 10 1
On premises Within 30 min Over 30 min Don't know
Pro
po
rtio
n o
f p
op
ula
tio
n
Accessibility of improved drinking water sources
Urban
Rural

Availability
• Household surveys and censuses
– Introducing new questions
• Continuity (hours of service) of piped water supplies
• In the last month, have you been unable to get water from your main drinking water source?
• Sector data
– Continuity of piped supplies
– Different benchmarks and standards
• 24/7, 20 hours/day, 16 hours/day, 5 days/week
18

Jordan PFHS 2007
19
92 88
33 42
Urban Rural
Pro
po
rtio
n o
f p
op
ula
tio
n Is water normally
available all day? (YES)
In the last two weeks, was water unavailable for an entire day or longer? (NO)
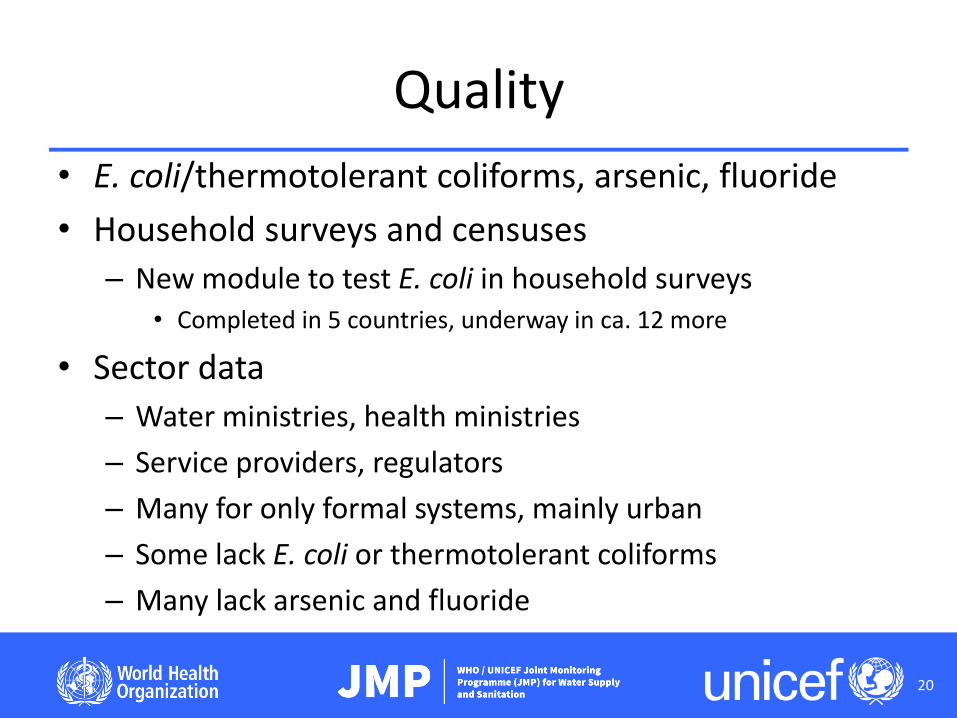
Quality
• E. coli/thermotolerant coliforms, arsenic, fluoride
• Household surveys and censuses
– New module to test E. coli in household surveys • Completed in 5 countries, underway in ca. 12 more
• Sector data
– Water ministries, health ministries
– Service providers, regulators
– Many for only formal systems, mainly urban
– Some lack E. coli or thermotolerant coliforms
– Many lack arsenic and fluoride
20

Lebanon Water Quality Survey, 2016
21

6 Domains
Total 2,770 HH E. coli, residual chlorine, turbidity, nitrate at point of collection, and point of consumption
Sampling methodology
Residences, 4 WE domains
Informal Settlements
Palestinian Camps

Lebanon Baseline for SDG 6, target 6.1
23
Population using improved water sources when needed: water is available in sufficient quantities when needed
Population using improved water sources on premises: distribution point within the HH dwelling, plot or yard
Population using safely
managed water
services
Population using improved water sources free of contamination: no fecal coliforms in drinking water supply at household
30/09/2016 - DRAFT

Lebanon Baseline for SDG 6, target 6.1
24
96%
Population using improved
water sources
Population using safely- managed drinking
water services
Pop
ula
tio
n %
Lebanon 2016
MDG 7C
SDG 6.1
30/09/2016 - DRAFT

Example of safely managed drinking water

Example of national target setting
Water supply
100% of population use improved drinking water
sources
95% use piped water supplies
Accessibility
100% use improved sources within 30
minutes
85% use water supplies on
premises
Availability
90% of population at 40+ litres per capita per day
Piped water supplies 18 hours
per day (large systems)
Piped water supplies 12 hours
per day (small systems)
Quality
100% of piped water supplies meet standards
for As, F
80% of piped water supplies meet
E. coli standards 95% of time
90% of supplies meet residual
chlorine targets
Water safety plans implemented in all
piped water supplies
Other
Reduce Non-Revenue Water in piped supplies to
25%
80% of households on piped supplies
are metered
Water bills should not exceed 3% of
GNI per capita
26
By 2030…
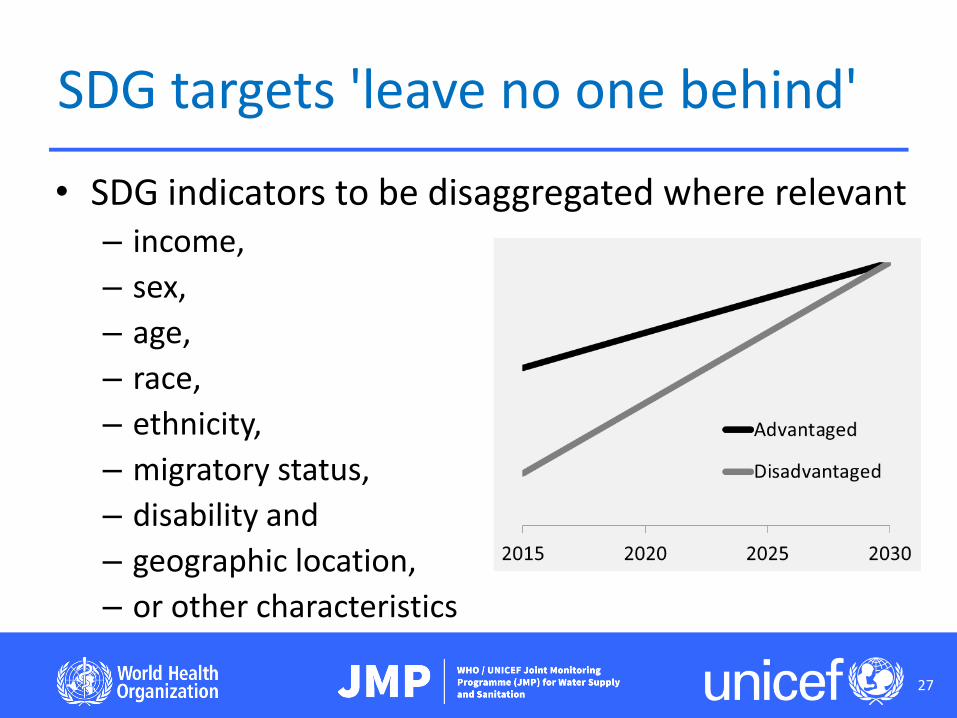
SDG targets 'leave no one behind'
• SDG indicators to be disaggregated where relevant – income,
– sex,
– age,
– race,
– ethnicity,
– migratory status,
– disability and
– geographic location,
– or other characteristics
27

Safely Managed Sanitation Services
28

Target 6.2: Sanitation and hygiene
By 2030, achieve access to adequate and equitable sanitation and hygiene for all, and end open defecation, paying special attention to the needs of women and girls and those in vulnerable situations
6.2.1: Population using safely managed sanitation services including a handwashing facility with soap and water
Definition: Pop. using an improved sanitation facility which is:
• not shared with other households and where
• excreta are safely disposed in situ or
• transported and treated off-site
29
Accessibility
Quality
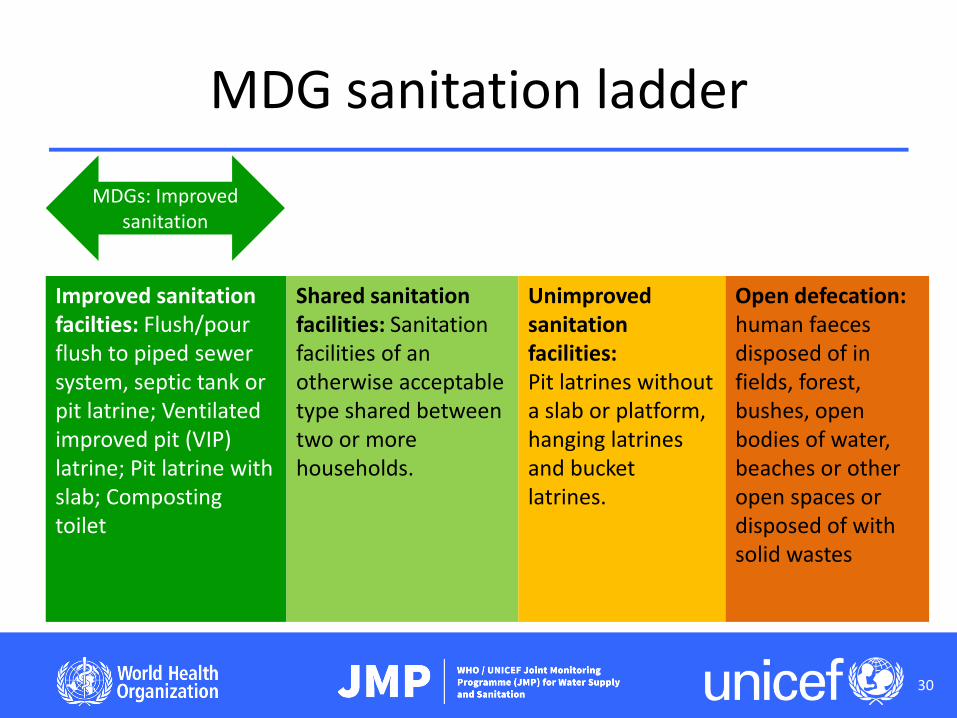
MDG sanitation ladder
Improved sanitation facilties: Flush/pour flush to piped sewer system, septic tank or pit latrine; Ventilated improved pit (VIP) latrine; Pit latrine with slab; Composting toilet
Shared sanitation facilities: Sanitation facilities of an otherwise acceptable type shared between two or more households.
Unimproved sanitation facilities: Pit latrines without a slab or platform, hanging latrines and bucket latrines.
Open defecation: human faeces disposed of in fields, forest, bushes, open bodies of water, beaches or other open spaces or disposed of with solid wastes
30
MDGs: Improved sanitation

31
Private
Improved facility
Pit latrine wastes safely
treated/disposed on/offsite
Septic tank wastes safely
treated/disposed on/offsite
Sewerage safely treated
offsite

32
Service ladder Progressive realization
SDG 6.2 Safely managed
sanitation services
Private improved facility where faecal wastes are safely disposed on site or transported and treated off-site
Basic service Private improved facility which separates excreta from human contact
Limited service Improved facility shared with other households
Unimproved Unimproved facility does not separate excreta from human contact
No service Open defecation P
rog
res
siv
e R
ea
lis
ati
on
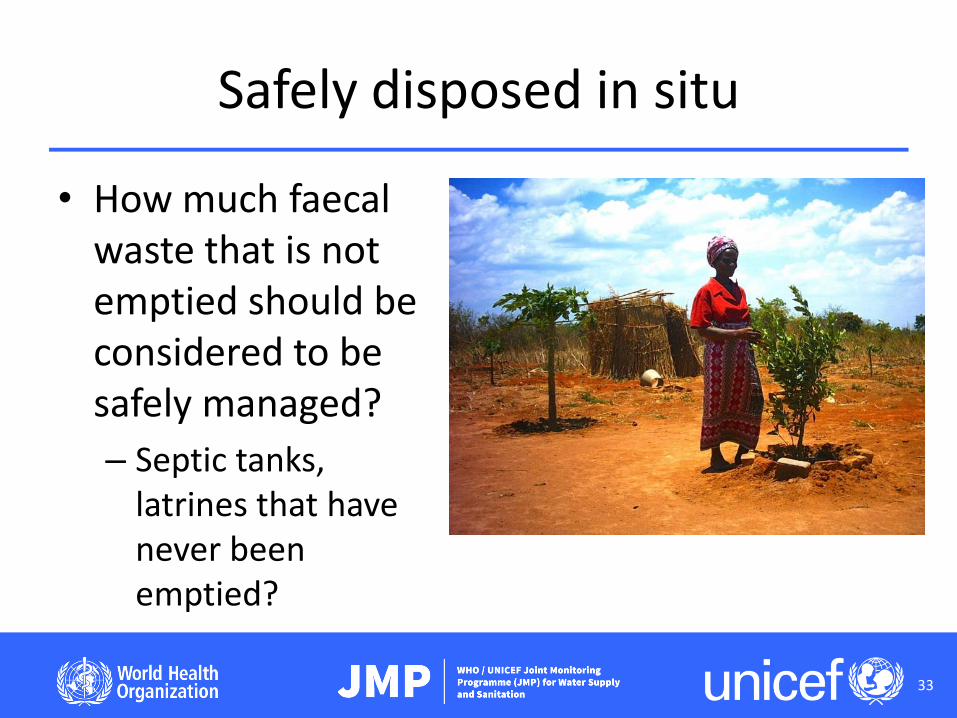
Safely disposed in situ
• How much faecal waste that is not emptied should be considered to be safely managed?
– Septic tanks, latrines that have never been emptied?
33
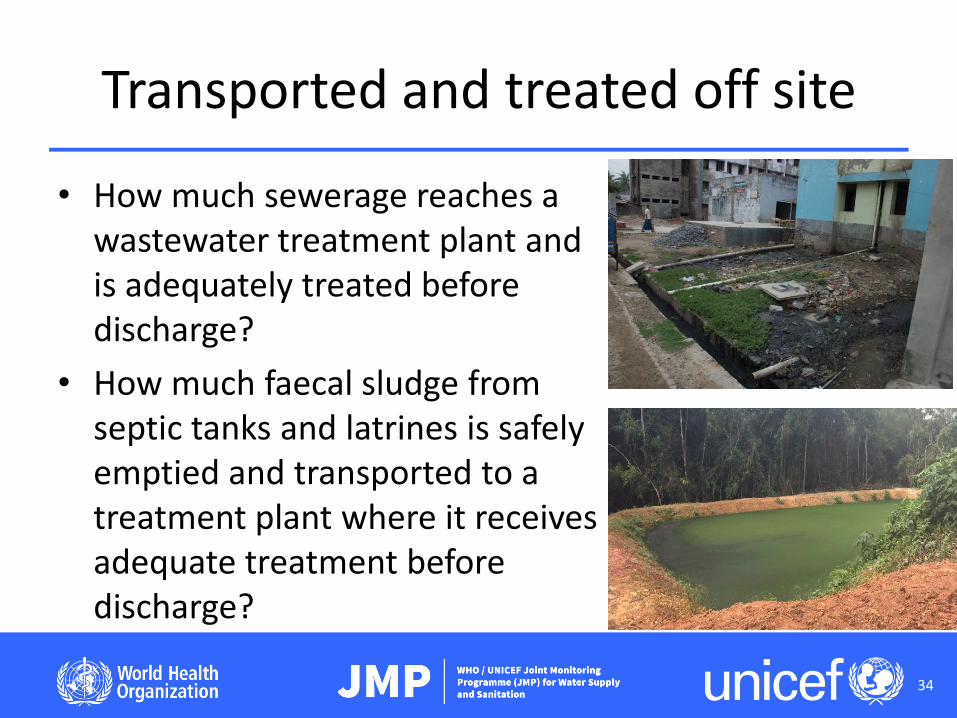
Transported and treated off site
• How much sewerage reaches a wastewater treatment plant and is adequately treated before discharge?
• How much faecal sludge from septic tanks and latrines is safely emptied and transported to a treatment plant where it receives adequate treatment before discharge?
34

35

36
Mass balance approach in 47 cities (BMGF)
0%
20%
40%
60%
80%
100%
Kh
uln
a P
hn
om
Pen
h
Srik
aku
lam
D
hak
a So
lap
ur
Dew
as
Tegu
clga
lpa
Nia
me
y B
ish
oft
u
Han
oi
Gw
alio
r H
ole
ta
Ko
chi /
Co
chin
A
xum
K
abu
l B
ahir
Dar
C
utt
ack
Dak
ar
Kis
um
u
Bu
rie
B
ign
on
a M
osh
i N
aku
ru
Dan
ang
Kam
pal
a D
ar e
s Sa
laam
M
anila
Li
ma
Map
uto
Ye
i A
izaw
l M
anag
ua
Kam
pal
a A
gra
Ku
mas
i Tu
mku
r D
elh
i B
ikan
er
San
ta C
ruz
Tiru
chir
app
alli
Du
rban
H
awas
sa
Tiru
pat
i N
on
thab
uri
N
ash
ik
Pal
u
Du
mag
uet
e
On-site: contained and composted On-site: treated at FSTP Sewer: treated

Example of Safely Managed Sanitation

38

6.3 Water quality
By 2030, improve water quality by reducing pollution, eliminating dumping and minimizing release of hazardous chemicals and materials, halving the proportion of untreated wastewater and substantially increasing recycling and safe reuse globally
6.3.1 Proportion of wastewater safely treated
• Domestic wastewater
– Sewerage, plus deliveries of sludge from onsite
• Hazardous industrial wastewater
– Pre-treatment
39

Links between Targets 6.2 and 6.3
• “Proportion of wastewater safely treated”
• Common elements
– Mass flow approach
• Differences
– 6.2 includes open defecation and on-site wastes
– 6.3 includes more on treatment and reuse
– 6.3 includes hazardous industrial wastes
40
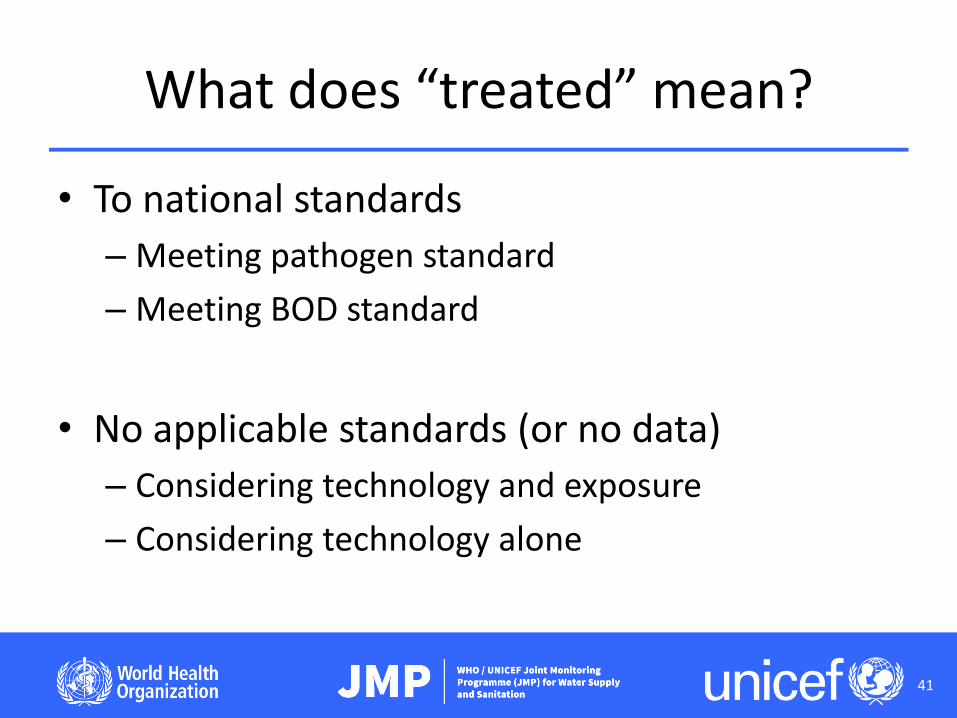
What does “treated” mean?
• To national standards
– Meeting pathogen standard
– Meeting BOD standard
• No applicable standards (or no data)
– Considering technology and exposure
– Considering technology alone
41

Treatment and exposures
42
Wastewater Treatment level
High exposure (reuse for food
production)
Medium exposure (disposal on land or
water bodies – not for food production)
Low exposure (long ocean outfall
or groundwater recharge)
Advanced treatment Safely treated Safely treated Safely treated
Tertiary treatment Safely treated1 Safely treated1 Safely treated
Secondary treatment Not safely treated Safely treated2 Safely treated
Primary treatment only Not safely treated Not safely treated Safely treated
Untreated discharge Not treated Not treated Not treated
1 – where only advanced N, P removal then classed as ‘ not safely treated’ 2 – where disposal is in proximity to bathing areas then classes as ‘ not safely treated’
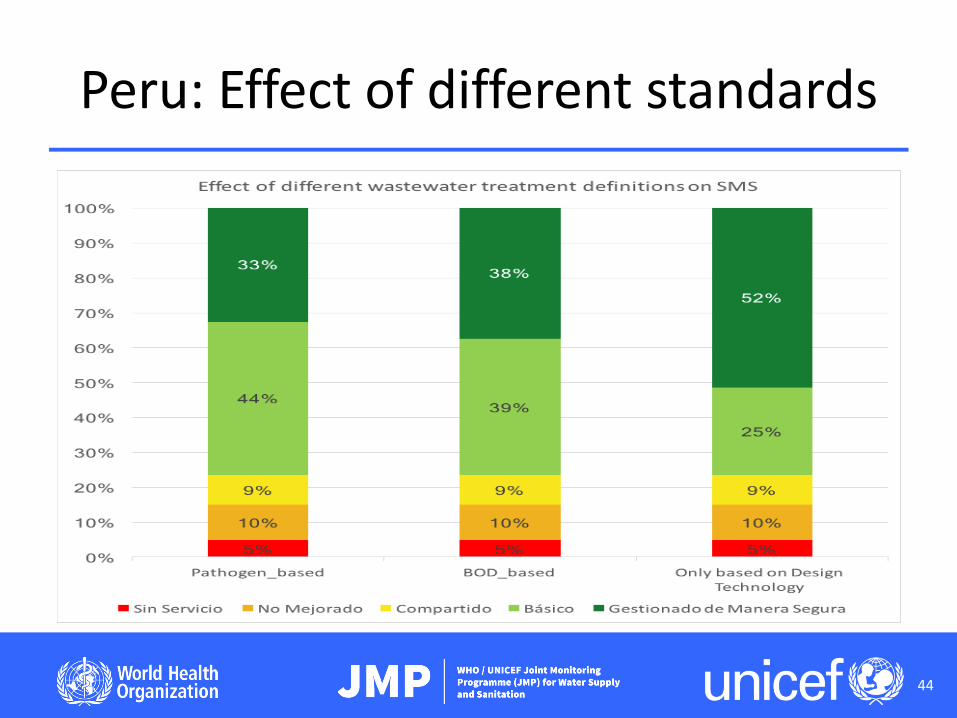
Peru: Effect of different standards
44
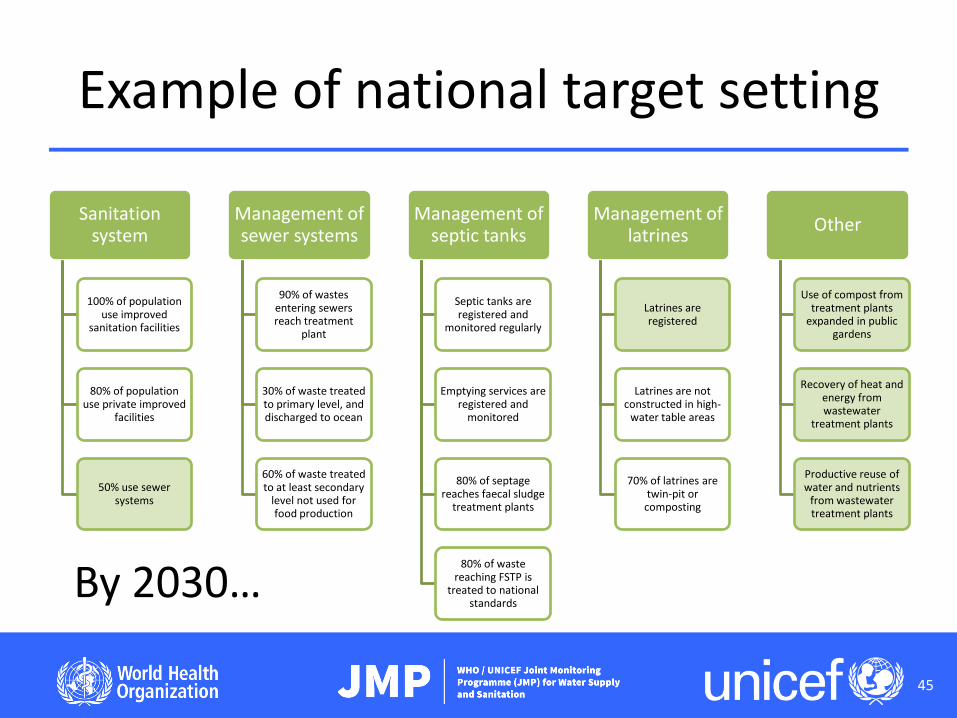
Example of national target setting
Sanitation system
100% of population use improved
sanitation facilities
80% of population use private improved
facilities
50% use sewer systems
Management of sewer systems
90% of wastes entering sewers reach treatment
plant
30% of waste treated to primary level, and discharged to ocean
60% of waste treated to at least secondary
level not used for food production
Management of septic tanks
Septic tanks are registered and
monitored regularly
Emptying services are registered and
monitored
80% of septage reaches faecal sludge
treatment plants
80% of waste reaching FSTP is
treated to national standards
Management of latrines
Latrines are registered
Latrines are not constructed in high-
water table areas
70% of latrines are twin-pit or
composting
Other
Use of compost from treatment plants
expanded in public gardens
Recovery of heat and energy from wastewater
treatment plants
Productive reuse of water and nutrients
from wastewater treatment plants
45
By 2030…

Handwashing facility with soap and water available
46
6.2.1: Population using safely managed sanitation services, including a handwashing facility with soap and water

JMP handwashing ladder
72
45
16
4 6
28
Handwashing facility
observed
Facility with water and soap
Facility with water only
Facility with soap only
Neither water or soap
No facility observed
Proportion of population with a handwashing facility, soap and water
Yemen DHS 2013
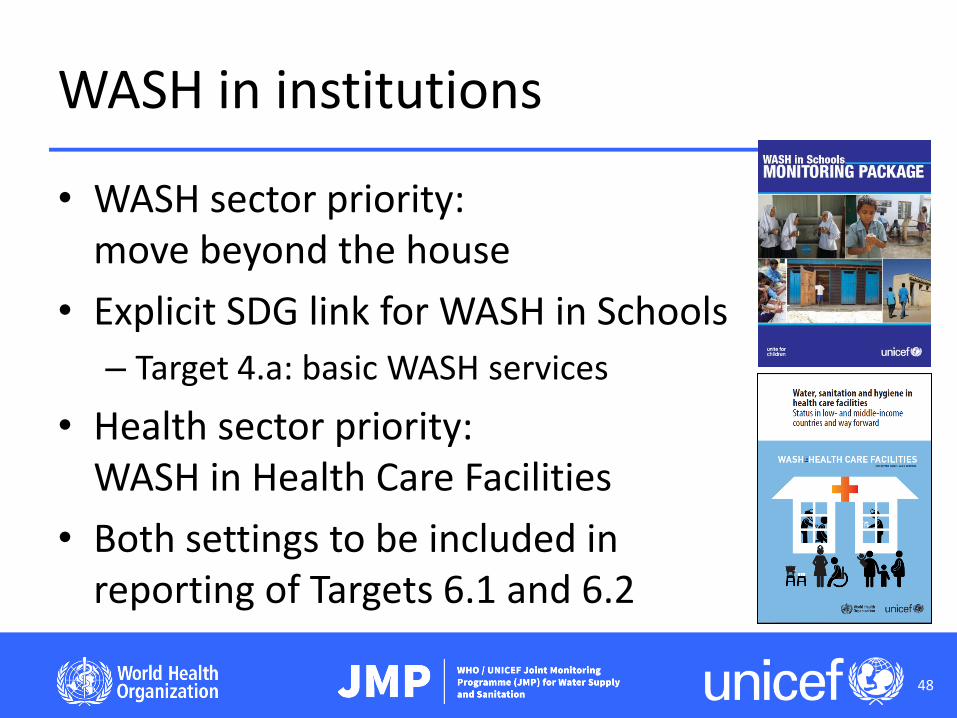
WASH in institutions
• WASH sector priority: move beyond the house
• Explicit SDG link for WASH in Schools
– Target 4.a: basic WASH services
• Health sector priority: WASH in Health Care Facilities
• Both settings to be included in reporting of Targets 6.1 and 6.2
48

SDG targets 'leave no one behind'
• SDG indicators to be disaggregated where relevant – income,
– sex,
– age,
– race,
– ethnicity,
– migratory status,
– disability and
– geographic location,
– or other characteristics
49

Timeline and next steps
• Data collection through end of 2016
– Data request to regional and country offices
• Data analysis through end of 2016
– Produce estimates and data completeness grades
• Country consultation on estimates, early 2017
• Publish 2017 baseline report, mid-2017
50

Extra slides
52
Target 6.a: International cooperation
By 2030, expand international cooperation and capacity-building support to developing countries in water- and sanitation-related activities and programmes, including water harvesting, desalination, water efficiency, wastewater treatment, recycling and reuse technologies
6.a.1: Amount of water and sanitation related Official Development Assistance that is part of a government coordinated spending plan
53

Target 6.b: Participation
Support and strengthen the participation of local communities in improving water and sanitation management
6.b.1: Percentage of local administrative units with established and operational policies and procedures for participation of local communities in water and sanitation management
54

Basic Services in Schools
Basic drinking water
Drinking water from an improved source is available at the school
Basic sanitation
Improved facilities, which are sex-separated and usable (accessible, functional, private) at the school
Basic handwashing
Handwashing facility with water and soap available to students

Basic Services in Health Care Facilities
Basic drinking water
Water from an improved source is available on premises
Basic sanitation
Improved sanitation facilities are available and usable, separated for patients and staff, separated for women and allowing menstrual hygiene management, and meeting the needs of people with limited mobility
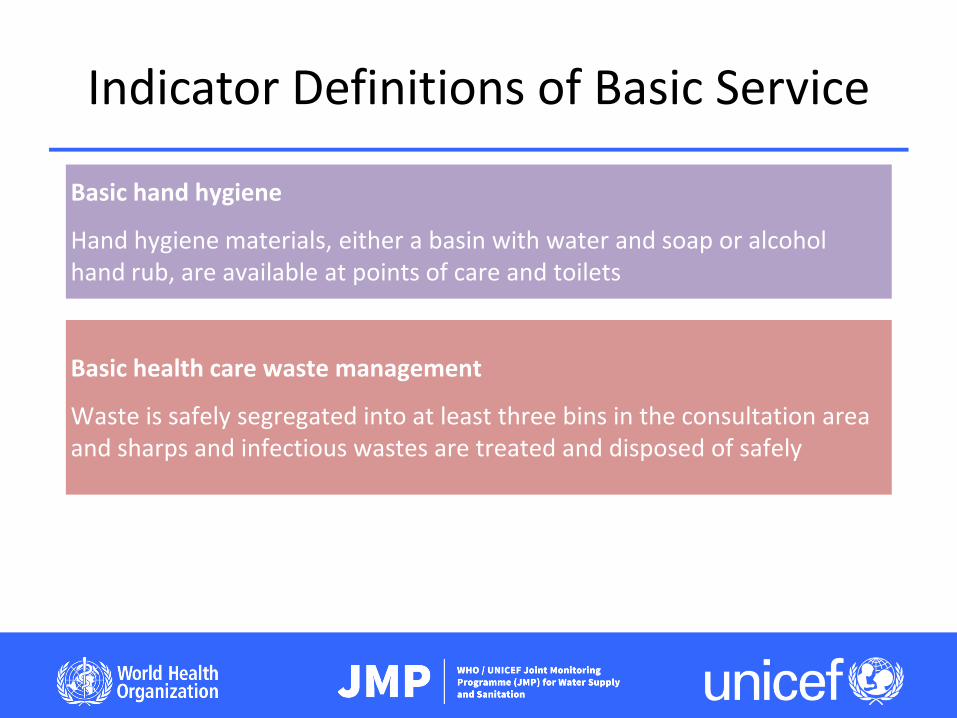
Indicator Definitions of Basic Service
Basic health care waste management
Waste is safely segregated into at least three bins in the consultation area and sharps and infectious wastes are treated and disposed of safely
Basic hand hygiene
Hand hygiene materials, either a basin with water and soap or alcohol hand rub, are available at points of care and toilets
58