Monitoring rock freezing and thawing by novel …sro.sussex.ac.uk/65769/1/Monitoring rock freezing...
33
Manuscript accepted in Journal of Geophysical Research – Earth Surface Monitoring rock freezing and thawing by novel geoelectrical and acoustic techniques 1 Julian B. Murton 1 , Oliver Kuras 2 , Michael Krautblatter 3 , Tim Cane 1 , Dominique 2 Tschofen 2 , Sebastian Uhlemann 2,4 , Sandra Schober 3 , Phil Watson 5,6 3 1 Permafrost Laboratory, Department of Geography, University of Sussex, Brighton, United 4 Kingdom. 5 2 Geophysical Tomography, British Geological Survey, Nottingham, United Kingdom. 6 3 Landslide Research, Technische Universität München, Munich, Germany. 7 4 Institute of Geophysics, ETH Zurich, Sonneggstrasse 5, 8092 Zurich, Switzerland 8 5 Sensor Technology Research Centre, Department of Engineering and Design, University of 9 Sussex, Brighton, United Kingdom 10 6 Apollo Fire Detectors Ltd, 36 Brookside Road, Havant PO9 1JR, United Kingdom 11 12 Corresponding author: Julian Murton ([email protected]) 13 14 Key Points: 15 Capacitive resistivity imaging (CRI) measures freezing and thawing in limestone 16 Microseismic events with characteristics typical of cracking of rock bridges were 17 detected during frost weathering experiments 18 CRI and microseismic techniques offer a viable route for long-term monitoring of freeze- 19 thaw and fracture in mountain rockwalls 20 21
Transcript of Monitoring rock freezing and thawing by novel …sro.sussex.ac.uk/65769/1/Monitoring rock freezing...

Manuscript accepted in Journal of Geophysical Research – Earth Surface
Monitoring rock freezing and thawing by novel geoelectrical and acoustic techniques 1
Julian B. Murton1, Oliver Kuras
2, Michael Krautblatter
3, Tim Cane
1, Dominique 2
Tschofen2, Sebastian Uhlemann
2,4, Sandra Schober
3, Phil Watson
5,6 3
1 Permafrost Laboratory, Department of Geography, University of Sussex, Brighton, United 4
Kingdom. 5
2 Geophysical Tomography, British Geological Survey, Nottingham, United Kingdom. 6
3 Landslide Research, Technische Universität München, Munich, Germany. 7
4 Institute of Geophysics, ETH Zurich, Sonneggstrasse 5, 8092 Zurich, Switzerland 8
5 Sensor Technology Research Centre, Department of Engineering and Design, University of 9
Sussex, Brighton, United Kingdom 10
6 Apollo Fire Detectors Ltd, 36 Brookside Road, Havant PO9 1JR, United Kingdom 11
12
Corresponding author: Julian Murton ([email protected]) 13
14
Key Points: 15
Capacitive resistivity imaging (CRI) measures freezing and thawing in limestone 16
Microseismic events with characteristics typical of cracking of rock bridges were 17
detected during frost weathering experiments 18
CRI and microseismic techniques offer a viable route for long-term monitoring of freeze-19
thaw and fracture in mountain rockwalls 20
21
Manuscript accepted in Journal of Geophysical Research – Earth Surface
Abstract 22
Automated monitoring of freeze-thaw cycles and fracture propagation in mountain rockwalls is 23
needed to provide early warning about rockfall hazards. Conventional geoelectrical methods 24
such as electrical resistivity tomography (ERT) are limited by large and variable ohmic contact 25
resistances, requiring galvanic coupling with metal electrodes inserted into holes drilled into 26
rock, and which can be loosened by rock weathering. We report a novel experimental 27
methodology that combined capacitive resistivity imaging (CRI), ERT and microseismic event 28
recording to monitor freeze-thaw of six blocks of hard and soft limestones under conditions 29
simulating an active layer above permafrost and seasonally frozen rock in a non-permafrost 30
environment. Our results demonstrate that the CRI method is highly sensitive to freeze-thaw 31
processes; it yields property information equivalent to that obtained with conventional ERT and 32
offers a viable route for non-galvanic long-term geoelectrical monitoring, extending the benefits 33
of the methodology to soft/hard rock environments. Contact impedances achieved with CRI are 34
less affected by seasonal temperature changes, the aggregate state of the pore water (liquid or 35
frozen), and the presence of low-porosity rock with high matrix resistivities than those achieved 36
with ERT. Microseismic monitoring has the advantage over acoustic emissions that events were 37
recorded in relevant field distances of meters to decameters from cracking events. For the first 38
time we recorded about 1000 microcracking events and clustered them in four groups according 39
to frequency and waveform. Compared to previous studies, mainly on ice-cracking in glaciers, 40
the groups are attributed to single- or multiple-stage cracking events such as crack coalescence. 41
42
1 Introduction 43
Understanding the impacts of freezing and thawing on bedrock properties is fundamental 44
to assessing the stability of mountain rockwalls. Remote monitoring of rockwall temperature and 45
related geotechnical parameters is an emerging research field for geomorphology and geohazard 46
mitigation. Geophysical tomography can contribute significantly to this field [Harris et al., 47
2009] by characterizing volumetric properties of rock masses over time without the limitations of 48
point sampling in boreholes. Both electrical and acoustic methods hold promise for long-term 49
automated monitoring, but their systematic application to mountain permafrost is still rare, partly 50
because sensor performance under repeated freeze-thaw conditions remains poorly understood. 51
Although temperature-calibrated electrical resistivity tomography (ERT) with galvanic sensors 52
can image movements of freezing fronts in rock [Krautblatter and Hauck, 2007; Krautblatter et 53
al., 2010], conventional geoelectrical methodology imposes practical limitations. The technique 54
relies on galvanically-coupled electrodes, which must be physically implanted into a substrate 55
[Loke et al., 2013]. For permafrost applications, this may lead to substantial magnitudes and 56
variations in ohmic contact resistances between sensors and the host rock or soil as it freezes and 57
thaws [Krautblatter et al., 2010]. This introduces noise and can render individual sensors or 58
indeed entire arrays unusable during the freezing periods, thus making quantitative interpretation 59
of geoelectrical monitoring data challenging. Geoelectrical interpretation is complicated further 60
where frost weathering leads to fracture and other changes in the physical properties of the rock. 61
By contrast, strategic long-term thermal and geotechnical monitoring demands stable and 62
predictable sensor properties and minimal bias of monitoring data due to the sensors themselves. 63
This paper reports a novel experimental design combining capacitively coupled resistivity 64
sensors, conventional galvanic electrode arrays and microseismic transducers to monitor non-65

Manuscript accepted in Journal of Geophysical Research – Earth Surface
invasively the dynamics of freezing and thawing of moist rock subject to varying degrees of frost 66
weathering. The capacitive methodology, referred to as capacitive resistivity imaging (CRI), uses 67
low-frequency impedance measurements across permanently installed multi-sensor arrays [Kuras 68
et al., 2006], emulating the well-established ERT methodology, but removing the need for 69
galvanic contact between the sensors and frozen soils or rocks. 70
We applied a monitoring strategy based on geoelectrical tomography to controlled 71
laboratory experiments simulating permafrost growth, persistence and thaw in bedrock. Frost 72
weathering was monitored by measuring heave and microseismic activity, and by visually 73
observing macrocracks. Our objectives are to explain and present results about rock fracture, 74
geoelectrical monitoring and microseismic events and to evaluate the performance of CRI beside 75
conventional ERT. 76
77
2 Materials and methods 78
2.1 Monitoring strategy 79
Our monitoring strategy relied on instrumenting multiple rock samples with geoelectrical 80
sensor arrays in order to compare the relative merits of the ERT and CRI techniques in different 81
settings. This allowed us to assess the influence of rock type, freezing regime, weathering status 82
and the performance of different cross-sample sensor geometries. Experimental control was 83
provided by simultaneous and continuous measurement of vertical rock temperature profiles, 84
surface heave and settlement, and liquid water content in all rock samples, except where there 85
was a risk of the simultaneous measurements interfering with each other or with the geophysical 86
monitoring. The experiments were carried out in the cold room of the Permafrost Laboratory at 87
the University of Sussex. This facility is designed for the physical modelling of permafrost 88
conditions in rock or soil by simulating the effect of different natural freezing regimes. 89
2.2 Rock types and sample preparation 90
The rock types used were tuffeau and Wetterstein Limestone. The tuffeau is a siliceous 91
and texturally uniform chalk of Upper Cretaceous (Turonian) age, commonly used as a building 92
stone in France. It was selected because it is frost-susceptible and therefore prone to 93
macrocracking [Murton et al., 2001, 2006], allowing us to evaluate its geoelectrical and 94
microseismic response as crack networks evolved. Its physical properties are detailed in Murton 95
et al. [2000]. Its porosity measured under vacuum is about 47%. The compressive strength varies 96
from 0.53 to 9.24 MPa, and tensile strength from 0.07 to 1.07 MPa. Four samples of tuffeau were 97
obtained from the Lucet limestone quarries, L'Epinay Brézé, near Saumur, in the Loire Valley, 98
France. Prior to the experiments the samples lacked visible evidence of macroscopic cracks or 99
other forms of weathering (Figure 1a). 100

Manuscript accepted in Journal of Geophysical Research – Earth Surface
101
Figure 1. Instrumented blocks resting on water-saturated gravel prior to initial freezing. (a) 102
Block 1 (tuffeau) wetted through by capillary rise. No macroscopic cracks are visible. (b) Block 103
2 (Wetterstein Limestone), with irregular wetting front extending along cracks near base of 104
block. (c) Blocks 4 to 6 within tank 2 (seasonal freezing). CRI plate sensors are installed on the 105
sides of block 5, and ERT galvanic electrodes in the sides of blocks 4 and 6. 106

Manuscript accepted in Journal of Geophysical Research – Earth Surface
The Wetterstein Limestone is a relatively uniform and isotropic fine-grained (algal) 107
limestone deposited in lagoonal back-reef conditions during the Middle Triassic (Ladinian). It 108
represents a very tough Alpine limestone and forms rock faces such as the Zugspitze North Face, 109
some more than 1000 m high. The Wetterstein Limestone was selected because it represents the 110
natural fractured bedrock on which a CRI system might be applied in the field. Wetterstein 111
Limestone has also been the host rock for temperature-calibrated permafrost ERT field 112
measurements at the Zugspitze summit [Krautblatter et al., 2010]. Previous laboratory testing of 113
similar limestone at the sample location yielded a porosity of 1.31±0.22 % and a permeability of 114
4.48±0.11 μD, with calcite contents of 99% or more [Krautblatter, 2009]. Two samples were cut 115
from a representative and relatively intact, unweathered boulder (about 1 m³) collected at the foot 116
of the Zugspitze North Face. The samples contained macroscopic fractures (Figure 1b). 117
The rock samples were sawn into six rectangular blocks measuring 300 300 mm wide 118
and 450 mm high, a size sufficiently large to monitor freezing and thawing and simulate almost 119
at field scale rock fracture by ice segregation [Murton et al., 2001, 2006]. Blocks 1, 3, 4 and 5 120
comprised tuffeau, and blocks 2 and 6 Wetterstein Limestone. All were air dried under ambient 121
laboratory conditions for several months. 122
The tuffeau blocks, once dry, were drilled prior to inserting sensors into them. Drill holes 123
were 4 mm in diameter and 50 mm long for temperature sensors, 3 mm in diameter and 150 mm 124
long for liquid water sensors, and 4 mm in diameter and 10 mm long for ERT galvanic 125
electrodes. The location and number of holes for the blocks are shown in Figure 2. CRI sensor 126
arrays made from copper foil were attached to transparent cellulose acetate film sheets (cut to 127
cover approximately 80% of the sample faces) and mounted onto the rock surface using spray 128
adhesive. This was done for the sides of blocks 3, 5 and 6 (Figures 1c and 3), which were then 129
wrapped in low-density polyethylene (‘cling film’) to protect the CRI sensor arrays and to 130
minimise lateral movements of water into or out of the blocks. The temperature and water 131
sensors were inserted into the blocks, grouting the interior ends of the holes with drill cuttings 132
(chalk powder) and sealing their exterior ends with a vinyl-based filler containing calcite 133
(‘Polyfilla’). Stainless steel M5 machine screws were used as galvanic electrodes; these were 134
dipped into conductive contact grease and screwed into the pre-drilled holes so as to establish 135
and maintain good galvanic contact with the rock matrix. 136

Manuscript accepted in Journal of Geophysical Research – Earth Surface
137
Figure 2. Vertical view of sensor locations for measuring heave (by LVDTs), temperature (by 138
Pt100s) and volumetric unfrozen water content (by TDR). 139
Manuscript accepted in Journal of Geophysical Research – Earth Surface
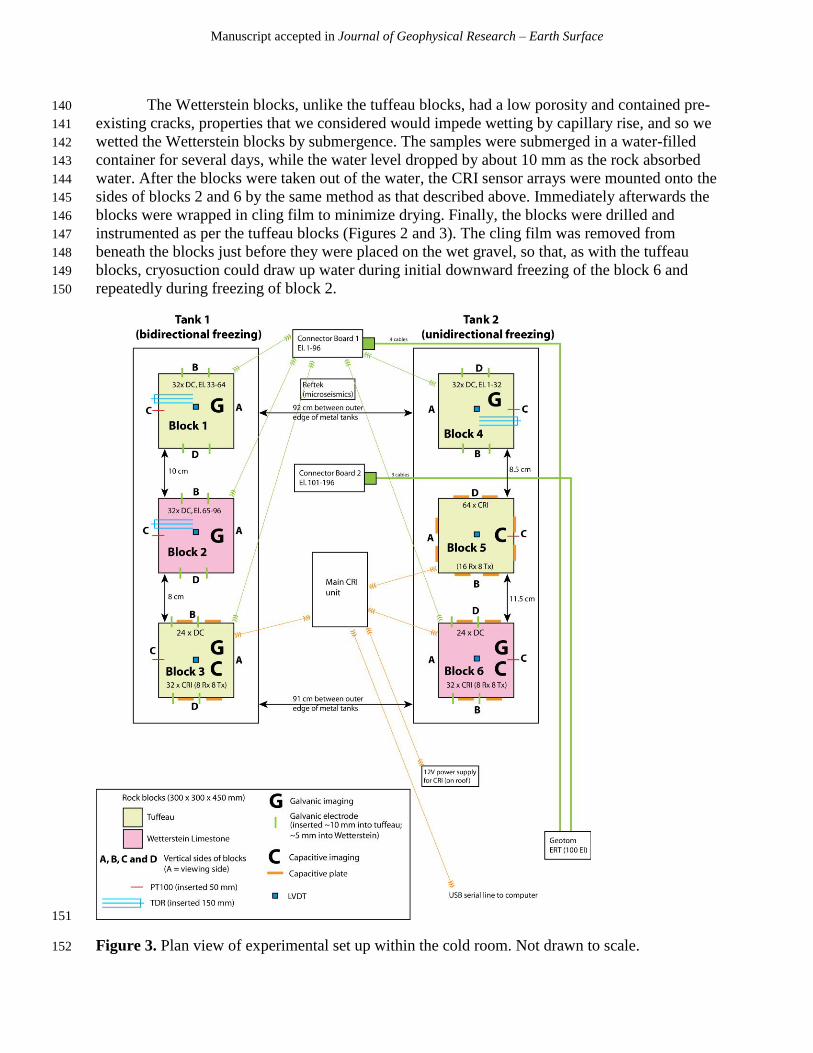
The Wetterstein blocks, unlike the tuffeau blocks, had a low porosity and contained pre-140
existing cracks, properties that we considered would impede wetting by capillary rise, and so we 141
wetted the Wetterstein blocks by submergence. The samples were submerged in a water-filled 142
container for several days, while the water level dropped by about 10 mm as the rock absorbed 143
water. After the blocks were taken out of the water, the CRI sensor arrays were mounted onto the 144
sides of blocks 2 and 6 by the same method as that described above. Immediately afterwards the 145
blocks were wrapped in cling film to minimize drying. Finally, the blocks were drilled and 146
instrumented as per the tuffeau blocks (Figures 2 and 3). The cling film was removed from 147
beneath the blocks just before they were placed on the wet gravel, so that, as with the tuffeau 148
blocks, cryosuction could draw up water during initial downward freezing of the block 6 and 149
repeatedly during freezing of block 2. 150
151
Figure 3. Plan view of experimental set up within the cold room. Not drawn to scale. 152

Manuscript accepted in Journal of Geophysical Research – Earth Surface
2.3 Freezing system 153
The freezing system in the cold room used two aluminium tanks, each with an internal 154
length, width and height of 1895 750 500 mm, respectively (Figures 1c and 3). Tank 1 155
contained blocks 1 to 3 and experienced bidirectional freezing and unidirectional thawing to 156
simulate an active layer above near-surface permafrost. Downward freezing resulted from chilled 157
air circulating the cold room, and upward freezing resulted from a thermostatically-controlled 158
eutectic cooling plate (manufactured by FIC, model EFR 1570) measuring 1490 mm long, 690 159
mm wide and 53 mm high, beneath the tank. Downward thawing occurred under ambient air 160
temperature in the cold room, when the inflow of chilled air ceased and warm air entered from 161
the surrounding laboratory. The space between the blocks and the tank walls was insulated with 162
expanded polystyrene and expanding polyurethane foam to minimise lateral heat transfer during 163
the experiment (Figure 1). Tank 2 contained blocks 4 to 6, which froze and thawed completely 164
during each freeze-thaw cycle in order to simulate seasonal freezing and thawing in the absence 165
of permafrost. The cooling plate beneath the tank was insulated to limit upward freezing; but 166
some upward freezing did occur (Section 3.1). Thawing was bidirectional (upward and 167
downward), simulating natural thawing of seasonally frozen ground. 168
Both tanks contained a horizontal layer of fine gravel, about 100 mm thick, above their 169
base. The gravel contained serpentine copper pipe through which water could circulate to wet, 170
warm or drain the gravel. The six blocks were placed on hard plastic feet that extended through 171
the gravel to keep the blocks stable. Then water entered the gravel through the serpentine pipe, 172
until the water table was 10–30 mm above the top of the gravel and the bottom of the blocks 173
resting on the gravel surface. Capillary rise wetted the four tuffeau blocks within 3 days, and the 174
rising wetting front in blocks 4 and 5 is shown in Figure 1c. 175
All six blocks initially froze from the surface downward. Thereafter, basal cooling from 176
the plate beneath tank 1 maintained permafrost in the lower part of blocks 1 to 3 during most of 177
the experiment, while the upper part of the blocks experienced bidirectional freezing, downward 178
from the top and upward from the permafrost table. By contrast, blocks 4 to 6 thawed and froze 179
completely during each cycle. The experiment lasted for 859 days, during which 28 freeze-thaw 180
cycles were monitored, prior to freezing of the blocks at the end of the experiment. Each cycle 181
consisted of a freezing period (with air temperatures <0°C) and a thawing period (air 182
temperatures >0°C). Freezing periods varied in duration between 2.16 and 40.10 days, and 183
thawing periods between 1.91 and 108.80 days. Freezing periods and thawing periods varied in 184
duration to test the influence of cycles of different length. In addition, malfunction of the basal 185
cooling plate resulted in some extended periods of freezing and thawing. Active-layer 186
thicknesses (ALTs) in blocks 1 to 3 were obtained by linear interpolation between temperature 187
measurements to determine the maximum depth of penetration of the 0°C isotherm during 188
thawing periods. A few of the ALT values are approximate due to gaps in data acquisition. 189
Macrocracks visible in the outer sides of the blocks were photographed and measured. The 190
blocks were then left to thaw before being encased in fibreglass, to protect them during handling, 191
and then sawn vertically in half with a circular diamond saw to reveal macrocracks visible in an 192
internal face. 193
194

Manuscript accepted in Journal of Geophysical Research – Earth Surface
2.4 Geophysical instrumentation and data acquisition protocol 195
2.4.1 Capacitive sensors and CRI instrumentation 196
Our use of capacitive sensors introduces a new technology concept for the non-invasive 197
volumetric geophysical imaging and routine temporal monitoring of hard rock materials and 198
engineered structures. In a recent numerical simulation study [Uhlemann and Kuras, 2014], we 199
demonstrated the feasibility of making multi-sensor CRI measurements for the 3D imaging of 200
cuboidal rock samples at laboratory scale. The fundamental theory of capacitively coupled 201
resistivity measurements is described by Kuras et al. [2006]. For the present laboratory 202
experiment, we used prototype multi-sensor CRI instrumentation developed at the British 203
Geological Survey (BGS), which can address a total of 128 sensors and allows the automatic 204
selection of quadrupoles comprising two current injection sensors and two potential 205
measurement sensors out of a set of 64 for each sensor type. Measurements of the complex 206
transfer impedance can be scheduled according to a pre-defined protocol (sequence of 207
quadrupoles), thus allowing the automated and routine acquisition of resistivity datasets. A 208
quasi-static estimate of the apparent resistivity 𝜌𝑎 is extracted by evaluating the in-phase 209
component of the transfer impedance [Kuras et al., 2006] 210
𝜌𝑎 ≈Re 𝑈
𝐼× 𝐾𝑑𝑐
where Re denotes the real part (in-phase component), 𝐼 is the injected current, U is the observed 211
potential and Kdc
is the DC geometric factor. 212
We instrumented the rock samples with capacitive sensors made from 50 × 50 mm 213
squares of dead soft copper foil backing (3M 1181 Tape), arranged in vertical columns of eight 214
sensors each with a mutual spacing of 5 mm (55 mm separation between square centres), with 215
two columns placed side-by-side (100 mm separation between column centres) on opposite sides 216
of the sample (Figure 1c). The total thickness of the copper foil sensors including the adhesive 217
layer was 66 µm. Blocks 3 and 6 were instrumented on two opposing faces only (32 sensors 218
each, which gave 8 current and 8 potential dipoles), whereas block 5 was instrumented on all 219
four faces (64 sensors, which gave 16 current and 16 potential dipoles) (Figure 3). 220
These capacitive sensor arrays were used to collect bipole-bipole impedance data on the 221
three instrumented blocks consecutively. Data acquisition was scheduled three times over a 24 h 222
period, leaving at least 6 h intervals between successive acquisition events (Table 1). Only cross-223
sample array styles were used in accordance with Uhlemann and Kuras [2014], and a transmitter 224
frequency of 15 kHz was employed. A total of 344 impedance measurements each were made on 225
blocks 3 and 6, whilst 688 measurements were made on block 5. 226
2.4.2 Galvanic sensors and ERT instrumentation 227
Conventional ERT monitoring using DC resistivity measurements with galvanically 228
coupled sensors was carried out alternately with the capacitive measurements described above. 229
We used a multi-electrode multi-channel resistivity meter (Geotom MK4E200 manufactured by 230
GEOLOG 2000, Germany), which is capable of making stable resistance measurements in highly 231
resistive environments using relatively low input power and very small transmitter currents 232
(minimum of 0.1 µA). 233
Manuscript accepted in Journal of Geophysical Research – Earth Surface
The geometry of the electrode arrays mirrored that of the capacitive sensors. ERT 234
electrodes were arranged 55 mm apart in vertical columns of 8 electrodes each, two columns 235
being placed 100 mm apart on opposing faces of the samples (Figure 1c). Blocks 1, 2, 3, 4 and 6 236
had ERT electrodes on two opposing faces only (32 electrodes each); block 5 did not have any 237
ERT electrodes (Figure 3). On blocks 3 and 6 the ERT electrodes were interspersed with the 238
capacitive sensors by laterally offsetting the ERT electrode columns to fit into the available 239
space on the vertical sample faces. 240
Measurements on the ERT sensor arrays were essentially analogous to those made with 241
the capacitive technique. However, the design of the Geotom resistivity meter allowed automated 242
collection of reciprocal resistance data, where current and potential dipoles are swapped and the 243
measurement is repeated [e.g., Loke et al., 2013]. This was not possible to automate with the 244
prototype CRI instrument, which required manual swapping of connections in order to perform 245
reciprocal acquisition. 246
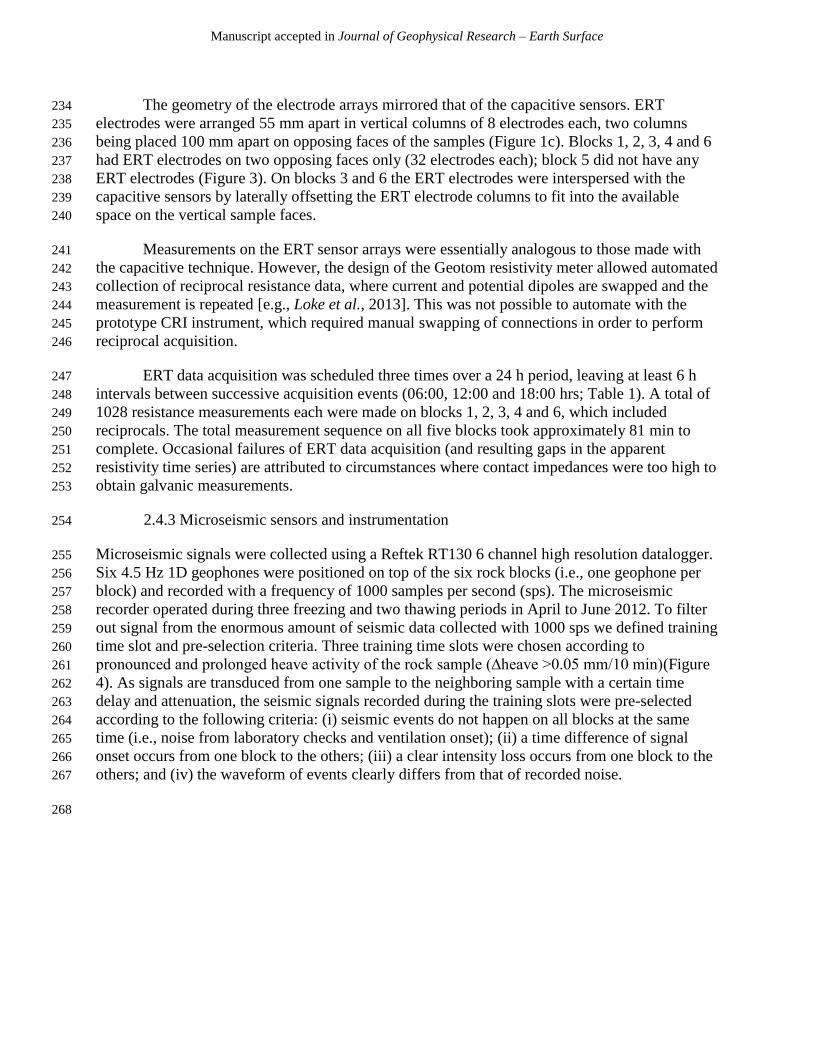
ERT data acquisition was scheduled three times over a 24 h period, leaving at least 6 h 247
intervals between successive acquisition events (06:00, 12:00 and 18:00 hrs; Table 1). A total of 248
1028 resistance measurements each were made on blocks 1, 2, 3, 4 and 6, which included 249
reciprocals. The total measurement sequence on all five blocks took approximately 81 min to 250
complete. Occasional failures of ERT data acquisition (and resulting gaps in the apparent 251
resistivity time series) are attributed to circumstances where contact impedances were too high to 252
obtain galvanic measurements. 253
2.4.3 Microseismic sensors and instrumentation 254
Microseismic signals were collected using a Reftek RT130 6 channel high resolution datalogger. 255
Six 4.5 Hz 1D geophones were positioned on top of the six rock blocks (i.e., one geophone per 256
block) and recorded with a frequency of 1000 samples per second (sps). The microseismic 257
recorder operated during three freezing and two thawing periods in April to June 2012. To filter 258
out signal from the enormous amount of seismic data collected with 1000 sps we defined training 259
time slot and pre-selection criteria. Three training time slots were chosen according to 260
pronounced and prolonged heave activity of the rock sample (∆heave >0.05 mm/10 min)(Figure 261
4). As signals are transduced from one sample to the neighboring sample with a certain time 262
delay and attenuation, the seismic signals recorded during the training slots were pre-selected 263
according to the following criteria: (i) seismic events do not happen on all blocks at the same 264
time (i.e., noise from laboratory checks and ventilation onset); (ii) a time difference of signal 265
onset occurs from one block to the others; (iii) a clear intensity loss occurs from one block to the 266
others; and (iv) the waveform of events clearly differs from that of recorded noise. 267
268

Manuscript accepted in Journal of Geophysical Research – Earth Surface
269
Figure 4. Training slots of rapid heave which were used for calibrating microseismic filtering 270
and event detection during freezing periods (FP) and thawing periods (TP) 1‒3. 271
We then used spectral analysis based on Fourier decomposition to identify the frequency 272
band associated with noise, calibrated in a 24 h time slot prior to the onset of the temperature 273
forcing as well as the frequency band associated with signals. To filter out low frequencies we 274
applied a Butterworth-Highpass Filter, which has only little effect on the filtered signal 275
characteristics. Events were then automatically detected using a short time average over long 276
time average (STA/LTA) trigger algorithm, where the amplitude of the short time seismic signal 277
was compared to the long-term average noise. Initial STA/LTA thresholds were 6.5 for 278
triggering and 3.5 for detriggering for 0.3 s long STA periods calibrated using the test data and 279
based on Vaezi and Van der Baan [2014]. Events were detected on 52 of 72 recording days. 280
2.5 Temperature 281
Rock temperature was measured by cylindrical platinum resistance thermometers 282
manufactured by British Rototherm Co Ltd. The resistors are 100 at 0°C (PT100) and consist 283
of a PR2825 element made to BS EN 60751:1996 Standard, 4 wire, Class A. The element is 284
connected to a silver-plated copper twisted insulated lead 7 m long with 7/0.2 PTFE core and 285
with PTFE shrink sleeve fitted over each joint and over the final sleeve. The element and 286
connection to the lead are embedded in epoxy and encased in a closed-end tube of 316 stainless 287
steel that is 4 mm in external diameter, 3 mm internal diameter and 40 mm long. The 288
manufacturer’s stated tolerance of the PT100 resistor is ±0.15°C at 0°C. The resistors were 289
Manuscript accepted in Journal of Geophysical Research – Earth Surface
calibrated to an accuracy of ±0.1°C in a mechanically stirred ice-water bath, prior to installing 290
them in the blocks. The precision of the PT100s during the experiment is estimated to be 291
typically ±0.1°C. Rock temperature was measured at 50 mm depth increments from the block 292
surface to the base (n=10 per block), with the PT100s at depths between 50 and 400 mm. The 293
surface (0 mm) and basal (450 mm) PT100s were glued into a shallow groove cut into the block 294
surface and base with an angle grinder. Sensor locations are shown in Figure 2. Additional 295
PT100s measured the air temperature within the cold room. Temperatures were logged every 10 296
minutes during the experiment. 297
2.6 Volumetric unfrozen water content 298
Volumetric unfrozen water content (θu) in the rock mass was measured by Time Domain 299
Reflectometry (TDR) using a Campbell Scientific TDR100 Time Domain Reflectometer. The 300
unit was connected to 24 stainless steel TDR probes (model CS635, 3-rod probe, rod length 301
150 mm) via low-loss LMR200DB cable and SDMX50 coaxial multiplexers. Blocks 1, 2 and 4 302
were instrumented with 8 TDR probes mounted in a vertical column at depth separations of 303
50 mm. The individual probes were oriented horizontally (Figure 2) and their exterior ends were 304
sealed with Polyfilla. TDR data were logged every 10 min with a Campbell Scientific CR800 305
datalogger. TDR probes act as a wave guide, and impedance along the rods varies with the 306
dielectric permittivity of the surrounding rock matrix, including any pore water in liquid or 307
frozen form. As the dielectric permittivity primarily depends on the amount of water present, θu 308
can be inferred from measurements of the elapsed travel time and pulse reflection amplitude. The 309
diameter around the sensor from where the water content is estimated to be approximately 25 310
mm. There are three parallel rods in a line, meaning that that the rock volume measured has an 311
oblong or ellipsoidal shape. We used the Topp equation [Topp et al., 1980] to calculate θu from 312
apparent dielectric permittivity. 313
2.7 Surface heave and settlement 314
Heave and settlement of the block tops were measured in order to provide an indirect and 315
non-invasive measure of macrocracking, because our previous experiments with tuffeau indicate 316
that macrocracking causes dilation and therefore heave of the rock top. Heave and settlement 317
were measured by six linear variable differential transformers (LVDTs; models LDC2000C and 318
LDC1000C, with captive guided armature) manufactured by RDP Group. Their linearity was ± 319
0.35% of the full range, and their sensitivity exceeded 46 mV mm-1
. Each LVDT was calibrated 320
individually with metal slips of known thickness prior to the experiment. The foot of each LVDT 321
rested on a metal stud glued near the centre of the top of each block. A seventh LVDT was 322
attached horizontally to the metal frame above tank 2 in order to measure its sensitivity to 323
temperature change. 324
Logging of heave and temperature were performed with a National Instruments 325
CompactDAQ multiplexed USB data acquisition system (model NI cDAQ-9172) connected to 326
four 32-channel analog input modules (model 9205). The measurement and control system uses 327
LabVIEW software, which was programmed to average 30 values measured during sampling 328
periods of 10 minutes. 329
330

Manuscript accepted in Journal of Geophysical Research – Earth Surface
3 Results 331
3.1 Temperature and active-layer thickness 332
Air temperature in the cold room had mean values of −9.3 to −13.8°C during freezing 333
periods, and 3.1 to 16.9°C during thawing periods (Figure 5a). Active-layer thickness (ALT) 334
varied substantially between blocks and between thawing periods (Figure 5b). In the tuffeau 335
blocks (#1 and 3), ALT varied from 126 to 337 mm (mean = 188 ± 59 mm) in block 1 and from 336
131 to 399 mm (mean = 236 ± 69 mm) in block 3. The Wetterstein block (#2) showed the 337
greatest variation, from 70 to 446 mm (mean = 186 ± 97 mm). Factors influencing ALTs 338
included the mean air temperatures during thawing periods (Figure 5a) and the duration of 339
thawing periods (Figure 5c). 340
341
Figure 5. Mean air temperature (± 1 std dev.) of the cold room during freezing and thawing 342
periods (a), time series of ALT in blocks 1 to 3 during the active layer-permafrost experiment 343
(b), and duration of thawing periods (c). Missing values of ALT resulted from complete thaw of 344
block 2 during freeze-thaw cycles 1 to 3, and of blocks 1 and 3 during cycle 3 due to malfunction 345
of the basal cooling plate. 346

Manuscript accepted in Journal of Geophysical Research – Earth Surface
Bidirectional freezing and unidirectional thawing is shown for the first few freeze-thaw 347
cycles during days 0–70 of the active layer-permafrost experiments in tuffeau blocks 1 and 3 and 348
in Wetterstein block 2 by the contoured isotherms in Figure 6a to 6c. Temporary failure of the 349
basal cooling plate around days 58–61 led to complete thaw of block B2, and unusually deep 350
thaw of blocks B1 and B3 (Figure 5). In the seasonal frost experiment, all three blocks froze 351
from the top downwards as well as from the bottom upwards (Figure 6d to 6f), the latter 352
attributed to imperfect insulation of the basal cooling plate. The Wetterstein block 6 thawed 353
downwards (Figure 6f), whereas tuffeau blocks 4 and 5 also experienced upwards thaw, as 354
expected under natural conditions of seasonal frost in the absence of permafrost. The absence of 355
upwards thaw of the Wetterstein block 6 is attributed to its low porosity and hence water content; 356
thus, negligible latent heat would have been released during thaw, which facilitated rapid thaw 357
from above rather than from below through the limited basal insulation. 358
359
Figure 6. Temperature time series in blocks 1 to 6 during the first 70 days of the experiments, 360
with bidirectional freezing of an active layer above permafrost (a to c), and bidirectional freezing 361
and thawing of rock lacking permafrost (d to f). Freezing periods and thawing periods are 362
indicated in (a). Black areas indicate missing or anomalous data, where interpolation is 363
inappropriate. 364

Manuscript accepted in Journal of Geophysical Research – Earth Surface
3.2 Volumetric unfrozen water content 365
The volumetric unfrozen water content (θu) in tuffeau blocks 1 and 4 varied substantially 366
between freezing and thawing periods, as illustrated during the first 70 days of the experiments 367
(Figure 7). Freezing periods were characterized by θu values of about 0.1 m3 m
–3 in both 368
experiments, and thawing periods by about 0.2 to 0.3 m3 m
–3 in the active layer of block 1 and 369
throughout block 4. Peak θu values of 0.41 and 0.45 m3 m
–3 briefly developed during early stages 370
of thawing period 1 at 150 mm depth in B1 and B4, respectively. These occurred during phase 371
changes of ice to water and are attributed to rapid drawdown of water by cryosuction into 372
partially frozen rock before the rock a particular depth had completely thawed. In permafrost of 373
block 1, θu values during thawing period 1 increased marginally to about 0.11 m3 m
–3 (depths of 374
300, 350 and 400 mm in Figure 7a), while ALT reached 268 mm. However, during the final 2–3 375
days of thawing period 2, as ALT approached 329 mm, θu values increased rapidly to 0.18 and 376
0.15 m3 m
–3 at depths of 350 and 400 m, respectively, indicating that the warm permafrost 377
contained substantial amounts of unfrozen water. 378
379
Figure 7. Time series of air temperature, volumetric unfrozen water content (VWC) and rock 380
temperature in tuffeau blocks 1 and 4 during the first 70 days of the active layer-permafrost 381

Manuscript accepted in Journal of Geophysical Research – Earth Surface
experiment (a) and seasonal frost experiment (b). Depths of water content measurements are 382
indicated by coloured lines. Freezing periods and thawing periods indicated in (a). 383
Unfortunately, measurement of θu after about day 100 in tuffeau blocks 1 and 4 failed, 384
and was not successful in Wetterstein block 2 throughout the experiment. By the end of the 385
experiment some of the TDR rods extracted from tuffeau block 4 were highly corroded, with 386
holes up to a few millimeters long in them. The reason for the failure of TDR to measure 387
unfrozen water content for the Wetterstein block is not known for certain. But, as suggested by 388
Sass [2005], TDR may be better suited for homogeneous, porous rocks such as sandstone and 389
tuff [Hokett et al., 1992], as well as the tuffeau in the present experiments. Possibly, the 390
heterogeneity caused by pre-existing cracks in the Wetterstein block as well as its low porosity, 391
may have contributed to the failure. Although TDR measurements in rock can be affected by 392
movement of water along TDR rods, for example following rainfall [Sass, 2005], we did not 393
identify this as a problem because our experiments did not involve sudden wetting of the rock 394
faces in which the rods were inserted. 395
The cause of small peaks in θu at some depths shortly before freezing (e.g. days 2 to 3 in 396
blocks B1 and B4, and days 28 and 62 in B4) is uncertain. An explanation in terms of pore water 397
pushed ahead of a freezing front into unfrozen limestone and dolostone whose low-porosity (1‒398
10%) is mainly due to cracks and narrow fissures [Sass, 2004], is thought to be unlikely for two 399
reasons. First, ice segregation and therefore cryosuction, rather than water expulsion, is indicated 400
by the occurrence of segregated ice within macrocracks, as discussed below in sections 3.4 and 401
4.1. Second, the expulsion of water ahead of a freezing front is most likely to occur in coarse-402
grained porous media such as saturated sand and gravel, as associated with hydrostatic pingos 403
[Mackay, 1998], and along macroscopic cracks and fissures in low-porosity rocks, as discussed 404
by Sass [2004]. In both coarse-grained porous media and along cracks in rocks the magnitude of 405
pore-water expulsion can overwhelm the opposite process of cryosuction. An alternative 406
explanation for the small peaks in θu may relate to changes in electrical conductivity caused by 407
solute rejection during freezing, but this requires further study. 408
3.3 Heave 409
Heave of the block tops varied according to rock type and freezing regime. Tuffeau 410
blocks 1, 3 and 4 showed a net heave of 7.6 to 13.4 mm during the experiment, whereas 411
Wetterstein block 2 heaved 1.8 mm and Wetterstein block 6 heaved 0.2 mm (Figure 8). In the 412
active layer-permafrost experiment, tuffeau blocks 1 and 3 heaved progressively during the 413
middle to late stages of many thawing periods, whereas in the seasonal frost experiment tuffeau 414
blocks 4 and 5 tended to settle during the late stages of thawing periods. 415
Manuscript accepted in Journal of Geophysical Research – Earth Surface
416
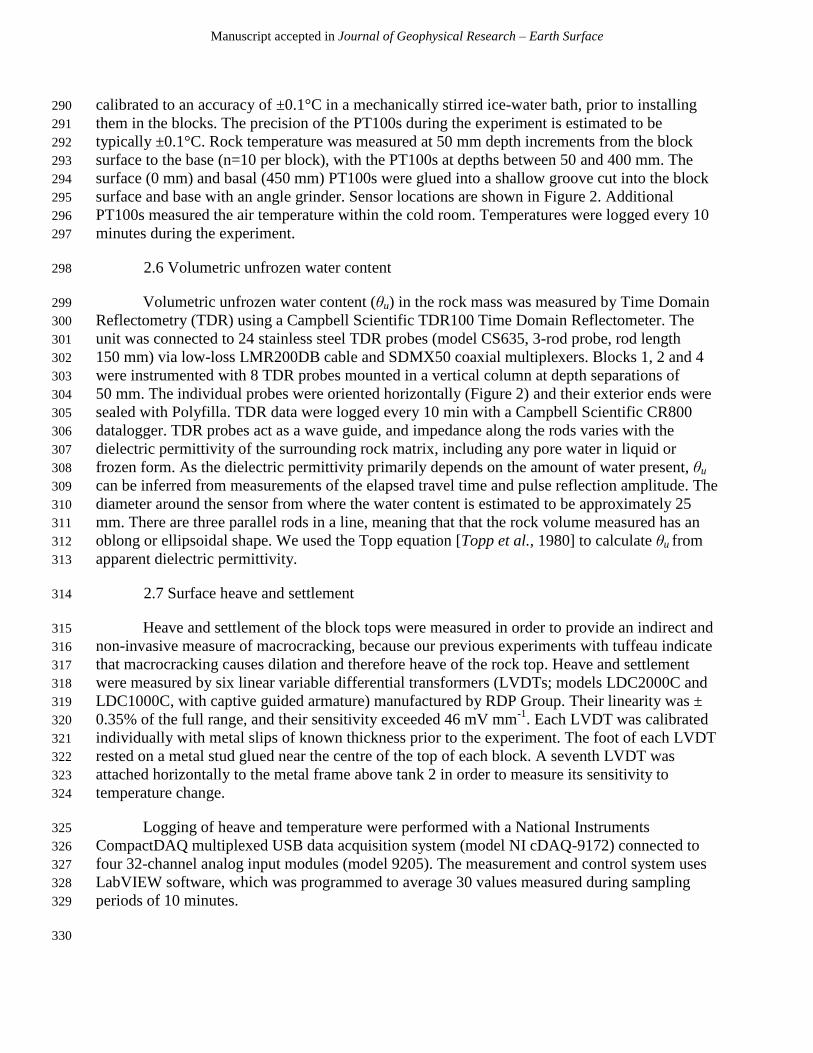
Figure 8. (a) Heave of blocks 1 to 6, air temperature of cold room and gravel base temperature in 417
tank 1 during the experiments. ‘1F’ to ‘28F’ indicate freezing periods 1 to 28, and ‘1T’ to ‘28T’ 418
indicate thawing periods. (b) Detailed plot of heave through freezing period 6 to thawing period 419
8. 420
Manuscript accepted in Journal of Geophysical Research – Earth Surface
The heave behaviour of tuffeau blocks 4 and 5 differed substantially. Block 4 showed the 421
greatest magnitude of heave and settlement during freeze-thaw cycles and the second greatest 422
amount of net heave of any block (Figure 8). The range and heave and settlement over individual 423
freeze-thaw cycles was up to ~ 5 mm. The net heave measured over the experiment was 12.8 424
mm, which is a conservative estimate because the LVDT reached the top of its travel during 425
some cycles (indicated in Figure 8 by the flat tops during some cycles). In contrast, block 5 had a 426
net heave of less than 0.4 mm and showed heave-settlement ranges of typically 1–2 mm during 427
freeze-thaw cycles. 428
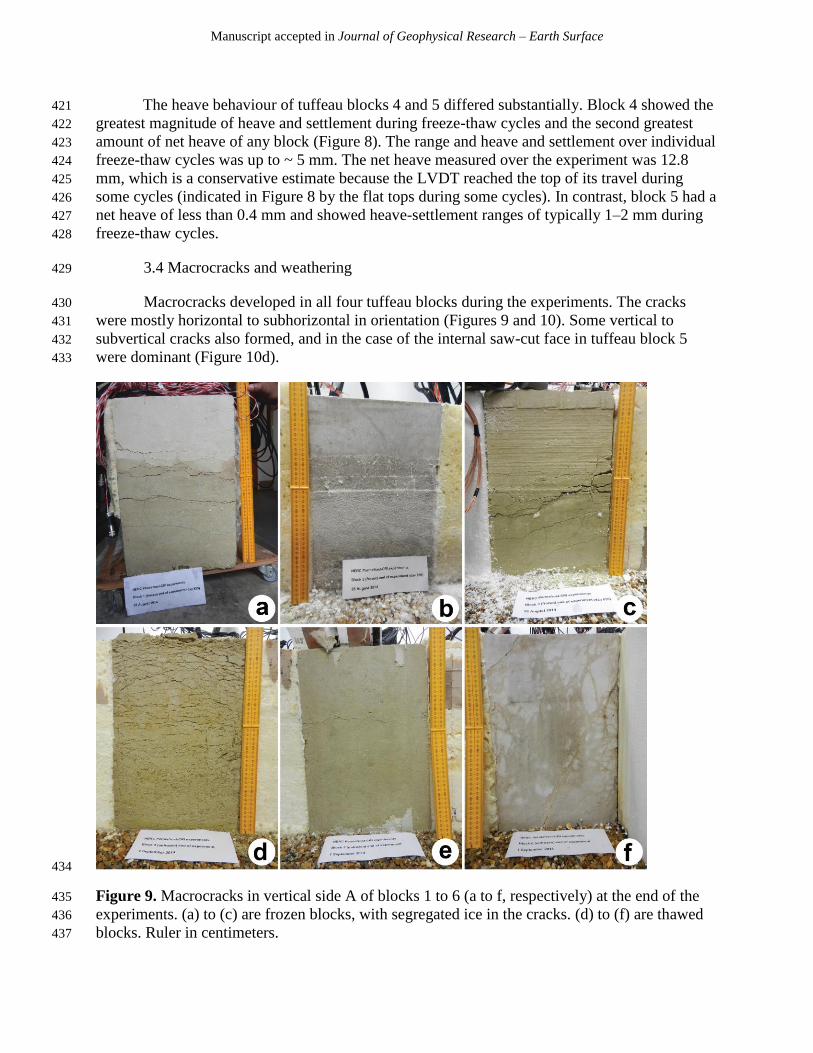
3.4 Macrocracks and weathering 429
Macrocracks developed in all four tuffeau blocks during the experiments. The cracks 430
were mostly horizontal to subhorizontal in orientation (Figures 9 and 10). Some vertical to 431
subvertical cracks also formed, and in the case of the internal saw-cut face in tuffeau block 5 432
were dominant (Figure 10d). 433
434
Figure 9. Macrocracks in vertical side A of blocks 1 to 6 (a to f, respectively) at the end of the 435
experiments. (a) to (c) are frozen blocks, with segregated ice in the cracks. (d) to (f) are thawed 436
blocks. Ruler in centimeters. 437
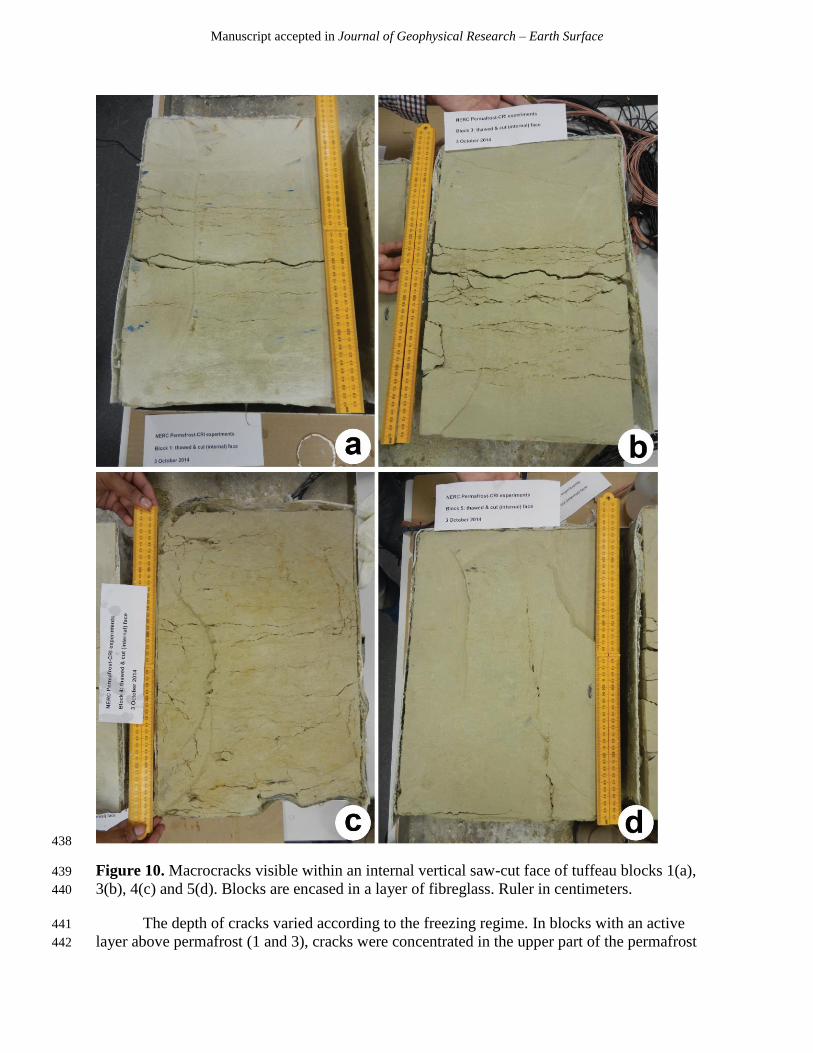
Manuscript accepted in Journal of Geophysical Research – Earth Surface
438
Figure 10. Macrocracks visible within an internal vertical saw-cut face of tuffeau blocks 1(a), 439
3(b), 4(c) and 5(d). Blocks are encased in a layer of fibreglass. Ruler in centimeters. 440
The depth of cracks varied according to the freezing regime. In blocks with an active 441
layer above permafrost (1 and 3), cracks were concentrated in the upper part of the permafrost 442

Manuscript accepted in Journal of Geophysical Research – Earth Surface
and the lower part of the active layer (Figures 9a, 9c and 11a). But in blocks lacking permafrost 443
(4 and 5), cracks occurred to greater depths, reaching almost the bottom of both blocks (Figure 444
11a). Remarkably, cracks were pervasive throughout block 4 (Figures 9d and 10c), whereas in 445
block 5 a few horizontal cracks were observed in the upper half of the outer side (Figure 9e) and 446
a subvertical crack was prominent on an internal face (Figure 10d). Block 4 also showed signs of 447
colour mottling, with patches of orange brown discoloration on both the external and internal 448
sides (Figures 9d and 10c). 449
The number of cracks observed in vertical traverses across the blocks also varied, 450
particularly in the experiment lacking permafrost. In blocks 1 and 3 the median numbers of 451
cracks were 8 and 11, respectively. In block 5, the median value was 4 cracks, and in block 4 it 452
was 19. The latter number, however, is likely an underestimate because it was based on 453
examination of the internal cut face (Figure 10c), when it was not possible to remove saw-454
generated dust from all the cracks, and earlier measurement of the external vertical side A during 455
thaw cycle 27 revealed a median value of 59 cracks; a value more consistent with the abundant 456
cracks shown in Figure 9d. 457
458
Figure 11. (a) Boxplots of depths to top and bottom cracks observed at the end of the 459
experiments in tuffeau blocks 1, 3, 4 and 5. ALT values for blocks 1 and 3 are also shown. (b) 460
Number of cracks recorded at the end of the experiments. The coloured boxes show the 461
interquartile range, the horizontal line within the boxes is the median, and the whiskers extend to 462
the highest and lowest values within 1.5 times the interquartile range. 463
464

Manuscript accepted in Journal of Geophysical Research – Earth Surface
3.5 Geoelectrical data 465
We focus here on our overarching goal to assess the suitability of geoelectrical 466
methodologies for monitoring freeze-thaw processes in contrasting rock types and under 467
different thermal regimes (permafrost and seasonal frost). We present example data from blocks 468
3 and 6, as these reflect both thermal regimes, both rock types and are measured with both 469
geoelectrical measurement techniques, therefore allowing direct comparison. The analysis is 470
preliminary and limited to the contact properties associated with CRI and ERT and the apparent 471
resistivity estimates obtained from both techniques. 472
3.5.1 Electrical contact properties 473
Electrode coupling is a critical parameter and known source of error in geoelectrical 474
measurements, particularly for cryospheric applications [Doetsch et al., 2015; Tomaškovičová et 475
al., 2016]. High contact impedances can severely limit the size of the injectable current or 476
generate unstable potential measurements, thus creating bias in some geoelectrical measurements 477
[Zonge and Hughes, 1986; Ingeman-Nielsen et al., 2016]. ERT relies on the galvanic contact 478
between the electrodes and the ground, giving rise to a contact impedance dominated by ohmic 479
resistance. The CRI contact impedance on the other hand is dominated by the capacitive 480
reactance established between the sensor and the ground surface, which in turn is a function of 481
their separation and the dielectric properties of the separating medium [Kuras et al., 2006]. 482
483
484 Figure 12. Contact impedance (magnitude) for geoelectrical sensor arrays, measured at 485
representative stages of the freeze-thaw experiments. Top row: ERT electrodes on block 3 486
(tuffeau) in thawed (a) and frozen (b) states; ERT electrodes on block 6 (Wetterstein) in thawed 487
(c) and frozen (d) states. Bottom row: CRI sensors on block 3 (tuffeau) (e) and on block 6 488
(Wetterstein) (f), both in frozen states. ERT data acquired on 22 May 2014 (thawed state) and 11 489
June 2014 (frozen state); CRI data acquired on 13 June 2014. 490

Manuscript accepted in Journal of Geophysical Research – Earth Surface
For our experiments, the measurement of contact properties could not be automated with 491
the available ERT and CRI instrumentation, and therefore could not be performed continuously 492
and systematically throughout the experiment. Instead, representative measurements were carried 493
out opportunistically at key stages during the seasonal temperature cycle. Figure 12 shows the 494
distribution of contact impedance magnitude obtained for both the CRI and ERT sensor arrays 495
during thawed and frozen states, respectively. Impedance magnitudes were measured by ERT on 496
block 3 (tuffeau) (Figure 12a,b) and on block 6 (Wetterstein) (Figure 12c,d). Equivalent CRI 497
measurements were made on blocks 3 (Figure 12e) and block 6 (Figure 12f). The values shown 498
in Figure 12a and 12c were obtained in a thawed state, whereas all other values were measured 499
on frozen rock, which naturally presents the greater challenge for low-frequency geoelectrical 500
techniques. 501
ERT. The ERT electrodes experienced a wide range of contact impedances across the 502
two rock types and the seasonal conditions. At practically all times the impedances were at least 503
1–2 orders of magnitude higher than for typical ERT installations in soft soils or sediments. In 504
line with expectations, the lowest range of values was observed on tuffeau in a thawed state 505
(Figure 12a, median = 62.7 k), although deeper sensors reaching the permafrost layer 506
experienced higher contact impedances. On the same block, median values were approximately 507
four times higher during frozen states (Figure 12b, median = 238.5 k). All values remained 508
below ~300 k at the time of measurement (after the 27th
freezing cycle and during the 28th
509
cycle, respectively). On the Wetterstein Limestone, median values observed in thawed states 510
were more than 20 times higher than on tuffeau (Figure 21c, median = 1,533 k), despite the 511
absence of a permafrost layer in block 6. The highest median values occurred in Wetterstein in a 512
frozen state (Figure 12d, median = 12,969 k) – >50 times higher than those observed on tuffeau 513
around the same time. The highest contact impedances observed on Wetterstein were around 514
15 MFor such poorly coupled sensors, obtaining stable ERT measurements with acceptable 515
noise properties is extremely challenging, and often beyond the capabilities of typical survey 516
instrumentation [Tomaškovičová et al., 2016]. 517
CRI. Owing to logistical constraints resulting from the prototype nature of the CRI 518
instrumentation, only contact impedance measurements on frozen blocks (but on both rock 519
types) were carried out for CRI. On tuffeau, the CRI sensors experienced median contact 520
impedances of 440.6 k (Figure 12e), which is comparable with the contact impedances seen by 521
ERT under the same conditions (Figure 12b). Some instances of higher CRI contact impedances 522
(sensors #14-16, 78-80 and 74) are attributed to greater separation between individual CRI 523
sensors and the rock surface due to reduced adhesion or increased surface roughness on some 524
sample faces. On Wetterstein Limestone, a median value of 1,361.1 k was observed (Figure 525
12f), which is only greater by a factor of ~3 than the tuffeau value. These measured contact 526
impedances are compatible with predicted values based on estimates of likely sensor 527
capacitance, based on a separation of <1.5 mm between sensor foil and rock surface, and a 528
dielectric medium comprising acetate, air and water [Tschofen, 2014]. 529
530
531
532

Manuscript accepted in Journal of Geophysical Research – Earth Surface
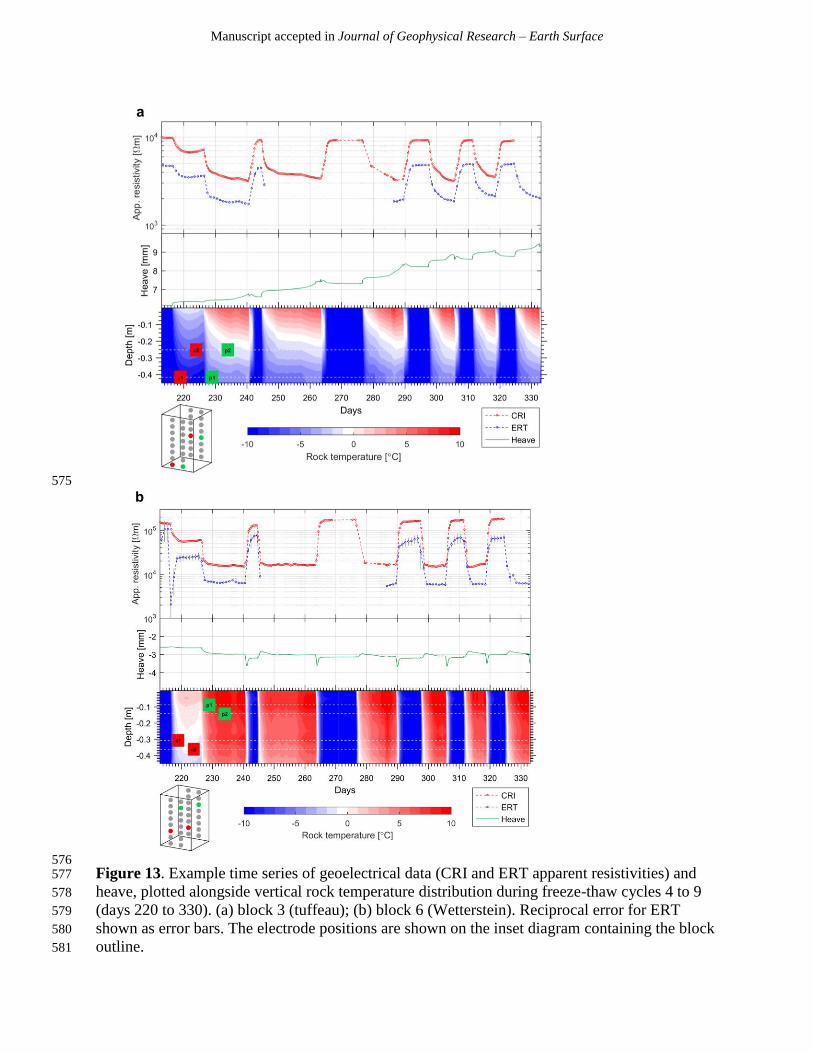
3.5.2 Apparent resistivity time series 533
Multi-sensor CRI and ERT data were acquired regularly throughout the experiments over 534
multiple freeze-thaw cycles. We illustrate the characteristics of apparent resistivity time series 535
for both methodologies. A subset of the data spanning freeze-thaw cycles 4 to 9 (days 210 to 325 536
after the start of the experiments) is examined below. 537
Tuffeau (block 3), active layer underlain by permafrost. Figure 13a shows apparent 538
resistivities estimated on block 3 (tuffeau) by a single four-sensor configuration (current dipole 539
C1, C2 and potential dipole P1, P2) of CRI and ERT arrays, respectively. The apparent 540
resistivities are plotted alongside the distribution of rock temperature (Section 3.1) and surface 541
heave/settlement observed on the block top (Section 3.3). The sensor positions for this 542
measurement are indicated as red (current) and green (potential) markers on the inset diagram 543
showing the block outline. They were chosen such that all four sensors were located on the lower 544
half of the tuffeau block, i.e., within the permafrost layer. The white dashed lines indicate the 545
electrode positions relative to the rock temperature distribution. 546
Both CRI and ERT apparent resistivities tracked the rock temperature variations very 547
clearly, with transitions between frozen and thawed conditions causing bulk resistivities to vary 548
by a factor of at least ~4 relative to maximum values, in broadly repeatable patterns. CRI and 549
ERT apparent resistivity estimates differed by a factor of ~2, with CRI consistently producing 550
higher estimates. During freezing cycles, when the entire block is frozen, both techniques 551
reached stable plateau values of maximum resistivities (CRI: ~10 km; ERT: ~5 km). During 552
thawing periods, resistivity values gradually dropped in line with rising temperature and increase 553
in liquid water content to eventually reach minimum levels (CRI: ~2.5 km; ERT: ~1.5 km). 554
At this point in the experiment, both sets of geoelectrical data exhibited relatively low levels of 555
noise. The total heave observed during freeze-thaw cycles 4 to 9 amounted to >3 mm, but no 556
effect on the electrical data due to the uplift is immediately apparent from the time series 557
associated with a single four-electrode combination. Such effects are more likely to become 558
apparent during tomographic reconstruction of data from multiple electrode combinations. 559
Wetterstein (block 6), seasonal frost. Figure 13b shows the same type of plot for a 560
single four-sensor configuration of CRI and ERT arrays on block 6 (Wetterstein). Once again, 561
both CRI and ERT apparent resistivities tracked the rock temperature variations closely, but 562
average resistivities of the Wetterstein Limestone were higher, in line with expectations. During 563
freezing periods both techniques reached maximum resistivities of >150 km (CRI) and 564
~70 km (ERT), although more stable plateau values were observed with CRI. Compared with 565
the tuffeau data, ERT measurements on Wetterstein exhibited substantial reciprocal errors (often 566
>20%) and ERT struggled to determine a stable maximum resistivity of the frozen rock mass. 567
During thawing periods, resistivity values gradually dropped, as with the tuffeau, and both 568
techniques reached well-defined minimum levels (CRI: ~15 km; ERT: ~7 km). Transitions 569
between frozen and thawed conditions therefore caused bulk resistivities to vary by a factor of at 570
least ~10 relative to maximum values. Total observed heave was <1 mm, and again no impact on 571
the electrical data is apparent. 572
573
574
Manuscript accepted in Journal of Geophysical Research – Earth Surface
575
576 Figure 13. Example time series of geoelectrical data (CRI and ERT apparent resistivities) and 577
heave, plotted alongside vertical rock temperature distribution during freeze-thaw cycles 4 to 9 578
(days 220 to 330). (a) block 3 (tuffeau); (b) block 6 (Wetterstein). Reciprocal error for ERT 579
shown as error bars. The electrode positions are shown on the inset diagram containing the block 580
outline. 581

Manuscript accepted in Journal of Geophysical Research – Earth Surface
3.6 Microseismic events 582
The calibrated triggering of more than 1000 microseismic events coincided with either 583
low temperatures or strong changes in thermal forcing (i.e., conditions favouring ice 584
segregation), while warm conditions from days 15 to 26 did not trigger seismic events (Figure 585
15). Frequent triggering (>40 events per day) often coincided with strong delta heave (days 3, 7, 586
9, 27, 49…), where the highest trigger frequencies corresponded to freezing and thawing days 587
(12–13, 26–27 and 48–49). 588
589
4 Discussion 590
4.1 Weathering 591
The physical properties of the four tuffeau blocks changed during the experiments, as 592
macrocracks developed by frost weathering. Macrocracking is attributed to ice segregation 593
within the tuffeau blocks, as observed in previous experiments on this rock type [Murton et al., 594
2001, 2006]. As expected, macrocracks in the permafrost experiment concentrated in the upper 595
part of the permafrost and the lower part of the active layer in tuffeau blocks 1 and 3, subject to 596
bidirectional freezing. This led to a build-up of segregated ice in the near-surface permafrost and 597
substantial heave of the block surface, interrupted episodically by melt of some segregated ice 598
and resultant settlement during particularly warm conditions. 599
In addition to ice segregation, corrosion of some TDR rods in tuffeau block 4 suggests 600
that frost weathering was accompanied by chemical weathering. The type of chemical 601
weathering is not known, but one possibility is oxidation of pyrite and/or destablisation of 602
glauconite within the tuffeau adjacent to the rods, as reported in weathering of tuffeau and the 603
formation of the mineral jarosite in the walls of the 13th
Century abbey at Fontevrault, Maine-et-604
Loire, France [Bauer and Velde, 1997]. We speculate that the potent combination of frost and 605
chemical weathering may also account for the remarkable abundance and pervasive nature of 606
macrocracks that formed in block 4 (Figures 9d and 10c) and the high-magnitude heave recorded 607
(Figure 8). The orange brown discoloration indicates oxidation associated with chemical 608
weathering of iron-bearing minerals. The highly corroded state of some TDR rods extracted from 609
block 4 is consistent with localized formation of acid (e.g. sulphuric) during some stages of 610
weathering. 611
4.2 Geoelectrical monitoring 612
Our geoelectrical results highlight the additional challenge of applying conventional 613
geoelectrical methodology to monitoring of permafrost-affected rocks, when compared to 614
monitoring of permafrost dynamics in soils or unconsolidated sediments. Irrespective of the 615
ambient temperatures and seasonal regime, the observed ERT contact impedances on our rock 616
samples were at least 1–2 orders of magnitude higher than typical values observed with ERT 617
monitoring arrays installed in soft soils or sediments [Doetsch et al., 2015; Tomaškovičová et al., 618
2016]. As shown in Section 3.5.1, contact impedances observed on low-porosity, high-strength 619
limestone are higher still (by factors of 20–50) compared with those achievable on high-porosity, 620
low-strength chalk. This imposes even tighter restrictions on the viability of permafrost 621

Manuscript accepted in Journal of Geophysical Research – Earth Surface
monitoring with ERT on rock walls or bedrock exposures, compared with those on lowland 622
postglacial sediments, for example as reported by Tomaškovičová et al. [2016]. By contrast, 623
typical contact impedances achieved with CRI are demonstrably less affected by the seasonal 624
changes in temperature, the aggregate state of the pore water (liquid or frozen), and the presence 625
of low-porosity rock with high matrix resistivities. This is because CRI contact impedances are 626
more likely to be dominated by the reactive component of the impedance associated with the 627
capacitive coupling, as opposed to the (ohmic) resistive component associated with quasi-static 628
current flow in the rock matrix [Kuras et al., 2006]. Provided the mechanical coupling of the 629
capacitive sensor with the rock surface can be sufficiently well controlled, CRI therefore offers 630
an opportunity to extend the benefits of geoelectrical monitoring methodology to soft/hard rock 631
environments. 632
Time series of apparent resistivity (Section 3.5.2) illustrate the performance of both ERT 633
and CRI during the freeze-thaw experiments and their response to the changing environmental 634
conditions. It is evident that both techniques are directly sensitive to the changes in rock 635
temperature and associated variations in liquid water content, which controls ionic current flow. 636
Essentially, both ERT and CRI make an equivalent measurement of (quasi-)DC electrical 637
properties within the limitations of the experimental constraints, the differences in the physics of 638
each measurement, and the differences in sensor geometry and location. The differences in 639
sensor geometry and location, combined with the fact that apparent resistivities vary with 640
measurement geometry, tend to make quantitative analysis and direct quantitative comparison 641
between ERT and CRI apparent resistivities challenging, and may account for much of the 642
observed constant offset between both time series. Furthermore, limitations in the validity of the 643
quasi-static approximation assumed for simple CRI data processing are known and can be 644
quantitatively assessed by numerical simulation [Uhlemann and Kuras, 2014]. For small sensor 645
separations, the point pole assumption starts to deteriorate, which can adversely affect CRI 646
measurements derived from sensors placed in close proximity to each other. However, for the 647
present configuration this effect is thought to be tolerable. The minimum normalised sensor 648
separation lr of the CRI sensors in the present experiment equals 1.1, which suggests maximum 649
errors relative to the ideal point-pole solution on the order of ~10% [Uhlemann and Kuras, 650
2014]. Inverse modelling of ERT and CRI data yields spatial distributions of bulk resistivity, 651
which will ultimately represent the yardstick for quantitative comparison between both 652
techniques. 653
4.3 Microseismic monitoring 654
After applying the four pre-filtering criteria (Section 2.4.3.), we applied additional 655
filtering criteria to detect and cluster relevant microcracking events out of the more than 1000 656
events reported in Figure 14. These criteria derive from previously published examples of best 657
practice [West et al., 2010; Hammer et al., 2013, 2015] and highlight frequency and waveform as 658
the criteria most indicative of microcracking in rock and ice masses. Spillman et al. [2007] 659
described brief seismic microcracking events up to 200 Hz, and Senfaute et al. [2009] classified 660
signals, prior to rockfall, with the highest frequencies of 100‒1000 Hz as crack initiation and 661
fracture opening, whereas a decrease in the highest frequencies marked the extension and 662
coalescence of existing microcracks. Eberhardt et al. [2004] estimated that frequencies of 100‒663
500 Hz indicated brittle-fracture-induced seismicity. Lower frequencies, between 8 and 100 Hz, 664
were reported for ice cracking [O'Neel et al., 2007; Neave and Savage, 1970; West et al., 2010]. 665

Manuscript accepted in Journal of Geophysical Research – Earth Surface
These best-practice examples also reported distinctive waveforms and durations [West et al., 666
2010] for crack initiation, crack coalescence and shearing, which we applied for our 667
interpretation. 668
669
Figure 14. Number of triggered microseismic events coincident to air temperature regime and 670
heave. 671
672

Manuscript accepted in Journal of Geophysical Research – Earth Surface
We grouped 42% of the ≥1000 triggered microseismic events in four event classes 673
(Figure 15), based on checking waveform characteristics and event frequency automatically 674
detected by the STA/LTA trigger, as performed in similar microseismicity analysis [West et al., 675
2010; Hammer et al., 2013, 2015]. Event class A shows an irregular, steep onset signal with a 676
duration of 0.5–1.0 sec and a frequency band up to 250 Hz. Event class B signal displays several 677
wave patterns with an emergent onset, a duration exceeding 1.5 sec and frequencies of 40–80 Hz. 678
Event class C refers to signals with a sequence of instant waveforms, a duration greater than 2.0 679
sec (whole signal) and frequencies below 50 Hz. Event class D consists of single-event signals 680
with a steep onset, a duration shorter than 0.5 sec and frequency bands up to >250 Hz. 681
682
Figure 15. Frequency of Class A, B, C and D microseismic events. The plots show seismic 683
acceleration versus time and the relevant frequency content during typical Class A–D events. 684
Characteristics relevant for the clustering of the events are given in the text. 685
Class A to D microseismic events can be hypothetically referred to certain mechanisms 686
by based on onset characteristics, frequency and the distribution of events relative to heave 687
(Figure 16). Class D only occurs pre-heave and during heave and compares well to events 688
characterized as shearing and/or opening of fracture prior to final failure by Senfaute et al. 689
[2009]. Class A could be interpreted as crack initiation or the beginning of crack coalescence 690
[Eberhardt et al., 1999; Senfaute et al., 2009]. In that way, classes B and C correspond best to 691
multi-stage crack coalescence organized by repeated small connecting fractures and rock bridge 692
yielding. 693
694

Manuscript accepted in Journal of Geophysical Research – Earth Surface
695
Figure 16. Number of class A to D microseismic events during days 1 to 14 of the experiment. 696
697
5 Conclusions 698
We have successfully integrated geophysical monitoring with controlled laboratory 699
freeze-thaw experiments that simulated an active layer in rock above permafrost and seasonally 700
frozen rock in a non-permafrost environment. The experiments monitored temperature, 701
volumetric unfrozen water content and heave in four blocks of soft, initially intact chalk (tuffeau) 702
and in two blocks of hard, initially fractured (Wetterstein) limestone. The volumetric unfrozen 703
water content in two blocks of tuffeau varied between about 0.1 m3 m
–3 during monitored 704
freezing periods and about 0.2 to 0.3 m3 m
–3 in the active layer of block 1 and throughout block 4 705
during thawing periods, peaking at 0.41 and 0.45 m3 m
–3 during early stages of thaw. Two blocks 706
of tuffeau in the permafrost experiment developed fractures filled with segregated ice that were 707
concentrated in the upper part of the permafrost and the lower part of the active layer, whereas 708
two blocks of tuffeau in the seasonal frost experiment developed fractures almost to the bottom 709
of the blocks. The fractures formed by ice segregation, although chemical weathering may have 710
been a contributory factor in one seasonally frozen block whose metal water content probes 711
became strongly corroded. 712
Our novel CRI monitoring system has been effective at observing the geoelectrical 713
signatures associated with freezing and thawing of a soft and a hard type of limestone over 714
multiple freeze-thaw cycles, and in the presence or absence of artificial permafrost. Of particular 715
importance is the demonstrated proof-of-concept that the CRI method is sensitive to the freezing 716
and thawing of rock whose internal structure is changing progressively with the development of 717
a fracture network. Our results show that CRI offers a viable route for non-galvanic long-term 718
geoelectrical monitoring in the cryosphere and yields information equivalent to that obtainable 719
with conventional ERT methodology. Multi-sensor CRI data acquisition has been demonstrated, 720

Manuscript accepted in Journal of Geophysical Research – Earth Surface
and observations are compatible with model-based predictions, suggesting that CRI-derived 721
apparent resistivities at the laboratory scale are suitable for tomographic reconstruction. In 722
contrast to ERT, contact impedances achieved with CRI are less affected by the seasonal changes 723
in temperature, the aggregate state of the pore water, and the presence of low-porosity rock with 724
high matrix resistivities. This suggests that the CRI method holds good promise to its application 725
to field conditions, where fractured bedrock is typical in mountain rockwalls. 726
More than 1000 microseismic events were detected during freeze-thaw cycles and 727
grouped into four classes according to frequency and waveform. The classes are hypothesized to 728
indicate shearing and/or fracture opening prior to final failure, crack initiation or the beginning 729
of crack coalescence, and multi-stage crack coalescence. Monitoring of microseismic events 730
holds promise for detecting crack initiation or coalescence during freezing and thawing of rock. 731
732
Acknowledgments and Data 733
The work was funded by a Natural Environment Research Council (NERC) Technology Proof of 734
Concept grant award (NE/I000917/1, NE/I000984/1). This paper is published with the 735
permission of the Executive Director of the British Geological Survey (NERC). Jerome Curoy is 736
thanked for transporting the blocks of tuffeau to Sussex, and Vikram Maji for measuring cracks. 737
The data used in this paper are archived by BGS and are available from the authors in 738
accordance with RCUK Concordat on Open Research Data. We thank Oliver Sass, Florian 739
Wagner, an anonymous reviewer and Editor Bryn Hubbard for their comments on earlier 740
versions of this paper, which have improved it substantially. 741
742
743
References 744
Bauer, A., and B. Velde (1997), Jarosite formation in weathered siliceous chalk in Fontevrault 745
abbey, Loire Valley, France, Mineralogical Mag., 61, 705–711, doi: 746
10.1180/minmag.1997.061.408.10 747
Doetsch, J., T. Ingeman-Nielsen, A. V. Christiansen, G. Fiandaca, E. Auken, and B. Elberling 748
(2015), Direct current (DC) resistivity and induced polarization (IP) monitoring of active 749
layer dynamics at high temporal resolution, Cold Reg. Sci. Technol., 119, 16–28, 750
doi:10.1016/j.coldregions.2015.07.002 751
Eberhardt, E., D. Stead, and B. Stimpson (1999), Quantifying progressive pre-peak brittle 752
fracture damage in rock during uniaxial compression. Int. J. Rock Mech. Min., 36, 361–753
380 10.1016/s0148-9062(99)00019-4. 754
Eberhardt, E., T. Spillmann, H. Maurer, H. Willenberg, S. Loew, S and D. Stead 2004. The 755
Randa Rockslide Laboratory: Establishing brittle and ductile instability mechanisms 756
using numerical modelling and microseismicity, in 9th International Symposium of 757
Landslides, edited by W. A. Lacerda et al., pp. 481–487, A. A. Balkema, Leiden. 758
Hammer, C., M. Ohrnberger, and D. Faeh (2013), Classifying seismic waveforms from scratch: a 759
case study in the alpine environment. Geophys. J. Int., 192, 425–439 10.1093/gji/ggs036. 760
Manuscript accepted in Journal of Geophysical Research – Earth Surface
Hammer, C., M. Ohrnberger, and V. Schlindwein (2015), Pattern of cryospheric seismic events 761
observed at Ekstrom Ice Shelf, Antarctica. Geophys. Res. Lett., 42, 3936–3943 762
10.1002/2015gl064029. 763
Harris, C., L. U. Arenson, H. H. Christiansen, B. Etzelmüller, R. Frauenfelder, S. Gruber, W. 764
Haeberli, C. Hauck, M. Hölzle, O. Humlum, K. Isaksen, A. Kääb, M. A. Kern-Lütschg, 765
M. Lehning, N. Matsuoka, J. B. Murton, J. Nötzli, M. Phillips, N. Ross, M. Seppälä, S. 766
M. Springman, and D. Vonder Mühll (2009), Permafrost and climate in Europe: 767
Monitoring and modelling thermal, geomorphological and geotechnical responses, Earth-768
Sci. Rev., 92(3–4), 117–171, doi:10.1016/j.earscirev.2008.12.002 769
Hokett, S. L., J. B. Chapman, and C. E. Russell (1992), Potential use of time domain 770
reflectrometry for measuring water content in rock, J. Hydrol., 138(1): 89–96, 771
doi:10.1016/0022-1694(92)90157-Q 772
Ingeman-Nielsen, T., S. Tomaškovičová, and T. Dahlin (2016), Effect of electrode shape on 773
grounding resistances — Part 1: The focus-one protocol, Geophysics, 81(1), WA159-774
WA167, doi: 10.1190/geo2015-0484.1 775
Krautblatter, M., (2009), Detection and quantification of permafrost change in alpine rock walls 776
and implications for rock instability, PhD Thesis, Univ. of Bonn, Bonn, Germany, 777
http://hss.ulb.uni-bonn.de/2009/1838/1838-engl.htm 778
Krautblatter, M., and C. Hauck (2007), Electrical resistivity tomography monitoring of 779
permafrost in solid rock walls, J. Geophys. Res.-Earth, 112(F2), 780
doi:10.1029/2006JF000546 781
Krautblatter, M., S. Verleysdonk, A. Flores-Orozco, and A. Kemna (2010), Temperature-782
calibrated imaging of seasonal changes in permafrost rock walls by quantitative electrical 783
resistivity tomography (Zugspitze, German/Austrian Alps), J. Geophys. Res.-Earth, 115, 784
doi: 10.1029/2008JF001209 785
Kuras, O., D. Beamish, P. I. Meldrum, and R. D. Ogilvy (2006), Fundamentals of the capacitive 786
resistivity technique, Geophysics, 71(3), G135–G152, doi:10.1190/1.2194892 787
Loke, M. H., J. E. Chambers, D. F. Rucker, O. Kuras, and P. B. Wilkinson (2013), Recent 788
developments in the direct-current geoelectrical imaging method, J. Appl. Geophys., 95, 789
135–156, doi:10.1016/j.jappgeo.2013.02.017 790
Mackay, J. R. (1998), Pingo growth and collapse, Tuktoyaktuk Peninsula area, western Arctic 791
coast, Canada: a long-term study. Géogr. Phys. Quatern., 52, 271–323, doi: 792
10.7202/004847ar 793
Murton, J. B., R. Peterson, and J. C. Ozouf (2006), Bedrock fracture by ice segregation in cold 794
regions, Science, 314(5802), 1127–1129, doi:10.1126/science.1132127 795
Murton, J. B., J. P. Coutard, J. P. Lautridou, J. C. Ozouf, D. A. Robinson, and R. B. G. Williams 796
(2001), Physical modelling of bedrock brecciation by ice segregation in permafrost, 797
Permafrost Periglac. Process., 12(3), 255–266, doi:10.1002/ppp.390 798
Murton, J. B., J. P. Coutard, J. P. Lautridou, J. C. Ozouf, D. A. Robinson, R. B. G. Williams, G. 799
Guillemet, and P. Simmons (2000), Experimental design for a pilot study on bedrock 800

Manuscript accepted in Journal of Geophysical Research – Earth Surface
weathering near the permafrost table, Earth Surf. Proc. Land., 25(12), 1281–1294, doi: 801
10.1002/1096-9837(200011)25:12<1281::AID-ESP137>3.0.CO;2-U 802
Neave, K. G., and J. C. Savage (1970), Icequakes on the Athabasca Glacier, J. Geophys. Res. 75, 803
1351–1362, doi: 10.1029/JB075i008p01351. 804
O'Neel, S., H. P. Marshall, D. E. McNamara, and W. T. Pfeffer (2007), Seismic detection and 805
analysis of icequakes at Columbia Glacier, Alaska, J. Geophys. Res.-Earth 112, F03s23, 806
doi: 10.1029/2006jf000595. 807
Sass, O. (2004), Rock moisture fluctuations during freeze-thaw cycles – preliminary results 808
derived from electrical resistivity measurements, Polar Geog., 28(1), 13–31, 809
doi.org/10.1080/789610157 810
Sass, O. (2005), Rock moisture measurements: techniques, results, and implications for 811
weathering, Earth Surf. Process., 30, 359–374, doi: 10.1002/esp.1214 812
Senfaute, G., A. Duperret, and J. A. Lawrence (2009), Micro-seismic precursory cracks prior to 813
rock-fall on coastal chalk cliffs: a case study at Mesnil-Val, Normandie, NW France, Nat. 814
Hazards and Earth Sys., 9, 1625–1641, doi:10.5194/nhess-9-1625-2009 815
Spillmann, T., H. Maurer, A. G. Green, B. Heincke, H. Willenberg and S. Husen (2007), 816
Microseismic investigation of an unstable mountain slope in the Swiss Alps. J. Geophys. 817
Res. 112, B07301, doi:10.1029/2006JB004723. 818
Topp, G. C., J. L. Davis, and A. P. Annan (1980), Electromagnetic determination of soil-water 819
content - measurements in coaxial transmission-lines, Water Resour. Res., 16(3), 574–820
582, doi:10.1029/WR016i003p00574 821
Tomaškovičová, S., T. Ingeman-Nielsen, A. V. Christiansen, I. Brandt, T. Dahlin, and B. 822
Elberling (2016), Effect of electrode shape on grounding resistances — Part 2: 823
Experimental results and cryospheric monitoring, Geophysics, 81(1), WA169‒WA182, 824
doi: 10.1190/geo2015-0148.1 825
Tschofen, D. (2014), Geoelectrical Monitoring of Rock Permafrost in the Laboratory, MSc 826
thesis, ETH Zurich, Zurich, Switzerland. 827
Uhlemann, S., and O. Kuras (2014), Numerical simulations of capacitive resistivity imaging 828
(CRI) measurements, Near Surf. Geophys., 12(4), 523–537, doi:10.3997/1873-829
0604.2014008 830
Vaezi, Y., and M. Van der Baan (2014), Analysis of instrument self-noise and microseismic 831
event detection using power spectral density estimates. Geophys. J. Int., 197, 1076–1089 832
10.1093/gji/ggu036. 833
West, M. E., C. F. Larsen, M. Truffer, S. O'Neel, and L. LeBlanc (2010), Glacier 834
microseismicity, Geology, 38, 319–322 10.1130/g30606.1. 835
Zonge, K. L. and L. J. Hughes (1986), Effect of Electrode Contact Resistance on Electric Field 836
Measurements, Geophysics, 51(2), 463. 837
838
Table 1. Data acquisition schedule for environmental and geophysical measurements. 839
840
Method No of sensors/ Sampling frequency Measurement

Manuscript accepted in Journal of Geophysical Research – Earth Surface
measurements duration
Temperature 10 per block,
6 blocks
Every 10 min Instant
LWC 8 per block,
3 blocks
Every 10 min Few seconds
Heave 1 per block,
6 blocks
Average of 30 values over
a 10 min period
Instant
ERT 1028 resistance
measurements;
32 sensors per block on
blocks 1, 2, 4;
24 sensors per block on
blocks 3 and 6
3 times over a 24 hr period ~81 min
CRI 1032 impedance
measurements;
32 sensors per block on
blocks 3 and 6;
64 sensors on block 5
3 times over a 24 hr period ~12.5 min
Microseismic 1 geophone per block,
6 blocks
1 kHz Continuous
841
842