Monitoring Implementation: Strategy and Program for Good Governance and Prevention and Countering...
16
Monitoring Implementation: Strategy and Program for Good Governance and Prevention and Countering Corruption (2006-2008) Alexander Stoyanov Center for the Study of Democracy Sofia, Bulgaria www.csd.bg
-
Upload
hubert-carr -
Category
Documents
-
view
214 -
download
0
Transcript of Monitoring Implementation: Strategy and Program for Good Governance and Prevention and Countering...
Monitoring Implementation:
Strategy and Program for Good Governance and Prevention and Countering Corruption (2006-2008)
Alexander Stoyanov
Center for the Study of DemocracySofia, Bulgaria
www.csd.bg

Goals of the System of Indicators
To monitor implementation of the specific measures envisioned in the Program;
To monitors progress in achieving the specific goals of the Strategy;
To assess the impact of the Strategy and the Program on the level of corruption;
To assess the overall sustainability of the Strategy and the relevance of the measures of the Program to the good governance.

Principles of the System of Indicators
To use methods and indicators that have already been nationally and internationally verified and have proven effective;
To address key problem areas identified in the Strategy; To use different sources of information and methods of
assessment; To enable regular monitoring of changes in the spread of
corruption; To ensure comparability of the information on Bulgaria
with that on the other European countries; To help assemble an extensive collection of information
with the results of assessments and the conducted monitoring.

Evaluation and Analysis Methods

Research Methods
Expert opinions (assessments and analyses by independent experts and representatives of non-governmental organizations);
Self-assessment by the institutions and agencies involved in the implementation of the Strategy and Program;
Analysis of data from official statistical surveys, agency information systems, national and international surveys;
National representative surveys of the population and the business community;
Surveys of the users of administrative, social, health and education services (Service Delivery Survey )
Mystery Customer Surveys for various services; Monthly monitoring of publications in the press,
radio and television.

System of Indicators
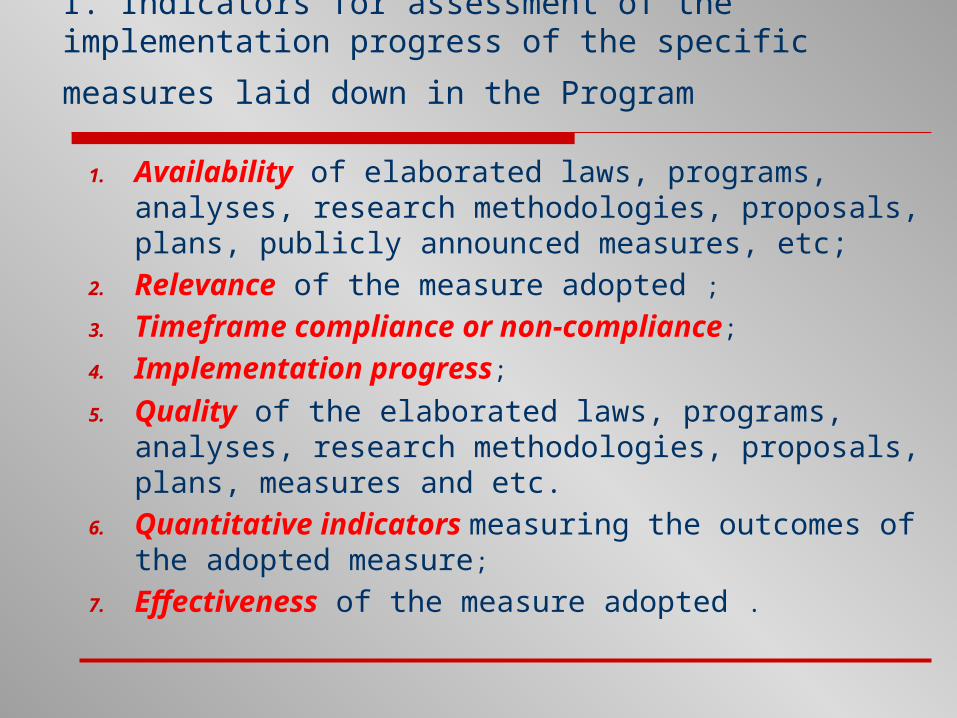
I. Indicators for assessment of the implementation progress of the specific measures laid down in the
Program
1. Availability of elaborated laws, programs, analyses, research methodologies, proposals, plans, publicly announced measures, etc;
2. Relevance of the measure adopted ;3. Timeframe compliance or non-compliance;
4. Implementation progress;
5. Quality of the elaborated laws, programs, analyses, research methodologies, proposals, plans, measures and etc.
6. Quantitative indicators measuring the outcomes of the adopted measure;
7. Effectiveness of the measure adopted .
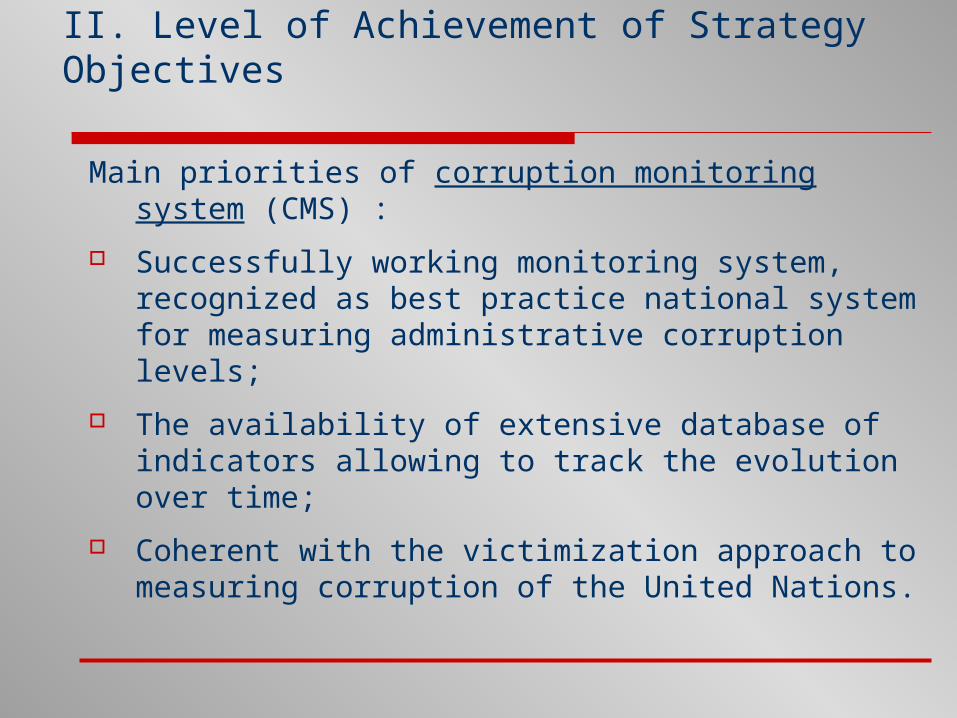
II. Level of Achievement of Strategy Objectives
Main priorities of corruption monitoring system (CMS) :
Successfully working monitoring system, recognized as best practice national system for measuring administrative corruption levels;
The availability of extensive database of indicators allowing to track the evolution over time;
Coherent with the victimization approach to measuring corruption of the United Nations.

Main CMS Indicators
1. Corruption victimization;
2. Corruption pressure;
3. Public attitudes towards corruption;
4. Spread of corruption;
5. Intolerance of corruption;
6. Factors of corruption;
7. Government anticorruption activities;
8. Access to information.

III. Assessment of the Public Services Delivery
Number of documents required for delivery of the respective administrative service;
Time spent on filling in documents; Availability of instructions for submitting the
documents needed to initiate the administrative procedures;
Total duration of the procedure from submitting the documents to the final decision;
Staff quality and competence; Service quality.

Corruption Monitoring System Results (1998-2007)
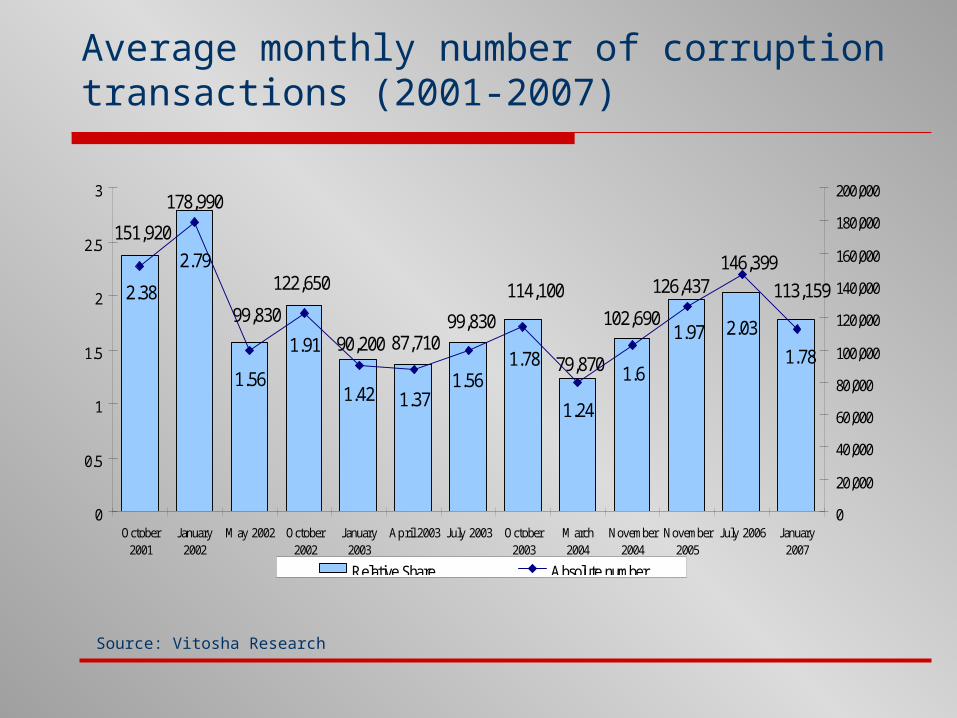
Average monthly number of corruption transactions (2001-2007)
Source: Vitosha Research
1.56
1.97
1.6
1.24
1.78
1.371.42
1.91
1.56
2.79
2.38
2.03
1.78
126,437
102,690
79,870
114,100
99,83087,71090,200
122,650
99,830
178,990
151,920
146,399
113,159
0
0.5
1
1.5
2
2.5
3
October2001
January2002
May 2002 October2002
January2003
April 2003 July 2003 October2003
March2004
November2004
November2005
July 2006 January2007
0
20,000
40,000
60,000
80,000
100,000
120,000
140,000
160,000
180,000
200,000
Relative Share Absolute number

Dynamic of indexes of the level of corruption June 1998 - January 2007
Source: Vitosha Research
1.7 1.61.5
1.2
1.51.4 1.4 1.4
1.0 1.0 1.01.1
0.8
1.3
1.61.5 1.5
1.0 1.0 1.1
0.40.3
0.50.6
0.70.6
0.81.0
1.5
2.1
0.40.3
0.90.8 0.7
0.8
0.4 0.40.50.4
0.70.8
0.0
0.5
1.0
1.5
2.0
2.5
06/9
802
/99
04/9
909
/99
01/0
004
/00
09/0
001
/01
10/0
101
/02
05/0
210
/02
01/0
305
/03
07/0
310
/03
03/0
411
/04
11/0
5
07/
06
01/
07
Corruption Pressure Involvement in Corrupt Practices

Dynamics of the indexes of the level of corruption for the business sector (October 2000 - January 2007)
Source: Vitosha Research
2.42.5 2.5
2.4
1.4
2.1
1.1
0.5
3.1
2.2
2.6
3.1
2.3
1.11.2 1.3
1.1 1.11.3
0.0
0.5
1.0
1.5
2.0
2.5
3.0
3.5
October,2000
December,2002
March,2003
June, 2003 November,2003
February,2004
April, 2004 November,2005
January2007
Corruption Pressure Corrupt Practices
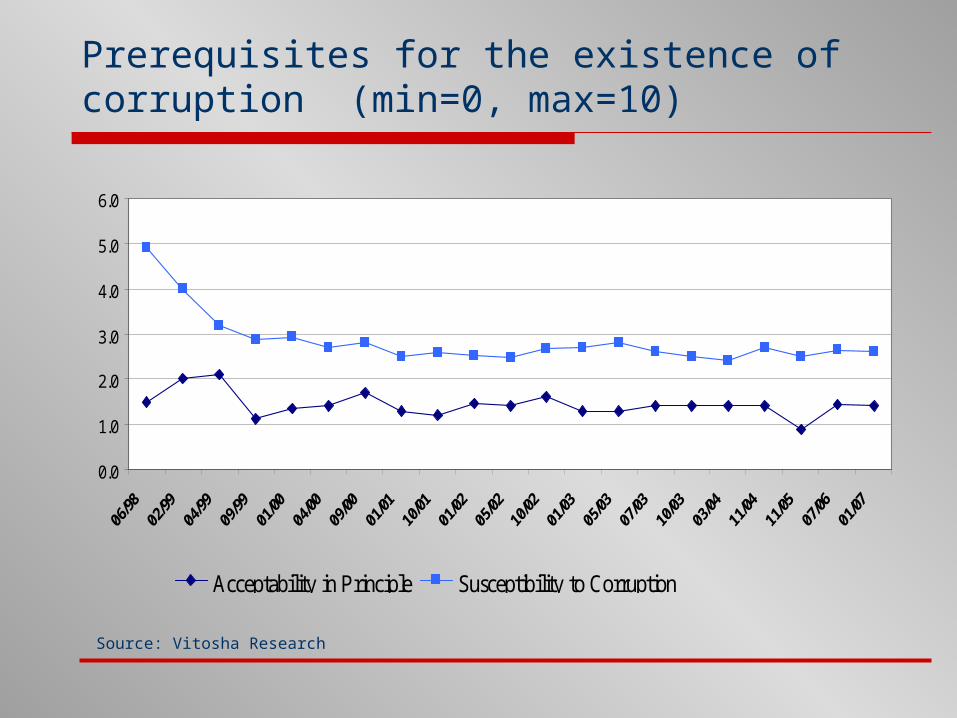
Prerequisites for the existence of corruption (min=0, max=10)
Source: Vitosha Research
0.0
1.0
2.0
3.0
4.0
5.0
6.0
Acceptability in Principle Susceptibility to Corruption

Average monthly number of corruption-related items in the media
Source: Vitosha Research
39,3
37,5
40,137,5 36,5
47,045,6
32,734,1
32,2
36,8
31,9
37,2 35,6
31,0
0
200
400
600
800
1000
1200
0
5
10
15
20
25
30
35
40
45
50
Monthly Number of Articles on Corruption in the Press
Public concern about corruption