Monitoring gamebird abundance and productivity in the UK ... · Índex de densitat de captures de...
14
Revista Catalana d’Ornitologia 24:30-43, 2008 Monitoring gamebird abundance and productivity in the UK: The GWCT long-term datasets Nicholas J. Aebischer & David Baines Because of the economic importance of gamebirds, land owners and game managers have long been interested in monitoring local abundance and productivity through counts and bag statistics. The National Gamebag Census (NGC) and Partridge Count Scheme (PCS) of The Game & Wildlife Conservation Trust (GWCT) were formally established in 1961. The NGC collects bag statistics on all game species from over 600 estates annually, and its records extend back up to 200 years. The PCS collects information on abundance and productivity of partridges from around 100 lowland estates annually since 1933. The count programme was extended in 1971 to monitor abundance and productivity of upland grouse. Using these data, we present long-term trends for five huntable bird species, several of which are poorly covered by other national schemes. Despite potential difficulties of interpretation due to shooting pressure and representativeness, the GWCT datasets usefully complement other UK bird monitoring schemes. Key words: Galliformes, bag statistics, long-term trend, index, abundance, productivity, UK. Nicholas J. Aebischer* & David Baines, The Game & Wildlife Conservation Trust, Fordingbridge, Hampshire, SP6 1EF, UK. * Corresponding author: [email protected] An understanding of how bird numbers and pro- ductivity change over time is crucial to effective conservation and management. This is especially true for huntable species such as gamebirds, which can be of considerable economic impor- tance but can also be vulnerable to overshoot- ing. Indeed, for these species, the European Union’s Birds Directive (79/409/EEC) requires its member states to ensure that hunting is com- patible with maintaining their populations at a satisfactory level, and complies with the princi- ples of wise use and ecologically balanced con- trol. Implicit in these requirements is the need, at the very least, to monitor population change. In the UK, unlike in North America and much of Europe, ownership of land extends to the game living on the land (Strutt 1801, Myr- berget 1991). As a result, game has historically been an important source of revenue for UK es- tates (Tapper 1992). For more than two centu- ries many estates have, as part of game manage- ment, monitored local game abundance and pro- ductivity through counts and numbers shot (the “bag”). Middleton (1934) made a first attempt to collate UK game bag data as well as building a national picture of game abundance (Middleton 1935, 1936, 1937). After the Second World War, he revived a survey of UK sporting estates begun in 1938, and in 1961 he formally established the National Gamebag Census and Partridge Count Scheme. These were administered by the then Game Research Association, now The Game & Wildlife Conservation Trust (GWCT). The GWCT’s long-term datasets therefore fall into two categories. The datasets within the National Gamebag Census are based on num- bers of birds shot annually by hunters. Because of the length of the time series, some of which start in the 19th century, they provide a unique insight into historical trends, but reflect hunt- ing effort as well as species abundance. By con- trast, the datasets within the GWCT Count
Transcript of Monitoring gamebird abundance and productivity in the UK ... · Índex de densitat de captures de...

Revista Catalana d’Ornitologia 24:30-43, 2008
Monitoring gamebird abundanceand productivity in the UK:The GWCT long-term datasets
Nicholas J. Aebischer & David Baines
Because of the economic importance of gamebirds, land owners and game managers have
long been interested in monitoring local abundance and productivity through counts and
bag statistics. The National Gamebag Census (NGC) and Partridge Count Scheme (PCS) of
The Game & Wildlife Conservation Trust (GWCT) were formally established in 1961. The
NGC collects bag statistics on all game species from over 600 estates annually, and its records
extend back up to 200 years. The PCS collects information on abundance and productivity
of partridges from around 100 lowland estates annually since 1933. The count programme
was extended in 1971 to monitor abundance and productivity of upland grouse. Using these
data, we present long-term trends for five huntable bird species, several of which are poorly
covered by other national schemes. Despite potential difficulties of interpretation due to
shooting pressure and representativeness, the GWCT datasets usefully complement other
UK bird monitoring schemes.
Key words: Galliformes, bag statistics, long-term trend, index, abundance, productivity,
UK.
Nicholas J. Aebischer* & David Baines, The Game & Wildlife Conservation Trust,
Fordingbridge, Hampshire, SP6 1EF, UK.
* Corresponding author: [email protected]
An understanding of how bird numbers and pro-ductivity change over time is crucial to effectiveconservation and management. This is especiallytrue for huntable species such as gamebirds,which can be of considerable economic impor-tance but can also be vulnerable to overshoot-ing. Indeed, for these species, the EuropeanUnion’s Birds Directive (79/409/EEC) requiresits member states to ensure that hunting is com-patible with maintaining their populations at asatisfactory level, and complies with the princi-ples of wise use and ecologically balanced con-trol. Implicit in these requirements is the need,at the very least, to monitor population change.
In the UK, unlike in North America andmuch of Europe, ownership of land extends tothe game living on the land (Strutt 1801, Myr-berget 1991). As a result, game has historicallybeen an important source of revenue for UK es-tates (Tapper 1992). For more than two centu-ries many estates have, as part of game manage-
ment, monitored local game abundance and pro-ductivity through counts and numbers shot (the“bag”). Middleton (1934) made a first attemptto collate UK game bag data as well as building anational picture of game abundance (Middleton1935, 1936, 1937). After the Second World War,he revived a survey of UK sporting estates begunin 1938, and in 1961 he formally established theNational Gamebag Census and Partridge CountScheme. These were administered by the thenGame Research Association, now The Game &Wildlife Conservation Trust (GWCT).
The GWCT’s long-term datasets thereforefall into two categories. The datasets within theNational Gamebag Census are based on num-bers of birds shot annually by hunters. Becauseof the length of the time series, some of whichstart in the 19th century, they provide a uniqueinsight into historical trends, but reflect hunt-ing effort as well as species abundance. By con-trast, the datasets within the GWCT Count

Monitoring gamebird in UK
31
Schemes are based on intensive spring and au-tumn counts of live birds on the ground. Theyprovide accurate measurements of density andproductivity, but the number of sites is limitedand not random.
These datasets are of interest because thespan of time that they cover is considerably great-er than that of other UK bird monitoringschemes, and often the species involved are poor-ly covered by other national schemes. In thispaper, we present trends in abundance and pro-ductivity of five huntable species extending backover at least a century, and discuss the reliabili-ty of such trends in relation to other UK schemes.
Materials and methods
National Gamebag Census
The GWCT’s National Gamebag Census (NGC)is a voluntary scheme that currently collects bagstatistics on all game species from over 600 UKestates annually (Tapper 1992). At the end ofeach shooting season, each participant com-pletes a form detailing the numbers of each spe-cies shot, numbers released, numbers of shootdays, estate area and, in the case of upland es-tates, moorland area. In many cases, additionaldata extracted from game books extend the timeseries back to at least the 19th century.
GWCT Count Schemes
The GWCT’s Partridge Count Scheme (PCS)collects information on annual abundance andproductivity of the Grey Partridge Perdix perdix
and Red-legged Partridge Alectoris rufa. It is avoluntary scheme, based on intensive counts ofpairs in spring and counts of young and old birdsin the autumn. Counting takes place at dawn anddusk, using a 4-wheel-drive vehicle to drivearound field edges and criss-cross stubbles. Re-turns are annual, and include the area counted.From 1933 to 1998, the scheme involved around100 lowland estates mainly in the east and southof England (Potts 1980, Potts & Aebischer 1995).Since 1999, it has been expanded as part of theGWCT’s commitment to the UK Grey PartridgeSpecies Action Plan and by spring 2004 therewere around 1,350 registered participants (Aeb-ischer & Ewald 2004). Potts (1986) showed how
it was possible to estimate Grey Partridge chicksurvival rate to six weeks based on brood counts.
In the British uplands, the GWCT beganmonitoring the abundance and productivity ofRed Grouse Lagopus lagopus scoticus in 1971 inEngland and 1976 in Scotland (Hudson 1992).Counts are carried out by professionals in Marchand July on blocks of moorland of approximately1 km2, using pointer dogs to locate birds eitherside of transects roughly 200 m apart. Althoughthe total number of sites counted exceeds 150,only a core of 35 sites has been counted for 15years or more. Counts of Black Grouse Tetrao
tetrix began in 1991, involving spring counts ofmales at leks and, as for Red Grouse, dog countsof adults and broods in late July and August(Baines 1996).
Statistical analysis
For this paper, data were analysed for five of thespecies covered by the NGC, namely Grey Par-tridge, Red Grouse, Black Grouse, Snipe Gallin-
ago gallinago and Woodcock Scolopax rusticola.These are all species that are red- or amber-list-ed as UK Birds of Conservation Concern (Gre-gory et al. 2002), which occurred on fewer than10% of squares surveyed by the British Trust forOrnithology (BTO) in its Breeding Bird Surveyof 2003 (Raven et al. 2004), and for which NGCdata extend back to at least 1900.
NGC bag returns from 1900 to 2002 for eachspecies were analysed by generalised linear mod-elling (McCullagh & Nelder 1996) with estateand year as factors, using a Poisson error ad-justed for overdispersion and a logarithmic linkfunction. The logarithm of estate area (GreyPartridge, Snipe, Woodcock) or of moorlandarea (Red Grouse, Black Grouse) was specifiedas an offset so that the dependent variable waseffectively bag density. An index of bag densitywas obtained by exponentiation of the coeffi-cients estimated for the year factor, expressedrelative to the first year of the series. Approxi-mate standard errors of the index values werederived from those of the year coefficients byTaylor series linearisation (Seber 1982). Asmoothed trend line was fitted to the series ofindex values using a cubic smoothing splinefunction of time with 12 effective degrees offreedom (Hastie & Tibshirani 1990). For each

N. J. Aebischer & D. Baines
32
Revista Catalana d’Ornitologia 24 (2008)
Figure 2. Number of estates contributing bag data on the Grey Partridge to the GWCT’s National Gamebag
Census in each of the years 1900 to 2002.
Nombre de finques que han contribuït amb dades de caça de Perdiu Xerra al Cens Nacional de Caça per a
cadascun dels anys del període 1900-2002.
Figure 1. Grey Partridge index of bag density from the GWCT’s National Gamebag Census, 1900-2002 (data
from 1,180 estates). The thick line represents the long-term trend, while the error bars indicate ± 1 s.e.
Índex de densitat de captures de Perdiu Xerra a partir de les dades del Cens Nacional de Caça 1900-2002
(dades de 1.180 finques). La línia gruixuda representa la tendència a llarg termini i les barres indiquen ± 1 e.s.

Monitoring gamebird in UK
33
species, estates that provided one year of dataonly were omitted, as were years when no or nilbags were given. Historical data were particu-larly good for Grey Partridge, so for this specieswe carried out an additional analysis of bag re-turns from 1803 to 2002. GWCT CountScheme data for Grey Partridge and Red Grousewere analysed in the same way, using site andyear as factors and the logarithm of the areacounted as offset. To maintain data consisten-cy, PCS sites acquired as part of the recent ex-pansion were not included in the analysis. Allanalyses were carried out using Genstat 7.1(Numerical Algorithms Group, Oxford, UK).
Results
Trends from the National Gamebag Census
We report below the trends over the whole ofthe last century for Grey Partridge, Red Grouse,
Black Grouse, Snipe and Woodcock. For all spe-cies we report the total number of estates con-tributing data during that period, and, for illus-trative purposes, we give the number of estatescontributing data in each year for Grey Par-tridge.
Grey Partridge
Between 1900 and 2002, a total of 1,180 es-tates provided data on Grey Partridge bags.Despite strong fluctuations, average bag densi-ty remained high until the Second World War,fell by around two-thirds until the early 1960s,then collapsed (Figure 1). This pattern corre-sponds to the well-known decline of the GreyPartridge described by Potts (1986), wherebypartridge management was only partially re-sumed after World War II, and the introduc-tion of herbicides in the 1950s disrupted thepartridge food chain. The number of estatescontributing data in any one year was over 100in all years except those corresponding to the
Figure 3. Grey Partridge index of bag density from the GWCT’s National Gamebag Census, 1803-2002 (data
from 1,189 estates). The thick line represents the long-term trend.
Índex de densitat de captures de Perdiu Xerra a partir de les dades del Cens Nacional de Caça 1803-2002
(dades de 1.189 finques). La línia gruixuda representa la tendència a llarg termini.

N. J. Aebischer & D. Baines
34
Revista Catalana d’Ornitologia 24 (2008)
Figure 4. Red Grouse index of bag density from the GWCT’s National Gamebag Census, 1900-2002 (data
from 495 estates). The thick line represents the long-term trend, while the error bars indicate ± 1 s.e.
Índex de densitat de captures de la Perdiu d’Escòcia a partir de les dades del Cens Nacional de Caça 1900-2002
(dades de 495 finques). La línia gruixuda representa la tendència a llarg termini i les barres indiquen ± 1 e.s .
Second World War (minimum 86 in 1944), butwas as high as 572 in 1961 (Figure 2). The rel-atively steep decline in numbers of contribut-ing estates since 1961 matches the decline ofthe Grey Partridge, and in all likelihood resultsfrom the cessation of Grey Partridge shootingas the bird’s numbers dwindled.
To put the changes in bag density into his-torical context, Figure 3 shows how the indexchanged since 1803. Although data were avail-able for fewer than 20 estates before 1860, thepattern of change over the two centuries cor-responds well to what is known about the riseand fall of the Grey Partridge as a gamebird inthe UK (Tapper 1992, Holloway 1996). Dur-ing the 19th century, the agricultural revolu-tion led to an increase in the arable habitatsfavoured by partridges, land enclosure provid-ed hedgerows and hence nesting habitat, andpredator eradication reduced mortality. As aresult, numbers of partridges soared, and par-tridge management for shooting became wide-
spread. Nevertheless, bag density at the end ofthe 20th century fell far below that at the startof the 19th century.
Red Grouse
Between 1900 and 2002, a total of 495 estatesprovided data on Red Grouse bags. The bagsexhibit strong fluctuations from year to year, butnevertheless there is a clear trend of high bagsup to the Second World War, a collapse in num-bers shot during the War itself, followed by apartial recovery until the early 1970s, then afurther decline over thirty years that is of theorder of -40% (Figure 4). This pattern reflectsthe intensive moorland management for grousecarried out by the Victorians and Edwardians,which involved predator eradication and rota-tional heather burning to produce a patchworkof small areas with heather growth of differentages. Grouse management was largely aban-doned during World War II, but recovered un-der a push for moorland restoration; from the

Monitoring gamebird in UK
35
mid-1970s, however, increasing pressure fromovergrazing, afforestation and predators nega-tively influenced grouse abundance and bags(Tapper 1992, Holloway 1996).
Black Grouse
Between 1900 and 2002, a total of 215 estatesprovided data on Black Grouse bags. The bagsshow a massive decline, starting already duringthe First World War, then collapsing almostcompletely just before and during the SecondWorld War (Figure 5). It is thought that thedecline began as farming gradually improved onthe moorland fringes (Tapper 1992). The col-lapse during World War II may reflect the in-tensification of farming during the War coupledwith the abandonment of Red Grouse manage-ment on moorland. Since then, although youngforestry plantations have provided temporaryhabitat, overgrazing by sheep and deer exacer-bated by predation is probably responsible forthe lack of recovery (Baines 1996).
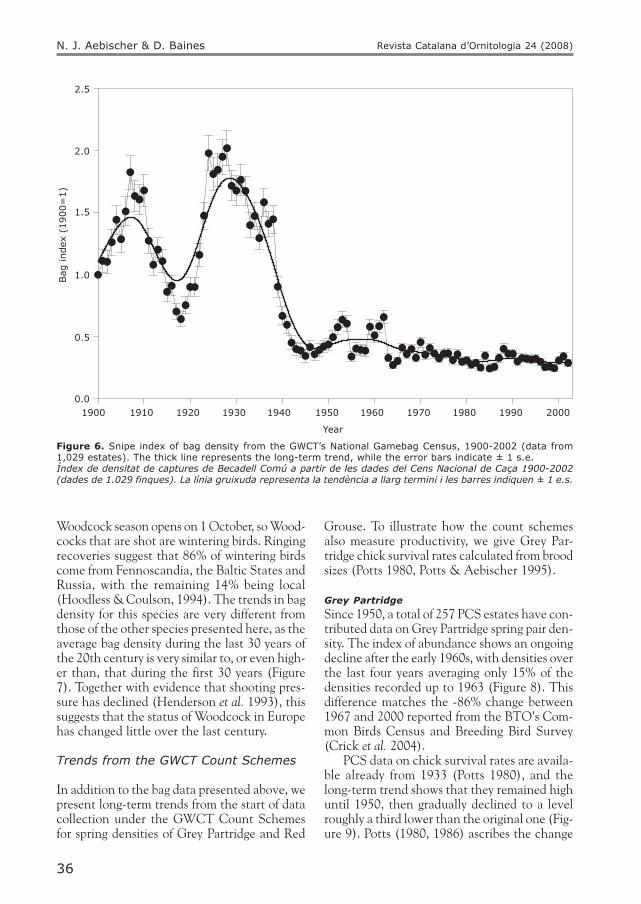
Snipe
Between 1900 and 2002, a total of 1,029 es-tates provided data on Snipe bags. Bags are de-rived primarily from wintering birds, and evi-dence from ringing indicates that the vastmajority of birds wintering in the UK come fromnorthern and eastern continental Europe(Wernham et al. 2002). The general trend is foran increase up to the Second World War, albeitwith a dip corresponding to the First World War,followed by a collapse and ongoing declinethroughout the second half of the 20th century(Figure 6). This pattern is the inverse of profit-able farming and the land drainage and culti-vation that went with it (Tapper 1992). As aresult of the loss of wetlands and damp mead-ows, it seems that the UK now has very limitedappeal to wintering Snipe.
Woodcock
Between 1900 and 2002, a total of 1,290 es-tates provided data on Woodcock bags. The
Figure 5. Black Grouse index of bag density from the GWCT’s National Gamebag Census, 1900-2002 (data
from 215 estates). The thick line represents the long-term trend, while the error bars indicate ± 1 s.e.
Índex de densitat de captures del Gall de Cua Forcada a partir de les dades del Cens Nacional de Caça 1900-2002
(dades de 215 finques). La línia gruixuda representa la tendència a llarg termini i les barres indiquen ± 1 e.s .
N. J. Aebischer & D. Baines
36
Revista Catalana d’Ornitologia 24 (2008)
Figure 6. Snipe index of bag density from the GWCT’s National Gamebag Census, 1900-2002 (data from
1,029 estates). The thick line represents the long-term trend, while the error bars indicate ± 1 s.e.
Índex de densitat de captures de Becadell Comú a partir de les dades del Cens Nacional de Caça 1900-2002
(dades de 1.029 finques). La línia gruixuda representa la tendència a llarg termini i les barres indiquen ± 1 e.s.
Woodcock season opens on 1 October, so Wood-cocks that are shot are wintering birds. Ringingrecoveries suggest that 86% of wintering birdscome from Fennoscandia, the Baltic States andRussia, with the remaining 14% being local(Hoodless & Coulson, 1994). The trends in bagdensity for this species are very different fromthose of the other species presented here, as theaverage bag density during the last 30 years ofthe 20th century is very similar to, or even high-er than, that during the first 30 years (Figure7). Together with evidence that shooting pres-sure has declined (Henderson et al. 1993), thissuggests that the status of Woodcock in Europehas changed little over the last century.
Trends from the GWCT Count Schemes
In addition to the bag data presented above, wepresent long-term trends from the start of datacollection under the GWCT Count Schemesfor spring densities of Grey Partridge and Red
Grouse. To illustrate how the count schemesalso measure productivity, we give Grey Par-tridge chick survival rates calculated from broodsizes (Potts 1980, Potts & Aebischer 1995).
Grey Partridge
Since 1950, a total of 257 PCS estates have con-tributed data on Grey Partridge spring pair den-sity. The index of abundance shows an ongoingdecline after the early 1960s, with densities overthe last four years averaging only 15% of thedensities recorded up to 1963 (Figure 8). Thisdifference matches the -86% change between1967 and 2000 reported from the BTO’s Com-mon Birds Census and Breeding Bird Survey(Crick et al. 2004).
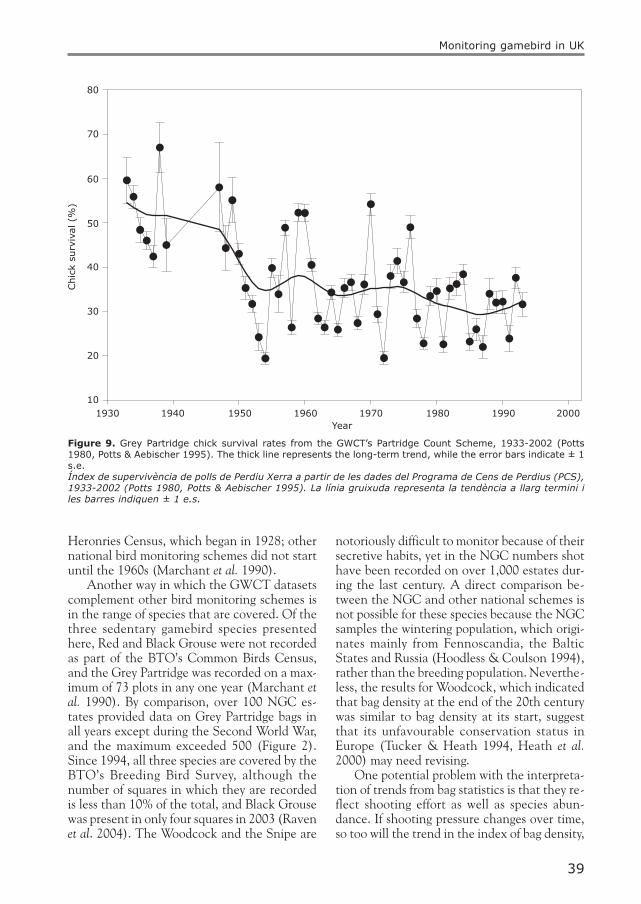
PCS data on chick survival rates are availa-ble already from 1933 (Potts 1980), and thelong-term trend shows that they remained highuntil 1950, then gradually declined to a levelroughly a third lower than the original one (Fig-ure 9). Potts (1980, 1986) ascribes the change

Monitoring gamebird in UK
37
in chick survival rate to the use of herbicideson cereals; this destroyed the weedy understo-rey that supports the invertebrates that chickseat and depend on for survival during the firsttwo weeks of life.
Red Grouse
Red Grouse counts were initiated in 1971, sincewhen spring density has been measured on atotal of 166 sites. There has been no detectablelong-term trend in spring density over the 32years covered by the count scheme (Figure 10).
Relevance and representativeness of
GWCT datasets
Being based on numbers of birds shot, the trendsfrom the NGC may reflect hunting effort rath-er then species abundance. Likewise, neither theNGC estates nor the GWCT Count Schemesites have been chosen at random, so the trendsthat they express may not be representative of
the national picture. Although a detailed con-sideration of these issues is beyond the scope ofthis paper, we present below information on bothaspects that suggests that, in some cases at least,the problems of interpretation that they implyare minor.
Do bags measure abundance?
This issue was examined by Hudson (1992) inthe case of Red Grouse. He showed that, on alogarithmic scale, there was a linear relation-ship between the density of birds present inAugust and the number shot per unit area suchthat August density explained 60% of the vari-ation in number shot (Figure 11). The implica-tion is therefore that grouse bags may be suc-cessfully used as a surrogate measure of grouseabundance.
How representative are the data?
Potts (1986) showed that Grey Partridge chicksurvival rate was a key factor sensu Varley &
Figure 7. Woodcock index of bag density from the GWCT’s National Gamebag Census, 1900-2002 (data from
1,290 estates). The thick line represents the long-term trend, while the error bars indicate ± 1 s.e.
Índex de densitat de captures de Becada a partir de les dades del Cens Nacional de Caça 1900-2002 (dades
de 1.290 finques). La línia gruixuda representa la tendència a llarg termini i les barres indiquen ± 1 e.s.

N. J. Aebischer & D. Baines
38
Revista Catalana d’Ornitologia 24 (2008)
Figure 8. Grey Partridge index of pair density from the GWCT’s Partridge Count Scheme, 1950-2002 (data
from 257 estates). The thick line represents the long-term trend, while the error bars indicate ± 1 s.e.
Índex de densitat de parelles de Perdiu Xerra a partir de les dades del Programa de Cens de Perdius (PCS),
1950-2002 (dades de 257 finques). La línia gruixuda representa la tendència a llarg termini i les barres
indiquen ± 1 e.s.
Gradwell (1963). If the PCS data were repre-sentative, it would be expected that annualchick survival rates calculated from the PCSwould tally with an independent measure ofGrey Partridge annual population change. Us-ing population change measured by the BTO’sCommon Birds Census, Aebischer & Ewald(2004) demonstrated that, indeed, the annualchange in Grey Partridge abundance was close-ly related to PCS chick survival rates (68% ofvariation explained; Figure 12). For this species,it seems clear that the PCS provides adequatenational representation.
Discussion and conclusion
The existence of the NGC and of the GWCT’sCount Schemes is probably one of the best-keptsecrets in the UK. The aim of this paper is todraw attention to the existence of these GWCTdatasets, which in many ways complement oth-
er widely quoted datasets such as those held bythe BTO. The NGC, for instance, provides ahistorical context and a long-term view span-ning at least a century for most game species.Indeed, as shown in Figure 3, the span is of twocenturies for the Grey Partridge. This revealedthat the ongoing decline since the Second WorldWar was only part of the picture, that there hadbeen large-scale increases during the course ofthe 19th century, but that nevertheless currentlevels are much lower than levels at the start ofthe 19th century. Data on Grey Partridge pro-ductivity, from the PCS, extend back 70 years,and clearly demonstrate the change that hastaken place in chick survival rate with the in-tensification of agriculture in the 1950s. Aschick survival is a key factor in determining pop-ulation change (Figure 12), being able to meas-ure it over such a long period is invaluable whenseeking to identify causes of decline (Potts 1980,Potts 1986). The only other UK bird survey thatapproaches similar lengths of time is the BTO’s
Monitoring gamebird in UK
39
Heronries Census, which began in 1928; othernational bird monitoring schemes did not startuntil the 1960s (Marchant et al. 1990).
Another way in which the GWCT datasetscomplement other bird monitoring schemes isin the range of species that are covered. Of thethree sedentary gamebird species presentedhere, Red and Black Grouse were not recordedas part of the BTO’s Common Birds Census,and the Grey Partridge was recorded on a max-imum of 73 plots in any one year (Marchant et
al. 1990). By comparison, over 100 NGC es-tates provided data on Grey Partridge bags inall years except during the Second World War,and the maximum exceeded 500 (Figure 2).Since 1994, all three species are covered by theBTO’s Breeding Bird Survey, although thenumber of squares in which they are recordedis less than 10% of the total, and Black Grousewas present in only four squares in 2003 (Ravenet al. 2004). The Woodcock and the Snipe are
notoriously difficult to monitor because of theirsecretive habits, yet in the NGC numbers shothave been recorded on over 1,000 estates dur-ing the last century. A direct comparison be-tween the NGC and other national schemes isnot possible for these species because the NGCsamples the wintering population, which origi-nates mainly from Fennoscandia, the BalticStates and Russia (Hoodless & Coulson 1994),rather than the breeding population. Neverthe-less, the results for Woodcock, which indicatedthat bag density at the end of the 20th centurywas similar to bag density at its start, suggestthat its unfavourable conservation status inEurope (Tucker & Heath 1994, Heath et al.2000) may need revising.
One potential problem with the interpreta-tion of trends from bag statistics is that they re-flect shooting effort as well as species abun-dance. If shooting pressure changes over time,so too will the trend in the index of bag density,
Figure 9. Grey Partridge chick survival rates from the GWCT’s Partridge Count Scheme, 1933-2002 (Potts
1980, Potts & Aebischer 1995). The thick line represents the long-term trend, while the error bars indicate ± 1
s.e.
Índex de supervivència de polls de Perdiu Xerra a partir de les dades del Programa de Cens de Perdius (PCS),
1933-2002 (Potts 1980, Potts & Aebischer 1995). La línia gruixuda representa la tendència a llarg termini i
les barres indiquen ± 1 e.s.

N. J. Aebischer & D. Baines
40
Revista Catalana d’Ornitologia 24 (2008)
Figure 10. Red Grouse index of spring density from the GWCT’s Grouse Count Scheme, 1971-2002 (data
from 166 estates). The thick line represents the long-term trend, while the error bars indicate ± 1 s.e.
Índex de densitat primaveral de Perdiu d’Escòcia a partir de les dades del Programa de Cens de Perdius de
muntanya (GCS), 1971-2002 (dades de 166 finques). La línia gruixuda representa la tendència a llarg termini
i les barres indiquen ± 1 e.s.
even if abundance remains constant. Althoughchanges in the number of shooters in the UKremains poorly known (most recently estimat-ed at 750,000 in 1990 – Harradine 1992), thesystem of game ownership, whereby game be-longs to the owner of the land where it is found,and the tradition of driven shooting have re-mained constant for at least 200 years (Tapper1992). These factors, far more than the numberof shooters, will determine shooting pressure.Where the data exist to link bag statistics togamebird density, as in the case of the RedGrouse (Figure 11; Hudson 1992), the relation-ship between the two appears good. This hasbeen confirmed with more sophisticated analy-ses by Cattadori et al. (2003). A recent exami-nation of the NGC data on mammalian gamefound that for species covered by other moni-toring schemes, such as Rabbit Oryctolagus cu-niculus, there was a good match between trendsin annual population indices (Whitlock et al.
2003). It would appear, therefore, that popula-
tion indices of huntable species derived frombags are influenced relatively little by shootingeffort, which is encouraging.
Another potential problem with the GWCTlong-term datasets is that the estates and sitesthat contribute records, either bags or counts,have not been chosen at random within thecountryside, and so the trends generated fromthem may not reflect national population trends.We believe that this is certainly an issue withthe Red Grouse counts, which, because of theirintensive nature, are concentrated on only asmall number of core sites corresponding to well-managed grouse moors. This would explain whythe downward trend apparent in the index ofbag density since 1970 (Figure 4) is absent fromthe count index (Figure 10). The bags them-selves come from estates with a much broadergeographical coverage than the counts, equiva-lent to over a third of overall grouse moorlandin the UK (Hudson 1992). This range includesestates where grouse were shot historically, but

Monitoring gamebird in UK
41
where densities are now too low for shooting totake place, so is likely to capture much of thegenuine variation in the UK Red Grouse popu-lation. A similarly broad coverage exists for low-land estates, of which over 1,000 have contrib-uted bags to the NGC, and over 250 havecontributed counts to the PCS. Indeed, thestrong relationship between annual productivi-ty and population change of the Grey Partridgein the UK measured using independent datasets(Figure 12) gives reassurance that these countsembody the changes that have taken place inthe wider countryside (Aebischer & Ewald2004).
In conclusion, we believe that the potentialproblems of interpretation associated with theNGC and GWCT count schemes are, in mostcases, relatively minor. The GWCT long-termdatasets provide an invaluable window into thepast, and usefully complement other UK birdmonitoring schemes for the present and the fu-ture.
Acknowledgements
Without the kind and dedicated participation of
keepers, farmers and landowners who have provid-
ed returns over all these years, neither the National
Gamebag Census nor the Partridge Count Scheme
would exist: we are most grateful to them all. We
thank also all members of GWCT staff who have
been responsible for setting up and maintaining the
schemes as well as collecting data for them.
Resum
El seguiment de l’abundància i la
productivitat dels ocells cinegètics al
Regne Unit: Les bases de dades a llarg
termini de la Game & Wildlife
Conservation Trust
A causa de la importància econòmica de la caça, els
propietaris de finques i els administradors de l’acti-
vitat cinegètica han estat durant molt temps inte-
ressats en el seguiment de l’abundància i la produc-
tivitat locals a través de comptatges i estadístiques
de caça. El Cens Nacional de Caça (NGC) i el Pro-
grama de Cens de Perdius (PCS) de la Game & Wil-
dlife Conservation Trust es van establir oficialment
l’any 1961. El NGC recopila anualment estadístiques
de totes les espècies cinegètiques de més de 600 fin-
ques, i la seva activitat té més de 200 anys d’història.
Des de 1933, el PCS recull anualment informació
sobre l’abundància i la productivitat de les perdius
de les terres baixes d’unes 100 finques. El programa
de cens es va ampliar el 1971 per determinar l’abun-
dància i la productivitat dels galls de muntanya. Uti-
litzant aquestes dades, es presenten les tendències a
llarg termini de cinc espècies d’ocells cinegètics, al-
gunes de les quals estan mal representades en d’altres
projectes de seguiment d’escala nacional. Tot i les
possibles dificultats d’interpretació a causa de la
mateixa pressió cinegètica i dels problemes de repre-
sentativitat, les bases de dades de la Game & Wildli-
fe Conservation Trust resulten d’utilitat per comple-
mentar els altres programes de seguiment d’ocells del
Regne Unit.
Figure 11. Red Grouse annual bag density in relation
to the annual density of Red Grouse in August (source:
Hudson 1992).
Densitat anual de captures de Perdiu d’Escòcia en
relació a la densitat anual de perdius d’Escòcia durant
el mes d’agost (font: Hudson 1992).
Figure 12. Grey Partridge annual population change
(from the BTO’s Common Birds Census) in relation
to productivity, measured as annual chick survival
rates from the GWCT’s Partridge Count Scheme.
Canvi anual de població de Perdiu Xerra (a partir del
Programa de Cens d’Ocells Comuns de la BTO) en
relació a la productivitat, mesurada com a
supervivència anual de polls a partir de les dades del
Programa de Cens de Perdius (PCS).

N. J. Aebischer & D. Baines
42
Revista Catalana d’Ornitologia 24 (2008)
Resumen
El seguimiento de la abundancia y la
productividad de las aves cinegéticas en
el Reino Unido: Las bases de datos a
largo plazo de la Game & Wildlife
Conservation Trust
Debido a la importancia económica de la caza, los
propietarios de fincas y los administradores de la ac-
tividad cinegética han estado durante mucho tiem-
po interesados en el seguimiento de la abundancia y
la productividad local a través de conteos y estadís-
ticas de caza. El Censo Nacional de Caza (NGC) y
el Programa de Censo de Perdices (PCS) de la Game
& Wildlife Conservation Trust se estableció oficialmen-
te en 1961. El NGC recopila anualmente estadísti-
cas de todas las especies de caza de más de 600 fincas,
y su actividad se remonta a más de 200 años. Desde
1933, el PCS recoge anualmente información sobre
la abundancia y la productividad de las perdices de
las tierras bajas de alrededor de 100 fincas. El pro-
grama de censo se amplió en 1971 para determinar
la abundancia y la productividad de los gallos de
monte. Usando estos datos, se presentan las tenden-
cias a largo plazo de cinco especies de aves cinegéti-
cas, algunas de las cuales están mal representadas
en otros proyectos de seguimiento de escala nacio-
nal. A pesar de las posibles dificultades de interpre-
tación debido a la propia presión cinegética y los pro-
blemas de representatividad, las bases de datos de la
Game & Wildlife Conservation Trust resultan de utili-
dad para complementar a los otros programas de se-
guimiento de aves del Reino Unido.
References
Aebischer, N.J. & Ewald, J.A. 2004. Managing the
UK Grey Partridge Perdix perdix recovery: popu-
lation change, reproduction, habitat and shoot-
ing. Ibis 146 (suppl. 2): 181–191.
Baines, D. 1996. The implications of grazing and
predator management on the habitats and breed-
ing success of black grouse Tetrao tetrix. J. Appl.
Ecol. 33: 54–62.
Cattadori, I.M., Haydon, D.T., Thirgood, S.J. &
Hudson, P.J. 2003. Are indirect measures of
abundance a useful index of population density?
The case of red grouse harvesting. Oikos 100:
439–446.
Crick, H.Q.P., Marchant, J.H., Noble, D.G., Bail-
lie, S.R., Balmer, D.E., Beaven, L.P.,
Coombes, R.H., Downie, I.S., Freeman, S.N.,
Joys, A.C., Leech, D.I., Raven, M.J., Robin-
son, R.A. & Thewlis, R.M. 2004. Breeding Birds
in the Wider Countryside: Their Conservation
Status 2001. BTO Research Report No. 353. Thet-
ford: British Trust for Ornithology. (http://
www.bto.org/birdtrends)
Gregory, R.D., Wilkinson, N.I., Noble, D.G., Rob-
inson, J.A., Brown, A.F., Hughes, J., Procter,
D., Gibbons, D.W. & Galbraith, C.A. 2002. The
population status of birds in the United Kingdom,
Channel Islands and Isle of Man: an analysis of
conservation concern 2002-2007. Brit. Birds 95:
410–448.
Harradine, J. 1992. A profile of the British hunters
community. In Csányi, S. & Ernhaft, J. (eds.):
Trans. XXth Congr. IUGB. Pp. 678–684. Gödöl-
lö: University of Agricultural Sciences.
Hastie, T.J. & Tibshirani, R.J. 1990. Generalized
Additive Models. London: Chapman & Hall.
Heath, M.F., Borggreve, C. & Peet, N. 2000. Eu-
ropean Bird Populations: Estimates and Trends.
Birdlife Conservation Series no. 10. Cambridge:
Birdlife International.
Henderson, I.G., Peach, W.J. & Baillie, S.R. 1993.
The Hunting of Snipe and Woodcock in Europe.
BTO Research Report No. 115. Thetford: British
Trust for Ornithology.
Holloway, S. 1996. The Historical Atlas of Breeding
Birds in Britain and Ireland: 1875–1900. Lon-
don: Poyser.
Hoodless, A.N. & Coulson, J.C. 1994. Survival rates
and movements of British and Continental Wood-
cock Scolopax rusticola in the British Isles. Bird
Study 41: 48–60.
Hudson, P.J. 1992. Grouse in Space and Time: The
Population Biology of a Managed Gamebird. Ford-
ingbridge: The Game Conservancy Ltd.
Marchant, J.H., Hudson, R., Carter, S.P. & Whit-
tington, P. 1990. Population Trends in British
Breeding Birds. Tring: British Trust for Ornithology.
McCullagh, P. & Nelder, J.A. 1996. Generalized
Linear Models. 3rd edn. London: Chapman & Hall.
Middleton, A.D. 1934. Periodic fluctuations in Brit-
ish game populations. J. Anim. Ecol. 3: 231–249.
Middleton, A.D. 1935. The population of partridges
(Perdix perdix) in 1933 and 1934 in Great Brit-
ain. J. Anim. Ecol. 4: 137–145.
Middleton, A.D. 1936. The population of partridges
(Perdix perdix) in Great Britain during 1935. J.
Anim. Ecol. 5: 252–261.
Middleton, A.D. 1937. The population of partridges
(Perdix perdix) in Great Britain during 1936. J.
Anim. Ecol. 6: 318–321.
Myrberget, S. 1991. Game management in Europe
outside of the Soviet Union. In Bobek, B. Per-
zanowski, K. & Regelin, W. L. (eds.): Trans. XVI-
IIth Congr. IUGB. Vol. 1. Pp. 41–53. Kraków-
Warszawa: Swiat Press.
Potts, G.R. 1980. The effects of modern agriculture,
nest predation and game management on the
population ecology of partridges (Perdix perdix
and Alectoris rufa). Adv. Ecol. Res. 11: 1–79.
Potts, G.R. 1986. The Partridge: Pesticides, Preda-
tion and Conservation. London: Collins.
Potts, G.R. & Aebischer, N.J. 1995. Population
dynamics of the Grey Partridge Perdix perdix
1793-1993: monitoring, modelling and manage-
ment. Ibis 137 (suppl. 1): 29–37.
Raven, M.J., Noble, D.G. & Baillie, S.R. 2004. The
Breeding Bird Survey 2003. BTO Research Re-
port No. 363. Thetford: British Trust for Orni-
thology.

Monitoring gamebird in UK
43
Seber, G.A.F. 1982. The Estimation of Animal Abun-
dance and Related Parameters. 2nd edn. Lon-
don: Charles Griffin & Co.
Strutt, J. 1801. The Sports and Pastimes of the Peo-
ple of England. London: J. White.
Tapper, S.C. 1992. Game Heritage: An Ecological
Review from Shooting and Gamekeeping Records.
Fordingbridge: Game Conservancy Ltd.
Tucker, G.M. & Heath, M.F. 1994. Birds in Europe:
Their Conservation Status. BirdLife Conservation
Series no. 3. Cambridge: BirdLife International.
Varley, G.C. & Gradwell, G.R. 1963. The interpre-
tation of insect population changes. Proc. Ceylon
Assoc. Adv. Sci. 18 (D): 142–156.
Wernham, C.V., Toms, M.P., Marchant, J.H.,
Clark, J.A., Siriwardena, G.M. & Baillie, S.R.
2002. The Migration Atlas: Movements of the
Birds of Britain and Ireland. London: Poyser.
Whitlock, R.E., Aebischer, N.J. & Reynolds, J.C.
2003. The National Gamebag Census as a Tool
for Monitoring Mammal Abundance in the UK.
GWCT Research Report to Joint Nature Conser-
vation Committee. Fordingbridge: The Game Con-
servancy Trust.


![Dades sobre la biologia de l'àliga cuabarrada ('Hieraaetus ... · DADES SOBRE LA BIOLOGIA DE L'ALIGA CUABARRADA (HIERAAETUS FASCIATUS [VIEILL.]) A LA SERRALADA PRE-LITORAL CATALANA](https://static.fdocuments.in/doc/165x107/5f05a2597e708231d413efb0/dades-sobre-la-biologia-de-lliga-cuabarrada-hieraaetus-dades-sobre-la-biologia.jpg)


![FACULTAT DE CIENCIES I BIOCI ENCIES DEPARTAMENT DE ...Catal a Funcio de Densitat de Probabilitat, Funci o de Disribucio, mediana, estimaci o de parametres. ... exp[a 2 (x m + m x)];x](https://static.fdocuments.in/doc/165x107/6100094a45b0f84e0e1d54fe/facultat-de-ciencies-i-bioci-encies-departament-de-catal-a-funcio-de-densitat.jpg)