Monitoring & Evaluation: The KZN Province's Digital...
45
Monitoring & Evaluation: The KZN Province Monitoring & Evaluation: The KZN Province ’ ’ s Digital s Digital Nerve Centre Nerve Centre Rishila Moonilal & Shaun Emslie 8 September 2010
Transcript of Monitoring & Evaluation: The KZN Province's Digital...

Monitoring & Evaluation: The KZN ProvinceMonitoring & Evaluation: The KZN Province’’s Digital s Digital Nerve CentreNerve Centre
Rishila Moonilal & Shaun Emslie 8 September 2010

2
M&E serves as a management strategy to make visible the factors, within the larger socio-economic landscape of KZN ,that can shape and influence the results of Provincial Wide interventions towards the attainment of A better life for all.A better life for all.

3
Vision
Nerve Centre Vision is to provide a complete and comprehensive view of the delivery, performance and effectiveness of public services across the Province, as Provincial Government seeks to fulfill its detailed mandate through the Programme of Action by enhancing the Province’s ability to ensure that public sector goals, objectives and development outcomes are achieved through IT enabled systems driven by the Office of the Premier in partnership with SITA.


5
SAS Government Intelligence Platform
Version 1.4

6

7
KZN Provincial Nerve Centre
The Provincial Nerve Centre is a web designed tool tracking the Province's development trajectory. This trajectory is anchored using Business Intelligence and other solutions to track development information on a multilevel basisacross all spheres of Government. Nerve Centre Vision is to provide a complete and comprehensive view of the delivery, performance and effectiveness of public services across the Province, as Provincial Government seeks to fulfill its detailed mandate through the Programme of Action The Nerve Centre enhances the Province’s ability to ensure that public sector goals, objectives and development outcomes are achieved.

8
Nerve Centre’s Key Objectives
Enable a single view of the Province for the Premier. This single view will transcend Departmental boundaries and break down the silo approach through shared information management;Bridge the gap between strategic objectives and the execution on these objectives, linking objectives to tangible outcomes and thereby improving service delivery.
Enable the province to quantify and measure Provincial performance and ensure that current service levels are managed and achieved; and
Provide insight into sector improvements and integration opportunities, by providing trend analysis on the operational data marts.
Measure business success by the triple bottom line of people, planet and profit
9
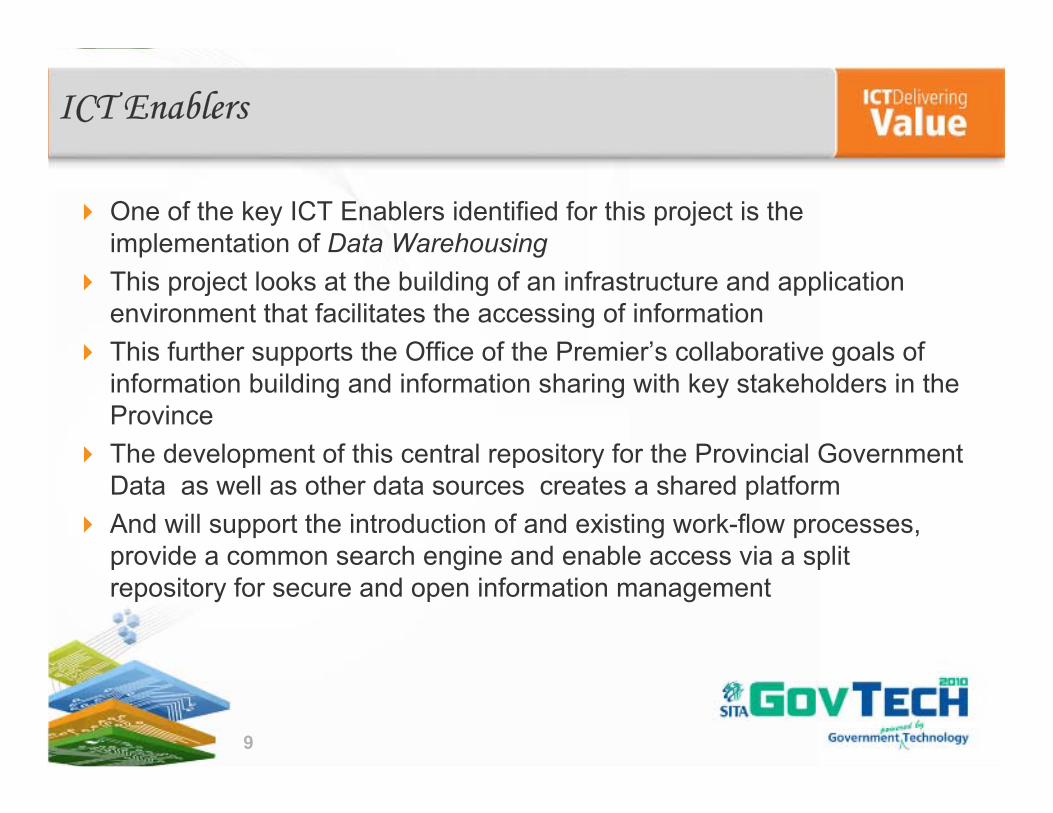
ICT Enablers
One of the key ICT Enablers identified for this project is the implementation of Data Warehousing This project looks at the building of an infrastructure and application environment that facilitates the accessing of information This further supports the Office of the Premier’s collaborative goals of information building and information sharing with key stakeholders in the ProvinceThe development of this central repository for the Provincial Government Data as well as other data sources creates a shared platform And will support the introduction of and existing work-flow processes, provide a common search engine and enable access via a split repository for secure and open information management

KZN PROGRAMME OF ACTION : Proposed Data Architecture
SAP
Venus
RDBMS
Data SourcesEx
trac
t, Tr
ansf
orm
and
Loa
dData
Acquisition
Single view KZNPG
Meta DataRepository
Extr
act,
Tran
sfor
m a
nd L
oad
For D
ata
Mar
ts
Works
FinanceTransport
Housing
Performance Management
Application Space
Data Marts Exploration and Delivery
Subject Area
Subject Area
Data Mart Space
Data Warehouse Management
Meta Data
Ad Hoc Query & Reports
Report Delivery & Alerting
Enterprise Reporting
Statistical Analysis & Data Mining
Porta
l
Meta Data Management
Decision Maker
BusinessAnalyst
PowerUser
Property
Data Quality
Software Configuration Management & Quality Control Change Control Process
Project Management
More Technical More Business
LegacySystems
HR
Other
Supplier Relationship
Provincial Nerve Centre

11
Leveraging ICT
ICT has a shared role in business processes as one of predominantly improving and enhancing quality of services, in additionE-government during the 21st Century will transform both the way in which public services are delivered and the fundamental relationship between governments, the community and citizens. ICT enabled systems driven by the Office of the Premier in partnership with SITA will extend accessibility of information within the KZN public sector through the Nerve CentreMoving Forward we envisage the ICT enablers to allow interface within the public domain especially the citizenry and, in so doing cut the impacts of 'distance' and 'time‘.

12
SITA’s Role
SITA has played a significant role in the Provincial Nerve Centre as the central intermediary for the Office of the Premier
Procurement (hardware, software and services)Project ManagementHosting, maintenance and support
Ongoing planning and implementationBusiness planningFacilitating access to national and provincial data sources and databasesFacilitating access for provincial users

KZN POVERTY WATCHKZN POVERTY WATCH
Building multidimensional poverty measures Building multidimensional poverty measures using analytics (2010 using analytics (2010 –– 2014)2014)
14
Nerve Centre Analysis
Specific analysis has been produced by the BI system on the Outcome Indicators derived from the Electoral Mandate expressed in the Medium Term Expenditure Framework.
A number of statistical analysis was completed on the Nerve Centre using multivariate analysis, regression and factor analysis showing multidimensional nature of poverty .

15
The Ideal StateThe Poverty Eradication Model for KZN
2010
16
The Ideal State - Poverty Eradication Model…
The model looks at three factors that are very useful in measuring poverty which are respectively
1 Human Development Index (HDI) which is defined as measure of a country’s development and it combines three basic measures:
Life expectancy at birth, as an index of population health and longevity
Knowledge and education, as measured by the adult literacy rate (with two-thirds weighting) and the combined primary, secondary, and tertiary gross enrollment ratio (with one-third weighting).
Standard of living, as measured by the natural logarithm of gross domestic product
17
2. Gini Coefficient which is defined as a measure of statistical dispersion, which is used to measure of inequality of income distribution or inequality of wealth distribution.
a. It is defined as a ratio with values between 0 and 1, where a low Gini coefficient indicates more equal income or wealth distribution, while a high Gini coefficient indicates more unequal distribution.– 0 corresponds to perfect equality– 1 corresponds to inequality
…Poverty Eradication Model

18
3. The Poverty Index scores which look at whole range of indicators and these indicators are defined in the table below.
4. Number of households that live on less than one dollar a day were used as reference point in the fight for poverty
…Poverty Eradication Model

19
Main Category Sub – Category Indicators
Economic Economic
Households with No Income Unemployment Levels Dependency Ratio (Total Population / Employed) Household with Income < 1600 pm
Social
Education / Literacy
Age 5-14 with No Schooling Age 20 + with No Schooling Age 20 + with No Matric
Demographic
Population Density (Population / km²) Elderly Population (Population > 65 years) Female Population (Female Population)Youth Population (Population 5-14 years)Disability
Table 1 and Table 2 show the Current situation and Ideal Situation…

20
Services
Services (Household Level)
Access to Piped Water 200m to Stand Pipe Sanitation Lighting using Electricity Telephone Refuse
Housing Informal
Social (Continued) Social Welfare
Head of Households – Child (Youth 5-19) Head of Households – Elderly (Over 65) Head of Household - Females Pension Payouts (Not Applicable – March
2005)
Main Category Sub – Category Indicators
…Table 1 and Table 2 show the Current situation and Ideal Situation

21
District Households living on Less than 1 dollar a day
Human Development Index
Poverty Score Gini Coefficient State
Amajuba 31,613 0.576 236 0.63 Current
eThekwini 217,284 0.687 64 0.59 Current
iLembe 28,352 0.533 408 0.58 Current
Sisonke 43,911 0.45 572 0.57 Current
Ugu 45,160 0.526 498 0.61 Current
uMgungundlovu 60,294 0.611 441 0.62 Current
uMkhanyakude 47,006 0.414 372 0.58 Current
uMzinyathi 36,272 0.437 447 0.6 Current
uThukela 53,583 0.494 521 0.61 Current
uThungulu 44,289 0.535 453 0.64 Current
Zululand 60,371 0.441 353 0.60 Current
KZN 668,135 0.52 397 0.60 Current
Table 2 Current situation

22
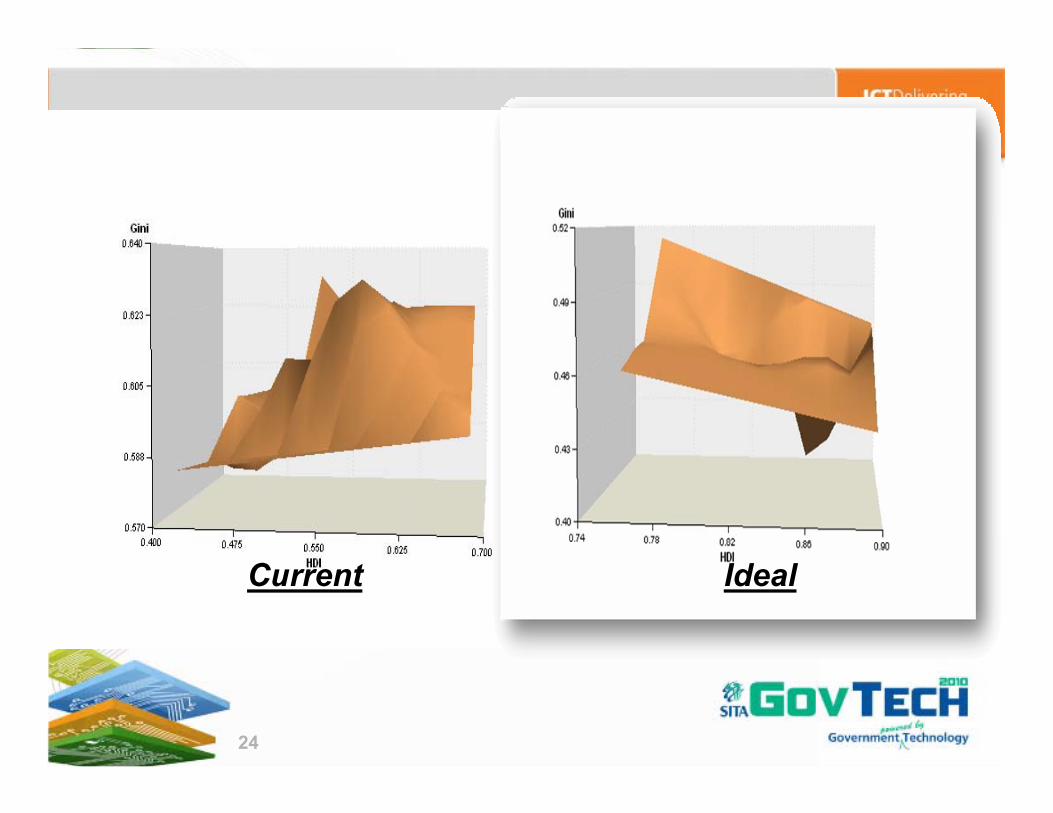
In KZN as per Community Survey 2007 the number of households living below the poverty line was 668,135 where it is defined as households that have no Income at all and those that have an income of less than R400 a month.For Human Development index is at an average of 0.52 for the province and the Gini Coefficient at a 0.60 and a poverty score added up to 397 for all metropolitan and districts municipalities.The Chart on the next slide shows the Gini Coefficient (Gini) in relation to the Human Development Index (HDI) and the poverty score as the depth of the situation.

23
Chart 1: Current Situation
24
Current Ideal

25
SOCIO-ECONOMIC STANCE FOR KWAZULU-NATAL
26
Methodology & Data
The analysis was derived at two levels: District and metropolitan areas and the second level included the local municipalities.
In the choosing of factors, as an example of the importance of each; population density plays an equally important role in service delivery as well dependency ratio of the particular district or local municipality.

27
Methodology & Data - continued
Using factor analysis socio- economic stance was graded from low to high using the real number scale that was bounded between 1 and 10 where 1 is the lowest and 10 being the highest on some factors, and other factors having a high of 3 and 5 respectively, and out that a composite index was composed.
The Area with the highest level of socio-economic stance would have a very low score relative to that area which has high score, meaning that the socio-economic stance for the particular region is high score is worse that drastic interventions need to carried out.

28
Factors
The factors and their relative scores were derived using Business Intelligence operating on the provincial Nerve Centre.Economic (focuses on Unemployment, Dependency Ratio, Household with Income < 1600 pm or Income)
Services (Access to Piped water, Sanitation, Telephone, Refuse, Lighting using Electricity)Education (Highest level of education for: Age 5 to 14 and Age 20 plus with no education, Age 20 plus no matric) Vulnerability :Pension Payouts, Heads of Household/Child, Headed households ; Female and ElderlyHousing ( Informal Housing)Demographic (Population density, Elderly, Youth and Female Population, and Disability)

29
The scores for each factor and maximum score for the index are outlined in the table below.
Indicators and Categories/Factors Max Score Group Score
Economic 25
Households with No Income 5
Unemployment Levels 5
Dependency Ratio (Total Population / Employed) 10
Household with Income < 1600 pm 5
Education (Highest Level of Education) 20
Age 5-14 with No Schooling 5
Age 20 + with No Schooling 10
Age 20 + with No Matric 5
Services (Household Level) 33
Access to Piped 10
Sanitation 10
Lighting using Electricity 5
Telephone 5
Refuse 3

30
Demographic 21
Population Density (Population / km²) 3
Elderly Population (Population > 65 years) 5
Female Population (Female Population) 5
Youth Population (Population 5 -14 years) 5
Disability 3
Housing 10
Informal 10
(Vulnerable Groups) 40
Head of Households - Child(Youth 5-19) 10
Head of Households - Elderly(Over 65) 10
Head of Household - Females 10
Pension Payouts 10
Total 149
The scores for each factor and maximum score for the index are outlined in the table below (Continued)

31
.
Chart 1: Provincial Wide Socio-Economic StatusThe radar charts used in the analysis focus on distinguishing features of the particular district, metro and local municipality.
Chart 1, illustrated the difference in the two years of measurement(2001 and 2007). eThekwini metro showed a particularly different pattern , where it shows relatively low scores of socio-economic factors.In 2007,An identification in vulnerability, with uThungulu and Umgungundlovu districts having the greatest increase the state. Housing scores showed a decrease . Zululand District showed a decline in the economic factor based on various issues such as unemployment levels.

32
Chart 2: Amajuba District
Amajuba experienced similar trends as the other districts in terms of vulnerability.Housing seems to be of importance in Amajuba .Services have not expanded significantly

33
Chart 5:uMngungundlovu District
Umgungundlovu District has experienced the same trend as the rest of the province in terms of Vulnerability and service delivery and other factors showing relative stable, and Mpofana Local Municipality taking the biggest knock in terms of Vulnerability .
Issues such as education and Economic stability have show very minute changes between period 2001 to 2007.

34
frenquency (monthly,daily,..)
Performance Measures
Access/ Quality/ Improvement
Monitoring and Evaluation: Poverty Watch
Set Alerts on Programs•Over Expenditure
•Project dates, timelines•Efficiency & effectiveness
35
Household Profiling
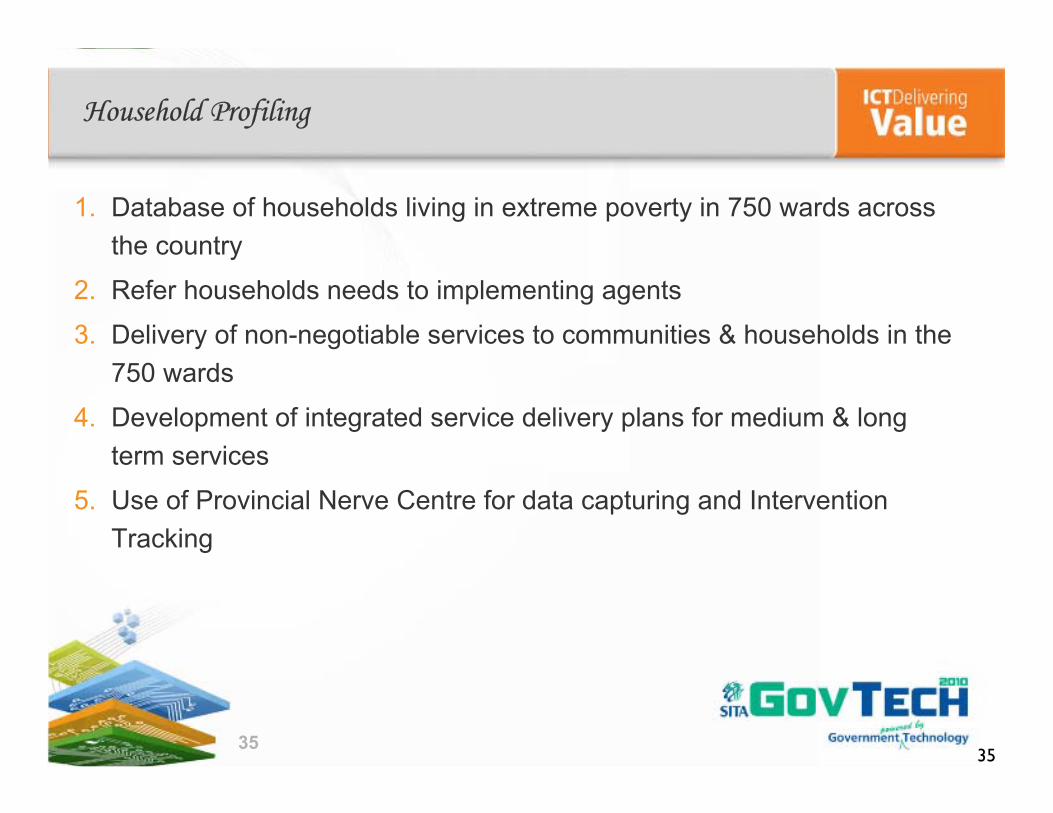
1. Database of households living in extreme poverty in 750 wards across the country
2. Refer households needs to implementing agents
3. Delivery of non-negotiable services to communities & households in the 750 wards
4. Development of integrated service delivery plans for medium & long term services
5. Use of Provincial Nerve Centre for data capturing and Intervention Tracking
35

36
Household Monitoring & Graduation
The 39+ Point System is a tool for classifying households who enter the programme and those that exit it or graduate out of poverty making it possible to prioritise and select beneficiaries for the various social programmes
37
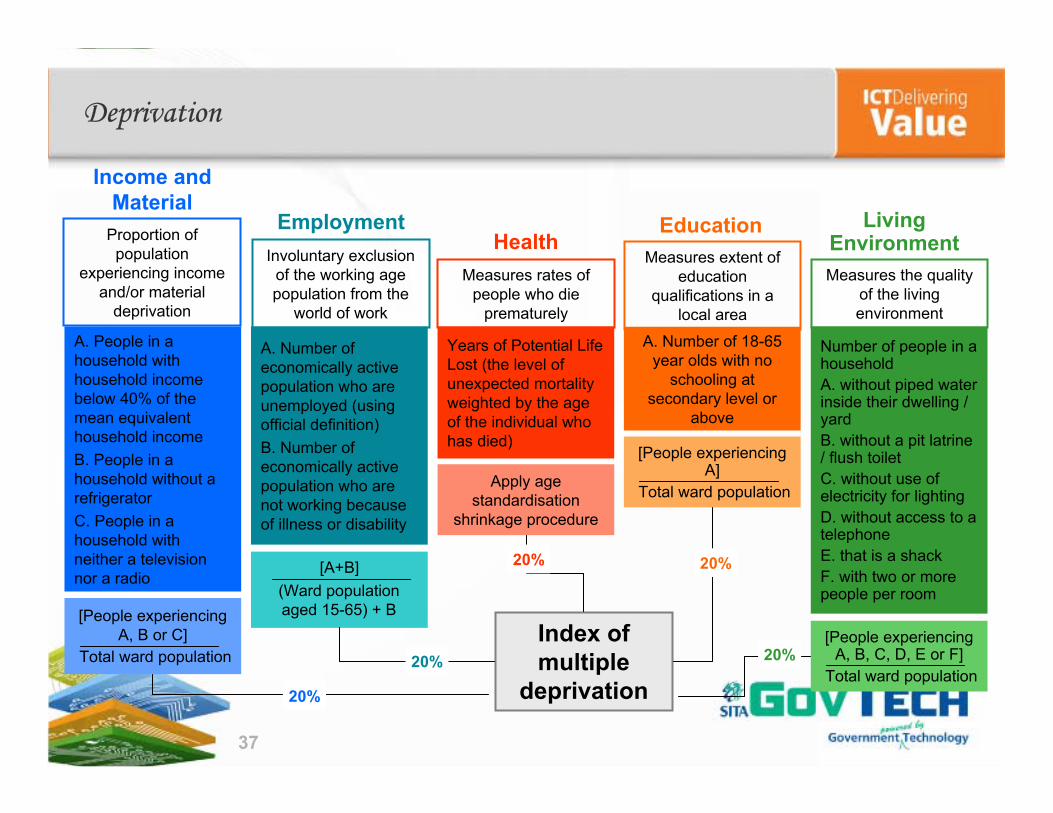
Deprivation
Income and Material
EmploymentHealth
Years of Potential Life Lost (the level of unexpected mortality weighted by the age of the individual who has died)
A. Number of economically active population who are unemployed (using official definition)B. Number of economically active population who are not working because of illness or disability
A. People in a household with household income below 40% of the mean equivalent household incomeB. People in a household without a refrigeratorC. People in a household with neither a television nor a radio
Proportion of population
experiencing income and/or material
deprivation
Involuntary exclusion of the working age population from the
world of work
Measures rates of people who die
prematurely
[People experiencing A, B or C]
[A+B]
Total ward population
(Ward population aged 15-65) + B
Education
A. Number of 18-65 year olds with no
schooling at secondary level or
above
Measures extent of education
qualifications in a local area
Living Environment
Number of people in a household A. without piped water inside their dwelling / yard B. without a pit latrine / flush toiletC. without use of electricity for lighting D. without access to a telephoneE. that is a shackF. with two or more people per room
Measures the quality of the living environment
[People experiencing A, B, C, D, E or F]
Total ward population
[People experiencing A]
Total ward populationApply age standardisation
shrinkage procedure
Index of multiple
deprivation20%
20%
20%
20%
20%

38
KwaZulu-Natal
Wards ranked relative to deprivation within the province
The most highly deprived wards score as deprived on several of the domainsConcentrations of wards showing deprivation in the most deprived decile are found in the municipalities of Nkandla, Ulundi, Msinga and Nqutu.

3939
Quality Assurance of data collected & storing of data in central database
Service Referrals to Implementing agents
Profile Households using door to door approach and Capture Data using Hand Held Devices
NEW CYCLE: Revisit deprived wards, profile households, provide service, refer service demands to aimplementing agents, verify service delivery, monitor all processes of the system & update it.
Ongoing U
pdating on the Information M
anagement System
, M
onitoring & Evaluation, C
omm
unication & C
hange M
anagement
Delivery of Non-Negotiable Services to households & community
PlanningService Provision
Community Profiling (gaps from IDPs or new)
Verification of Services Delivered
Integrated Delivery of Services (Short 90 days, Medium 91 to 180 days, long term >6 months) Norms & Stds should be monitored + Exit strategy
Implementation
START:Institutionalise War Rooms, Ward selection, Sector norms & Stds + Exit strategy, Buy-in, Community Mobilisation, Change Agents, training of field staffIntegrated Development Plans with budgetFeasibility studies Development of business plans
END: Feedback to Households & Communities

40
Flagship Program Process for Integrated Development
Deliver Service Update Referral Status
Technology and Process Support (PROVINCIAL NERVE CENTRE )
Pick-up Referrals
Line Department
Profile Household & Capture HH
data
E-solutions
Generate Referrals
NISIS
SITA

41
Dashboards
Similar to the informative dashboards in modern vehicles, the Dashboards provide important indications and vital signs of the health and performance of the enterprise. For the Premier, and then downwards through and across organisational and information hierarchies, Dashboards and Scorecards will provide graphic quick-views of the state of the Province

42
Outcome Reporting Solution

43
GIS/Spatial Representation
Typically, dashboard views of geographic related data is translated into an area map of the information being reported, providing the user with a “real life”perspective of the information is being viewed.
This spatial perspective significantly aids the visual interpretation of information across a geographic spread for comparison purposes. Spatial data available is stored in the data warehouse for such purposes

44
Provincial Nerve Centre Outlook (2010 -2014)
1. Emphasis on Accountable delivery 2. Knowledge Based approaches dependent on change behavior,
attitudes and skill 3. An improved credible data architecture interconnecting local, Provincial
& National sphere using shared service concept 4. Establishing competency centres linked to war rooms at ward level5. Linking planning, monitoring & coordination 6. Improved public accountability through Citizen interactions making
citizen scorecard a robust instrument

45
Public Public Accountability Through MeasurementAccountability Through Measurement